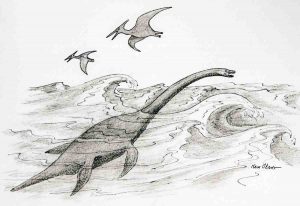
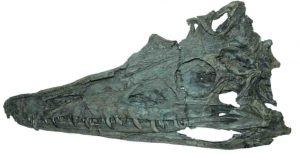
This undated image provided by Ken Olson shows a drawing of the plesiosaur (marine reptile). A fossil found by an elk hunter in Montana nearly seven years ago has led to the discovery this new species of prehistoric sea creature. The new species of elasmosaur is detailed in an article published Thursday, April 13, in the Journal of Vertebrate Paleontology. The creature lived about 70 million years ago in the inland sea that flowed east of the Rocky Mountains from Canada to the Gulf of Mexico. (Ken Olson via AP)
A fossil found by an elk hunter in Montana nearly seven years ago has led to the discovery of a new species of prehistoric sea creature that lived about 70 million years ago in the inland sea that flowed east of the Rocky Mountains.
The new species of elasmosaur is detailed in an article published Thursday in the Journal of Vertebrate Paleontology. Most elasmosaurs, a type of marine reptile, had necks that could stretch 18 feet, but the fossil discovered in the Charles M. Russell National Wildlife Refuge is distinct for its much shorter neck—about 7½ feet.
“This group is famous for having ridiculously long necks, I mean necks that have as many as 76 vertebrae,” said Patrick Druckenmiller, co-author of the article and a paleontologist with the University of Alaska Museum of the North. “What absolutely shocked us when we dug it out—it only had somewhere around 40 vertebrae.”
The smaller sea creature lived around the same time and in the same area as the larger ones, which is evidence contradicting the belief that elasmosaurs did not evolve over millions of years to have longer necks, co-author Danielle Serratos said.
Elasmosaurs were carnivorous creatures with small heads and paddle-like limbs that could grow as long as 30 feet. Their fossils have been discovered across the world, and the one discovered in northeastern Montana was well-preserved and nearly complete.
The refuge adjacent to the Missouri River is popular with hunters for its big game and remote setting.
David Bradt, a ranch manager from Florence, Montana, said he was hunting elk unsuccessfully in November 2010 when he walked into a canyon to splash some water on his face.
In the creek, the water ran over what he thought was petrified wood sticking out of a rock. He pulled back the brush, saw vertebrae and knew it was fossilized bones.
He thought it was a dinosaur and was floored when he learned it was a sea creature.
“It’s about the size of a cow, and I’m thinking it’s a triceratops,” he said. “I didn’t know there was an ocean there.”
Bradt took photographs and reported the find to the U.S. Fish and Wildlife Service and the Museum of the Rockies in Bozeman.
It took three days to excavate the fossil, but much longer to clean and study it before the determination could be made that it was a new species, Druckenmiller said.
He said the inland sea that stretched the width of Montana to Minnesota and from Canada to the Gulf of Mexico was teeming with marine reptiles, but relatively few of their fossils have been excavated.
“It’s a total bias—just more people out there are interested in land-living dinosaurs than marine reptiles,” he said. “There would be a lot more known if more people were studying them.”
Note: The above post is reprinted from materials provided by The Associated Press.
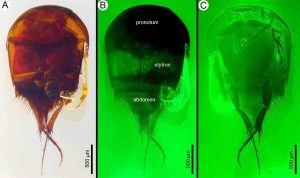
The oldest termitophile from 99-million-year-old Burmese amber, Cretotrichopsenius burmiticus. Credit: Cai et al., 2017
Eusocial insects, such as ants, social wasps and bees, and termites, include some of the most ecologically ubiquitous of terrestrial animals. The nests of these insects are well protected and provide a safe, communal space for the storing of resources and production of brood, so the nests are often cohabited by various highly specialized symbionts that take advantage of the abundant resources and protection inside the nests.
Recently, a research team led by Dr. CAI Chenyang and Prof. HUANG Diying from Nanjing Institute of Geology and Palaeontology (NIGPAS) of the Chinese Academy of Sciences reported the oldest horseshoe-crab-shaped, obligate termite-loving rove beetles from mid-Cretaceous Burmese amber. These fossils represent the oldest known termitophiles, which are able to hack into a termite nest and exploit their controlled physical conditions to steal plentiful resources (e.g., fungi) inside it. The discovery reveals that ancient termite societies were quickly invaded by beetles about 99 million year ago.
Termitophiles, symbionts that live in termite nests, include a wide range of morphologically and behaviorally specialized organisms. Understanding of the early evolution of termitophily is challenging due to a scarcity of fossil termitophiles, with all known reliable records deriving from the Miocene Dominican and Mexican ambers (approximately 19 million years ago). Mesozoic termitophiles are of great significance for understanding the origin of eusocial societies of termites and the early evolution of specialized termitophily.
To integrate into the hosts’ societies, termitophilous beetles have repeatedly evolved physogastry (swollen abdomens) and limuloid (horseshoe-crab-shaped) body shapes, representing the two principal forms. Both morphological adaptations have arisen convergently many times in beetles (Coleoptera) as well as in flies (Diptera).
The peculiar fossil rove beetles, named as Cretotrichopsenius burmiticus Cai et al., 2017, exhibits the characteristic features of the modern aleocharine tribe Trichopseniini, including the articulation of the hind leg whereby the coxae are fully fused and incorporated into the metaventrite.
Cretotrichopsenius burmiticus has a protective horseshoe-crab-shaped body form typical of many modern termitophiles, with concealed head and antennae and strong posteriorly directed abdominal setae. The discovery represents the earliest definitive termitophiles, pushing back the fossil record of termitophiles by 80 million years.
Recent species of Trichopseniini are usually associated with derived neoisopteran termites of Rhinotermitidae, and less frequently with Termitidae. Interestingly, some trichopseniines are known to live within nests of the basal-most termites (Mastotermitidae) and drywood termites (Kalotermitidae).
Because host specificity is rather low in extant trichopseniines, it is certainly likely that Cretotrichopsenius may have been associated with the variety of termite groups known from Burmese amber. The fossils reveal that ancient termite societies were quickly invaded by beetles about 99 million years ago.
The result was published in Current Biology on April 13th, 2017. This study was jointly supported by the Chinese Academy of Sciences, the National Natural Science Foundation, the Natural Sciences Foundation of Jiangsu Province, and the Ministry of Science and Technology of China.
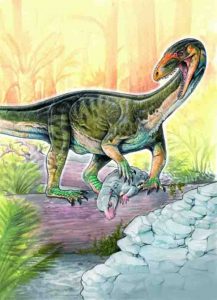
This is the new species Teleocrater rhadinus hunting a cynodont, a close relative of mammals. Credit: Artwork by Gabriel Lio, and courtesy of Museo Argentino de Ciencias Naturales
For decades, scientists have wondered what the earliest dinosaur relatives looked like. Most assumed that they would look like miniature dinosaurs, be about the size of a chicken, and walk on two legs.
A Virginia Tech paleobiologist’s latest discovery of Teleocrater rhadinus, however, has overturned popular predictions. This carnivorous creature, unearthed in southern Tanzania, was approximately seven to 10 feet long, with a long neck and tail, and instead of walking on two legs, it walked on four crocodylian-like legs.
The finding, published in the journal Nature April 12, fills a critical gap in the fossil record. Teleocrater, living more than 245 million years ago during the Triassic Period, pre-dated dinosaurs. It shows up in the fossil record right after a large group of reptiles known as archosaurs split into a bird branch (leading to dinosaurs and eventually birds) and a crocodile branch (eventually leading to today’s alligators and crocodiles). Teleocrater and its kin are the earliest known members of the bird branch of the archosaurs.
“The discovery of such an important new species is a once-in-a-lifetime experience,” said Sterling Nesbitt, an assistant professor of geosciences in the College of Science.
He and Michelle Stocker, a co-author and also an assistant professor of geosciences in the College of Science, will give a free public talk with the fossils at 7 p.m. Thursday, April 13, 2017 at the Virginia Tech Museum of Geosciences on the second floor of Derring Hall.
Teleocrater fossils were first discovered in Tanzania in 1933 by paleontologist F. Rex Parrington, and the specimens were first studied by Alan J. Charig, former Curator of Fossil Reptiles, Amphibians and Birds at the Natural History Museum of London, in the 1950s.
Largely because the first specimen lacked crucial bones, such as the ankle bones, Charig could not determine whether Teleocrater was more closely related to crocodylians or to dinosaurs. Unfortunately, he died before he was able to complete his studies. The new specimens of Teleocrater, found in 2015, clear those questions up. The intact ankle bones and other parts of the skeleton helped scientists determine that the species is one of the oldest members of the archosaur tree and had a crocodylian look.
Nesbitt and co-authors chose to honor Charig’s original work by using the name he picked out for the animal, Teleocrater rhadinus, which means “slender complete basin” and refers to the animal’s lean build and closed hip socket.
“The discovery of Teleocrater fundamentally changes our ideas about the earliest history of dinosaur relatives,” said Nesbitt. “It also raises far more questions than it answers.”
“This research sheds light on the distribution and diversity of the ancestors of crocodiles, birds, and dinosaurs,” says Judy Skog, program director in the National Science Foundation’s Division of Earth Sciences, “and indicates that dinosaur origins should be re-examined now that we know more about the complex history and traits of these early ancestors.”
Teleocrater and other recently discovered dinosaur cousins show that these animals were widespread during the Triassic Period and lived in modern day Russia, India, and Brazil. Furthermore, these cousins existed and went extinct before dinosaurs even appeared in the fossil record.
The team’s next steps are to go back to southern Tanzania this May to find more remains and missing parts of the Teleocrater skeleton. They will also continue to clean the bones of Teleocrater and other animals from the dig site in the paleontology preparation lab in Derring Hall.
“It’s so exciting to solve puzzles like Teleocrater, where we can finally tease apart some of these tricky mixed assemblages of fossils and shed some light on broader anatomical and biogeographic trends in an iconic group of animals,” said Stocker.
Stocker and Nesbitt are both researchers with the Global Change Center at Virginia Tech. Other co-authors on the paper include: Richard J. Butler with the University of Birmingham; Martin D. Ezcurra with Museo Argentino de Ciencias Naturales; Paul M. Barrett with the Natural History Museum of London; Kenneth D. Angielczyk with the Field Museum of Natural History; Roger M. H. Smith with the University of the Witwatersrand and Iziko South African Museum; Christian A. Sidor with the University of Washington; Grzegorz Niedzwiedzki with Uppsala University; Andrey G. Sennikov with Borissiak Paleontological Institute and Kazan Federal Univeristy; and Charig.
The research was funded by the National Science Foundation, National Geographic Society, a Marie Curie Career Integration Grant, a National Geographic Society for Young Explorers grant, and the Russian Government Program of Competitive Growth of Kazan Federal University.
Reference:
Sterling J. Nesbitt, Richard J. Butler, Martín D. Ezcurra, Paul M. Barrett, Michelle R. Stocker, Kenneth D. Angielczyk, Roger M. H. Smith, Christian A. Sidor, Grzegorz Niedźwiedzki, Andrey G. Sennikov, Alan J. Charig. The earliest bird-line archosaurs and the assembly of the dinosaur body plan. Nature, 2017; DOI: 10.1038/nature22037
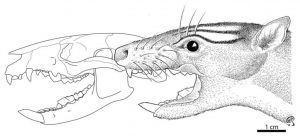
Acdestis maddeni’s snout is short and its canines are relatively large, followed by large, shearing middle teeth and molars well developed for grinding. Credit: Skull drawing by Russell Engelman. Life restoration of Acdestis by Russell Hawley
The discovery of three extinct species and new insights to a fourth indicates a little-known family of marsupials, the Palaeothentidae, was diverse and existed over a wide range of South America as recent as 13 million years ago.
The finding, however, complicates the question: why did these animals go extinct?
“It was previously assumed this group slowly went extinct over a long time period, but that’s probably not the case,” said Russell Engelman, a biology MS student at Case Western Reserve and lead author of a new study on the group. “They were doing very well at the time they were supposedly on death’s door.”
Discovering new fossil sites may be the only way to learn the answer, researchers say.
Engelman; along with Federico Anaya, professor of geological engineering at Universidad Autónoma Tomás Frías, in Potosí, Bolivia; and Darin Croft, anatomy professor at Case Western Reserve School of Medicine, describe the animals, where they fit in the family, and their paleoecology and paleobiology in the Journal of Systematic Palaeontology.
Fossils of the new species were found at Quebrada Honda, a high elevation fossil site in southern Bolivia. They are about 13 million years old (from the middle Miocene epoch), placing them among the youngest known palaeothentid fossils.
Fossil remains of other members of the family, and other relatives within the order Paucituberculata, have been found at sites of similar age in southwestern Colombia and possibly southern Argentina, geographically spanning almost the entire continent.
“The only close relatives of palaeothentids alive today are shrew-opossums, small, poorly-known, ground-living marsupials that live in and near the Andes,” Croft said. “Palaeothentid marsupials once included a diversity of species that filled a variety of roles in ancient ecosystems. During their heyday in the Miocene, they were abundant.”
The new species, Palaeothentes serratus, Palaeothentes relictus, and Chimeralestes ambiguus, all had long snouts but differed in diet and body size and other features.
The researchers suggest P. serratus — serratus means saw-like — was an insectivore, with well-developed slicing premolars. The researchers estimate the mouse-size marsupial weighed about 3.5 ounces.
P. relictus had large, well-developed grinding molars. The animal probably ate fruits, seeds and insects, and weighed about five ounces.
C. ambiguus, as the name indicates, has attributes of a number of family members, making its evolutionary relationships with the group uncertain. The animal was about the same size as P. serratus and its limited dental remains indicate its diet was likely similar to that of P. relictus.
The most common member of the family found at Quebrada Honda is Acdestis maddeni. The species was named 14 years ago, but the researchers are the first to find and analyze its lower jaw.
These lower jaw fossils, combined with reexamination of other specimens, show that the skull of Acdestis was different from other palaeothentids. A. maddeni’s snout is short and its canines are relatively large, followed by large, shearing middle teeth and molars well developed for grinding.
“All this indicates it was a generalist,” Engelman said. “Although it could eat fruits and insects like its relatives it could also catch small vertebrates and dismember them… It probably ate anything, like a hedgehog or Norway rat does.”
The animal was rat-size and weighed about a pound, the researchers estimate.
The fossil record indicates the Palaeothentidae and much of the order Paucituberculata abruptly went extinct about 12 million years ago, leaving only the lineage leading to modern shrew-opossums.
“Most species threatened with extinction are like giant pandas: highly specialized, live only in a certain area and eat only certain things,” Engelman said. Due to their diversity and wide range, “the Palaeothentidae didn’t fit the pattern of extinction.”
Previous hypotheses that palaeothentids were done in by climate change or competition lack support, the researchers say.
For example, fossils found at high latitudes in Argentina and Bolivia after the Middle Miocene Climatic Optimum indicate they withstood the dramatic cooling of the period. The family and opossums, which may have been competitors, appear to have overlapped for nearly 10 million years. Yet opossums didn’t become abundant until 3 million to 4 million years after the family went extinct.
But, the hypothesis cannot be completely ruled out, the researchers said. And, there is a possibility the decline of the family was slow.
The reason for the quandary is that fossils have been well collected in the southern end of South America but the middle and northern parts of the continent remain largely unexplored.
“It’s as if all the fossils in the U.S. came from Florida — you don’t get the full picture,” Engelman said.
If new fossil sites are found in the northern two-thirds of the continent, “it will be interesting to see whether we find younger members of the group,” Croft said. “That will help us understand their extinction.”
Reference:
Russell K. Engelman, Federico Anaya, Darin A. Croft. New palaeothentid marsupials (Paucituberculata) from the middle Miocene of Quebrada Honda, Bolivia, and their implications for the palaeoecology, decline and extinction of the Palaeothentoidea. Journal of Systematic Palaeontology, 2016; 1 DOI: 10.1080/14772019.2016.1240112
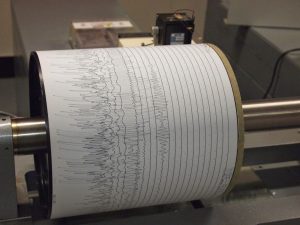
Seismogram being recorded by a seismograph at the Weston Observatory in Massachusetts, USA. Credit: Wikipedia
The public wants to know more about earthquake risk and how best to manage it, surveys show, but scientists and engineers must adapt their communication skills to meet these public needs, researchers will report at the 2017 Seismological Society of America’s (SSA) Annual Meeting.
Keith Porter, a research professor in civil, environmental, and architectural engineering at the University of Colorado, Boulder, has studied the public’s knowledge about earthquake risk and building code preferences through community action groups and online web surveys. His research indicates that the public can understand earthquake risk assessments and the cost-benefit tradeoffs involved designing and retrofitting buildings to withstand seismic events.
But he suggests that there are three keys to success in communicating earthquake risk that seismologists and engineers should follow: use plain language when possible, discuss likely outcomes instead of probabilities or uncertainties, and limit misinformation about earthquake risk.
For instance, this could mean using the term “flood” instead of “storm surge,” and talking about the impact of the “Big One” in California rather than offering a recitation about the percentage of ground shaking expected over an interval of 50 years, he says. It may also mean addressing any misinformation about the costs and benefits of earthquake protections for buildings.
Porter’s research has uncovered “some tension,” he says, between the standards of current building codes and what people say are acceptable seismic performance targets for those buildings. For instance, in the case of a San Francisco voluntary action committee, Porter had expected that the group would be in favor of voluntary retrofitting of older buildings to meet a minimum level of safety. Instead, he says, the group was in favor of “mandatory retrofitting to the highest seismic performance level, with the costs shared between building owners and tenants.”
And where structural engineers work mostly with building codes designed to focus on the human lives saved during an earthquake, rather than preserving the buildings themselves, a majority of respondents to a web survey said they preferred stricter codes for new buildings that would make them habitable and functional after an earthquake, Harper notes.
Other presentations in the SSA session on communicating risk include preliminary results from a project in Pakistan to include religious leaders in earthquake hazard mitigation programs; a report on school seismic safety programs in Washington State; predictions for human and property loss in the event of a large Himalayan earthquake; and a tsunami preparation program in Puerto Rico.
Reference:
“The Public Can Understand Risk and Cares About Building Code Requirements for New Buildings” will be presented at the SSA Annual Meeting on Wednesday, April 19. All presentation abstracts for the 2017 SSA Annual Meeting can be accessed at meetings.seismosoc.org/abstracts
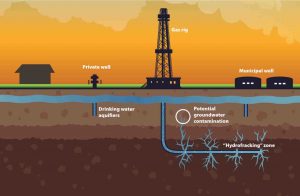
As hydraulic fracturing operations expand in Canada and in some parts of the United States, researchers at the 2017 Seismological Society of America’s (SSA) Annual Meeting are taking a closer look at ways to minimize hazards from the earthquakes triggered by those operations.
Hydraulic fracturing, or fracking, is a method of hydrocarbon recovery that uses high-pressure injections of fluid to break apart rock and release trapped oil and natural gas. At the SSA Annual Meeting, experts will speak about the growing recognition that hydraulic fracturing or fracking can produce earthquakes magnitude 3 and larger, acknowledging that this type of seismic activity is difficult to predict and may be difficult to stop once it begins.
Most induced earthquakes in Canada have been linked to hydraulic fracturing, in contrast to induced earthquakes studied in the central and eastern United States. In the U.S., these earthquakes have been linked primarily to massive amounts of wastewater injected back into the ground after oil and gas recovery. However, some presentations at the SSA meeting will take a closer look at the possibilities for fracking earthquakes in the United States.
Michael Brudzinski of Miami University and his colleagues will discuss their work to identify swarms of small magnitude earthquakes in Ohio that appear to be correlated in time and space with hydraulic fracturing or wastewater disposal. Their work suggest that there are roughly three times more earthquake sequences of magnitude 2 or larger induced by hydraulic fracturing compared to wastewater disposal in the area—even though there are about 10 times more hydraulic fracturing wells than wastewater disposal wells. Their technique, they say, provides evidence of induced seismicity from hydraulic fracturing in Oklahoma, Arkansas, Pennsylvania, West Virginia and Texas as well.
Zenming Wang and colleagues are preparing for the onset of oil and gas exploration in the Rome Trough of eastern Kentucky, conducting a study of the natural background seismicity in the area to be able to better identify induced earthquakes if they occur. In their SSA presentation, they will also discuss how an area like eastern Kentucky might assess and prepare for ground shaking hazards from induced earthquakes, since the ruptures may occur on unmapped or “quiet” faults.
In western Alberta and eastern British Columbia in Canada, a significant increase in the rate of felt earthquakes from hydraulic fracturing has researchers looking at ways to mitigate potential damage to infrastructure in the region. In her SSA presentation, Gail Atkinson of Western University will discuss the factors that affect the likelihood of damaging ground motion from fracking-induced earthquakes. Based on these factors, Atkinson proposes targeted “exclusion zones” with a radius of about five kilometers around critical infrastructure such as major dams. This would be combined real-time monitoring to track the rate of seismic events of magnitude 2 or greater within 25 kilometers, with fracking operations adjusted to potentially reduce this rate to less hazardous levels.
Reference:
“Correlation Algorithms to Better Characterize Seismicity Induced by Hydraulic Fracturing” will be presented at the SSA Annual Meeting on Wednesday, April 19. All presentation abstracts for the 2017 SSA Annual Meeting can be accessed at meetings.seismosoc.org/abstracts
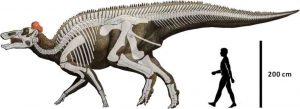
Skeletal reconstruction of Edmontosaurus regalis, from Xing et al. 2017. Note that we do not advise walking so closely to the back end of a large herbivorous dinosaur.
The duck-billed dinosaurs (hadrosaurs) may not be as glamorous as tyrannosaurs (and most tyrannosaur researchers sure don’t respect these “Cretaceous food items” anyhow), but in many ways they are a far more interesting and scientifically viable group to study. Hadrosaurs are known from literally tons of fossils from around the world, often with nearly complete skeletons and frequent soft-tissue preservation. As a result, you can answer a lot of research questions with hadrosaurs that are difficult to address with more rare groups. But, surprisingly (or perhaps not surprisingly, given many people’s inexplicable preference for the sharp-in-tooth-and-claw tyrannosaurs), lots of basic research on hadrosaurs remains. This is a golden opportunity for scientists!
In many ways, Edmontosaurus is the archetype of hadrosaurs. Their fossils, abundant in North American rocks from around 72 to 66 million years old, are on display in numerous museums and have consequently been featured in toys and on television alike. Early researchers, beginning in the first half of the 20th century, lavishly described and illustrated many of these specimens in the scientific literature. Yet, that grand tradition of detailed description has fallen somewhat fallow. We as scientists are often happy to rest on the laurels of our predecessors. If Edmontosaurus was already well-described back in 1920, what’s the point in doing it again?
As paleontologists learn more about the anatomy and evolution of hadrosaurs, it’s readily apparent that earlier workers didn’t even know to bother describing, comparing, and illustrating certain features. This is not their fault, of course–different aspects of anatomy are considered more relevant at different times. As additional species are uncovered or as old species are invalidated, the importance of some anatomical details is elevated, and that of other details is decreased. So, it never hurts to revisit “old” and well-described fossils.
A new paper by Hai Xing and colleagues redescribes skulls of the original Edmontosaurus species, Edmontosaurus regalis. Uncovered in Upper Cretaceous rocks of Alberta, over a dozen pretty decent crania, partial skeletons, and many fragments are known. Edmontosaurus as a genus was recently revised, showing that many things previously lumped into various species and genera (including the old classics Anatosaurus and Anatotitan) were likely just two species of Edmontosaurus: E. regalis (the earlier Canadian form) and E. annectens (the later form found in both Canada and the United States). An Alaskan form, Ugrunaaluk, was considered to be closely related. So, with all of the family tree stuff sorted out, now is a good time to review the variation within Edmontosaurus regalis and describe some newly relevant (and previously unrecognized) anatomical details.
The paper, published last week in PLOS ONE, provides detailed illustrations and text descriptions for numerous details on the skull in Edmontosaurus regalis. Once the anatomical work was out of the way, the authors re-evaluated previously proposed differences with the sister species E. annectens, and were able to add several formerly unrecognized features that can help separate the two species. Next, a comprehensive analysis produced a new family tree, which was broadly similar to previously published versions but also had a few interesting adjustments. For instance, an animal from Alabama called Eotrachodon was found to fall outside of the main group of “true” hadrosaurids (rather than within the group as previously proposed). A number of other slight readjustments also appeared in the analysis, all of which have relevance for how hadrosaurs spread across the surface of the globe during their evolution.
Finally, restudy of Edmontosaurus regalis indicates a potential shake-up for the Alaskan duck-bill Ugrunaaluk. Ugrunaaluk is known from numerous specimens, but they are all juveniles. Xing and colleagues note many similarities between Ugrunaaluk and Edmontosaurus regalis–enough that they may even be the same species. Frustratingly, though, no juveniles of E. regalis are known at a size similar to those for Ugrunaaluk, meaning that equivalent life stages from the animals can’t be compared directly. So, we’re back to the classic refrain: we need more fossils to know for sure!
Reference:
Hai Xing et al. Supplementary cranial description of the types of Edmontosaurus regalis (Ornithischia: Hadrosauridae), with comments on the phylogenetics and biogeography of Hadrosaurinae, PLOS ONE (2017). DOI: 10.1371/journal.pone.0175253
Nicolás E. Campione et al. Cranial Growth and Variation in Edmontosaurs (Dinosauria: Hadrosauridae): Implications for Latest Cretaceous Megaherbivore Diversity in North America, PLoS ONE (2011). DOI: 10.1371/journal.pone.0025186
Note: The above post is reprinted from materials provided by Public Library of Science. This story is republished courtesy of PLOS Blogs: blogs.plos.org.
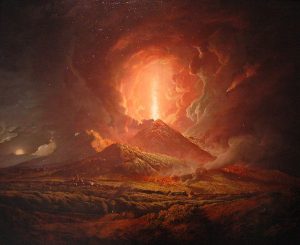
An eruption of Vesuvius seen from Portici, by Joseph Wright (ca. 1774-6)
Known for its 79AD eruption, which destroyed the towns of Pompeii and Herculaneum, Vesuvius is still a significant hazard given that it overshadows the city of Naples and its surrounds, which are home to over 3m people.
It is also known for a particularly intense form of eruption. Plinian (after Pliny the Younger who was the first to describe the 79AD event) eruptions are characterised by the ejection of a vast column of gas and ash which extends into the stratosphere, far higher than commercial airliners fly.
Were such an eruption to occur at Vesuvius today, it is likely that much of the population would already have been evacuated as a precursory swarm of earthquakes would likely herald its imminent approach. But those who remained would initially be showered with huge pumice rocks too large to be kept aloft by the column of gas.
Then, as the volcano began to run out of energy, the column itself would collapse, causing smaller particles of rock (from fine ash to small boulders) to fall from the sky and back to Earth at high velocity. Asphyxiating clouds of gas and pulverised rock – pyroclastic density currents – would then flood down the slopes of the volcano, annihilating anything in their path. Such gas-ash features have been known to travel tens of kilometres and at terrifying speeds, potentially turning modern Naples into a new Pompeii.
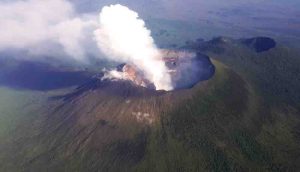
Nyiragongo, Democratic Republic of Congo
An aerial view of the towering volcanic peak of Mount Nyiragongo. Credit: MONUSCO / Neil Wetmore
This central African volcano has erupted several times over the last few decades and while its eruptions aren’t particularly explosive, it produces a particularly runny – and dangerous – form of lava. Once effused, this lava can rapidly move down the flanks of the volcano and inundate areas with little or no warning.
In 2002, the lava lake at the volcano’s summit was breached, resulting in streams of lava hurtling towards the nearby city of Goma at 60km/hr, engulfing parts of it to a depth of two metres.
Fortunately, warnings had been issued as the volcano’s unrest has made it the focus of intense research – and over 300,000 people were evacuated in time. Should such an event occur again, we have to hope that the authorities are equally prepared, but this is a politically unstable area and it remains seriously vulnerable.
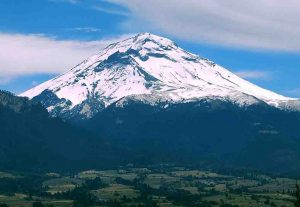
Popocatepetl, Mexico
View of the Popocatepetl volcano from Amecameca, Mexico State. Credit: Ricraider
“Popo”, as the locals call it, is just 70km south-west of the one of the largest cities in the world: Mexico City, home to 20m people. Popo is regularly active and its most recent bout of activity in 2016 sent a plume of ash to an altitude of five kilometres.
In recent times, and indeed throughout much of its history, eruptive events at Popo have consisted of similarly isolated ash plumes. But these plumes coat the mountain in a thick blanket of ash which, when mixed with water, can form a dense muddy mixture which has the potential to flow for many kilometres and at relatively high speeds.
Such phenomena, known as “lahars”, can be extremely deadly, as exemplified by the Nevado del Ruiz disaster of 1985 when around 26,000 people were killed in the town of Armero, Colombia, by a lahar with a volcanic source that was 60km away.
The Nevado del Ruiz tragedy was the direct result of volcanic activity melting ice at the volcano’s summit, but a large volume of rainfall or snowmelt could feasibly generate a similar lahar on Popo. This could flow down-slope towards nearby settlements with little or no warning.
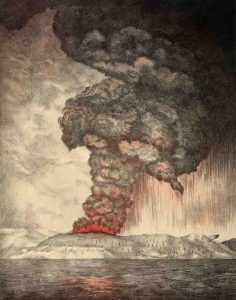
Krakatoa, Indonesia
A lithograph of the eruption (circa 1888). Lithograph: Parker & Coward, Britain
Otherwise named Krakatau, Krakatoa’s name is infamous; 36,000 people were killed by the tsunami triggered by its 1886 eruption, which released more energy than 13,000 Hiroshima atomic bombs. The eruption destroyed the volcanic island completely, but within 50 years, a new island had appeared in its place.
The new island is named Anak Krakatau (Child of Krakatoa) and since the 1920s, it has been growing in episodic phases, reaching about 300 metres in height today. New and significant activity commenced in 2007 and since this time, further episodes of activity were noted at the volcano, most recently in March 2017.
No one knows for sure whether or not the spectacular growth of Anak Krakatau means it may one day repeat the catastrophe its “father” unleashed, but its location between Indonesia’s two most populated islands, Java and Sumatra, means it poses a grave threat to life.
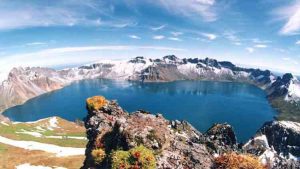
Changbaishan, China
Few have heard of this volcano in a remote part of Asia – and its last eruption was in 1903. However, its history tells a rather scarier story. In around 969AD, the volcano produced one of the largest eruptions of the last 10,000 years, releasing three times more material than Krakatoa did in 1886.
One of the chief hazards is posed by the massive crater lake at its peak (with a volume of about nine cubic kilometres). If breached, this lake could generate lahars that would pose a significant threat to the 100,000 people that live in the vicinity.
In the early 2000s, scientists began monitoring the hitherto under-monitored volcano, and determined that its activity was increasing, that its magma chamber dormancy was coming to an end, and that it could pose a hazard in the following decades.
Further complicating things is the fact that Changbaishan straddles the border of China and North Korea. Given such a geo-politically sensitive location, the effects of any volcanic activity here would likely be very hard to manage.
Mount Etna is an active stratovolcano on the east coast of Sicily, Italy, in the Metropolitan City of Catania, between the cities of Messina and Catania. It lies above the convergent plate margin between the African Plate and the Eurasian Plate. It is the tallest active volcano in Europe, currently 3,329 m (10,922 ft) high, though this varies with summit eruptions. It is the highest peak in Italy south of the Alps. Etna covers an area of 1,190 km2 (459 sq mi) with a basal circumference of 140 km.
This is the wing of the bird-like feathered dinosaur Anchiornis under laser-stimulated fluorescence. The folds of skin in front of the elbow and behind the wrist (called patagia) were covered in feathers, just like in modern living birds. Credit: Wang XL, Pittman M et al. 2017
Until now it has been hard to get an accurate idea of the shape of a dinosaur from its fossilised remains, as only their bones are usually preserved. Using a new technique, Dr Michael Pittman from the Department of Earth Sciences, the University of Hong Kong and his collaborators reconstructed the first highly detailed body outline of a feathered dinosaur based on high-definition images of its preserved soft tissues.
This ground breaking work was published in Nature Communications.
Laser-stimulated fluorescence (LSF) is a revolutionary new technique using high power lasers that makes unseen soft tissues preserved alongside the bones, literally “glow in the dark” by fluorescence. The technique developed by collaborator Tom Kaye of the Foundation for Scientific Advancement, scans the fossils with a violet laser in a dark room. The laser “excites” the few skin atoms left in the matrix making them glow, to reveal what the shape of the dinosaur actually looked like. “For the last 20 years we have been amazed by the wondrous feathered dinosaurs of Northeastern China. However, we never thought they would preserve soft tissues so extensively,” said lead author and palaeontologist Dr Michael Pittman.
Dr Pittman and his colleagues examined over 200 specimens of the feathered bird-like dinosaur Anchiornis to find the dozen with special preservation. The quantitative reconstruction shows the contours of the wings, legs and even perfectly preserved foot scales, providing new details that illuminate the origin of birds.
“The detail was so well lit that we could see the texture of the skin,” said Dr Pittman. Anchiornis lived in the late Jurassic period (~160 million years old), close to the time when palaeontologists think birds first appeared. In recovering important soft tissue details of the wing in particular, Dr. Pittman and his colleagues found that the shape of wing was in many ways similar to modern birds, but it also had some seemingly primitive characteristics like feathers arranged more evenly across the wing rather than in distinct rows. These new insights provide crucial information for reconstructing how dinosaurs experimented and eventually achieved flight. The new laser technique brings out hidden details because of the high intensity laser light. The team is already scheduling trips worldwide to fulfill requests to scan exceptional specimens.
Reference:
Xiaoli Wang, Michael Pittman, Xiaoting Zheng, Thomas G. Kaye, Amanda R. Falk, Scott A. Hartman, Xing Xu. Basal paravian functional anatomy illuminated by high-detail body outline. Nature Communications, 2017; 8: 14576 DOI: 10.1038/NCOMMS14576
This is the skull of Diandongosuchus fuyuanensis. Credit: Xiao-chun Wu
The skeleton of a small, short-snouted reptile found in China was recently identified as the oldest known member of the phytosaurs — an extinct group of large, semi-aquatic reptiles that superficially resembled the distantly-related crocodylians and lived during the Triassic Period, approximately 250 million years ago to 200 million years ago.
Virginia Tech researchers led the team that re-evaluated and re-classified the animal, Diandongosuchus fuyuanensis, which had previously been labeled as a poposauroid, a group of animals more closely related to crocodiles.
The shape of the animal’s head, shoulder, and skeleton bones is what gave away the animal’s linkage to the phytosaurs, according to Michelle Stocker, lead author and assistant professor of geosciences in the College of Science. After seeing a photo of the fossil in a paper published in 2012, she and other co-authors met in China in 2015 to re-examine the bones. Their findings were published in Scientific Reports April 10.
The fossil, which is older than other phytosaur fossils by about 5 million years, fills a critical gap in scientists’ understanding of how the animal evolved. The short snout and small body size suggest that the features the species is most known for — a long snout and large body size — evolved later than previously thought. A long snout is useful for predatory endeavors like reaching, snapping, and biting.
“So much of our study of the fossil record is about filling in the gaps in our knowledge of how animals came to look as they do or live where they are, and Diandongosuchus does that for phytosaurs. We’re never done filling in those gaps,” said Stocker.
“Early members of these Triassic reptile lineages are appearing where they’ve been predicted for years. Now we have the fossils,” said Nesbitt.
Reference:
Michelle R. Stocker, Li-Jun Zhao, Sterling J. Nesbitt, Xiao-Chun Wu, Chun Li. A Short-Snouted, Middle Triassic Phytosaur and its Implications for the Morphological Evolution and Biogeography of Phytosauria. Scientific Reports, 2017; 7: 46028 DOI: 10.1038/srep46028
Researchers also want to encourage the locals to develop practical evacuation plans to help them feel less pessimistic about their survival odds. Credit: Katsushika Hokusai
An effective communication approach incorporating computer simulations could help people find practical means to evacuate in the event of a tsunami.
The extent of damage caused by a 2011 earthquake and tsunami in Japan demonstrated that the outcomes of disaster mitigation research were not fully applied in reality. Computer simulations are normally used to develop effective evacuation strategies. However, a gap remains between computer-generated results and what is actually feasible for people, since simulations are not usually tested in real life.
Led by Professor Michinori Hatayama, researchers at Kyoto University combined computer simulations with fieldwork done in partnership with the residents of Mangyo, Kuroshio in Kochi prefecture in southern Japan. It is thought that the Kuroshio area will be the most affected in the event of a long-anticipated earthquake and tsunami originating in the Nankai Trough, a depression at the bottom of the ocean about 900km off the southern coast of Japan’s mainland.
The team’s aim was to facilitate effective communication between disaster mitigation professionals and society at large so that research outcomes are better utilized. They also wanted to encourage the locals to develop practical evacuation plans to help them feel less pessimistic about their survival odds. Some residents had previously expressed hopelessness to the media should such a disaster happen.
Hatayama and his colleagues interviewed the residents to find out how they would react in the case of a tsunami warning and what issues make them feel pessimistic. They then put the responses into a computer simulation system that includes geographical information and tsunami hazard data. The output, which was shared with the locals in workshops, showed an animation of how they would react to a tsunami, allowing them to identify what challenges they faced in order to evacuate successfully. This was followed by discussions about what the locals perceived to be issues, such as an elevated shelter being too far away, and possible alternative plans, such as using a much nearer evacuation tower. The researchers conducted evacuation drills so that the residents could experience the alternative plans.
They found that this method made evacuation drills more efficient. Contrary to previously practiced drills, the researchers placed problem awareness ahead of practice, which helped shorten the time needed to determine possible alternative solutions.
The field activities also allowed some residents to realize evacuation was possible; something they were unsure of before. They regarded alternative plans as feasible evacuation options.
However, some locals tended not to accept the alternative plans as they might involve some risks. For example, they preferred to evacuate by car rather than on foot, despite the fact that roads are often blocked by debris or are congested in a disaster.
New research should look into real life examples in order to find a solution to these problems, the researchers conclude.
Note: The above post is reprinted from materials provided by Kyoto University.
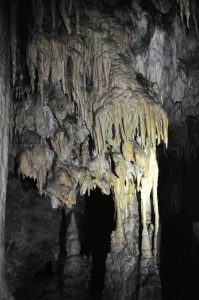
Zoolithen Cave in Burggaillenreuth with flowstones, stalactites, and stalagmites. Credit: Jasper Wassenburg, JGU
The North Atlantic Oscillation (NAO) is the dominant atmospheric pressure mode over the North Atlantic that plays a significant role in determining the winter climate in Europe. Depending on the prevailing state of the NAO, Europe experiences mild or very cold winters and even strong storms. Geoscientists based at Johannes Gutenberg University Mainz (JGU) in Germany are currently reconstructing the fluctuations of the NAO over the last 10,000 years with the aim of being able to predict future developments. For this purpose, they use stalagmites obtained from subterranean caves as natural climate archives and are examining new indicators of climate change to retrieve climate information that is as accurate as possible. Initial results indicate that it is likely that the NAO will respond to the melting of the Arctic ice cap in the future, with consequences for our climate, environment, and society as a whole.
Dr. Jasper Wassenburg works with stalagmites from caves in the Middle Atlas, a mountain range in the northwest of Morocco. Stalagmites are calcium carbonate deposits that grow from the floor of a cave upwards due to precipitation of calcium carbonate minerals deposited from the dripwater. Calcite is the most common form of calcium carbonate although in some cases it can also be aragonite. “Aragonite, if well preserved, can be dated with remarkable precision. So we prefer aragonite stalagmites over calcitic ones,” explained Wassenburg, who is a member of the research team headed by Professor Denis Scholz at the Institute of Geosciences at Mainz University.
The incorporation of chemical elements in speleothems, which is the term scientists use for the secondary mineral deposits in caves, is often depending on changes in the environment. These elements are known as climate proxies because they provide indirect evidence of climatic history. Wassenburg’s study of seven speleothem samples obtained from Morocco, India, France, Spain, and a cave known as the Hüttenbläserschachthöhle in Germany’s Sauerland region is the first attempt to identify in detail the concentrations at which trace elements tend to be incorporated in aragonite. “We have been able to demonstrate that the concentration of uranium in aragonite stalagmites is a very precise indicator of prehistoric rainfall patterns,” he added. This means that stalagmites can tell us qualitatively how much it rained 200,000 years ago.
Reconstruction of the North Atlantic Oscillation as far back as the onset of the current interglacial period
Uranium and strontium concentrations and the relative ratios of oxygen isotopes were also analyzed in order to obtain information on past rainfall for a recent study of past NAO variability. The NAO index reflects the difference in atmospheric pressure between the Icelandic Low to the north and the Azores High to the south. One particular phenomenon of interest is that if the NAO brings dry weather to Europe, it rains in Morocco—and vice versa. The weather of the northwestern region of Morocco seems to react particularly sensitive to changes in the NAO. In this case, the samples used by Dr. Jasper Wassenburg came from a fairly small cave in which the host rock is dolomite. The Grotte de Piste is located in the Atlas Mountains at an elevation of some 1,250 meters above sea level. It is 70 to 80 meters in extent and 15 to 20 meters from floor to ceiling.
The results of analysis of the speleothems from the north-west of Morocco were compared with a rainfall reconstruction obtained from other cave deposits from the Bunkerhöhle or Bunker cave in western Germany. This enabled the climate researchers to trace back the fluctuations of the NAO over the past 11,000 years to the end of the last Ice Age. The best reconstruction previously available went back only 5,200 years. “We were surprised to discover that the situation during the early Holocene 11,000 years ago was quite different to that of today. The weather regimes in Europe and Morocco seem to have behaved similarly so that wet weather in Europe also meant more rain in Morocco,” explained Wassenburg. This positive correlation disappeared at some point during the transition from the early Holocene to the mid-Holocene.
The researchers postulate that this was attributable to a major reduction in the melt water contribution from the Laurentide Ice Sheet that still covered large areas of North America at the end of the Ice Age. “The pattern of the North Atlantic Oscillation is not as stable as we thought,” stated Professor Dennis Scholz and added that the NAO will probably also be influenced by today’s melting of the Greenland Ice Sheet, with potential effects on the atmosphere, the oceans, and other biological phenomena, including farming and fishing. The team plans to conduct further research in order to reconstruct the changes of the NAO over the last 10,000 years.
Reference:
J.A. Wassenburg et al. Determination of aragonite trace element distribution coefficients from speleothem calcite–aragonite transitions, Geochimica et Cosmochimica Acta (2016). DOI: 10.1016/j.gca.2016.06.036
Jasper A. Wassenburg et al. Reorganization of the North Atlantic Oscillation during early Holocene deglaciation, Nature Geoscience (2016). DOI: 10.1038/NGEO2767
Dr. Itay Halevy of the Weizmann Institute of Science has looked to the distant past — all the way back to Earth’s earliest oceans. The model he developed, together with Dr. Aviv Bachan of Stanford University, suggests that the early oceans, right around the time that life originated, were somewhat acidic, and that they gradually became alkaline. Credit: Weizmann Institute of Science
One way to understand how ocean acidity can change, for example, in response to rising carbon dioxide (CO2) levels, is to look to the history of seawater acidity. Dr. Itay Halevy of the Weizmann Institute of Science has looked to the distant past — all the way back to Earth’s earliest oceans. The model he developed, together with Dr. Aviv Bachan of Stanford University, suggests that the early oceans, right around the time that life originated, were somewhat acidic, and that they gradually became alkaline. The study, published in Science, sheds light on how past ocean acid levels were controlled by CO2 in the atmosphere, an important process for understanding the effects of climate change.
Acidity and alkalinity are measured on the pH scale of 0-14. On this scale, 7 is neutral, higher is alkaline, lower is acidic. At around 8.2, today’s oceans are mildly alkaline, and we know that rising CO2 levels are currently increasing the oceans’ acidity (decreasing pH).
Halevy, of the Weizmann Institute’s Earth and Planetary Sciences Department, explains that billions of years ago “the early Sun was dimmer, even though we don’t have evidence for a much colder climate. We think that this is because the early atmosphere had more of the greenhouse gas CO2 than at present, and that as the Sun got brighter, CO2 levels decreased,” says Halevy.
CO2, and water produce carbonic acid, so it stands to reason that the early oceans would have been more acidic. But higher early CO2 levels would also have resulted in acidic rainwater and this, in turn, could have led to higher rates of chemical weathering of Earth’s rocky crust, washing down ions that would partly neutralize the acidity of CO2. Which effect is the stronger? This has been unclear; thus previous models of the history of seawater pH have come up with everything from high values to low.
The model that Halevy and Bachan developed accounts for these processes and the way in which they influence the fluxes of ions into and out of ocean water. According to their model, the acidifying effect of higher CO2 levels dominated, and the early oceans had a lower-than-present pH.
“On a very fundamental level,” says Bachan, “we show that the pH of the ocean has been controlled by a few simple processes for all of geologic time.”
Putting numbers to the proposed pH, Halevy says that three to four billion years ago, the pH of ocean water was somewhere between 6.0 and 7.5 — between that of milk and human blood. Halevy: “This gives us some clues as to the conditions under which life emerged in the early oceans.”
“We had an early ocean more acidic than today in which primitive life thrived and chemical cycles were balanced; but if we want to apply this insight to today, we have to remember that this balance of acids and bases was maintained over geological timescales — millions of years,” he adds. “Today’s acidification from CO2 is much more rapid, so this model does not apply to the short-term problem. Hundreds of thousands of years from now, the oceans will have found a new balance, but between now and then, marine organisms and environments may suffer.”
Reference:
I. Halevy, A. Bachan. The geologic history of seawater pH. Science, April 2017 DOI: 10.1126/science.aal4151
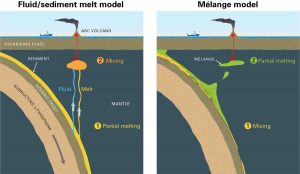
The two main events — mixing and melting — are reversed in the mélange model, which is an important distinction because scientists use measurements of isotope and trace elements to determine compositions of arc lavas. Credit: Jack Cook, Woods Hole Oceanographic Institution
Beneath the ocean, massive tectonic plates collide and grind against one another, which drives one below the other. This powerful collision, called subduction, is responsible for forming volcanic arcs that are home to some of Earth’s most dramatic geological events, such as explosive volcanic eruptions and mega earthquakes.
A new study published in the journal Science Advances changes our understanding of how volcanic arc lavas are formed, and may have implications for the study of earthquakes and the risks of volcanic eruption.
Researchers led by the Woods Hole Oceanographic Institution (WHOI) have discovered a previously unknown process involving the melting of intensely-mixed metamorphic rocks—known as mélange rocks—that form through high stress during subduction at the slab-mantle boundary.
Until now, it was long-thought that lava formation began with a combination of fluids from a subducted tectonic plate, or slab, and melted sediments that would then percolate into the mantle. Once in the mantle, they would mix and trigger more melting, and eventually erupt at the surface.
“Our study clearly shows that the prevailing fluid/sediment melt model cannot be correct,” says Sune Nielsen, a WHOI geologist and lead author of the paper. “This is significant because nearly all interpretations of geochemical and geophysical data on subduction zones for the past two decades are based on that model.”
Instead, what Nielsen and his colleague found was that mélange is actually already present at the top of the slab before mixing with the mantle takes place.
“This study shows—for the first time—that mélange melting is the main driver of how the slab and mantle interact,” says Nielsen.
This is an important distinction because scientists use measurements of isotope and trace elements to determine compositions of arc lavas and better understand this critical region of subduction zones. When and where the mixing, melting, and redistribution of trace elements occurs generates vastly different isotopic signature ratios.
The study builds on a previous paper by Nielsen’s colleague and co-author Horst Marschall of Goethe University in Frankfurt, Germany. Based on field observations of mélange outcrops, Marschall noted that blobs of low-density mélange material, called diapirs, might rise slowly from the surface of the subducting slab and carry the well-mixed materials into the mantle beneath arc volcanoes.
“The mélange-diapir model was inspired by computer models and by detailed field work in various parts of the world where rocks that come from the deep slab-mantle interface have been brought to the surface by tectonic forces,” Marschall says. “We have been discussing the model for at least five years now, but many scientists thought the mélange rocks played no role in the generation of magmas. They dismissed the model as ‘geo-fantasy.'”
In their new work, Nielsen and Marschall compared mixing ratios from both models with chemical and isotopic data from published studies of eight globally representative volcanic arcs: Marianas, Tonga, Lesser Antilles, Aleutians, Ryukyu, Scotia, Kurile, and Sunda.
“Our broad-scale analysis shows that the mélange mixing model fits the literature data almost perfectly in every arc worldwide, while the prevailing sediment melt/fluid mixing lines plot far from the actual data,” Nielsen says.
Understanding the processes that occur at subduction zones is important for many reasons. Often referred to as the planet’s engine, subduction zones are the main areas where water and carbon dioxide contained within old seafloor are recycled back into the deep Earth, playing critical roles in the control of long-term climate and the evolution of the planet’s heat budget.
These complex processes occur on scales of tens to thousands of kilometers over months to hundreds of millions of years, but can generate catastrophic earthquakes and deadly tsunamis that can occur in seconds.
“A large fraction of Earth’s volcanic and earthquake hazards are associated with subduction zones, and some of those zones are located near where hundreds of millions of people live, such as in Indonesia,” Nielsen says. “Understanding the reasons for why and where earthquakes occur, depends on knowing or understanding what type of material is actually present down there and what processes take place.”
The research team says the study’s findings call for a reevaluation of previously published data and a revision of concepts relating to subduction zone processes. Because mélange rocks have largely been ignored, there is almost nothing known about their physical properties or the range of temperatures and pressures they melt at. Future studies to quantify these parameters stand to provide even greater insight into the role of mélange in subduction zones and the control it exerts over earthquake generation and subduction zone volcanism.
Reference:
Geochemical evidence for mélange melting in global arcs” Science Advances (2017). DOI: 10.1126/sciadv.1602402
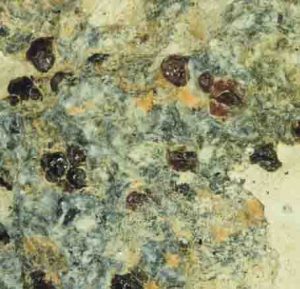
The fragment of the metamorphic rock eclogite in which the garnet that encased the ferric-iron-rich majorite sample was found in Northern China. Credit: Yingwei Fei.
Recovered minerals that originated in the deep mantle can give scientists a rare glimpse into the dynamic processes occurring deep inside of the Earth and into the history of the planet’s mantle layer. A team led by Yingwei Fei, a Carnegie experimental petrologist, and Cheng Xu, a field geologist from Peking University, has discovered that a rare sample of the mineral majorite originated at least 235 miles below Earth’s surface. Their findings are published by Science Advances.
Majorite is a type of garnet formed only at depths greater than 100 miles. Fascinatingly, the majorite sample Fei’s team found in Northern China was encased inside a regular garnet—like mineralogical nesting dolls. It was brought to surface as an eclogite xenolith in the North China Craton, one of the oldest cratonic blocks in the world. What’s more, the majorite was rich in ferric iron, an oxidized form of iron, which is highly unusual for the mineral.
All of these uncommon factors prompted the team to investigate the majorite’s origins.
They used several different kinds of analytical techniques to determine the chemistry and structural characteristics of this majorite formed deep inside the Earth. In order to determine the exact depth of its origin, Carnegie’s postdoc Renbiao Tao conducted high-pressure experiments that mimicked the formation conditions of natural majorite. The team pinpointed its origin to a depth of nearly 250 miles (400 kilometers), at the bottom of the soft part of the upper mantle, called the asthenosphere, which drives plate tectonics.
It is extremely unusual that a high-pressure majorite could survive transportation from such a depth. Adding to the strange circumstances is the fact that it was later encased by a garnet that formed at a much shallower depth of about 125 miles (200 kilometers). The nesting-doll sample’s existence required two separate geological events to explain, and these events created a time capsule that the researchers could use to better understand the Earth’s deep history.
“This two-stage formation process offers us important clues about the mantle’s evolutionary stage at the time when the majorite was first formed,” Fei explained.
The sample’s location and depth of origin indicate that it is a relic from the end of an era of supercontinent assembly that took place about 1.8 billion years ago. Called Columbia, the supercontinent’s formation built mountain ranges that persist today.
“More research is needed to understand how the majorite became so oxidized, or rich in ferric iron, and what this information can tell us about mantle chemistry. We are going back to the site this summer to dig deeper trenches and hope to find fresh rocks that contain more clues to the deep mantle,” Fei added.
Reference:
“Recovery of an oxidized majorite inclusion from Earth’s deep asthenosphere” Science Advances (2017). DOI: 10.1126/sciadv.1601589
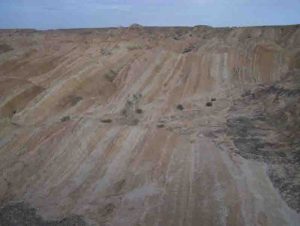
Stratification in Tibet sediment. Climate variations are reflected in color variations with the red sediment typically indicating a wetter climate and the white indicating a drier climate. “You can literally walk up time as you sample the sediment,” Garzione says. Credit: Qingquan Meng
The Tibetan Plateau in China experiences the strongest monsoon system on Earth, with powerful winds — and accompanying intense rains in the summer months — caused by a complex system of global air circulation patterns and differences in surface temperatures between land and oceans.
These extreme weather patterns make this area an ideal location for climate scientists to study the delicate interconnected web of the global climate system.
Carmala Garzione, a professor of earth and environmental sciences at the University of Rochester, and Junsheng Nie, a visiting research associate at the University, surveyed sediment samples from the northern Tibetan Plateau’s Qaidam Basin and were able to construct paleoclimate cycle records from the late Miocene epoch of Earth’s history, which lasted from approximately 11 to 5.3 million years ago. They recently published their findings in Science Advances.
Reconstructing past climate records can help scientists determine both natural patterns and the ways in which future glacial events and greenhouse gas emissions may affect global systems.
Based on previous research on ice core, marine, and sediment records, researchers determined that for the past 800,000 years, Northern Hemisphere ice ages — in which vast areas of North America, Europe, and Asia are covered with thick sheets of ice — occurred about every 100,000 years. Prior to that period, ice ages occurred more frequently, on cycles of 41,000 years, and scientists believed this was the norm.
Using the sediment samples from the Qaidam Basin, Nie and Garzione show that the East Asian monsoon patterns in the late Miocene also follow similar 100,000 year cycles, with stronger monsoons peaking at 100,000 years and diminishing in the periods in between. This reveals a greater than 6 million earlier onset of these 100,000 year cycles than was previously documented.
“People have been thinking that the 100,000 year cycle was a later Quaternary [present-day] climate anomaly,” Nie says. “But from our results, we see that it’s not an anomaly, it was present many years before.”
Several factors affect these cycles, but they are ultimately determined by orbital forcing — the Sun’s radiation received by Earth due to variations in Earth’s orbit in the solar system. There are three types of variations that occur simultaneously, known as the Milankovitch Cycles:
Eccentricity: How Earth rotates around the Sun — the shape of Earth’s orbit gradually changes from being more oval to more round over a period of 100,000 years.
Axial tilt: Earth tilts toward the Sun at an angle that changes from an approximate 22-degree tilt to a 24.5-degree tilt over a period of 41,000 years.
Precession of equinox: Earth slowly wobbles as it spins, much like a toy top, while at the same time, Earth’s rotational axis — the line from the north to south poles — rotates. The interaction of these two processes results in cyclical movement of equinoxes over a period of approximately 23,000 years.
“Each of these factors influences incoming solar radiation and how Earth is absorbing heat,” Garzione says.
Mysteries remain because eccentricity is the weakest cycle, so should logically not be the dominant cycle for climatic events. It is not only sunlight that plays a role in these cycles, but the influence of glaciers and atmospheric carbon dioxide.
For the past one million years, the waxing and waning of Northern Hemisphere ice sheets — mainly those in Canada — have controlled the climate cycles, by affecting ocean currents, temperatures, and wind patterns. Southern Hemisphere ice in Antarctica has remained relatively fixed, without any major glacial melting to catalyze advances and retreats.
During the late Miocene, this was the opposite, with ice in Antarctica in the Southern Hemisphere waxing and waning. Nie and Garzione suggest that the fluctuating Antarctic ice sheet in the late Miocene, at a time when there was minimal ice in the Northern Hemisphere, exerted the dominant control on the 100,000 year cycles observed in the Qaidam Basin record.
“If one hemisphere sees major advances and retreats in ice sheets, that’s when we get into this pattern of 100,000 year cycles dominating,” Garzione says. “The question is, will we push carbon dioxide high enough in the future that the Northern Hemisphere remains ice free and the advances and retreats begin again with the Southern Hemisphere ice sheets.”
If so, the Southern Hemisphere ice sheets may once again exert dominant influence on climate cycles.
Reference:
Junsheng Nie et al. Dominant 100,000-year precipitation cyclicity in a late Miocene lake from northeast Tibet. Science Advances, March 2017 DOI: 10.1126/sciadv.1600762
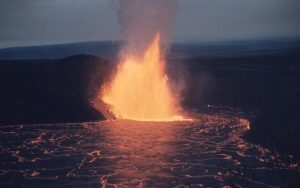
A fountain of lava erupts from Hawaii’s Kilauea Iki crater on Dec. 5, 1959. Two rock samples from this eruption contain geochemical anomalies that could date back 4.5 billion years, shortly after the Earth first formed. Credit: USGS/J.P. Eaton
Earth’s mantle is made of solid rock that nonetheless circulates slowly over millions of years. Some geologists assume that this slow circulation would have wiped away any geochemical traces of Earth’s early history long ago. But a new study led by University of Maryland geologists has found new evidence that could date back more than 4.5 billion years.
The authors of the research paper, published April 7 in the journal Science, studied volcanic rocks that recently erupted from volcanoes in Hawaii and Samoa. The rocks contain surprising geochemical anomalies — the “fingerprints” of conditions that existed shortly after the planet formed.
The researchers are not yet sure how Earth’s mantle preserved these anomalies. But the group’s results suggest that some of these rocks contain material that survived through all of Earth’s history — and that the planet’s interior may not be well mixed after all.
“We found geochemical signatures that must have been created nearly 4.5 billion years ago,” said Andrea Mundl, a postdoctoral researcher in geology at UMD and the lead author of the study. “It was especially exciting to find these anomalies in such young rocks. We don’t yet know how these signatures survived for so long, but we have some ideas.”
The anomalous signatures are found in the ratios of key isotopes of two elements: tungsten and helium.
In the case of tungsten, which has many isotopes, the important ratio is tungsten-182 to tungsten-184. The heavier isotope, tungsten-184, is stable and has existed since the planet first formed. Tungsten-182, on the other hand, results from the decay of hafnium-182, which is highly unstable. All naturally occurring hafnium-182 decayed within the first 50 million years of Earth’s history, leaving tungsten-182 in its place.
Tungsten and hafnium behaved very differently during the planet’s first 50 million years. Tungsten tends to associate with metals, so most of it migrated to Earth’s core, while hafnium, which tends to associate with silicate minerals, stayed in Earth’s mantle and crust. Most of the rocks on Earth have a similar ratio of tungsten-182 to tungsten-184, and this ratio serves as a global baseline. Geologists can learn a lot from rocks with an unusually high or low amount of tungsten-182 — which indicates how much hafnium-182 was present in the rock long ago.
“Nearly all of these anomalies formed within the first 50 million years after the solar system formed,” Mundl said. “Higher than normal levels of tungsten-182 are seen in very old rocks that most likely contained a lot of hafnium long ago. But lower levels of tungsten-182 are rare, and resemble what we might expect to see deep beneath the surface, in or near the planet’s metallic core.”
Sure enough, Mundl and her colleagues observed an unusually low amount of tungsten-182 in some of the rocks from Hawaii and Samoa. On its own, the tungsten isotope ratio is interesting, but not enough to make any convincing conclusions. But the researchers also observed that the same rocks contain an unusual ratio of helium isotopes.
Helium-3 is extremely rare on Earth, and tends to show up in samples of rock that have not been melted or otherwise recycled since the planet first formed. Helium-4, on the other hand, can form from the radioactive decay of uranium and thorium. A higher than normal ratio of helium-3 to helium-4 typically indicates very old rocks that have not been significantly altered since the planet formed.
“Variations in the isotopic composition of helium have been long known, but have never been correlated with other geochemical parameters,” said Richard Walker, professor and department chair of geology at UMD and a co-author of the paper. “Rocks with high helium-3 to helium-4 ratios have commonly been speculated to contain ‘primitive’ mantle material, but how primitive was not known. Our tungsten data show that it is very primitive indeed, with the source region most likely forming within the first 50 million years of solar system history.”
Mundl, Walker and their co-authors suggest a few different scenarios that could have produced the tungsten and helium anomalies they observed in volcanic rocks from Hawaii and Samoa. Perhaps the volcanoes are drawing material from Earth’s core, where the ratios are expected to favor low tungsten-182 and high helium-3.
Alternatively, the rocky outer surface of Earth might have formed in patches, with vast magma oceans in between. Parts of these magma oceans may have crystallized and sunk to the boundary between the mantle and the core, preserving the ancient tungsten and helium signatures.
“Each of these scenarios contain some inconsistencies that we can’t yet explain,” Mundl said. “But this is an exciting result that is sure to generate lots of interesting new research questions.”
Reference:
Andrea Mundl, Mathieu Touboul, Matthew G. Jackson, James M. D. Day, Mark D. Kurz, Vedran Lekic, Rosalind T. Helz, Richard J. Walker. Tungsten-182 heterogeneity in modern ocean island basalts. Science, 2017; 356 (6333): 66 DOI: 10.1126/science.aal4179
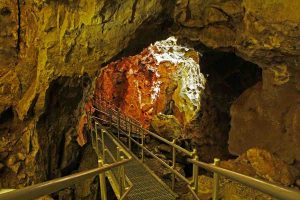
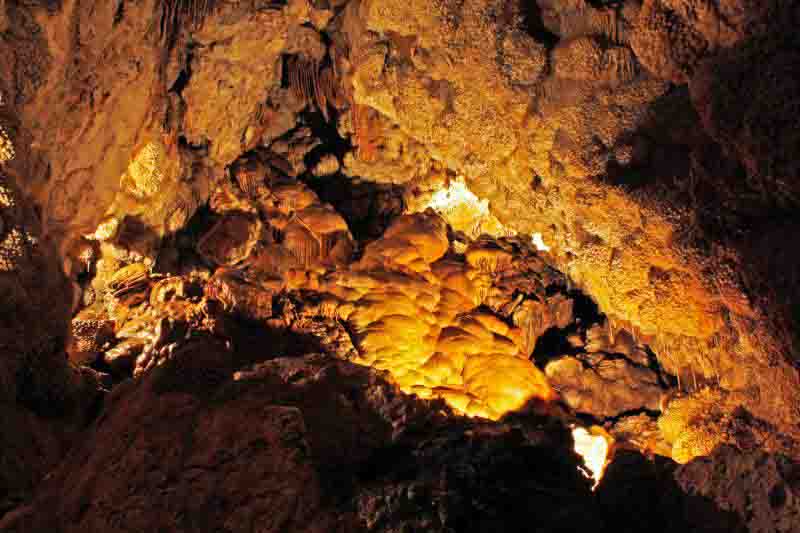
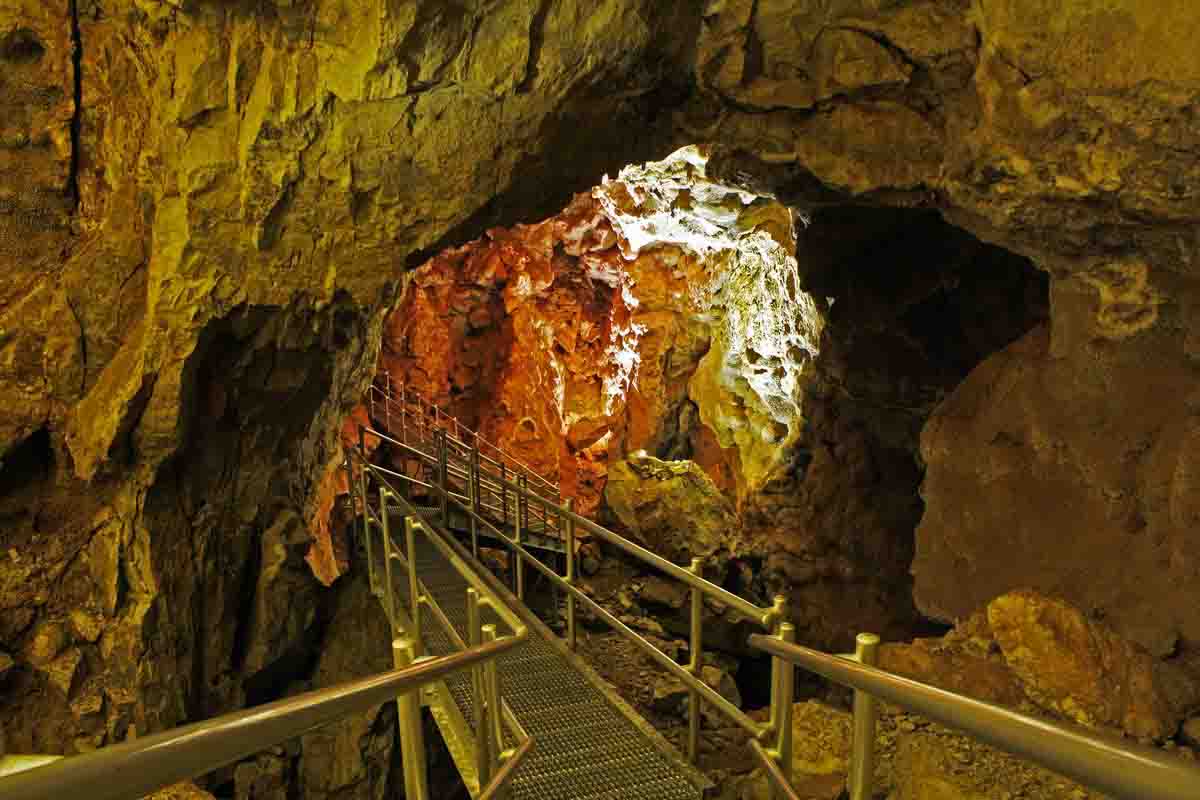
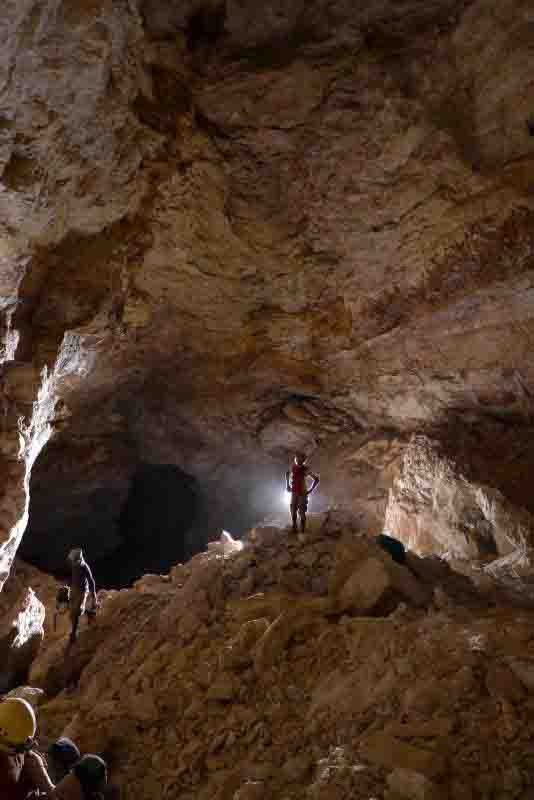
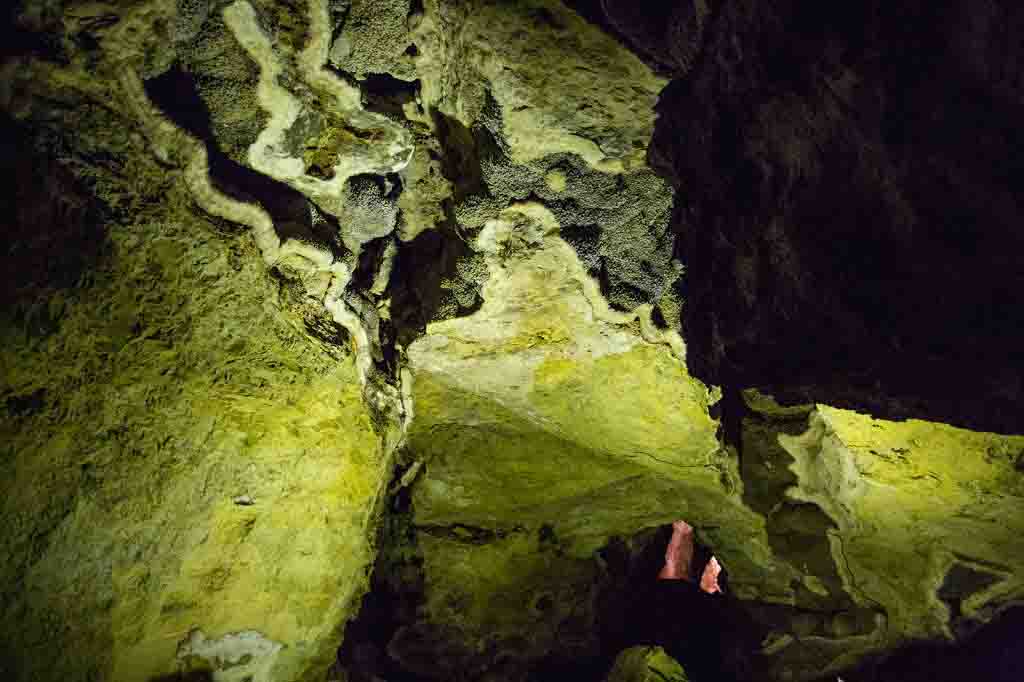
Jewel Cave National Monument contains Jewel Cave, currently the third longest cave in the world, with 181.89 miles (292.72 kilometers) of mapped passageways. It is located approximately 13 mi (21 km) west of the town of Custer in South Dakota’s Black Hills. It became a national monument in 1908
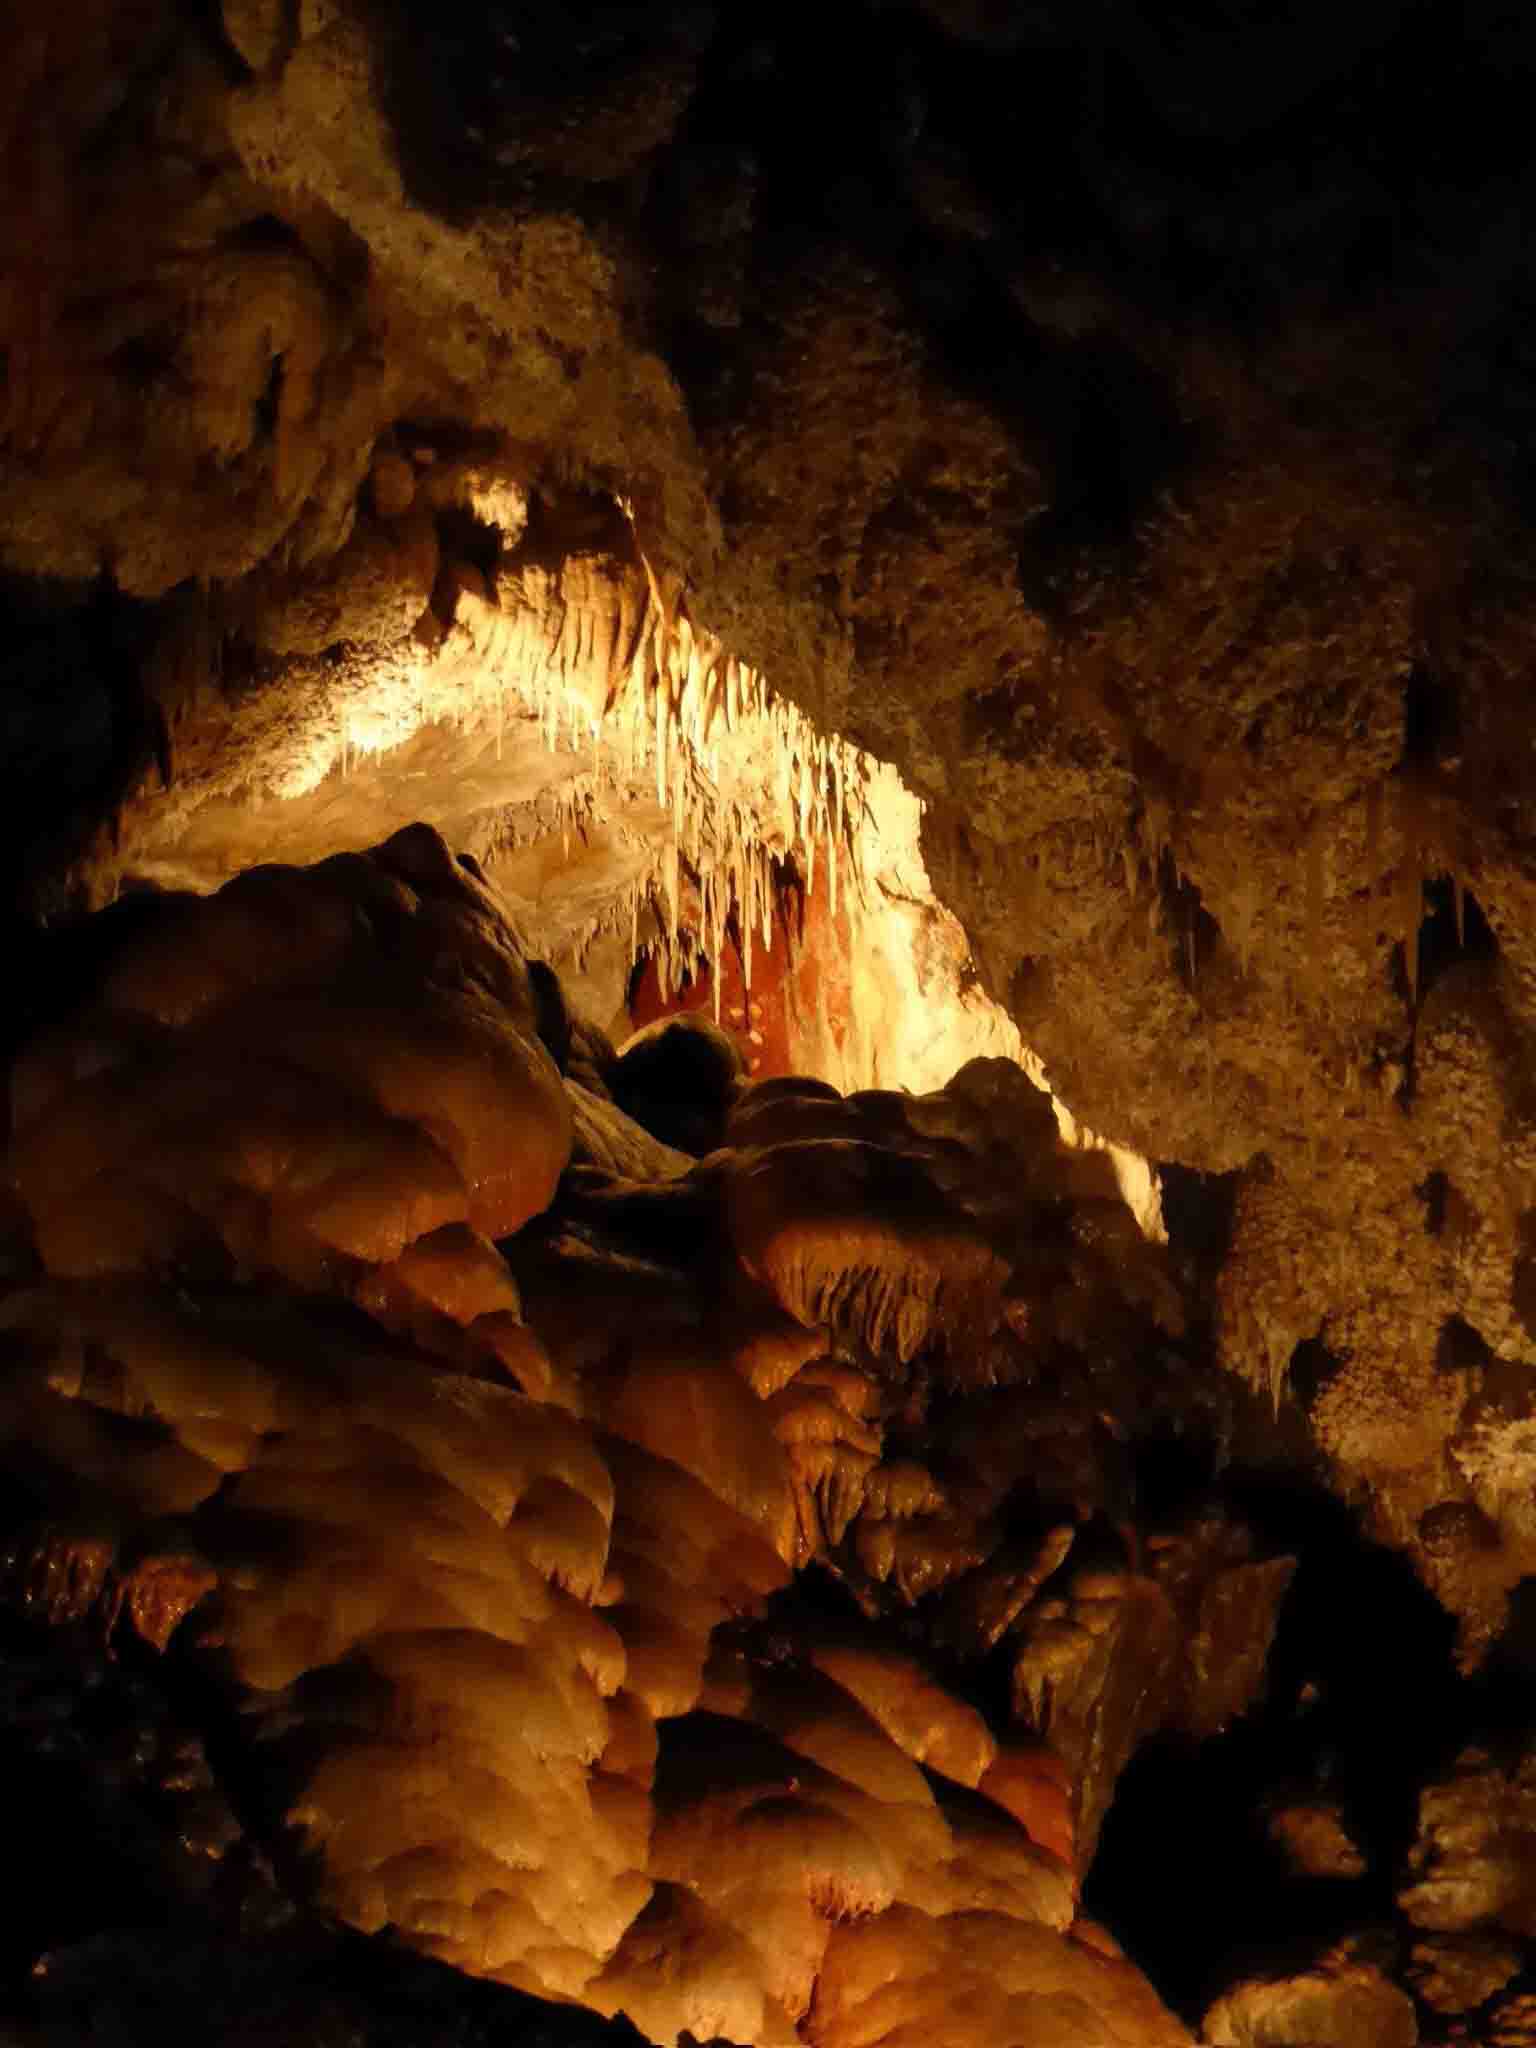
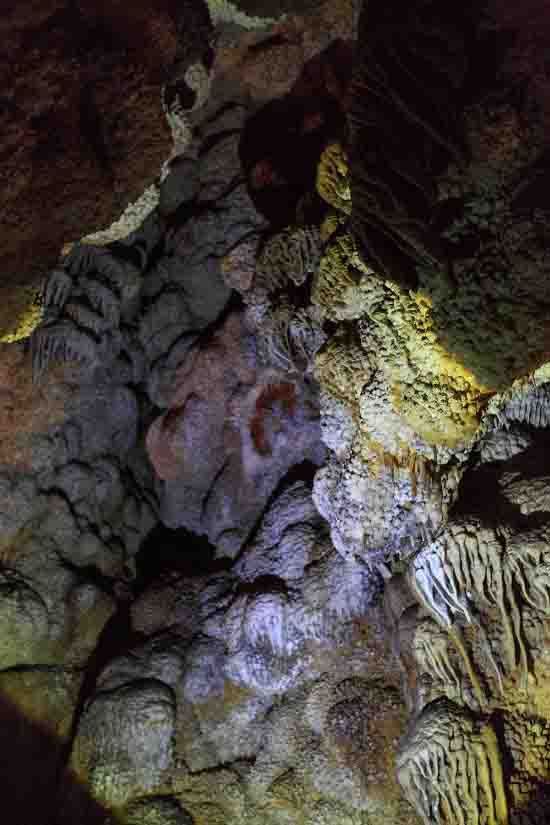
Jewel Cave was formed by the gradual dissolution of limestone by stagnant, acid-rich water. The water enlarged a network of cracks that had formed during the uplift of the Black Hills approximately 60 million years ago. The layer of calcite crystals that covers much of the cave walls was created by the re-deposition of calcite from water saturated with the mineral.
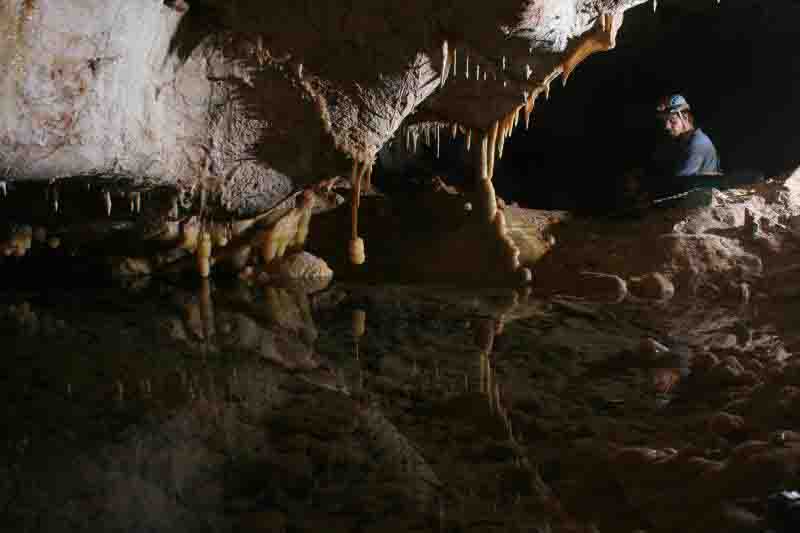
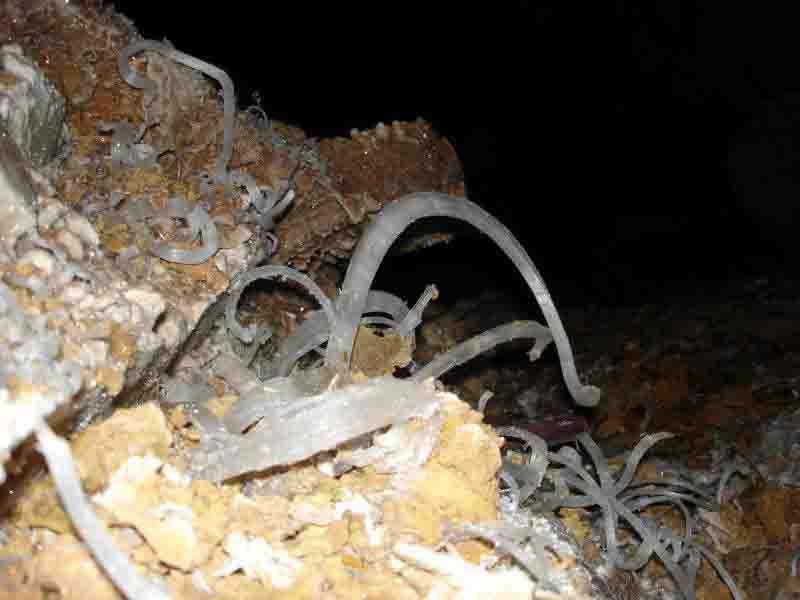
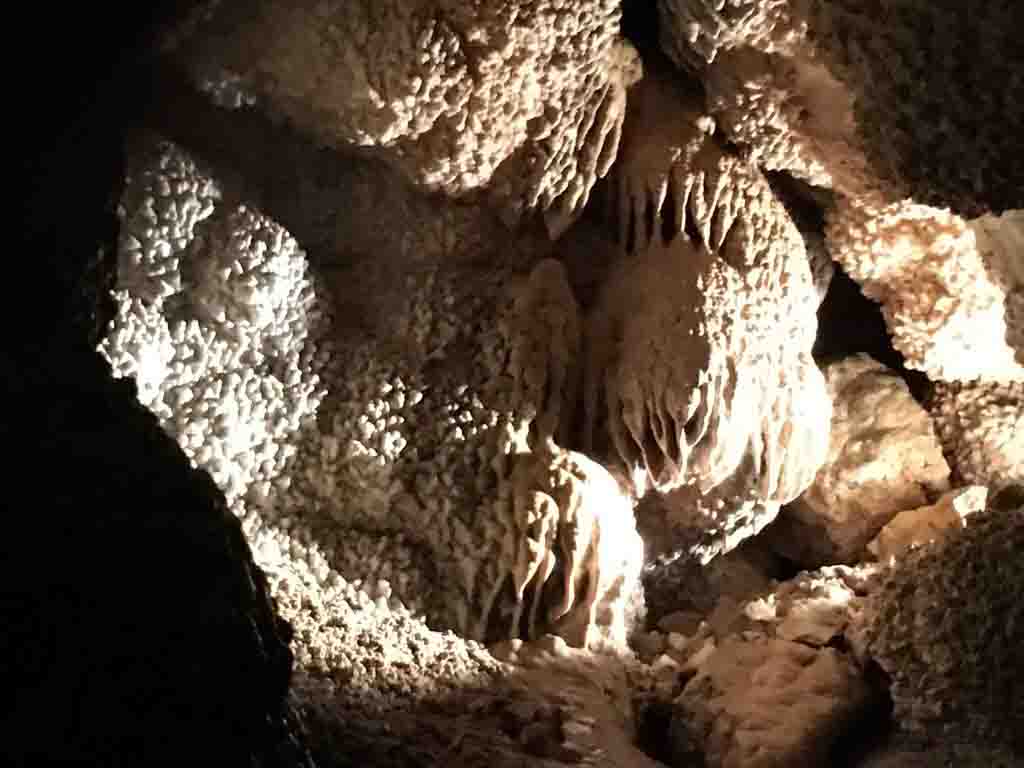
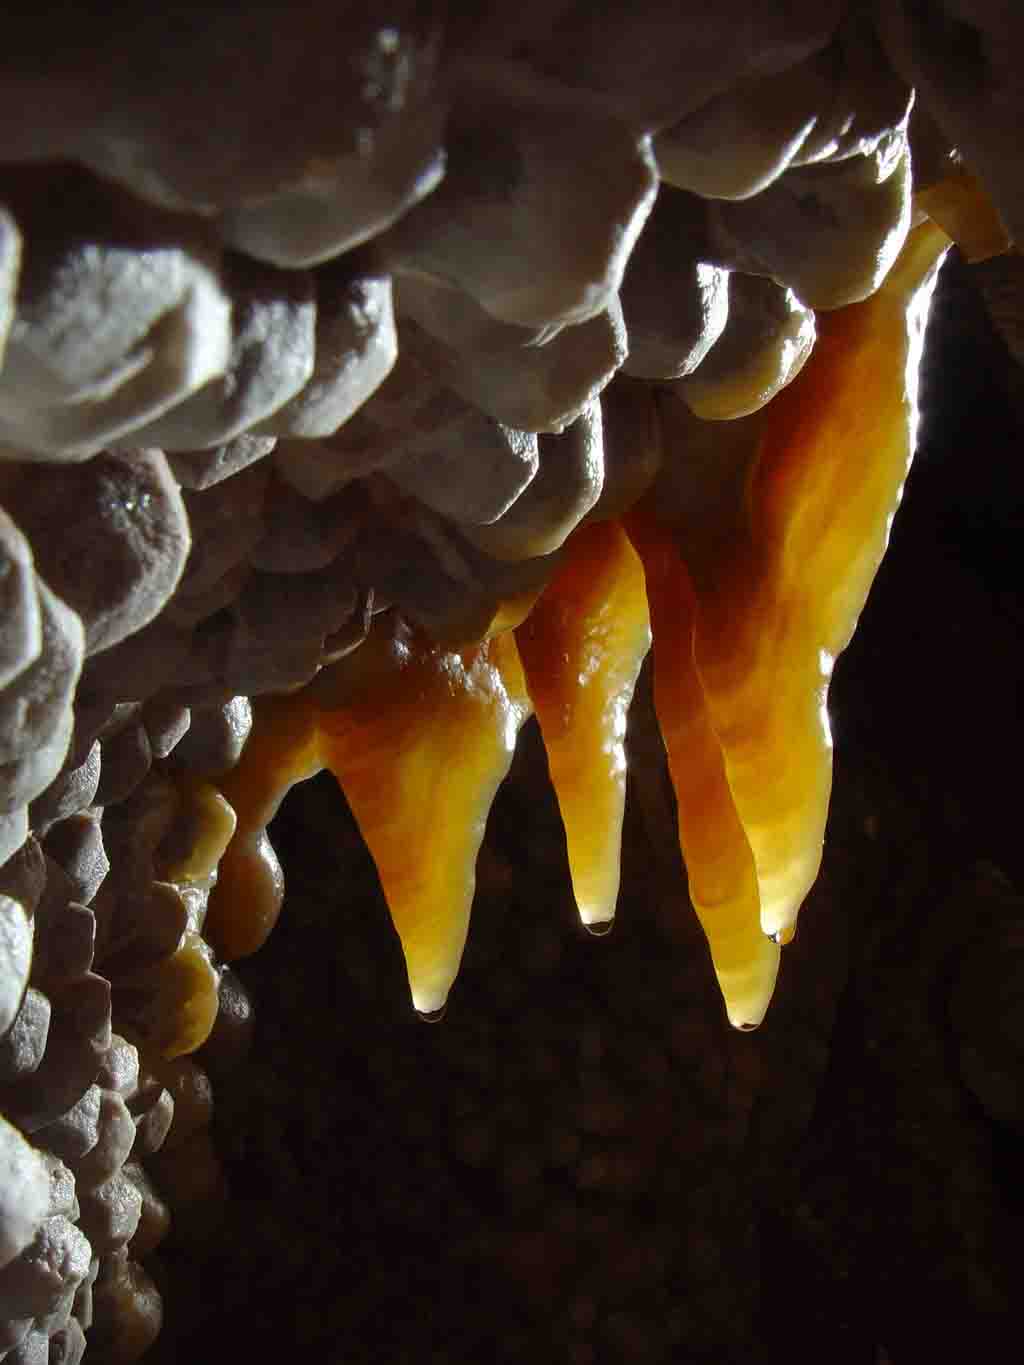
After the water that formed the cave drained, speleothems (cave formations) began to form. Jewel Cave contains all the common types of calcite formations, such as stalactites, stalagmites, flowstone, and frostwork, although not in the same abundance as other well-known caves. The dry parts of the cave contain some formations created by the deposition of gypsum, such as gypsum needles, beards, flowers, and spiders. Finally, Jewel Cave contains a very rare formation called a hydromagnesite balloon. Those are created when gas of an unknown source inflates a pasty substance formed by the precipitation of the magnesium carbonate hydroxide mineral.
Devils Tower was the first declared United States National Monument, established on September 24, 1906, by President Theodore Roosevelt. The Monument’s boundary encloses an area of 1,347 acres (545 ha).
In recent years, about 1% of the Monument’s 400,000 annual visitors climbed Devils Tower, mostly using traditional climbing techniques.
The landscape surrounding Devils Tower is composed mostly of sedimentary rocks. The oldest rocks visible in Devils Tower National Monument were laid down in a shallow sea during the Triassic period, 225 to 195 million years ago.