Geologists classify rocks into three main groups: igneous rock, sedimentary rock, and metamorphic rock. Metamorphic Rock is formed by heat and pressure from other rocks. Depending on how the rock formed, rocks can be igneous, sedimentary, or metamorphic.
Igneous Rock
Igneous rock, or magmatic rock, is one of the three main rock types.
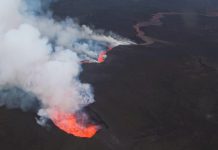
Igneous rock is formed by magma or lava cooling and solidifying. In either the mantle or crust of a planet, the magma can be derived from partial melts of existing rocks.
The melting is typically caused by one or more of three processes: temperature increases, pressure decreases, or composition changes. Rock solidification occurs either as intrusive rocks below the surface or as extrusive rocks on the surface. Igneous rock can form granular, crystalline rocks with crystallization or form natural glasses without crystallization.
There are two basic types:
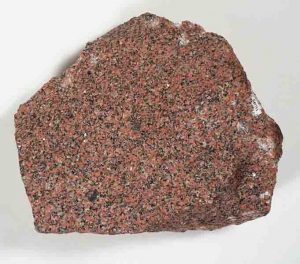
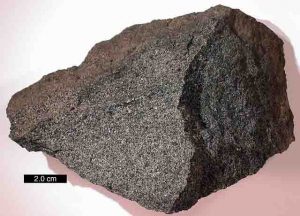
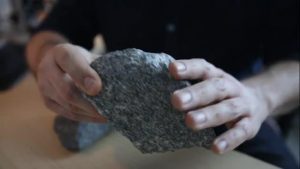
Intrusive igneous rocks crystallize below Earth’s surface, and the slow cooling that occurs there allows large crystals to form. Examples of intrusive igneous rocks are diorite, gabbro, granite, pegmatite, and peridotite.
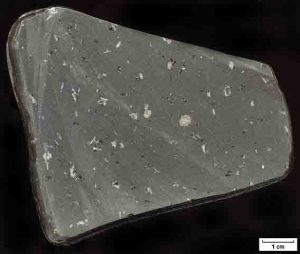
Extrusive igneous rocks erupt onto the surface, where they cool quickly to form small crystals. Some cool so quickly that they form an amorphous glass. These rocks include andesite, basalt, obsidian, pumice, rhyolite, scoria, and tuff.
Sample of basalt (an extrusive igneous rock), found in Massachusetts. Credit: B.W. Hallett, V. F. Paskevich, L.J. Poppe, S.G. Brand, and D.S. BlackwoodGranite. Credit: Museums VictoriaGabbro specimen; Rock Creek Canyon, eastern Sierra Nevada, California. Credit: Mark A. Wilson
Metamorphic Rock
Metamorphic rocks arise from the transformation of existing rock types, in a process called metamorphism, which means “change in form”.
The original rock (protolith) is subjected to heat and pressure causing profound physical and/or chemical change. The protolith may be a sedimentary rock, an igneous rock or another older metamorphic rock.
Metamorphic rocks make up a large part of the Earth’s crust and form 12% of the Earth’s current land surface. They are classified by texture and by chemical and mineral assemblage (metamorphic facies). They may be formed simply by being deep beneath the Earth’s surface, subjected to high temperatures and the great pressure of the rock layers above it. They can form from tectonic processes such as continental collisions, which cause horizontal pressure, friction and distortion. They are also formed when rock is heated up by the intrusion of hot molten rock called magma from the Earth’s interior.
There are two basic types of metamorphic rocks:
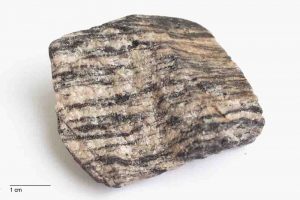
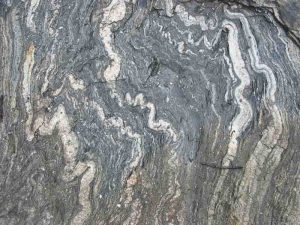
Foliated metamorphic rocks such as gneiss, phyllite, schist, and slate have a layered or banded appearance that is produced by exposure to heat and directed pressure.
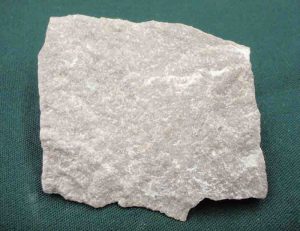
Non-foliated metamorphic rocks such as hornfels, marble, quartzite, and novaculite do not have a layered or banded appearance.
Quartzite. Credit: Museum of Geology at University of Tartu collectionGneiss. Credit: McMaster Virtual Geology MuseumFolded foliation in a metamorphic rock from near Geirangerfjord, Norway. Credit: Siim
Sedimentary Rock
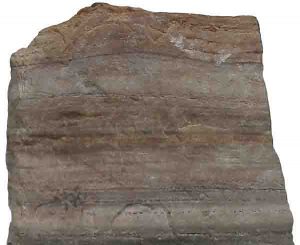
Sedimentary rock is one of the three main rock groups (along with igneous and metamorphic rocks) and is formed in four main ways: by the deposition of the weathered remains of other rocks (known as ‘clastic’ sedimentary rocks); by the accumulation and the consolidation of sediments; by the deposition of the results of biogenic activity; and by precipitation from solution.
Sedimentary rocks include common types such as chalk, limestone, sandstone, clay and shale.
Sedimentary rocks cover 75% of the Earth’s surface.
Four basic processes are involved in the formation of a clastic sedimentary rock: weathering (erosion)caused mainly by friction of waves, transportation where the sediment is carried along by a current, deposition and compaction where the sediment is squashed together to form a rock of this kind.
Sedimentary rocks are formed from overburden pressure as particles of sediment are deposited out of air, ice, or water flows carrying the particles in suspension.
As sediment deposition builds up, the overburden (or ‘lithostatic’) pressure squeezes the sediment into layered solids in a process known as lithification (‘rock formation’) and the original connate fluids are expelled.
The term diagenesis is used to describe all the chemical, physical, and biological changes, including cementation, undergone by a sediment after its initial deposition and during and after its lithification, exclusive of surface weathering.
There are three basic types of sedimentary rocks:
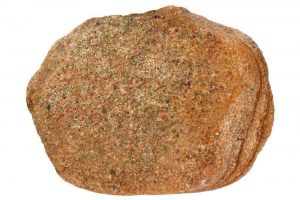
Clastic sedimentary rocks such as breccia, conglomerate, sandstone, siltstone, and shale are formed from mechanical weathering debris.
Chemical sedimentary rocks such as rock salt, iron ore, chert, flint, some dolomites, and some limestones, form when dissolved materials precipitate from solution.
Organic sedimentary rocks such as coal, some dolomites, and some limestones, form from the accumulation of plant or animal debris.
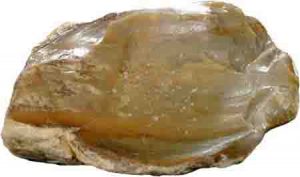
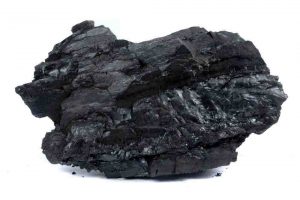
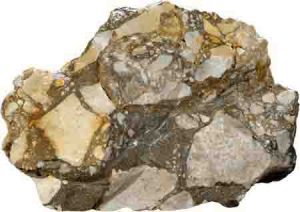
Sandstone. Credit: Minerals Education CoalitionCalcitic Limestone. Credit: Missouri Department of Natural Resources – State of MissouriChertLump of CoalBreccia
This artist’s concept shows a high-speed collision in the early stages of planetary formation. Credit: NASA/JPL-Caltech
New research challenges the prevailing theory that the unique nature of Earth’s iron was the result of how its core was formed billions of years ago.
The study opens the door to competing theories about why levels of certain heavy forms of iron, known as isotopes, are higher on Earth than in other bodies in the solar system. The prevailing view attributes Earth’s anomalous iron composition to the formation of the planet’s core. But the study published Feb. 20 in Nature Communications suggests that the peculiar iron’s isotopic signature developed later in Earth’s history, possibly created by a collision between Earth and another planetary body that vaporized the lighter iron isotopes, or the churning of Earth’s mantle, drawing a disproportionate amount of heavy iron isotopes to Earth’s crust from its mantle.
Iron is one of the most abundant elements in the solar system, and understanding it is key to figuring out how Earth and other celestial bodies formed. The researchers compared the ratio of the heavier iron isotope Fe-56 to the lighter Fe-54 for Earth and extraterrestrial rocks, including those from the moon, Mars and ancient meteorites. They found that the ratio is significantly higher for Earth rocks than for extraterrestrial rocks, all of which have an identical ratio. Their research attempts to explain how that happened.
“Earth’s core formation was probably the biggest event affecting Earth’s history,” said Jung-Fu Lin, professor of geosciences at the University of Texas at Austin and co-author of the paper. “In this study we say that there must be other origins than Earth’s formation for this iron isotopic anomaly.”
Co-author Nicolas Dauphas, the Louis Block Professor of Geophysical Sciences at the University of Chicago, called the research groundbreaking “because of the synthesis of the materials analyzed, the technique to take the measurements and the data treatment.”
The authors recreated the high pressure that characterized the conditions on Earth during the formation of its core. To do this, the researchers used a diamond anvil cell — a device capable of recreating pressures that exist deep inside planets — and were able to synthesize processes that would not be discernible otherwise.
“The diamond anvil cell has been used in this way before, but the difficulty is getting correct numbers,” Dauphas said. “That requires great care in data acquisition and treatment because the signal the diamond anvil gives off is very small. One has to use sophisticated mathematical techniques to make sense of the measurements, and it took a dream team to pull this off.”
The experiment sought to show that the high levels of heavy iron isotopes in Earth’s mantle likely occurred during the formation of Earth’s core. But the measurements show that it does not work, “so the solution to this mystery must be sought elsewhere,” Dauphas said.
More research is needed to understand the core’s formation and the reasons for Earth’s unique iron isotopic signature.
Reference:
Jin Liu, Nicolas Dauphas, Mathieu Roskosz, Michael Y. Hu, Hong Yang, Wenli Bi, Jiyong Zhao, Esen E. Alp, Justin Y. Hu, Jung-Fu Lin. Iron isotopic fractionation between silicate mantle and metallic core at high pressure. Nature Communications, 2017; 8: 14377 DOI: 10.1038/ncomms14377
Dork Sahagian and his colleagues drilled samples in the Hangay Mountains of central Mongolia. The lower portion of this photo shows the larger vesicles, or bubbles, that formed as smaller vesicles rose through hardening lava and coalesced. Credit: Dork Sahagian
Back when he was working on his Ph.D. in geophysics at the University of Chicago in the 1980s, Dork Sahagian took a break one day from studying lava flows to attend a lecture on how raindrops form in clouds.
What he learned gave him a fresh perspective on lava and inspired him to develop a new method of estimating the historic elevation of the Earth’s land surfaces.
“At the lecture,” says Sahagian, who is now a professor of earth and environmental sciences at Lehigh, “an atmospheric physicist showed how larger raindrops fall faster because they have a greater volume-to-surface-area ratio and thus a higher terminal velocity than smaller raindrops.
“Because of this, the larger drops catch up to the smaller drops and coalesce with them. The raindrops then grow in size, causing the size distribution to get bigger.”
At the time, Sahagian was studying the vesicles, or air bubbles, that become suspended in the hardened flows of basaltic lava, a highly fluid form of molten rock spewed by volcanoes. The vesicles form and are trapped in the top and bottom layers of the lava flow; the middle layer, the last to solidify, remains bubble-free.
The physicist’s lecture led to a Eureka moment for Sahagian.
“I turned the heavens upside-down, so to speak,” he recalls. “I imagined the larger lava bubbles flowing upwards, like the bubbles in champagne or soda, and catching up to the smaller bubbles and then coalescing and rising faster still.”
The top and bottom layers of the lava, Sahagian assumed, should contain roughly the same sizes of bubbles and the same distribution of bubble sizes. He did some mathematical calculations and wrote a model describing the rise, growth and coalescence of bubbles in a lava flow.
“But then one day I realized that the size distribution of the bubbles at the top of the flow should differ from the distribution at the bottom even though the lava comes from the same volcanic magma,” he said. “That’s because at the top, the bubbles are subjected only to atmospheric pressure, while at the bottom, they’re subjected to atmospheric pressure as well as to the hydrostatic pressure from the weight of the lava above.”
Thus, Sahagian reasoned, by calculating the ratio between modal bubble size in the top and bottom layers of the lava, and relating this to the thickness and the age of the lava flow, he could determine the atmospheric pressure that prevailed when the lava emplaced, or hardened into its final position. (The modal size is the size range with the greatest population of bubbles.)
“In other words, the ratios of the volumes of the bubbles should be the same as the ratio of the pressures. If we can measure the bubble volumes and the thickness of the lava, we can solve for atmospheric pressure.”
And given that atmospheric pressure declines as a function of increasing elevation, Sahagian further deduced that it should be possible to determine at what elevation the lava emplaced.
Several years later, Sahagian, by this time a faculty member at Ohio State University, headed to Hawaii to test the formula in basaltic lava flows that had hardened during the 1959 eruption of Mauna Loa volcano.
“When in doubt,” he says, “go to Hawaii.”
Sahagian and his student, Joe Maus, measured bubble sizes and distribution in samples taken from the base of Mauna Loa at sea level and from its summit at 12,000 feet elevation. To avoid skewed results, they sampled only simply emplaced, well-preserved and exposed lava flows that had not been altered—through inflation or drainage—after the upper and lower parts of the flows had solidified.
“We did a lot of scouting around before we found the right kind of flows,” Sahagian said. “We wanted to make sure that the vesicularity we measured was truly a function of stratigraphic position in the flow.”
The researchers calculated the ratio between average bubble size in the top and bottom layers of the lava at the base of Mauna Loa and then determined the same ratio for the lava at the volcano’s summit. The difference between the two ratios was significant, and it corresponded roughly to the difference in atmospheric pressure between the summit and base of Mauna Loa. Sahagian and Maus reported their results in Nature magazine in 1994 in an article titled “Basalt Vesicularity as a Measure of Atmospheric Pressure and Paleoelevation.”
“If atmospheric sea-level pressure is known (or assumed),” they wrote, “vesicle size distributions in basalt flows can thus be used as an indicator of the paleoelevation of emplacement. Analysis of the vesicle size distribution of basalt samples collected from the summit and base of Mauna Loa volcano in Hawaii [show] that the technique provides estimates of ambient pressure that provided estimates of elevation with a resolution of about 400 meters.”
“We were excited about this,” says Sahagian. “There weren’t really any good geologic paleoaltimeters to tell you how high a land feature was unless it was at sea level. We could measure water depth better than we could measure elevation.
“But now I had made a paleoaltimeter out of a trivial mathematical formula, and it worked.”
Sahagian next took his new technique to the Colorado Plateau, which covers large portions of Utah, Colorado, Arizona and New Mexico. Scientists using different methods to measure the plateau’s geologically recent rise in elevation had arrived at seemingly contradictory conclusions as to when—and thus why—the uplift was occurring.
“We tried to settle a dispute between those who said this was a recent uplift and those who said it was ancient. It turned out that both groups were right. The plateau has been uplifting for at least 30 million years but it’s been uplifting faster in the last five to ten million years than it was before.”
Most recently, Sahagian has traveled to the Hangay Mountains of central Mongolia to take on another geological puzzle: How did a relatively high region—the Hangay is a plateau with peaks reaching 13,000 feet in elevation—occur in a continental interior where elevations are usually low? Also, the Hangay are located near major rift zones that are stretching and that might be expected to have a flattening effect on the topography.
Sahagian and his collaborator, Alex Proussevitch of the University of New Hampshire and formerly of the Siberian Academy of Sciences in Novosibirsk, Russia, are part of an interdisciplinary team of two dozen researchers that has spent seven years studying the Hangay with a grant from the National Science Foundation. The team includes Lehigh faculty members Peter Zeitler, a geochronologist, Anne Meltzer, a seismologist, and Bruce Idleman, a senior research scientist. The researchers hope to shed light on the geologic history of the Earth and on the connections linking continental deformation, the development of topography and global climate.
In Mongolia, the first order of business for Sahagian and Proussevitch and their colleagues was to search for samples of well-exposed, unaltered lava whose thickness could be accurately measured. As the Hangay Mountains are a region of rugged topography with few roads and little if any infrastructure, the group considered itself fortunate to find a Russian-speaking driver with an all-terrain van.
“We did a lot of scouting around and collected samples,” says Sahagian. “We tried to make sure these lava sites had good exposure and that we could see the top and the bottom of a lava flow. We went all over the Hangay Plateau and the surrounding areas, including the Gobi Desert, where there were lava flows as well.”
The group collected samples drilling 1-inch-diameter cores. The specimens were dated by Zeitler and his students in Lehigh’s Geochronology Lab and found to range in age from 100,000 years to 3-4 million years to 9.5 million years.
“We were fortunate to get a good distribution of ages,” says Sahagian.
The researchers next used high-resolution computed x-ray tomography scanning to measure bubble sizes and distributions in the top and bottom layers of each lava specimen. They then determined the ratio of average vesicle sizes between the layers and, subsequently, the atmospheric pressure at the time of emplacement.
The group reported its results last year in an article in the Journal of Geology titled “Uplift of Central Mongola Recorded in Vesicular Basalts.” Its main conclusion: the Hangay Mountains have risen in elevation by approximately 1 kilometer, plus or minus a few hundred meters, in the last 10 million years. When this uplift occurred, and whether it happened all at once, gradually or in fits and starts, has yet to be determined.
Sahagian says that much work remains to be done in the Hangay Mountains.
“This is one of our first results. Many different hypotheses have been suggested as to why the Hangay region is high and why it is uplifting. We’re hoping to test these and develop a hypothesis of our own. We’re waiting for the results of seismic work that will tell us more about the deep structure of the mantle and upper and lower lithosphere.
“But as far as our basaltic vesicularity work is concerned, our result is robust. One kilometer in 10 million years is not an abnormal rate of uplift. It’s very consistent with what others are finding. How do we interpret that result? That’s the bigger picture, and it still has to be resolved.”
Reference:
D. Sahagian et al. Uplift of Central Mongolia Recorded in Vesicular Basalts, The Journal of Geology (2016). DOI: 10.1086/686272
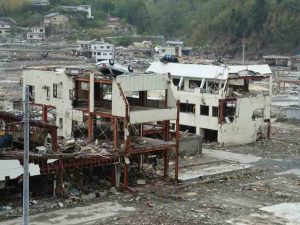
Damage in Onagawa, Japan, after the 2011 Tōhoku earthquake and tsunami
The first computer model to simulate the whole chain of events triggered by offshore mega subduction earthquakes could reduce losses to life and property caused by disasters like the huge earthquake and tsunami that struck Japan six years ago.
This pioneering new model has been developed by the CRUST (Cascading Risk and Uncertainty Assessment of Earthquake Shaking and Tsunami) project with funding from the Engineering and Physical Sciences Research Council (EPSRC). The University of Bristol, in collaboration with UCL, has led the work at the head of a multi-national consortium.
Designed to be used in any part of the world potentially vulnerable to offshore subduction earthquakes (where one tectonic plate is forced beneath another), such as Japan, New Zealand, the Pacific Northwest (US and Canada), Mexico, Chile and Indonesia, the model integrates every aspect and consequence of an undersea earthquake — including tsunamis, aftershocks and landslides — into a single disaster simulation tool.
By generating more comprehensive, more accurate maps of all potential hazards and a better understanding of how these are connected with each other, it can be used to strengthen emergency planning, improve evacuation strategies, enable engineers to calculate buildings’ resilience more realistically and help the insurance industry produce more reliable financial risk analyses, for example.
In the past, risks posed by earthquakes and by the different threats associated with them have been modelled separately, based on different methods, data and assumptions varying from one part of the world to another. This lack of integration and lack of a standard approach has limited models’ real-world value as well as the benefits of information sharing between countries.
Dr Katsu Goda, Senior Lecturer in Civil Engineering in the University of Bristol’s Department of Civil Engineering, who has led the CRUST team, says: “For the first time ever, we’ve brought genuine joined-up thinking to the whole issue of offshore giant subduction earthquakes and their links to tsunamis, aftershocks and landslides, taking account of how all of these are linked and how one type of event leads, or ‘cascades’, into another.”
With its ability to produce a more reliable and realistic picture of the entire sequence of events and to generate multi-hazard maps, the model will enable governments, emergency services, the financial industry and others to explore alternative disaster scenarios in detail. In the coming months, the CRUST team will focus on refining the model’s capabilities as a truly predictive tool.
Dr Goda says: “The magnitude 9 Tohoku earthquake and resulting tsunami waves that hit the east coast of Japan on 11 March, 2011 caused around 19,000 deaths plus economic damage estimated at US$300 billion. We hope our simulation tool will secure wide rollout around the world and will be used to inform decision-making and boost resilience to these frequently devastating events.”
Analysis of rock samples harvested from the Canadian Shield suggests the samples contain components of Earth’s crust that existed more than 4.2 billion year ago. The results and related interpretations improve scientists’ understanding of the evolution of the oldest elements of Earth’s continental hard outer layer.
Recreating the nature of Earth’s first crust is difficult because geologic activity has created turnover that drove most of it back into Earth’s interior. While some slivers of 4-billion-year-old crust remain in the rock record, only isolated zircon mineral grains are dated to be older. Here, Jonathan O’Neil and Richard W. Carlson analyzed isotope ratios of samarium and neodymium in rocks collected from the Superior Province, the region in Canada just north of the Great Lakes.
The samples are mostly made up of a type of granite that formed 2.7 billion years ago, but the authors note that the formation of these magnesium-deficient rocks requires the “recycling” of older, magnesium-rich rocks. Given the age of the samples, the time it would take for them to form from recycled magnesium-rich rocks, and the ratio of samarium and neodymium isotopes in the samples, the authors suggest that reworked crust – older than 4.2 billion years – is mixed into the 2.7-billion-year-old rocks of the Superior Province.
They preserve the signature of an early differentiation in the Earth, one presumably related to the formation of a primordial crust that took shape within the first few hundred million years of Earth’s history.
Reference:
Jonathan O’Neil, Richard W. Carlson, Building Archean cratons from Hadean mafic crust. DOI: 10.1126/science.aah3823
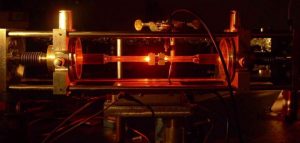
Radiofrequency discharge of the GINGERino ring laser. A helium-neon plasma is generated in the middle of one side of the ring through a pyrex capillary. Credit: Belfi et al.
Researchers in Italy hope to measure Earth’s rotation using a laser-based gyroscope housed deep underground, with enough experimental precision to reveal measurable effects of Einstein’s general theory of relativity. The ring laser gyroscope (RLG) technology enabling these Earth-based measurements provide, unlike those made by referencing celestial objects, inertial rotation information, revealing fluctuations in the rotation rate from the grounded reference frame.
A group from the Italian National Institute for Nuclear Physics’ (INFN) Laboratori Nazionali del Gran Sasso (LNGS) are working with a research program aimed at measuring the gyroscopic precession Earth undergoes due to a relativistic effect called the Lense-Thirring effect. This program, called Gyroscopes in General Relativity (GINGER), would eventually use an array of such highly sensitive RLGS. For now, they have successfully demonstrated its prototype, GINGERino, and acquired a host of additional seismic measurements necessary in their efforts.
In this week’s journal Review of Scientific Instruments, from AIP Publishing, the group reports their successful installation of the single-axis GINGERino instrument inside the INFN’s subterranean laboratory LNGS, and its ability to detect local ground rotational motion.
Ultimately, GINGER aims to measure Earth’s rotation rate vector with a relative accuracy of better than one part per billion to see the miniscule Lense-Thirring effects.
“This effect is detectable as a small difference between the Earth’s rotation rate value measured by a ground based observatory, and the value measured in an inertial reference frame,” said Jacopo Belfi, lead author and a researcher working for the Pisa section of INFN. “This small difference is generated by the Earth’s mass and angular momentum and has been foreseen by Einstein’s general theory of relativity. From the experimental point of view, one needs to measure the Earth rotation rate vector with a relative accuracy better than one part per billion, corresponding to an absolute rotation rate resolution of 10-14 [radians per second].”
The underground placement of these systems is essential for getting far enough away from external disturbances from hydrology, temperature or barometric pressure changes to carry out these types of sensitive measurements.
This pilot prototype is expected to reveal unique information about geophysics, but, according to Belfi, “underground installations of large RLGs, free of surface disturbances, may also provide useful information about geodesy, the branch of science dealing with the shape and area of Earth.”
The ultimate goal for GINGERino is to achieve a relative precision of at least one part per billion, within a few hours’ time, to integrate with the less precise information of Earth’s changing rotation provided by global positioning system data and the astronomically based measurements of the International Earth Rotation System.
“RLGs are essentially active optical interferometers in ring configuration,” Belfi said. “Our interferometers are typically made of three or four mirrors that form a closed loop for two optical beams counter propagating along the loop. Due to the Sagnac effect, a ring interferometer is an extremely accurate angular velocity detector. It’s essentially a gyroscope.”
The group’s approach enabled the first deep underground installation of an ultrasensitive large-frame RLG capable of measuring the Earth’s rotation rate with a maximum resolution of 30 picorads/second.
“One peculiarity of the GINGERino installation is that it’s intentionally located within a high seismicity area of central Italy,” Belfi said. “Unlike other large RLG installations, GINGERino can actually explore the seismic rotations induced by nearby earthquakes.”
One of the biggest challenges during GINGERino’s installation was controlling the natural relative humidity, which was above 90 percent.
“With this humidity level, long-term operation of GINGERino’s electronics wouldn’t be viable,” Belfi said. “So to maneuver around this problem, we enclosed the RLG inside an isolation chamber and increased the internal temperature of the chamber via a set of infrared lamps supplied with a constant voltage.”
By doing so, the group was able to drop the relative humidity down to 60 percent. “It didn’t significantly degrade the natural thermal stability of the underground location, which allows us to keep GINGERino’s cavity length stable to within one laser wavelength (633 nanometers) for several days,” he said.
GINGERino is now operating, along with seismic equipment provided by the Italian Institute of Geophysics and Volcanology, as a rotational seismic observatory.
“GINGERino and one co-located broadband seismometer make it possible to retrieve, via a single station, information about the seismic surface wave’s phase velocity that in standard seismology requires using large arrays of seismometers,” said Belfi.
Reference:
“Deep underground rotation measurements: GINGERino ring laser gyroscope in Gran Sasso,” is authored by Jacopo Belfi, Nicolò Beverini, Filippo Bosi, Giorgio Carelli, Davide Cuccato, Gaetano De Luca, Angela D. Di Virgilio, André Gebauer, Enrico Maccioni, Antonello Ortolan, Albert Prozio, Gilberto Saccorotti, Andreino Simonelli and Giuseppe Terreni. The article will appear in the journal Review of Scientific Instruments March 14, 2017. DOI: 10.1063/1.4977051
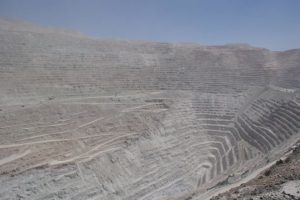
Chuquicamata, in Chile, is amongst the largest copper deposits in the world. Credit: M. Chiaradia, UNIGE
The world’s most valuable copper deposits, known as porphyry deposits, originate from cooling magma. But how can we predict the size of these deposits? What factors govern the amount of copper present? Researchers at the University of Geneva (UNIGE), Switzerland, have studied over 100,000 combinations to establish the depth and number of years required for magma to produce a given amount of copper. The same scientists have also devised a model that can detect the quantity of copper held in a deposit by means of a simple factor analysis. The research, which is published in the journal Scientific Reports, will make it possible to estimate the potential for mining the metal before beginning any drilling. It is a model that will undoubtedly be of great benefit to mining companies.
Porphyry copper deposits account for 75% of natural copper worldwide. They are formed by magma chambers situated between 10 and 15 km beneath Earth’s surface. At this depth, the magma heats to around 900°C but when it comes into contact with the surrounding rock, it cools and crystallises. The water in the magma can then no longer be in solution: it forms bubbles that escape to the surface, carrying with them a substantial part of the copper originally contained in the magma. At a depth of around 2-3 km, the bubbles cool down in the porosities of the rocks, and precipitate the copper they contain as sulphide, creating deposits that may include from 1 to >200 million tons of copper. This explains why Massimo Chiaradia and Luca Caricchi, researchers in the Earth sciences department in the faculty of science at UNIGE, were so keen to discover what dictates the amount of copper in a deposit and whether it was possible to anticipate its size.
More magma means more copper
The volume of magma determines the amount of copper, but under what conditions does the volume of the initial magma form? Chiaradia explains: “We used models that incorporate the depth and timescale at which the magma accumulates, the duration of the build-up that forms the deposit, the water content of the magma and the quantity of copper in the water. We then varied these parameters from a minimum to a maximum based on actual measurements.” By modifying the parameters, the scientists obtained 100,000 simulations that they compared with the actual data available to them, which helped define the ideal conditions for the formation of a huge deposit. As Caricchi adds: “The optimum conditions for creating a magmatic system that results in the formation of a deposit of 30 to 240 million tons of copper is a depth of over 20 km and a continuous injection time of molten magma of over 2 million years.”
In search of the ideal deposit
Magma contains water, copper and various other chemical components, including Strontium (Sr) and Yttrium (Y). We know that when the Sr divided by Y ratio is between 50 and 150 in the magma, there is a high probability of finding copper in the deposit. The researchers at UNIGE integrated this ratio into their new model and merged it with the estimated formation time for deposits. Other minerals are associated with copper in these deposits, which allows scientists to date them thanks to the natural decay of uranium into lead and rhenium into osmium. This enabled the scientists to establish the age, i.e. the birth, but also the length, i.e. the number of years, for forming a copper deposit, which can range from tens of thousands of years to two million years. “These two items of data — the Sr / Y ratio and the duration of the formation — meant we could design a table of probabilities for determining the amount of copper in the deposit under analysis,” continues Chiaradia. Mining companies will be able to use this model to assess the size of a copper deposit at the initial research stage, before starting any significant drilling work. “Our model,” says Caricchi, “which we have compared to real data, has an excellent match rate, and it can save an enormous amount of time and money during mining explorations.”
Reference:
Massimo Chiaradia, Luca Caricchi. Stochastic modelling of deep magmatic controls on porphyry copper deposit endowment. Scientific Reports, 2017; 7: 44523 DOI: 10.1038/srep44523
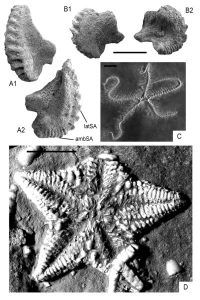
These are paleozoic hangover asterozoans. Specimen repositories: MHI = Muschelkalkmuseum Ingelfingen; MnhnL = Natural History Museum Luxembourg. Figure courtesy B. Thuy et al., copyright The Geological Society of America, 2017. Credit: Figure courtesy B. Thuy et al., copyright The Geological Society of America, 2017.
The end-Paleozoic witnessed the most devastating mass extinction in Earth’s history so far, killing the majority of species and profoundly shaping the evolutionary history of the survivors. Echinoderms are among the marine invertebrates that suffered the most severe losses at the end-Permian extinction.
At least that was the consensus until a team of European paleontologists — Ben Thuy, Hans Hagdorn, and Andy S. Gale — cast a critical eye on some poorly studied Triassic echinoderm fossils. The fossils turned out to belong to groups that supposedly went extinct by the end of the Paleozoic.
Some ancient echinoids, ophiuroids, and asteroids had slipped the bottleneck and coexisted with the ancestors of modern-day sea urchins, brittle stars, sand dollars, and relatives, for many millions of years. These echinoderm hangovers occurred almost worldwide and had spread into a wide range of paleo-environments by the late Triassic.
This discovery challenges the fundamentals of echinoderm evolution with respect to end-Permian survival and sheds new light on the early evolution of the modern clades, in particular on Triassic ghost lineages of the crown-group look-alikes of the Paleozoic hangovers.
Reference:
Andy S. Gale et al. Paleozoic echinoderm hangovers: Waking up in the Triassic. Geology, March 2017 DOI: 10.1130/G38909.1
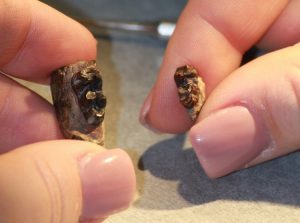
Comparing fossil size; larger non-ETM2 Arenahippus specimen in left hand, smaller mid-ETM2 Arenahippus specimen in right hand. Credit: University of New Hampshire
More than 50 million years ago, when the Earth experienced a series of extreme global warming events, early mammals responded by shrinking in size. While this mammalian dwarfism has previously been linked to the largest of these events, research led by the University of New Hampshire has found that this evolutionary process can happen in smaller, so-called hyperthermals, indicating an important pattern that could help shape an understanding of underlying effects of current human-caused climate change.
“We know that during the largest of these hyperthermals, known as the Paleocene-Eocene Thermal Maximum, or PETM, temperatures rose an estimated nine to 14 degrees Fahrenheit and some mammals shrank by 30 percent over time, so we wanted to see if this pattern repeated during other warming events,” says Abigail D’Ambrosia, a doctoral student at UNH and lead author of the study. “The hope is that it would help us learn more about the possible effects of today’s global warming.”
In the study, published in Science Advances, researchers collected teeth and jaw fragments in the fossil-rich Bighorn Basin region of Wyoming. Their focus was on several early mammals including Arenahippus, an early horse the size of a small dog, and Diacodexis, a rabbit-sized predecessor to hoofed mammals.
Using the size of the molar teeth as a proxy for body size, the researchers found a statistically significant decrease in the body size of these mammals’ during a second, smaller, hyperthermal, called the ETM2. Arenahippus decreased by about 14 percent in size, and the Diacodexis by about 15 percent.
“We found evidence of mammalian dwarfism during this second hyperthermal, however it was less extreme than during the PETM,” said D’Ambrosia. “During ETM2 temperatures only rose an estimated five degrees Fahrenheit and it was shorter only lasting 80,000 to 100,000 years, about half as long as the larger PETM. Since the temperature change was smaller, this suggests there may be a relationship between the magnitude of a global warming event and the degree of associated mammal dwarfism.”
Researchers propose that the body change could have been an evolutionary response to create a more efficient way to reduce body heat. A smaller body size would allow the animals to cool down faster. Nutrient availability and quality in plants may have also played a role. Previous research shows that both the PETM and the ETM2 hyperthermals coincided with increased levels of carbon dioxide in the atmosphere and that could have limited nutrient quality in plants, which may have contributed to the smaller mammal body size. Hydrological records during the PETM also suggest less precipitation and drought which could have led to drier soils and even fire which may have affected vegetation growth and eventually possibly offspring size. After both hyperthermal events, body sizes on all mammals rebounded.
The carbon dioxide released during both hyperthermals has a similar footprint to today’s fossil fuels. Researchers hope that developing a better understanding of the relationship between the change in mammalian body size during those events and today’s greenhouse gas-induced global warming may help to better predict possible future ecological changes in response to today’s climate changes.
Co-authors include William Clyde, professor of Earth Sciences at UNH; Henry C. Fricke, Colorado College; Philip D. Gingerich, University of Michigan; Hemmo A. Abels, Delft University of Technology, Netherlands.
The preliminary findings were presented earlier at the Society of Vertebrate Paleontology’s 2013 annual meeting.
Reference:
Abigail R. D’Ambrosia, William C. Clyde, Henry C. Fricke, Philip D. Gingerich, Hemmo A. Abels. Repetitive mammalian dwarfing during ancient greenhouse warming events. Science Advances, 2017; 3 (3): e1601430 DOI: 10.1126/sciadv.1601430
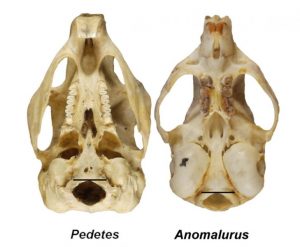
Comparison of the positioning of the foramen magnum in a bipedal springhare (left) and its closest quadrupedal relative, the scaly-tailed squirrel. Credit: Image from Russo and Kirk, Journal of Human Evolution
The evolution of bipedalism in fossil humans can be detected using a key feature of the skull — a claim that was previously contested but now has been further validated by researchers at Stony Brook University and The University of Texas at Austin.
Compared with other primates, the large hole at the base of the human skull where the spinal cord passes through, known as the foramen magnum, is shifted forward. While many scientists generally attribute this shift to the evolution of bipedalism and the need to balance the head directly atop the spine, others have been critical of the proposed link. Validating this connection provides another tool for researchers to determine whether a fossil hominid walked upright on two feet like humans or on four limbs like modern great apes.
Controversy has centered on the association between a forward-shifted foramen magnum and bipedalism since 1925, when Raymond Dart discussed it in his description of “Taung child,” a 2.8 million-year-old fossil skull of the extinct South African species Australopithecus africanus. A study published last year by Aidan Ruth and colleagues continued to stir up the controversy when they offered additional criticisms of the idea.
However, in a study published in the Journal of Human Evolution, UT Austin anthropology alumna Gabrielle Russo, now an assistant professor at Stony Brook University, and UT Austin anthropologist Chris Kirk built on their own prior research to show that a forward-shifted foramen magnum is found not just in humans and their bipedal fossil relatives, but is a shared feature of bipedal mammals more generally.
“This question of how bipedalism influences skull anatomy keeps coming up partly because it’s difficult to test the various hypotheses if you only focus on primates,” Kirk said. “However, when you look at the full range of diversity across mammals, the evidence is compelling that bipedalism and a forward-shifted foramen magnum go hand-in-hand.”
In this study, Russo and Kirk expanded on their previous research (published in the same journal in 2013) by using new methods to quantify aspects of foramen magnum anatomy and sampling the largest number of mammal species to date.
To make their case, Russo and Kirk compared the position and orientation of the foramen magnum in 77 mammal species including marsupials, rodents and primates. Their findings indicate that bipedal mammals such as humans, kangaroos, springhares and jerboas have a more forward-positioned foramen magnum than their quadrupedal close relatives.
“We’ve now shown that the foramen magnum is forward-shifted across multiple bipedal mammalian clades using multiple metrics from the skull, which I think is convincing evidence that we’re capturing a real phenomenon,” Russo said.
Additionally, the study identifies specific measurements that can be applied to future research to map out the evolution of bipedalism. “Other researchers should feel confident in making use of our data to interpret the human fossil record,” Russo said.
Reference:
Gabrielle A. Russo, E. Christopher Kirk. Another look at the foramen magnum in bipedal mammals. Journal of Human Evolution, 2017; 105: 24 DOI: 10.1016/j.jhevol.2017.01.018
Picture of Cyphoderis monstrosa. Credit: Piotr Naskrecki
World-first research into a rare family of insects will help scientists understand how the common bush-crickets we are familiar with today developed their highly specialised acoustic functions.
Findings of the new study by sensory and evolutionary biologists at the University of Lincoln, UK, in collaboration with teams in Canada and France, have been published in the Journal of Experimental Biology.
Funded by the Leverhulme Trust, the new multidisciplinary research sheds light on the very early evolutionary stages of the sound generating organs in ‘orthopterans’ (bush-crickets and their related species) — the largest group of acoustically active insects on the planet.
The study takes a detailed look at a small and rare group of orthopterans, called ‘grigs’, which are the sole remaining living family of an ancient super-family of crickets called ‘haglids’. Until now, most of our scientific knowledge about haglids has been derived from fossilised remains, which are known to date back to the Jurassic period at least.
This new research reveals that grigs, and the way they create sounds using their wings, are of major importance in helping us to understand the early evolutionary stages in the centuries-old lineages of modern field and bush-crickets.
Dr Fernando Montealegre-Z, a Leverhulme grant holder and leading entomologist from the University of Lincoln’s School of Life Sciences, explained: “There are less than 10 species of grigs alive today, nearly 100 species extinct, so our research into these rare animals is very significant as it tells us a great deal about how orthopterans have evolved.
“Our work focuses on the relationship between form and function in the sound-generating organs of the different cricket groups. Both common field crickets and bush-crickets are categorised by the males of the groups producing female-attracting calls by rubbing together specialised regions of their forewings.
“Such sound generation is made possible by specially evolved forewing morphologies. By contrast, the forewings of grigs lack most of the specialised features seen in their relatives. In other words, they are more reminiscent of the forms we see in the fossilised remains of now extinct species.”
Previous studies have concluded that grigs are more closely related to bush-crickets than to common field crickets. However, grigs and common crickets both use two symmetrical forewings for creating sound, while bush-crickets have a strong asymmetry between their forewings and use different wing areas for sound production.
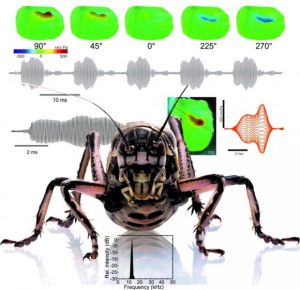
By using state-of-the-art laser measurement techniques, the research team found that the sound-producing areas on the wings of grigs are in fact the same as in bush-crickets.
Benedict Chivers, a PhD student funded by the Leverhulme grant at the University of Lincoln, said: “Our findings suggest that the sound generators in grigs represent an early evolutionary stage in the bush-cricket lineage. Grigs are therefore highly important for our investigations into the early evolutionary stages of a tremendous group diversity.
“We identified vibrating areas on seemingly unspecialised wings and found that these can function as highly tuned resonators — this is particularly interesting because there are multiple examples of similarly ‘unspecialised’ wings within the fossil record, and until now our understanding of how these worked was relatively poor.
“We now believe that both the morphology and function of grigs’ wings represent a transitional stage between the unspecialised wings of their fossilised ancestors, and the adapted form of modern bush-crickets.
“Thanks to this new research, scientific efforts to discover the vibrational and sound-producing properties of fossilised wings will be significantly improved, so that we can better understand the acoustic world in which now extinct species once lived.”
The researchers also found that there is a ‘mirror area’ on the wings of grigs which is shared by both bush-crickets and field crickets. They believe this finding points to a single ancestral pattern, from which the field and bush-cricket lineages went on to diverge. Following this initial study, more work can now be done to examine the early stages of species development.
Reference:
Benedict D. Chivers, Olivier Béthoux, Fabio A. Sarria-S, Thorin Jonsson, Andrew C. Mason, Fernando Montealegre-Z. Functional morphology of tegmina-based stridulation in the relict species Cyphoderris monstrosa (Orthoptera: Ensifera: Prophalangopsidae). The Journal of Experimental Biology, 2017; 220 (6): 1112 DOI: 10.1242/jeb.153106
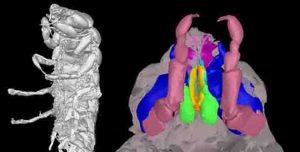
Micro-computed tomography of the fossil isopod Urda rostrata. Credit: C. Nagler, LMU
Biologists at LMU have identified two 168-million-year-old fossils as the oldest known parasitic representatives of the crustacean group Isopoda. The study sheds new light on the evolutionary history of isopods.
Isopods—of which the woodlouse is perhaps the best known representative—are crustaceans, related to shrimps and lobsters. Representatives of this crustacean group exhibit a wide variety of lifestyles and exploit a large spectrum of ecological niches. Cymothoida, an isopod ingroup, is composed of different sub-groups that evolved different feeding strategies, from free-living scavengers to host-specific and obligate parasites depending on their hosts for their survival; hence, isopods in this group show an extremely diverse morphology. A new study of the oldest fossil parasitic isopods discovered to date, carried out by LMU biologists Christina Nagler and Joachim Haug, has allowed reconstructing the evolution of parasitism within Cymothoida in detail. The findings have just appeared in the online journal BMC Evolutionary Biology.
For the study, the authors chose two specimens of the fossil species Urda rostrata held in the Bavarian State Collection for Paleontology and Geology in Munich, which are unusually well preserved and amenable to three-dimensional reconstruction. Both were recovered at the same site and are 168 million years old, hence from the Jurassic period (145-200 million years ago). Representatives of Urda were widespread during the Jurassic. However, little is known about their lifestyle or phylogenetic affiliation, as morphological characters that would allow drawing reliable conclusions on these aspects have not been accessible in the fossil specimens investigated so far. “With modern imaging techniques, especially micro-computed tomography, we were able to visualize morphological details of the mouthparts and the legs of these fossil isopods for the first time,” Nagler says.
The imaging data revealed that the fossils possess certain features that are typically found in modern parasitic isopods. The morphology of the mouthparts suggests that both specimens were specialized for piercing and sucking, while the legs on the thorax end in clearly curved hooks of the sort that modern forms use to attach themselves firmly to their hosts. These aspects of its functional morphology therefore support the inference that U. rostrata was an external parasite. Moreover, both specimens were recovered from limestone beds indicative of a tropical lagoon – an environment in which diverse present-day species of Cymothoida occur as obligate ectoparasites on fish. In addition, the fossils have a number of morphological features in common with modern isopods which follow a parasitic lifestyle only during the juvenile phase of the life-cycle. “This finding indicates that the morphology of the mouthparts and the thoracic appendages was progressively adapted to the demands of a parasitic lifestyle,” Nagler explains. Furthermore, the reconstruction of the phylogenetic relationships suggests that parasitism originated only once within Cymothoida, and that the transition from scavenger to parasite involved intermediate forms that began as opportunistic predators (like mosquitoes) and subsequently gave rise to stage-specific and to obligate parasites.
Reference:
Christina Nagler et al. 168 million years old “marine lice” and the evolution of parasitism within isopods, BMC Evolutionary Biology (2017). DOI: 10.1186/s12862-017-0915-1
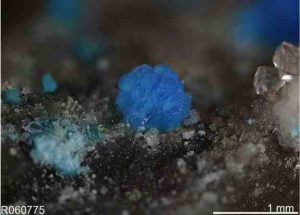
Nevadaite is only known from just two locations: Eureka County, Nevada, and a copper mine in Kyrgyzstan. Credit: R.DOWNS/UofNEVADA
Scientists have categorised the Earth’s rarest minerals.
None of 2,500 species described is known from more than five locations, and for a few of them the total global supply could fit in a thimble.
The researchers say it is important to hunt down these oddities because they contain fundamental information about the construction of our planet.
Some will also undoubtedly have properties that are useful in technological applications.
The list appears in a paper about to be published in the journal American Mineralogist.
It is authored by Dr Robert Hazen, from the Carnegie Institution in Washington DC, and Prof Jesse Ausubel of The Rockefeller University, in New York.
“Scientists have so far tracked down 5,000 mineral species and it turns out that fewer than a 100 constitute almost all of Earth’s crust. The rest of them are rare, but the rarest of the rare – that’s about 2,500 minerals – are only found at five places on Earth or fewer,” Dr Hazen told BBC News.
“And you ask: why study them; they seem so insignificant? But they are the key to the diversity of the Earth’s near-surface environments.
“It’s the rare minerals that tell us so much about how Earth differs from the Moon, from Mars, from Mercury, where the same common minerals exist, but it’s the rare minerals that make Earth special.”
Minerals are combinations of chemical elements arranged into crystalline structures. Earth’s rocks are built from different aggregations. Think of feldspar, quartz and mica – these are the ubiquitous species that everyone knows.
But cobaltominite, abelsonite, fingerite, edoylerite – these are examples that will not form unless the “cooking conditions” are absolutely perfect.
The atomic ingredients must sum exactly, the temperature must be precise to the degree, and the pressure will have to be defined in the narrowest of margins.
And then, some will immediately fall apart when they get wet or the sun shines on them.
Edoylerite, metasideronatrite, and sideronatrite are examples of vampire-like minerals that decompose on exposure to light.
Hazen and Ausubel have put their list of 2,500 species into four broad categories of rarity that speak to the conditions under which they form, how rare their ingredients are, how ephemeral they are, and the limitations on their sampling.
“Fingerite is like a ‘perfect storm of rarity’,” said Dr Hazen.
“It occurs only on the flanks of the Izalco Volcano in El Salvador – an incredibly dangerous place with super-hot fumeroles.
“It’s made of rare elements – vanadium and copper have to exist together, and it forms under an extremely narrow range of conditions. If you just change the ratio of copper to vanadium slightly, you get a different mineral. And every time it rains, fingerite washes away.”
The new catalogue allows scientists to begin to gauge just how large the reserves of a particular mineral ought to be, and where those reserves might be. And for the technologically useful ones, this will have enormous value (although it is often possible to synthesise these minerals industrially).
But the exercise also provides important insights on Earth itself. Many of these minerals would be absent altogether if not for the presence of biology, which moderates the chemical environment in which minerals forms.
In that context, the paper contributes to the Deep Carbon Observatory project, an international venture that seeks to understand carbon’s role in the Earth system.
It is thought there are just over 100 carbon-bearing minerals out there waiting to be found.
Dr Hazen actually has an entry named after him in the catalogue.
Hazenite is only known from Mono Lake, California. It forms when the phosphorus levels in the lake get too high, and the microbes in the water, in order to survive, have to start excreting it from their cells.
The resulting tiny, colourless crystals are essentially microbial “poop”.
“Yes, it’s true – hazenite happens,” said Dr Hazen.
Note: The above post is reprinted from materials provided by BBC. The original article was written by Jonathan Amos.
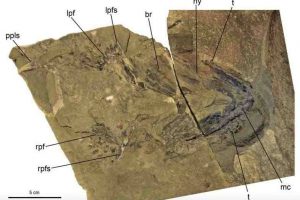
The Doliodus problematicus fossil specimen (scale bar 5 cm).
New research based on x-ray imaging provides the strongest evidence to date that sharks arose from a group of bony fishes called acanthodians. Analyzing an extraordinarily well-preserved fossil of an ancient sharklike fish, researchers identified it as an important transitional species that points to sharks as ancanthodians’ living descendants. The work is published in the journal American Museum Novitates.
“Major vertebrate evolutionary transitions, such as ‘fin to limb’ and ‘dinosaur to bird’ are substantiated by numerous fossil discoveries,” said John Maisey, the lead author of the study and the Herbert R. and Evelyn Axelrod Research Curator in the American Museum of Natural History’s Division of Paleontology. “By contrast, the much earlier rise of sharklike fishes within jawed vertebrates is poorly documented. Although this ‘fish to fish’ transition involved less profound anatomical reorganization than the evolutions of tetrapods or birds, it is no less important for informing the evolutionary origins of modern vertebrate diversity.”
In 2003, this question in vertebrate evolution was revitalized by the discovery of a remarkable fossil skeleton of a sharklike fish in New Brunswick, Canada. Named Doliodus problematicus, this species lived during the lower Devonian, between about 397 and 400 million years ago. When its discovery was announced, D. problematicus was shown to have paired spines in front of its pectoral (shoulder) fins, a feature otherwise known mainly in acanthodians. But in 2009 and 2014, Maisey and colleagues determined that the animal’s head, skeleton, and teeth were actually more like those of sharks than acanthodians.
The new study, based on computed tomography (CT) imaging at the French National Museum of Natural History in Paris, uncovered even more spines that are buried
inside the matrix of the fossil. These spines likely lined the underside of the fish, a distinguishing characteristic of acanthodians that confirms the fossil is evidence of an important transitional species.
“The arrangement of these spines shows unequivocally that this fish was basically an acanthodian with a shark’s head, pectoral skeleton, and teeth,” Maisey said.
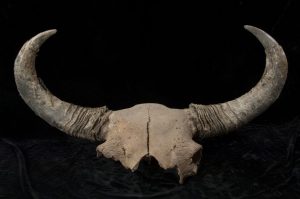
New research by Professor Beth Shapiro of the UC Santa Cruz Genomics Institute and University of Alberta Professor Duane Froese has identified North America’s oldest bison fossils and helped construct a bison genealogy establishing that a common maternal ancestor arrived between 130,000 and 195,000 years ago, during a previous ice age.
Shapiro, Froese and colleagues used new techniques for ancient DNA extraction and sequenced the mitochondrial genomes of more than 40 bison, including the two oldest bison fossils ever recovered. Comparing these genomes to additional Siberian and North American bison clarifies the earliest parts of the bison family tree.
“There has long been a controversy about the timing of bison arrival in North America,” said Shapiro. Bison arrival in North America marks the beginning of what geologists call the “Rancholabrean Land Mammal Age,” which is used to discriminate between different ecological periods in the continent’s history. “Until recently, the fossil records from different parts of North America disagreed with each other, with a few fossil localities suggesting that bison arrived millions of years ago, but most old fossil sites showing no evidence of bison at all,” Shapiro said. As new methods to date fossil localities emerged, the ages of the sites in North America with purportedly very old fossil bison have all been questioned, leaving the timing of bison arrival a mystery.
The new study explored fossil locations in Northern North America — the entry point for bison into the continent — and extracted DNA from two of the oldest bison fossils known on the continent. One from Ch’ijee’s Bluff in the Vuntut Gwitchin First Nation in northern Yukon, and another from Snowmass, Colorado.
“Bison used what is called the Bering Land Bridge — a vast connection of land between Asia and North America — to cross from Asia into North America. The land bridge forms during ice ages, when much of the water on the planet becomes part of growing continental glaciers, making the sea level much lower than it is today,” explained Shapiro. “After they arrived in Alaska, they spread quickly across the continent, taking advantage of the rich grassland resources that were part of the ice age ecosystem.”
While bison were not introduced by humans to North America, their rapid spread and diversification are hallmarks of an invasive species — and part of what make bison’s role in the Great Plains ecosystem so significant. “Bison arrived in North America and quickly came to dominate a grazing ecosystem that was previously reigned over by horses and mammoths for one million years,” said Shapiro.
Reference:
Peter D. Heintzman, Duane Froese, John W. Ives, André E. R. Soares, Grant D. Zazula, Brandon Letts, Thomas D. Andrews, Jonathan C. Driver, Elizabeth Hall, P. Gregory Hare, Christopher N. Jass, Glen MacKay, John R. Southon, Mathias Stiller, Robin Woywitka, Marc A. Suchard, Beth Shapiro. Bison phylogeography constrains dispersal and viability of the Ice Free Corridor in western Canada. Proceedings of the National Academy of Sciences, 2016; 113 (29): 8057 DOI: 10.1073/pnas.1601077113
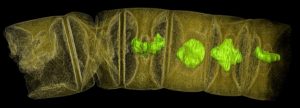
X-ray tomographic picture (false colors) of fossil thread-like red algae. Credit: Stefan Bengtson; CCAL
Scientists at the Swedish Museum of Natural History have found fossils of 1.6 billion-year-old probable red algae. The spectacular finds, publishing on 14 March in the open access journal PLOS Biology, indicate that advanced multicellular life evolved much earlier than previously thought.
The scientists found two kinds of fossils resembling red algae in uniquely well-preserved sedimentary rocks at Chitrakoot in central India. One type is thread-like, the other one consists of fleshy colonies. The scientists were able to see distinct inner cell structures and so-called cell fountains, the bundles of packed and splaying filaments that form the body of the fleshy forms and are characteristic of red algae.
“You cannot be a hundred per cent sure about material this ancient, as there is no DNA remaining, but the characters agree quite well with the morphology and structure of red algae,” says Stefan Bengtson, Professor emeritus of palaeozoology at the Swedish Museum of Natural History.
The earliest traces of life on Earth are at least 3.5 billion years old. These single-celled organisms, unlike eukaryotes, lack nuclei and other organelles. Large multicellular eukaryotic organisms became common much later, about 600 million years ago, near the transition to the Phanerozoic Era, the “time of visible life.”
Discoveries of early multicellular eukaryotes have been sporadic and difficult to interpret, challenging scientists trying to reconstruct and date the tree of life. The oldest known red algae before the present discovery are 1.2 billion years old. The Indian fossils, 400 million years older and by far the oldest plant-like fossils ever found, suggest that the early branches of the tree of life need to be recalibrated.
“The ‘time of visible life’ seems to have begun much earlier than we thought,” says Stefan Bengtson.
The presumed red algae lie embedded in fossil mats of cyanobacteria, called stromatolites, in 1.6 billion-year-old Indian phosphorite. The thread-like forms were discovered first, and when the then doctoral student Therese Sallstedt investigated the stromatolites she found the more complex, fleshy structures.
“I got so excited I had to walk three times around the building before I went to my supervisor to tell him what I had seen!” she says.
The research group was able to look inside the algae with the help of synchrotron-based X-ray tomographic microscopy. Among other things, they have seen regularly recurring platelets in each cell, which they believe are parts of chloroplasts, the organelles within plant cells where photosynthesis takes place. They have also seen distinct and regular structures at the centre of each cell wall, typical of red algae.
Reference:
Stefan Bengtson, Therese Sallstedt, Veneta Belivanova, Martin Whitehouse. Three-dimensional preservation of cellular and subcellular structures suggests 1.6 billion-year-old crown-group red algae. PLOS Biology, 2017; 15 (3): e2000735 DOI: 10.1371/journal.pbio.2000735
Note: The above post is reprinted from materials provided by PLOS.
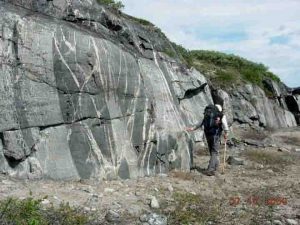
Photograph of the ancient crust such as these found along the eastern shores of the Hudson Bay. Credit: Photo by Rick Carlson
Rock samples from northeastern Canada retain chemical signals that help explain what Earth’s crust was like more than 4 billion years ago, reveals new work from Carnegie’s Richard Carlson and Jonathan O’Neil of the University of Ottawa. Their work is published by Science.
There is much about Earth’s ancient crust that scientists don’t understand. This is because most of the planet’s original crust simply isn’t around any longer to be studied directly — it has either sunk back into the planet’s interior due to the action of plate tectonics or been transformed by geological activity at Earth’s surface to make new, younger rocks.
“Finding remnants of this ancient crust has proven difficult, but a new approach offers the ability to detect the presence of truly ancient crust that has been reworked into ‘merely’ really old rocks,” Carlson said.
The approach employed in this study examined variations in the abundance of an isotope of the element neodymium, which is created by the radioactive decay of a different element, samarium.
Isotopes are versions of an element that have the same number of protons, but different numbers of neutrons, causing each isotope to have a different mass. The isotope of samarium with a mass of 146 is unstable and decays to the isotope of neodymium with a mass of mass 142. (If you’re interested in knowing how, it does this by emitting what’s called an alpha particle — composed of two neutrons and two protons — from its nucleus.)
Samarium-146 is a radioactive isotope that has a half-life of only 103 million years. That may sound like a long time, but in geological terms it is really quite short. While samarium-146 was present when Earth formed, it became extinct very early in Earth’s history. We know of its existence from the study of very ancient rocks, especially meteorites and samples from Mars and the Moon.
Variations in the relative abundance of neodymium-142 compared to other isotopes of neodymium that didn’t originate from decaying samarium reflect chemical processes that changed the ratio of samarium to neodymium in the rock while samarium-146 was still present — basically before about 4 billion years ago.
Carlson and O’Neil studied 2.7 billion-year-old granitic rocks that make up a good portion of the eastern shore of Hudson Bay. The abundances of neodymium-142 in these granites indicates that they were derived from the re-melting of much older rocks — rocks that were more than 4.2 billion years old — and that these ancient rocks were compositionally similar to the abundant magnesium-rich rock type known as basalt, which makes up all of the present day oceanic crust as well as large volcanoes such as Hawaii and Iceland.
In more-recent times in Earth’s history, basaltic oceanic crust survives at Earth’s surface for less than 200 million years before it sinks back into Earth’s interior due to the action of plate tectonics. The results presented in this paper, however, suggest that basaltic crust, which may have formed not long after Earth’s formation, survived at Earth’s surface for at least 1.5 billion years before later being re-melted into rocks that form a good portion of the northernmost Superior craton, a geological formation that extends roughly from the Hudson Bay in Quebec to Lake Huron in Ontario.
“Whether this result implies that plate tectonics was not at work during the earliest part of Earth history can now be investigated using our tool of studying neodymium-142 variation to track the role of truly ancient crust in building up younger, but still old, sections of Earth’s continental crust,” Carlson explained.
Their findings thus have important implications about the Earth’s earliest crust and the processes that started the formation of Earth’s continental crust.
Reference:
Jonathan O’Neil, Richard W. Carlson. Building Archean cratons from Hadean mafic crust. Science, 2017 DOI: 10.1126/science.aah3823
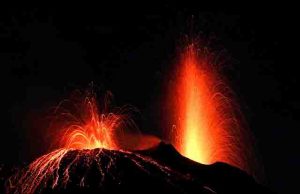
Scientists think that greenhouse gasses released by massive volcanic eruptions caused climate change that led to the end-Permian extinction. Credit: Victor/Flickr
Researchers studying marine fossil beds in Italy have found that the world’s worst mass extinction was followed by two other extinction events, a conclusion that could explain why it took ecosystems around the globe millions of years to recover.
The extinction events are linked to climate change caused by massive volcanic activity, according to the study published in the journal PLOS ONE on March 15. Lead author William Foster, a postdoctoral researcher in the Jackson School of Geosciences at The University of Texas at Austin, said that this study is a step toward understanding how lifeforms survived during the extinctions, which could help scientists understand how modern ocean life evolved and how it might respond to climate change in the future.
“The early evolution of modern marine ecosystems happened during the recovery period of these extinction events,” Foster said. “Looking at how they responded back then gives us an idea of how they’ll respond to similar factors in the future.”
Earth has experienced five mass extinctions in its history that killed the majority of species living on the planet at the time. The end-Permian extinction or “Great Dying” that occurred about 252 million years ago was the worst, with an estimated 95 percent of marine life and 70 percent of terrestrial life perishing.
The extinction is linked to climate change caused by prolonged volcanic eruptions in Russia’s Siberian Traps. The eruptions covered an area larger than Alaska with lava and released massive amounts of greenhouse gasses into the atmosphere, which had dire consequences for life across the planet.
“This release of carbon dioxide and sulfur started this whole climate warming scenario that caused the extinction,” Foster said.
The end-Permian extinction also had the longest recovery time of any mass extinction, lasting 5 million to 8 million years.
“We had to investigate hundreds of meters of rock before you could see the recovery millions of years later,” Foster said.
In their research paper, Foster and his colleagues provide the first combined fossil and geochemical evidence for two distinct extinction events following the end-Permian that probably played a role in the slow recovery. The evidence comes from rock samples with spikes of carbon 12 relative to carbon 13, a chemical ratio associated with large disruptions in the carbon cycle that were probably caused by the volcanic eruptions.
A carbon 12 spike occurred in samples from the Dienerian, a period about half a million years after the end-Permian extinction that was previously recognized from fossil evidence as an extinction event. A second carbon 12 spike was found at the boundary of the Smithian/Spathian periods, which occur about 1.5 million years after the end-Permian extinction. At both sites Foster and colleagues also noted a decreased diversity of marine fossils compared with surrounding periods, with the dominant survivors of the extinction events being mollusks, such as snails and clams, only a few centimeters in size at most.
After the second extinction event, the fossil record shows an increased ecological diversity. This is a sign, researchers said, that the environmental stresses that limited recovery from the first extinction event and instigated the second were beginning to lessen.
Studying how sea life responded to climate change in the past can help prepare for the potential effects of ongoing and future climate change, said Foster. He pointed out that the changes in ocean conditions that caused the end-Permian mass extinction – ocean acidification, ocean deoxygenation and increasing temperatures – are issues occurring today, though not at the extreme levels recorded in the late stages of the end-Permian extinction.
Reference:
Foster WJ, Danise S, Price GD, Twitchett RJ (2017) Subsequent biotic crises delayed marine recovery following the late Permian mass extinction event in northern Italy. PLoS ONE 12(3): e0172321. DOI: 10.1371/journal.pone.0172321
Algal population split into two equally sized groups when exposed to turbulence. Downward swimming cells become egg-shaped, while those swimming upwards are pear-shaped. This change of shape involves a difference of just one micrometre. Credit: Copyright ETH Zürich
Microscopic marine plankton are not helplessly adrift in the ocean. They can perceive cues that indicate turbulence, rapidly respond to regulate their behaviour and actively adapt. ETH researchers have demonstrated for the first time how they do this .
Plankton in the ocean are constantly on the move. By day, these tiny organisms, one-tenth the diameter of a human hair, actively migrate towards the sunlit ocean surface to carry out photosynthesis. At night, they make their way to depths of tens of metres, where the supply of nutrients is greater.
During their regular trips between well-lit and nutrient-rich zones, plankton cells frequently encounter turbulent layers, which disrupt this essential migratory pattern. It is still a mystery how these minute organisms can navigate through the dangers of turbulent waters. Plankton cells are whirled around by turbulence — particularly by the smallest, millimetre-sized flow vortices — as if they were in a miniature washing machine, which can induce permanent damage to their propulsion appendages and cell envelope. In the worst case, they can perish in turbulence.
Migratory behaviour observed in micro-chambers
Certain microalgae have, however, developed a sophisticated response to such turbulent cues. Post-doctoral researchers Anupam Sengupta and Francesco Carrara, together with their advisor Roman Stocker, Professor at the ETH Zurich Institute of Environmental Engineering, have shown this in a study recently published in the journal Nature.
Using laboratory experiments, the three scientists “brought the ocean into the lab” and examined the migratory behaviour of Heterosigma akashiwo, an alga known for forming toxic algal blooms. To examine swimming behaviour, the researchers used a microfabricated chamber, just a few cubic millimetres in volume, in which they introduced the Heterosigma cells. The chamber could be rotated along its axis using a computer-controlled motor, exposing cells to periodic flips in orientation replicating how tiny turbulent vortices flip the cells upside down in the ocean.
Diving with foresight
The scientists were able to observe that an algal population moving upwards split into two equally sized groups over a period of 30 minutes after the chamber was repeatedly flipped by 180 degrees. One group of cells continued to strive upwards, whereas the other group switched behaviour and began to swim in the opposite direction. This population split did not occur with algae in stationary chambers, in which all swam continuously upwards and accumulated near the top surface.
By zooming into single cells, the researchers discovered the reason for the change in swimming behaviour. When exposed to the turbulence-like cues, the cells were able to actively and rapidly change their shape: from asymmetric pear-shaped cells swimming upwards, the cells morphed into egg-shaped structures swimming downwards. Strikingly, this shift involved changes of less than a micrometre. “It is spectacular that a cell barely 10 micrometres in size can adapt its shape to change its swimming direction,” says the study’s co-author Francesco Carrara.
Perfect adaptation
Roman Stocker does not view this mechanism as just a coincidence. “The algae have adapted perfectly to their ocean habitat: they can actively swim, they perceive a range of different environmental signals, including turbulence, and they rapidly adapt and regulate their behaviour accordingly.” Anupam Sengupta adds: “We now better understand how these microorganisms confront potentially detrimental situations, however, at the moment we can only speculate as to why the cells do this.”
The researchers argue that splitting into two groups creates an evolutionary advantage for the population: in this manner, the entire population is not lost when it encounters a layer of strong turbulence, but in the worst case, only half. In avoiding the turbulence by diving, the downward-swimming cells suffer the short-term cost of receiving too little light to carry out photosynthesis, meaning that they cannot grow. The researchers also found evidence that the flipping by turbulence has a physiological impact on the algae. Cells that were flipped in their experiment exhibited higher levels of stress than those in the stationary chambers.
Climate change influences turbulence
The researchers now plan to observe the algae in a larger tank, where they will expose the cells not only to flipping but also to real turbulence. Understanding how these minute cells respond to turbulence holds great importance for our understanding of the ocean. “As we now know that global climate change will modify the turbulence landscape in the ocean, it is particularly important to understand how the organisms that are the foundation of the marine food web respond to it. This work contributes a piece of the puzzle, by demonstrating that phytoplankton are not just at the mercy of turbulence, but can actively cope with it,” says the ETH professor.
Reference:
Anupam Sengupta, Francesco Carrara, Roman Stocker. Phytoplankton can actively diversify their migration strategy in response to turbulent cues. Nature, 2017; DOI: 10.1038/nature21415