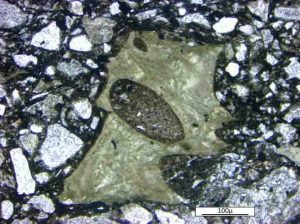
This is a photomicrograph of a vesicular green shard from the Onaping Formation of the Sudbury impact basin. Credit: Paul Guyett, Trinity College Dublin
Meteorite impacts can produce more than craters on Earth — they can also spark volcanic activity that shapes its surface and climate by bringing up material from depth. That is the headline finding of an international team, led by geochemists from Trinity College Dublin, who discovered that large impacts can be followed by intense, long-lived, and explosive volcanic eruptions.
The team studied rocks filling one of the largest preserved impact structures on the planet, located in Sudbury (Ontario, Canada). The ‘bolide’ hit Earth here 1.85 billion years ago and excavated a deep basin, which was filled with melted target rocks and, later, with jumbled mixed rocks full of tiny volcanic fragments.
Not only are there volcanic fragments throughout the sequence of the 1.5 km-thick basin but they have a very distinctive angular shape, which the scientists explain resembles a ‘crab claw’. Such shapes form when gas bubbles expand in molten rock that then catastrophically explodes — a feature of violent eruptions involving water, and which can be seen under glaciers in Iceland, for example. In the crater, these took place for a long period of time after the impact, when the basin was flooded with sea water.
The key finding of the research, just published in the Journal of Geophysical Research: Planets, is that the composition of the volcanic fragments changed with time. Right after the impact, volcanism is directly related to melting of Earth’s crust. However, with time, volcanism seems to have been fed by magma coming from deeper levels within Earth.
Professor of Geology and Mineralogy at Trinity, Balz Kamber, said: “This is an important finding, because it means that the magma sourcing the volcanoes was changing with time. The reason for the excitement is that the effect of large impacts on the early Earth could be more serious than previously considered.”
On the early Earth there was a relatively brief period during which ca. 150 very large impacts occurred, whereas since then, only a handful have hit Earth.
Professor Kamber added: “The intense bombardment of the early Earth had destructive effects on the planet’s surface but it may also have brought up material from the planet’s interior, which shaped the overall structure of the planet.”
The findings raise interest in topical research on similar volcanism on other planetary bodies like Mercury, Venus, Mars and the Moon. There, unlike on Earth, the lack of plate tectonics and erosion help preserve surface features, which are probed by space craft.
The insight from Sudbury is complemental, the geologists say, because you can directly observe the rocks with your own eyes and collect loads of samples for detailed study in the lab.
Reference:
Teresa Ubide, Paul C. Guyett, Gavin G. Kenny, Edel M. O’Sullivan, Doreen E. Ames, Joseph A. Petrus, Nancy Riggs, Balz S. Kamber. Protracted volcanism after large impacts: Evidence from the Sudbury impact basin. Journal of Geophysical Research: Planets, 2017; DOI: 10.1002/2016JE005085
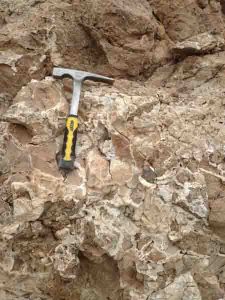
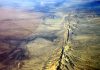
The white calcite ‘veins’ of the Loma Blanca fault are evident in this slab of rock on the fault. These veins of calcite reveal a record of fluid-driven earthquakes clustered together on a fault typically characterized by less frequent, periodic earthquakes caused by mechanical stress. They helped UW-Madison researchers trace the oldest and longest earthquake record ever documented. Credit: Courtesy of Laurel Goodwin and Randy Williams, UW-Madison
Using radioactive elements trapped in crystallized, cream-colored “veins” in New Mexican rock, geologists have peered back in time more than 400,000 years to illuminate a record of earthquakes along the Loma Blanca fault in the Rio Grande rift.
It is the longest record of earthquakes ever documented on a fault, showing 13 distinct seismic events — nine of which occurred at regular intervals averaging 40,000-to-50,000 years and four that clustered together just five-to-11,000 years apart.
The work, described in a study published last week in the Proceedings of the National Academy of Sciences, was led by University of Wisconsin-Madison postdoctoral researcher Randy Williams and his advisor, Laurel Goodwin, a professor in the UW-Madison geoscience department.
“We weren’t expecting any of this,” Goodwin says. “It’s been quite the odyssey for us.”
The researchers initially set out to better understand the background, or default, earthquake activity along the 14-mile-long Loma Blanca fault, south of Albuquerque. An intraplate fault like this generally produces earthquakes much less frequently than those at the boundaries of tectonic plates, like California’s San Andreas Fault, and tends to be less well understood by geologists. However, some intraplate faults have experienced increased seismicity in recent years, likely due to deep injection wells used for wastewater disposal.
In places like Texas, Oklahoma and Ohio, Williams explains, earthquake activity has been linked to high-pressure wastewater injected far beneath Earth’s surface. In part to better understand these human-driven events, the researchers wanted to get a handle on what mechanical factors control natural earthquakes and how often a given fault slips to cause one.
“We can’t predict an exact date for when they will occur, and it’s unlikely that we ever will,” Goodwin explains, “but we want to understand what is driving them so we can better prepare.”
To look for answers, Williams began to examine “veins” made of the mineral calcite that streak segments of rock along the fault. Calcite precipitates out of pressurized fluids that travel through rock near faults during some earthquakes and gets deposited in layers, like rings of a tree. During subsequent earthquakes, the calcite fractures and heals, leaving a distinct signature like old broken bones.
Williams looked at the radioactive elements uranium and thorium trapped in these calcite crystals, using them as a kind of clock based on the rate at which uranium decays into thorium. He and the rest of the research team, which includes Warren Sharp from the Berkeley Geochronology Center and Peter Mozley of the New Mexico Institute of Mining and Technology, could measure the age of each “generation” of calcite found in the veins and determine when earthquakes occurred relative to one another. The magnitude of these earthquakes at Loma Blanca has been estimated to be between 6.2 and 6.9, by analogy with more recent events.
The team showed that earthquakes on the fault were controlled by two different processes. Earthquakes that occurred at regular intervals were the result of accumulated stress that eventually caused the fault to fail every 40,000 years or so but were not driven by fluids. However, the unusual cluster of earthquakes that occurred roughly 430,000 years ago was the result of an increase in fluid pressure deep beneath the surface. Increases in fluid pressure in Earth can decrease the friction between the two sides of a fault, leading to easier sliding — like the pressurized air on an air hockey table.
The team also showed that calcite associated with two seismic events in the earthquake cluster indicates very rapid carbon dioxide degassing, which can occur when fluid under high pressure is released — like opening the top of a shaken bottle of soda.
“When pore pressure increases far enough over the background level, the fault fails and cracks form, releasing fluid from the basin,” Goodwin explains. Williams says that injected wastewater is likely to increase pressure at a faster rate than most faults have experienced in the geologic past.
The findings also help contribute to a longstanding question in geology regarding the mechanics of earthquakes in intraplate faults and whether they occur periodically or randomly in time.
Today, Williams is working to improve the methods the team used. “We want to understand how the calcite-dating method can be used to contribute to documenting the seismic record of other faults,” he says.
Reference:
Randolph T. Williams, Laurel B. Goodwin, Warren D. Sharp, Peter S. Mozley. Reading a 400,000-year record of earthquake frequency for an intraplate fault. Proceedings of the National Academy of Sciences, 2017; 201617945 DOI: 10.1073/pnas.1617945114
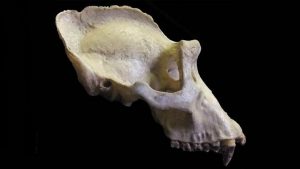
This is the sagittal crest of a male gorilla skull. Credit: ANU
A new study from The Australian National University (ANU) of the bony head-crests of male gorillas could provide some of the first clues about the social structures of our extinct human relatives, including how they chose their sexual partners.
The study looks at the sagittal crest, a bone ridge on the top of the skull, in four species of apes.
Lead researcher of the study Dr Katharine Balolia of the ANU School of Archaeology and Anthropology said that while the crests were long thought to develop in apes to provide extra space for the muscles used for chewing, this study indicates they could also be a form of social signalling that results from sexual selection.
“We found that for male gorillas and orangutans, it is not just chewing that drives crest formation. There is also a social element to it. For example, females prefer male gorillas with larger sagittal crests,” Dr Balolia said.
Dr Balolia said the findings may provide clues to the social structures of some extinct human relatives.
“Some species of extinct human relatives have a sagittal crest,” she said.
“And if sagittal crest size and social behaviour are linked in this way, then we could potentially establish that some of our extinct human relatives had a gorilla-like social system.
“This would be a first, because otherwise the human fossil record provides precious little about how our extinct relatives chose their mates.”
The study used 3D scans of skull specimens and found two lines of evidence to support the finding.
“In terms of gorilla social structures, the males establish dominance shortly after their wisdom teeth emerge. We found the sagittal crest appears right after their wisdom teeth emerge, so that fits in with the timing of social dominance,” she said.
“In contrast, in orangutans some males only become dominant quite late in their adult life, and the sagittal crest appears later,” she said.
In addition, statistical modelling suggests that, when present, crests in gorillas and orangutans are larger than what would be expected if they were simply there to provide more space for the larger chewing muscles needed by the big males.
Reference:
Katharine L. Balolia, Christophe Soligo, Bernard Wood. Sagittal crest formation in great apes and gibbons. Journal of Anatomy, 2017; DOI: 10.1111/joa.12609
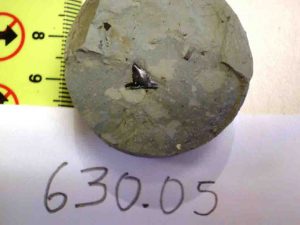
Carcharhiniformes indet. tooth from the Saltarin core, Carbonera C2 Formation, early Miocene flooding. Credit: Jorge Carrillo
A tiny shark tooth, part of a mantis shrimp and other microscopic marine organisms reveal that as the Andes rose, the Eastern Amazon sank twice, each time for less than a million years. Water from the Caribbean flooded the region from Venezuela to northwestern Brazil. These new findings by Smithsonian scientists and colleagues, published this week in Science Advances, fuel an ongoing controversy regarding the geologic history of the region.
“Pollen records from oil wells in eastern Colombia and outcrops in northwestern brazil clearly shows two short-lived events in which ocean water from the Caribbean flooded what is now the northwest part of the Amazon basin,” said Carlos Jaramillo, staff scientist at the Smithsonian Tropical Research Institute and lead author of the study.
“Geologists disagree about the origins of the sediments in this area, but we provide clear evidence that they are of marine origin, and that the flooding events were fairly brief,” Jaramillo said. His team dated the two flooding events to between 17 to18 million years ago and between 16 to 12 million years ago.
Several controversial interpretations of the history of the region include the existence of a large, shallow sea covering the Amazon for millions of years, a freshwater megalake, shifting lowland rivers occasionally flooded by seawater, frequent seawater incusions, and a long-lived “para-marine metalake,” which has no modern analog.
Jaramillo assembled a diverse team from the Smithsonian and the University of Illinois at Urbana-Champaign; Corporacion Geologica Ares; the University of Birmingham; the University of Ghent; the Universidad del Norte, Baranquilla, Colombia; the University of Alberta, Edmonton; the University of Zurich; Ecopetrol, S.A.; Hocol, S.A.; the Royal Netherlands Institute for Sea Research at Utrecht University; the University of Texas of the Permian Basin; and the Naturalis Biodiversity Center.
Together, they examined evidence including more than 50,000 individual pollen grains representing more than 900 pollen types from oil drilling cores from the Saltarin region of Colombia and found two distinct layers of marine pollen separated by layers of non-marine pollen types. They also found several fossils of marine organisms in the lower layer: a shark tooth and a mantis shrimp.
“It’s important to understand changes across the vast Amazonian landscape that had a profound effect, both on the evolution and distribution of life there and on the modern and ancient climates of the continent,” Jaramillo said.
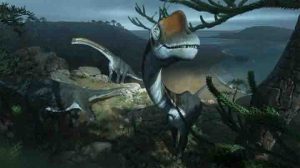
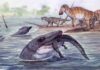
This Vouivria herd are roaming the coast of what is now Europe. Millions of years ago Europe was a chain of islands and, being a herbivore, Vouivria damparisensis would have grazed on the vegetation in its local vicinity. Credit: Imperial College London/ Chase Stone
Scientists have re-examined an overlooked museum fossil and discovered that it is the earliest known member of the titanosauriform family of dinosaurs.
The fossil, which the researchers from Imperial College London and their colleagues in Europe have named Vouivria damparisensis, has been identified as a brachiosaurid sauropod dinosaur.
The researchers suggest the age of Vouivria is around 160 million years old, making it the earliest known fossil from the titanosauriform family of dinosaurs, which includes better-known dinosaurs such as the Brachiosaurus. When the fossil was first discovered in France in the 1930s, its species was not identified, and until now it has largely been ignored in scientific literature.
The new analysis of the fossil indicates that Vouivria died at an early age, weighed around 15,000 kilograms and was over 15 metres long, which is roughly 1.5 times the size of a double-decker bus in the UK.
It had a long neck held at around a 45 degree angle, a long tail, and four legs of equal length. It would have been a plant eater.
Dr Philip Mannion, the lead author of the study from the Department of Earth Science and Engineering at Imperial College London, said: “Vouivria would have been a herbivore, eating all kinds of vegetation, such as ferns and conifers. This creature lived in the Late Jurassic, around 160 million years ago, at a time when Europe was a series of islands. We don’t know what this creature died from, but millions of years later it is providing important evidence to help us understand in more detail the evolution of brachiosaurid sauropods and a much bigger group of dinosaurs that they belonged to, called titanosauriforms.”
Titanosauriforms were a diverse group of sauropod dinosaurs and some of the largest creatures to have ever lived on land. They lived from at least the Late Jurassic, right to the end-Cretaceous mass extinction, when an asteroid wiped out most life on Earth.
A lack of fossil records means that it has been difficult for scientists to understand the early evolution of titanosauriforms and how they spread out across the planet. The re-classification of Vouivria as an early titanosauriform will help scientists to understand the spread of these creatures during the Early Cretaceous period, a later period of time, after the Jurassic, around 145 — 100 million years ago.
The team’s incorporation of Vouivria into a revised analysis of sauropod evolutionary relationships shows that by the Early Cretaceous period, brachiosaurids were restricted to what is now Africa and the USA, and were probably extinct in Europe.
Previously, scientists had suggested the presence of another brachiosaurid sauropod dinosaur called Padillasaurus much further afield in what is now South America, in the Early Cretaceous. However, the team’s incorporation of Vouivria into the fossil timeline suggests that Padillasaurus was not a brachiosaurid, and that this group did not spread as far as South America.
The Vouivria fossil was originally discovered by palaeontologists in the village of Damparis, in the Jura Department of eastern France, in 1934. Ever since, it has been stored in the Museum National d’Histoire Naturelle, Paris. It was only briefly mentioned by scientists in studies in the 1930s and 1940s, but it was never recognised as a distinct species. It has largely been ignored in the literature, where it has often been referred to simply as the Damparis dinosaur.
Now, a deeper analysis of the fossil is also helping the scientists in today’s study to understand the environment Vouivria would have been in when it died, which was debated when it was initially found. The researchers believe Vouivria died in a coastal lagoon environment, during a brief sea level decline in Europe, before being buried when sea levels increased once more. When the fossil was first discovered, in rocks that would have originally come from a coastal environment, researchers suggested that its carcass had been washed out to sea, because sauropods were animals that lived on land.
Today’s team’s examination of Vouivria, coupled with an analysis of the rocks it was encased in, provides strong evidence that this was not the case.
The genus name of Vouivria is derived from the old French word ‘vouivre’, itself from the Latin ‘vipera’, meaning ‘viper’. In French-Comte, the region in which the specimen was originally discovered, ‘la vouivre’ is a legendary winged reptile. The species name damparisensis refers to the village Damparis, from which the fossil was originally found.
The research was carried out in conjunction with the Museum National d’Histoire Naturelle and the CNRS/Université Paris 1 Panthéon-Sorbonne, with funding from the European Union’s Synthesys programme.
Currently, titanosauriforms from the Late Cretaceous are poorly understood compared to their relatives in the Late Jurassic. So, the next step for the researchers will see them expanding on their analysis of the evolutionary relationships of all species in the titanosauriform group. The team are also aiming to find more sauropod remains from older rocks to determine in more detail how they spread across the continents.
Reference:
Philip D. Mannion, Ronan Allain, Olivier Moine. The earliest known titanosauriform sauropod dinosaur and the evolution of Brachiosauridae. PeerJ, 2017; 5: e3217 DOI: 10.7717/peerj.3217
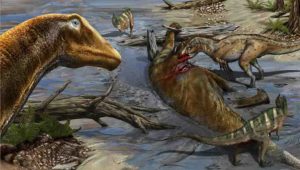
This is a Galeamopus pabsti in its environment in the Late Jurassic of North America. An Allosaurus and two Ceratosaurus are feeding on a carcass of Galeamopus pabsti. Credit: Davide Bonadonna
Researchers from Italy and Portugal describe yet another new sauropod species from 150 million years ago, from Wyoming, USA.
The new species, Galeamopus pabsti, is the most recent dinosaur to be described by paleontologists from the Department of Earth Sciences of the University of Turin, Italy; the Faculty of Science and Technology, Universidade Nova de Lisboa, and the Museum of Lourinhã in Portugal. This Jurassic dinosaur was originally excavated in 1995 by a Swiss team, led by Hans-Jakob “Kirby” Siber and Ben Pabst, in Wyoming, in the United States and is the latest in a series of new discoveries by the paleontologists Emanuel Tschopp and Octávio Mateus, which started in 2012 with Kaatedocus siberi. The paper describing the new species was published online in the open access scientific journal PeerJ on Tuesday, May 2.
Galeamopus pabsti is similar to the famous dinosaur Diplodocus, but with more massive legs, and a particularly high and triangular neck close to the head. It is the second species of the genus Galeamopus to be shown to be different to Diplodocus by the same researchers (the first being published in 2015, in a paper which also reinstated the brontosaurus as a distinct genus). The new species is dedicated to Ben Pabst, who found the skeleton, and prepared it for mounting at the Sauriermuseum Aathal in Switzerland, where it is one of the main attractions of the permanent exhibit.
Diplodocid sauropods are among the most iconic dinosaurs. With their greatly elongated necks and tails, they represent the typical body shape of sauropods. Species of this group occur also in Africa, South America, and Europe, but the highest diversity is known from the USA: more than 15 species of these gigantic animals are known from there, also including the famous Brontosaurus. Researchers are still baffled by this high diversity of giants, and are continuing their studies to understand how such a diversity could be maintained by the ecosystem in which they lived.
Reference:
Emanuel Tschopp, Octávio Mateus. Osteology of Galeamopus pabsti sp. nov. (Sauropoda: Diplodocidae), with implications for neurocentral closure timing, and the cervico-dorsal transition in diplodocids. PeerJ, 2017; 5: e3179 DOI: 10.7717/peerj.3179
Note: The above post is reprinted from materials provided by PeerJ.
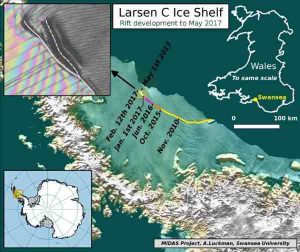
The current location of the rift on Larsen C, as of May 1 2017. Labels highlight significant jumps. Tip positions are derived from Landsat (USGS) and Sentinel-1 InSAR (ESA) data. Background image blends BEDMAP2 Elevation (BAS) with MODIS MOA2009 Image mosaic (NSIDC). Other data from SCAR ADD and OSM.
The rift in the Larsen C ice shelf in Antarctica now has a second branch, which is moving in the direction of the ice front, Swansea University researchers revealed after studying the latest satellite data.
The main rift in Larsen C, which is likely to lead to one of the largest icebergs ever recorded, is currently 180 km long. The new branch of the rift is 15 km long.
Last year, researchers from the UK’s Project Midas, led by Swansea University, reported that the rift was growing fast. Now, just 20km of ice is keeping the 5,000 sq km piece from floating away.
Professor Adrian Luckman of Swansea University College of Science, head of Project Midas, described the latest findings, “While the previous rift tip has not advanced, a new branch of the rift has been initiated. This is approximately 10km behind the previous tip, heading towards the ice-front.
This is the first significant change to the rift since February of this year. Although the rift length has been static for several months, it has been steadily widening, at rates in excess of a metre per day.
It is currently winter in Antarctica, therefore direct visual observations are rare and low resolution. Our observations of the rift are based on synthetic aperture radar (SAR) interferometry from ESA’s Sentinel-1 satellites. Satellite radar interferometry allows a very precise monitoring of the rift development.”
Researchers say the loss of a piece a quarter of the size of Wales will leave the whole shelf vulnerable to future break-up. Larsen C is approximately 350m thick and floats on the seas at the edge of West Antarctica, holding back the flow of glaciers that feed into it.
Professor Luckman said, “When it calves, the Larsen C Ice Shelf will lose more than 10% of its area to leave the ice front at its most retreated position ever recorded; this event will fundamentally change the landscape of the Antarctic Peninsula.
We have previously shown that the new configuration will be less stable than it was prior to the rift, and that Larsen C may eventually follow the example of its neighbour Larsen B, which disintegrated in 2002 following a similar rift-induced calving event.
Changes to the rate of wastewater injection in disposal wells may have contributed to conditions that led to last year’s Pawnee earthquake in Oklahoma, according to a new report published May 3 as part of a focus section in Seismological Research Letters.
The magnitude 5.8 Pawnee quake, felt widely across Oklahoma, is the largest earthquake recorded in the state since the 1950s. Most Oklahoma earthquakes since 2009 are thought to have been triggered by wastewater produced by oil and gas drilling that has been injected back into the ground. The Pawnee earthquake occurred in a region with active wastewater disposal wells, and is potentially the largest such induced earthquake to have occurred in Oklahoma so far, write University of Oklahoma seismologists Xiaowei Chen and Norimitsu Nakata in their preface to the section.
When Andrew Barbour of the U.S. Geological Survey and colleagues examined new injection data from nearby disposal wells in Osage County, they found a significant increase in injection rates in the years leading up to the Pawnee mainshock. Some wells injected wastewater at a constant rate, while others injected the water at a variable rate. The overall injected volume was roughly the same between these two types of wells.
Barbour and colleagues’ models of injection indicate, however, that it may have been the variable-rate wells that were most important for the Pawnee event. Their findings suggest that “long-term injection may have been responsible for a gradual loading of the fault to the point where it primed the fault for failure triggered by the short-term high-rate injection…” the authors write. They note that in the absence of these variable rate injections, however, the fault may have still failed at a much later time.
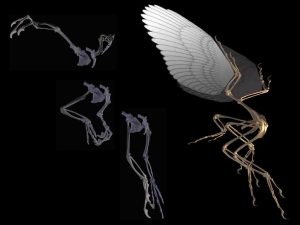
The Archaeopteryx is digitized to help paleontologists and students study how it evolved without having to travel to a museum. Credit: Ryan Carney
A key piece of evidence proving how dinosaurs evolved into modern-day birds could soon be studied across the world.
University of South Florida biology professor Ryan Carney, PhD, MPH, MBA, has created interactive holograms of dinosaurs, including the Archaeopteryx, which is believed to be the missing link in understanding the origin of birds and flight. Only 12 fossils have been discovered, all in Germany.
Dr. Carney digitizes these fossils using X-ray, lasers and photogrammetry, then brings them “back to life” with computer animation. Using virtual reality and augmented reality, paleontologists and students could interact with the dinosaurs in 3D, allowing them to better understand their anatomy and motion without having to travel to a museum.
These technologies are also integrated into Dr. Carney’s Digital Dinosaurs course at the University of South Florida’s Center for Virtualization & Applied Spatial Technologies (CVAST) and Integrative Biology Department. Students use the same techniques to visualize, animate, and 3D print specimens for research and educational purposes, helping foster enthusiasm for STEM fields.
His work is so groundbreaking, the National Geographic Society just named Dr. Carney to the 2017 class of “Emerging Explorers,” granting him $10,000 for research and exploration. This prestigious award recognizes those who are already making a difference and changing the world. He is the first faculty member at the University of South Florida to receive this honor.
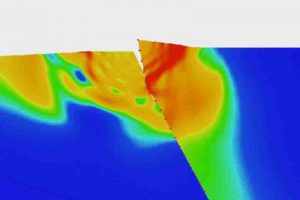
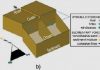
Illustration based on computer model shows how the hanging wall (right) of a thrust fault can twist away from the foot wall (left) during an earthquake. Credit: Harsha Bhat/ENS
It is a common trope in disaster movies: an earthquake strikes, causing the ground to rip open and swallow people and cars whole. The gaping earth might make for cinematic drama, but earthquake scientists have long held that it does not happen.
Except, it can, according to new experimental research from Caltech.
The work, appearing in the journal Nature on May 1, shows how the earth can split open — and then quickly close back up — during earthquakes along thrust faults.
Thrust faults have been the site of some of the world’s largest quakes, such as the 2011 Tohoku earthquake off the coast of Japan, which damaged the Fukushima nuclear power plant. They occur in weak areas of the earth’s crust where one slab of rock compresses against another, sliding up and over it during an earthquake.
A team of engineers and scientists from Caltech and École normale supérieure (ENS) in Paris have discovered that fast ruptures propagating up toward the earth’s surface along a thrust fault can cause one side of a fault to twist away from the other, opening up a gap of up to a few meters that then snaps shut.
Thrust fault earthquakes generally occur when two slabs of rock press against one another, and pressure overcomes the friction holding them in place. It has long been assumed that, at shallow depths the plates would just slide against one another for a short distance, without opening.
However, researchers investigating the Tohoku earthquake found that not only did the fault slip at shallow depths, it did so by up to 50 meters in some places. That huge motion, which occurred just offshore, triggered a tsunami that caused damage to facilities along the coast of Japan, including at the Fukushima Daiichi Nuclear Power Plant.
In the Nature paper, the team hypothesizes that the Tohoku earthquake rupture propagated up the fault and — once it neared the surface — caused one slab of rock to twist away from another, opening a gap and momentarily removing any friction between the two walls. This allowed the fault to slip 50 meters.
That opening of the fault was supposed to be impossible.
“This is actually built into most computer models of earthquakes right now. The models have been programed in a way that dictates that the walls of the fault cannot separate from one another,” says Ares Rosakis, Theodore von Kármán Professor of Aeronautics and Mechanical Engineering at Caltech and one of the senior authors of the Nature paper. “The findings demonstrate the value of experimentation and observation. Computer models can only be as realistic as their built-in assumptions allow them to be.”
The international team discovered the twisting phenomenon by simulating an earthquake in a Caltech facility that has been unofficially dubbed the “Seismological Wind Tunnel.” The facility started as a collaboration between Rosakis, an engineer studying how materials fail, and Hiroo Kanamori, a seismologist exploring the physics of earthquakes and a coauthor of the Nature study. “The Caltech research environment helped us a great deal to have close collaboration across different scientific disciplines,” Kanamori said. “We seismologists have benefited a great deal from collaboration with Professor Rosakis’s group, because it is often very difficult to perform experiments to test our ideas in seismology.”
At the facility, researchers use advanced high-speed optical diagnostics to study how earthquake ruptures occur. To simulate a thrust fault earthquake in the lab, the researchers first cut in half a transparent block of plastic that has mechanical properties similar to that of rock. They then put the broken pieces back together under pressure, simulating the tectonic load of a fault line. Next, they place a small nickel-chromium wire fuse at the location where they want the epicenter of the quake to be. When they set off the fuse, the friction at the fuse’s location is reduced, allowing a very fast rupture to propagate up the miniature fault. The material is photoelastic, meaning that it visually shows — through light interference as it travels in the clear material — the propagation of stress waves. The simulated quake is recorded using high-speed cameras and the resulting motion is captured by laser velocimeters (particle speed sensors).
“This is a great example of collaboration between seismologists, tectonisists and engineers. And not to put too fine a point on it, US/French collaboration,” says Harsha Bhat, coauthor of the paper and a research scientist at ENS. Bhat was previously a postdoctoral researcher at Caltech.
The team was surprised to see that, as the rupture hit the surface, the fault twisted open and then snapped shut. Subsequent computer simulations — with models that were modified to remove the artificial rules against the fault opening — confirmed what the team observed experimentally: one slab can twist violently away from the other. This can happen both on land and on underwater thrust faults, meaning that this mechanism has the potential to change our understanding of how tsunamis are generated.
Reference:
Vahe Gabuchian, Ares J. Rosakis, Harsha S. Bhat, Raúl Madariaga, Hiroo Kanamori. Experimental evidence that thrust earthquake ruptures might open faults. Nature, 2017; DOI: 10.1038/nature22045
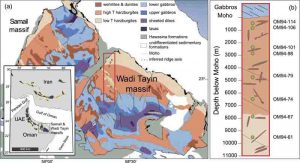
A geologic map of the Wadi Tayin massif, Samail ophiolite. Credit: Modified from Hanghøj et al. (2010), and Nicolas et al. (2001).
By examining the cooling rate of rocks that formed more than 10 miles beneath the Earth’s surface, scientists led by The University of Texas at Austin Jackson School of Geosciences have found that water probably penetrates deep into the crust and upper mantle at mid-ocean spreading zones, the places where new crust is made. The finding adds evidence to one side of a long-standing debate on how magma from the Earth’s mantle cools to form the lower layers of crust.
The research was led by Nick Dygert, a postdoctoral fellow in the Jackson School’s Department of Geological Sciences, and was published in May in the print edition of Earth and Planetary Science Letters in May. Collaborators include Peter Kelemen of Colombia University and Yan Liang of Brown University.
The Earth’s mantle is a semi-solid layer that separates the planet’s crust from the core. Dygert said that while it’s well known that magma upwelling from the mantle at mid-ocean spreading zones creates new crust, there are many questions on how the process works.
“There’s a debate in the scientific community how oceanic crust forms,” Dygert said. “And the different models have very different requirements for cooling regimes.”
To learn more about the conditions under which magma turns into crustal rock, Dygert and his collaborators examined rock samples that were part of the Earth’s mantle a hundred million years ago, but are now part of a canyon in Oman.
“One can effectively walk down 20 kilometers in the Earth’s interior,” said Kelemen. “This allows scientists to access rocks that formed far below the seafloor which are not available for study.”
The team used “geothermometers” — the name of a technique that uses mineral compositions inside rock samples to calculate temperatures and reveal the cooling history of the rock. Geothermometers help scientists determine the temperatures experienced by magmas and rocks as they cool, and infer how rapidly the cooling occurred. The study included use of a new geothermometer developed by Liang, which records the maximum temperature a rock attained before it cooled.
“Traditional geothermometers usually give you a cooling temperature rather than a formation temperature for the rock,” Dygert said. “This thermometer is a neat new tool because it allows us to look at a part of the cooling history that was inaccessible for igneous rocks previously.”
The temperatures recorded in the rocks show that the lower crust and uppermost mantle cooled and solidified almost instantly, Dygert said — like a “hot frying pan being plopped in a sink of water” — while the deeper mantle cooled more gradually. The temperature change is indicative of water circulating through the crust and uppermost mantle beneath mid-ocean spreading centers, and the heat from deeper portions of the mantle being dissipated through contact with the cooler upper rocks.
Currently, there are two primary theories for crust formation. In the Sheeted Sill hypothesis, circulating seawater cools many small magma deposits at different depths in the lower crust, which would simultaneously cool the upper mantle. In the Gabbro Glacier hypothesis, magma gradually loses heat as it flows away from a central magma chamber.
Dygert said that temperatures recorded by the geothermometers matched with the Sheeted Sill cooling process.
“The Sheeted Sill model requires a very efficient mechanism for cooling because crystallization is happening at all different depths within the crust at the same time,” Dygert said. “And what we were able to find strongly implies that hydrothermal circulation was very efficient throughout the crustal section.”
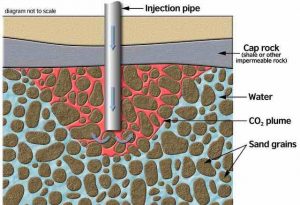
Uncovering how crust forms is at the heart of understanding the geological history of our planet, Dygert said, but the results could also have implications for our planet’s future. Some scientists have proposed mixing carbon dioxide (CO2) with water and injecting it into mantle rock as a means to fight climate change. The CO2 reacts with minerals in the mantle, which safely locks up the carbon up in their crystal structures. However, Dygert notes that mantle rock that has already been exposed to seawater may not react as readily with CO2, which would slow the carbon capture process. Dygert said that the new results suggest that circulation of water beneath mid-ocean ridges is effectively limited to the crustal section, and that enormous sections of the mantle could be available beneath the oceanic crust to efficiently trap CO2.
The research was supported by the Jackson School of Geosciences, the National Science Foundation, the Alfred P. Sloan Foundation, and an International Continental Drilling Program grant.
Reference:
Nick Dygert, Peter B. Kelemen, Yan Liang. Spatial variations in cooling rate in the mantle section of the Samail ophiolite in Oman: Implications for formation of lithosphere at mid-ocean ridges. Earth and Planetary Science Letters, 2017; 465: 134 DOI: 10.1016/j.epsl.2017.02.038
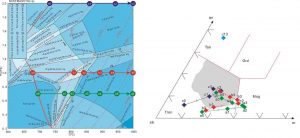
The left figure shows the P-T pseudosection calculated for the representative tonalitic sample (J13). The melt compositions simulated for three isobaric melting processes under high, medium and low pressure conditions are presented in the right (an-ab-or) diagram, the shadow showing the composition range of trondhjemites in the Eastern Hebei. Credit: Science China Press
The Earth’s continental crust was mainly formed in the Archean period, ~2.5 to 4.0 billion years ago, and is chiefly composed of tonalite, trondhjemite and granodiorite (TTG rocks). These three kinds of rock preserve pivotal information of the formation and evolution of early continental crust. Study on the petrogenesis of TTG rocks can elucidate the tectonic regimes of the early Earth. A recent study using a quantitative phase modeling approach to document the partial melting process of tonalitic gneiss presents an innovative viewpoint of petrogenesis of Archean trondhjemite in the Eastern Hebei, China.
An advanced method for studying the petrogenesis of granitoids involves conducting high-temperature and high-pressure experiments by selecting different bulk-rock compositions as starting materials and comparing the melt compositions with those of real rocks. Results from previous experimental studies suggest that the Archean TTG rocks were formed by partial melting of hydrous mafic rocks, and low melting degrees or melting under high-pressure conditions tends to produce trondhjemitic melt. Field observations in many Precambrian terrains shows that trondhjemite commonly occurs as small veins, intrusions and/or as leucosomes within tonalitic gneiss. This suggests that that trondhjemitic melt can be generated by partial melting of tonalitic rocks. Thus, a systematic study was undertaken to simulate the origin of trondhjemite.
Taking trondhjemitic rocks from the Eastern Hebei as an example, the authors present phase modeling for a representative tonalitic sample using a recent internally consistent thermodynamic data set, available activity models of minerals and melt and the THERMOCALC software. On the basis of the calculated P-T pseudosection, melt compositions were constrained under different P-T conditions, and compared with those of trondhjemitic rocks in the Eastern Hebei. The simulation results show that melts generated under 0.9~1.1GPa/800~850?C with melting degree of 5~10wt.% are comparable with trondhjemitic rocks from the Eastern Hebei in both major and trace element compositions. In addition, zircon U-Pb isotopic dating reveals that the formation age of trondhjemitic veins in the Eastern Hebei is consistent with the metamorphic age of the country tonalitic gneiss, further supporting the viewpoint that trondhjemitic rocks can be formed by the partial melting of tonalitic rocks.
Using a quantitative phase modeling approach, the researchers simulated partial melting of tonalite and have proposed a new view that trondhjemite can be a melting product of tonalite, and not simply produced by the partial melting of mafic rocks under high-pressure conditions. This will be significant for elucidating the Archean tectonic regime for the formation of TTG rocks. Moreover, this study provides a new and effective method for documenting of the genesis of granitoids.
Reference:
ShiWei Zhang et al, Petrogenetic simulation of the Archean trondhjemite from Eastern Hebei, China, Science China Earth Sciences (2017). DOI: 10.1007/s11430-016-9025-9
Note: The above post is reprinted from materials provided by Science China Press.
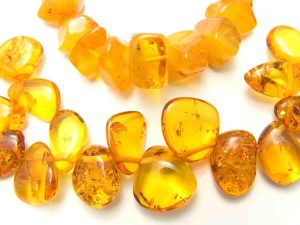
Yellow and brownish amber pieces are found around the world. They make up more than two-thirds of the amber found in the world. The original place it amber was found was in the Baltic Sea area, and this area is still the best market for amber both in quality and quantity. However, wherever old fossilized trees can be found, amber may be found as well.
Black Amber
Black amber accounts for about fifteen percent of the amber found. However, it is not actually pure fossilized tree resin. It has been mixed with the remains of the tree from which it came or other plant matter. That does not make it any less appetizing.
When the specimen is made up entirely of carbonized coal, so there is little difference between jet and black amber. Consequently jet is sometimes called black amber and visa versa. When black amber is held up to the light, it will usually be another color.
The back-light shines through the amber and a different color will show. This color is usually a dark red, blue, or brown. It is criticized that the black amber is not truly black because of this property and some people deny that black amber even exists.
The cost of black amber is slightly more expensive than the common amber, but there is also not much of a demand for it.
Green Amber
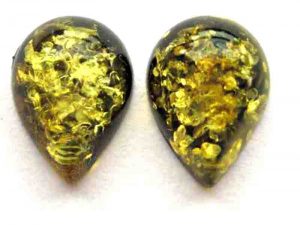
Green amber is very popular. It only accounts for about two percent of the amber, but there is plenty of it found in the to supply the world. The Dominican Republic is known for the best specimens of green amber.
The cost goes up as the shade of green, or any other color, deepens in the rock. Lighter amber, or yellow-green amber is less expensive. Green amber can also be treated by heating it and it will become even more beautiful as it becomes more transparent.
White Amber
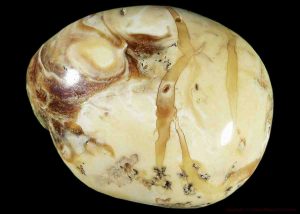
White amber is especially rare (about 1-2%). It is also called “bony” or “royal white” for its unique texture. White amber is praised for the decorative swirls in butterscotch, grey, green, honey or blue hues which create one-of-a kind decorative effects. White amber is never treated as it is praised for its natural beauty.
Red Amber
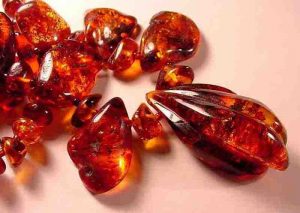
The second most rare amber is red amber. Only about one in every two hundred amber specimens are red. The color is very authentic and can be very deep. This amber is very expensive per gram.
Blue Amber
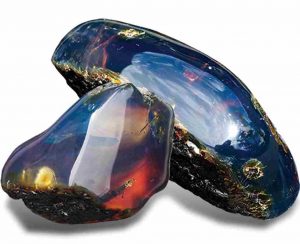
Blue amber is the rarest of all the colors of amber. However, blue amber is fairly new to the gem industry. It must be caught in the right light, or it will look like every other piece of yellow-brown amber.
A fascinating property of blue amber is the color that it will change when a fluorescent light is shown on it. It will be a dazzling bright blue because the fluorescents inside it will react to the light.
However, the same rock will look yellow or brownish when a white light source, such as the natural sunlight, shines from behind it. Blue amber is almost completely found in the Dominican Republic.
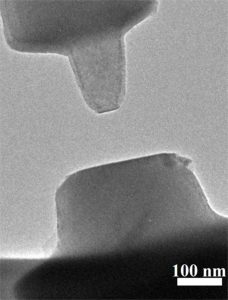
Tiny, milled pieces of a titanium oxide mineral called rutile — top left, bottom right — face off within a high resolution microscope enhanced with the ability to measure minuscule forces called van der Waals forces. Credit: Xin Zhang/PNNL
Like two magnets being pulled toward each other, tiny crystals twist, align and slam into each other, but due to an altogether different force. For the first time, researchers have measured the force that draws them together and visualized how they swivel and align.
Called van der Waals forces, the attraction provides insights into how crystals self-assemble, an activity that occurs in a wide range of cases in nature, from rocks to shells to bones.
“It’s provocative in the sense that from these kinds of measurements one can build a model of 3-D assembly, with particles attaching to each other in select ways like Lego bricks,” said chemist Kevin Rosso of the Department of Energy’s Pacific Northwest National Laboratory. “Crystals are most everywhere in nature, and this work will help us take advantage of these forces when we design new materials.”
Fusion force
Crystals form supporting structures in a variety of natural and synthetic materials. Larger crystals can build up from smaller ones. Although generally shaped like cubes, crystals have several different sides, some of which match well with each other and others that don’t. When matching sides are oriented properly, crystals can fuse seamlessly, growing larger and larger.
But what makes crystals get close enough to fuse in the first place, and can they self-align? Many types of forces have been hinted at through the years, but the tools to narrow down the correct ones have not existed.
Now, Rosso and teams at PNNL, EMSL, the Environmental Molecular Sciences Laboratory, a DOE Office of Science User Facility at PNNL, and the University of Pittsburgh developed a new approach by combining an environmental transmission electron microscope, called an ETEM, with nanocrystal force probes that allows scientists to watch crystals interact in a life-like situation. PNNL post-doctoral chemist Xin Zhang and EMSL user Yang He, a Ph.D. student from the University of Pittsburgh, used resources within EMSL to examine how titanium oxide crystals couple.
To understand their experiment, imagine holding two magnets and moving them toward each other. When they’re so close that the attractive force overcomes the effort you’re using to hold them apart, they will jump together. The PNNL team did this, but on a much smaller scale and with a force that isn’t magnetism.
One small jump
The team needed to use very tiny crystals that wouldn’t overwhelm the weak forces they expected to see. They attached titanium oxide crystals a hundred to a thousand times thinner than a human hair (depending on the hair) to either side of an instrument that measures force. The team then moved the crystals toward each other, twisted at several different angles between them, until the two snapped together.
The team also pulled the crystals apart and measured how much force that took as well. These measurements allowed the researchers to characterize the force in detail. There are several different kinds of forces that work for objects of this size, and with additional analyses the team concluded forces called van der Waals were the ones at work causing self-alignment.
And a twist
In addition, they wanted to put a face to a name, in a manner of speaking, of a theoretical prediction of van der Waals forces made in the 1970s. The theory allowed scientists to calculate the torque between crystals that are being twisted relative to each other (imagine twisting a baguette to pull a piece of bread off) based on the angle between them.
So the team also measured the force between two crystals held at a constant distance apart but twisted in opposite directions from each other. Co-author computational physicist Maria Sushko compared the data to predictions the theory made and showed that the theory held up.
“This is the first measure and proof that the force depends on how the crystals are rotated relative to each other, what we call rotationally dependent,” said Rosso. “If they are rotationally dependent, this implies that this force will contribute to aligning free crystals that bump together in a liquid environment, for example, increasing the rate of successful sticking.”
In addition, proving the connection means it will be easier to determine such attractive forces for crystals made of different materials, such as calcium carbonate found in seashells. Scientists will be able to determine these forces by plugging in numbers to an equation rather than re-doing all of the experiments.
Reference:
Xin Zhang, Yang He, Maria L. Sushko, Jia Liu, Langli Luo, James J. De Yoreo, Scott X. Mao, Chongmin Wang, Kevin M. Rosso. Direction-specific van der Waals attraction between rutile TiO2 nanocrystals, Science April 28, 2017, DOI: 10.1126/science.aah6902.
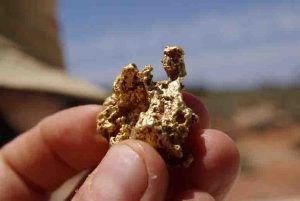
Gold nugget found in the field. Credit: University of Adelaide
Special ‘nugget-producing’ bacteria may hold the key to more efficient processing of gold ore, mine tailings and recycled electronics, as well as aid in exploration for new deposits, University of Adelaide research has shown.
For more than 10 years, University of Adelaide researchers have been investigating the role of microorganisms in gold transformation. In the Earth’s surface, gold can be dissolved, dispersed and reconcentrated into nuggets. This epic ‘journey’ is called the biogeochemical cycle of gold.
Now they have shown for the first time, just how long this biogeochemical cycle takes and they hope to make to it even faster in the future.
“Primary gold is produced under high pressures and temperatures deep below the Earth’s surface and is mined, nowadays, from very large primary deposits, such as at the Superpit in Kalgoorlie,” says Dr Frank Reith, Australian Research Council Future Fellow in the University of Adelaide’s School of Biological Sciences, and Visiting Fellow at CSIRO Land and Water at Waite.
“In the natural environment, primary gold makes its way into soils, sediments and waterways through biogeochemical weathering and eventually ends up in the ocean. On the way bacteria can dissolve and re-concentrate gold – this process removes most of the silver and forms gold nuggets.
“We’ve known that this process takes place, but for the first time we’ve been able to show that this transformation takes place in just years to decades – that’s a blink of an eye in terms of geological time.
“These results have surprised us, and lead the way for many interesting applications such as optimising the processes for gold extraction from ore and re-processing old tailings or recycled electronics, which isn’t currently economically viable.”
Working with John and Johno Parsons (Prophet Gold Mine, Queensland), Professor Gordon Southam (University of Queensland) and Dr Geert Cornelis (formerly of the CSIRO), Dr Reith and postdoctoral researcher Dr Jeremiah Shuster analysed numerous gold grains collected from West Coast Creek using high-resolution electron-microscopy.
Published in the journal Chemical Geology, they showed that five ‘episodes’ of gold biogeochemical cycling had occurred on each gold grain. Each episode was estimated to take between 3.5 and 11.7 years – a total of under 18 to almost 60 years to form the secondary gold.
“Understanding this gold biogeochemical cycle could help mineral exploration by finding undiscovered gold deposits or developing innovative processing techniques,” says Dr Shuster, University of Adelaide. “If we can make this process faster, then the potential for re-processing tailings and improving ore-processing would be game-changing. Initial attempts to speed up these reactions are looking promising.”
The researchers say that this new understanding of the gold biogeochemical process and transformation may also help verify the authenticity of archaeological gold artefacts and distinguish them from fraudulent copies.
Reference:
Jeremiah Shuster et al. Secondary gold structures: Relics of past biogeochemical transformations and implications for colloidal gold dispersion in subtropical environments, Chemical Geology (2017). DOI: 10.1016/j.chemgeo.2016.12.027
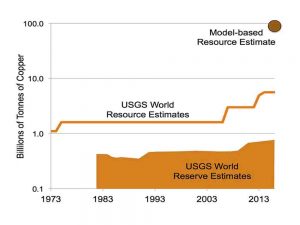
Comparison of changing estimates for copper reserves, resources and theoretical estimate of ultimate resource to depth of 3.3 km. These estimates are based on grades similar to those of deposits exploited today. If lower grades become feasible to mine, as has occurred over the past century, the resource size could increase significantly. Note log scale. Credit: UNIGE
Recent articles have declared that deposits of raw mineral materials (copper, zinc, etc.) will be exhausted within a few decades. An international team including the University of Geneva (UNIGE), Switzerland, has shown that this is incorrect and that the resources of most mineral commodities are sufficient to meet the growing demand from industrialization and future demographic changes. Future shortages will arise not from physical exhaustion of metals but from causes related to industrial exploitation, the economy, and environmental or societal pressures on the use of mineral resources. The report can be read in the journal Geochemical Perspectives.
Some scientists have declared that mineral deposits containing important non-renewable resources such as copper and zinc will be exhausted in a few decades if consumption does not decrease. Reaching the opposite conclusion, the international team of researchers shows that even though mineral resources are finite, geological arguments indicate that they are sufficient for at least many centuries, even taking into account the increasing consumption required to meet the growing needs of society. How can this difference be explained?
Definitions matter: reserves and resources
“Do not confuse the mineral resources that exist within the Earth with reserves, which are mineral resources that have been identified and quantified and can be exploited economically. Some studies that predict upcoming shortages are based on statistics that only take reserves into account, i.e., a tiny fraction of the deposits that exist,” explains Lluis Fontboté, professor in the Department of Earth Sciences, University of Geneva. To define reserves is a costly exercise that requires investment in exploration, drilling, analyses and numerical and economic evaluations. Mining companies explore and delineate reserves sufficient for a few decades of profitable operation. Delineation of larger reserves would be a costly and unproductive investment, and does not fit the economic logic of the modern market.
The result is that the estimated life of most mineral commodities is between 20 to 40 years, and has remained relatively constant over decades. Use of these values to predict the amount available leads to the frequently announced risks of impending shortages. But this type of calculation is obviously wrong, because it does not take into account the amount of metal in lower quality deposits that are not included in reserves and the huge amount of metal in deposits that have not yet been discovered. Some studies have produced figures that include the known and undiscovered resources, but as our knowledge of ore deposits in large parts of the Earth’s crust is fragmentary, these estimates are generally very conservative.
The vast majority of mined deposits have been discovered at the surface or in the uppermost 300 meters of the crust, but we know that deposits are also present at greater depths. Current techniques allow mining to depths of at least 2000 to 3000 meters. Thus, many mineral deposits that exist have not yet been discovered, and are not included in the statistics. There have been some mineral shortages in the past, especially during the boom related to China’s growth. However, these are not due to a lack of supply, but to operational and economic issues. For instance, between the discovery of a deposit and its effective operation, 10 to 20 years or more can elapse, and if demand rises sharply, industrial exploitation cannot respond instantly, creating a temporary shortage.
Environment and society
“The real problem is not the depletion of resources, but the environmental and societal impact of mining operations,” says Professor Fontboté. Mining has been undeniably linked to environmental degradation. While impacts can be mitigated by modern technologies, many challenges remain. The financial, environmental and societal costs of mining must be equitably apportioned between industrialized and developing countries, as well as between local communities near mines and the rest of society. “Recycling is important and essential, but is not enough to meet the strong growth in demand from developing countries. We must continue to seek and carefully exploit new deposits, both in developing and in industrialized countries,” says the researcher at the University of Geneva.
The importance of research
But how can we protect the environment while continuing to mine? Continuing research provides the solutions. If we are to continue mining while minimizing associated environmental effects, we need to better understand the formation of ore deposits in order to open new areas of exploration with advanced methods of remote sensing. The continual improvement of exploration and mining techniques is reducing the impact on the Earth’s surface. “Rapid evolution of technologies and society will eventually reduce our need for mineral raw materials, but at the same time, these new technologies are creating new needs for metals, such as many of the 60 elements that make up every smart phone,” adds Professor Fontboté.
The geological perspective that guided the present study leads to the conclusion that shortages will not become a threat for many centuries as long as there is a major effort in mineral exploration, coupled with conservation and recycling. To meet this challenge, society must find ways to discover and mine the required mineral resources while respecting the environment and the interests of local communities.
Note: The above post is reprinted from materials provided by University of Geneva.
New research shows that a volcano in northeastern Australia last erupted around 7000 years ago – and stories passed down by the Gugu Badhun Aboriginal people suggest they were there to see it happen.
In a paper published in the journal Quaternary Geochronology, geologists based in Scotland and Australia outline how they used a sophisticated rock dating technique to determine when the eruption occurred. They also describe a potential link between the volcanic eruption and stories from Aboriginal verbal traditions, which would have been passed down for around 230 generations – further back in time than even the oldest written historical records of Egypt or Mesopotamia.
The team, from the Scottish Universities Environmental Research Centre (SUERC), the University of Glasgow, the University of St Andrews, the Australian National University, and James Cook University, examined rock samples from long lava flows around the Kinrara volcano in Queensland. The flows, which are up to 55 km long, are still clearly visible across the landscape around the volcano.
Dr Benjamin Cohen, of the University of Glasgow and SUERC, said: “When people think of Australia, volcanoes are probably not the first thing that springs to mind, but they are actually more common than many people realise. For example, there are nearly 400 volcanic vents in north Queensland, which erupted over the last few million years, and Kinrara is one of the most recent.”
The researchers used a technique known as argon-argon geochronology to learn more about the age of the volcano. Using a noble gas mass spectrometer, they could measure the amount of argon built-up from natural radioactive decay of potassium, allowing them to determine how much time has passed since the volcano erupted.
The team’s measurements allowed them to date the Kinrara eruption to around 7000 years ago, with the possibility that it may have been up to 2000 years further back or forward in time.
“The argon-argon technique we use has improved considerably in the last few years, allowing us to view the past through a sharper lens than ever before. Without those improvements, we would not have been able to determine the age of the Kinrara volcano.”
Dr Cohen’s exploration of local histories from the Gugu Badhun people uncovered a recording, made in the 1970s, of an Aboriginal elder discussing an event that sounds very much like a volcanic eruption. The elder described a time when a pit was made in the ground with lots of dust in the air, and that people got lost in the dust and died. He also described an occurrence when the earth was on fire along the watercourses.
Dr Cohen added: “These stories are plausible descriptions of a volcanic eruption – the Kinrara volcano has a very prominent crater, which produced volcanic ash and lava fountains. The lavas from the volcano flowed 55 kilometres down the surrounding stream and river valleys, and would have looked very much like the earth burning. The volcanic eruption of Kinrara adds to a growing list of geological events that appear to be recounted in Australian Aboriginal traditions, including sea level rise around 10,000 years ago and other volcanic eruptions elsewhere on the continent.
“Studying the Kinrara eruption has been a fascinating step on the road to better understanding the most recent volcanic activity in Australia, and also the history and traditions of Aboriginal peoples. We look forward to continuing our work on volcanoes in Australia.”
Reference:
Benjamin E. Cohen et al. Holocene-Neogene volcanism in northeastern Australia: Chronology and eruption history, Quaternary Geochronology (2017). DOI: 10.1016/j.quageo.2017.01.003
Panoramic view of an ice cliff inside the Sc?ri?oara Ice Cave, where the research was done. Credit: Gigi Fratila & Claudiu Szabo
Ice cores drilled from a glacier in a cave in Transylvania offer new evidence of how Europe’s winter weather and climate patterns fluctuated during the last 10,000 years, known as the Holocene period.
The cores provide insights into how the region’s climate has changed over time. The researchers’ results, published this week in the journal Scientific Reports, could help reveal how the climate of the North Atlantic region, which includes the U.S., varies on long time scales.
The project, funded by the National Science Foundation (NSF) and the Romanian Ministry of Education, involved scientists from the University of South Florida (USF), University of Belfast, University of Bremen and Stockholm University, among other institutions.
Researchers from the Emil Racoviță Institute of Speleology in Cluj-Napoca, Romania, and USF’s School of Geosciences gathered their evidence in the world’s most-explored ice cave and oldest cave glacier, hidden deep in the heart of Transylvania in central Romania.
With its towering ice formations and large underground ice deposit, Scărișoara Ice Cave is among the most important scientific sites in Europe.
Scientist Bogdan Onac of USF and his colleague Aurel Perșoiu, working with a team of researchers in Scărișoara Ice Cave, sampled the ancient ice there to reconstruct winter climate conditions during the Holocene period.
Over the last 10,000 years, snow and rain dripped into the depths of Scărișoara, where they froze into thin layers of ice containing chemical evidence of past winter temperature changes.
Until now, scientists lacked long-term reconstructions of winter climate conditions. That knowledge gap hampered a full understanding of past climate dynamics, Onac said.
“Most of the paleoclimate records from this region are plant-based, and track only the warm part of the year — the growing season,” says Candace Major, program director in NSF’s Directorate for Geosciences, which funded the research. “That misses half the story. The spectacular ice cave at Scărișoara fills a crucial piece of the puzzle of past climate change in recording what happens during winter.”
Reconstructions of Earth’s climate record have relied largely on summer conditions, charting fluctuations through vegetation-based samples, such as tree ring width, pollen and organisms that thrive in the warmer growing season.
Absent, however, were important data from winters, Onac said.
Located in the Apuseni Mountains, the region surrounding the Scărișoara Ice Cave receives precipitation from the Atlantic Ocean and the Mediterranean Sea and is an ideal location to study shifts in the courses storms follow across East and Central Europe, the scientists say.
Radiocarbon dating of minute leaf and wood fragments preserved in the cave’s ice indicates that its glacier is at least 10,500 years old, making it the oldest cave glacier in the world and one of the oldest glaciers on Earth outside the polar regions.
From samples of the ice, the researchers were able to chart the details of winter conditions growing warmer and wetter over time in Eastern and Central Europe. Temperatures reached a maximum during the mid-Holocene some 7,000 to 5,000 years ago and decreased afterward toward the Little Ice Age, 150 years ago.
A major shift in atmospheric dynamics occurred during the mid-Holocene, when winter storm tracks switched and produced wetter and colder conditions in northwestern Europe, and the expansion of a Mediterranean-type climate toward southeastern Europe.
“Our reconstruction provides one of the very few winter climate reconstructions, filling in numerous gaps in our knowledge of past climate variability,” Onac said.
Warming winter temperatures led to rapid environmental changes that allowed the northward expansion of Neolithic farmers toward mainland Europe, and the rapid population of the continent.
“Our data allow us to reconstruct the interplay between Atlantic and Mediterranean sources of moisture,” Onac said. “We can also draw conclusions about past atmospheric circulation patterns, with implications for future climate changes. Our research offers a long-term context to better understand these changes.”
The results from the study tell scientists how the climate of the North Atlantic region, which includes the U.S., varies on long time scales. The scientists are continuing their cave study, working to extend the record back 13,000 years or more.
Reference:
Aurel Perșoiu, Bogdan P. Onac, Jonathan G. Wynn, Maarten Blaauw, Monica Ionita, Margareta Hansson. Holocene winter climate variability in Central and Eastern Europe. Scientific Reports, 2017; 7 (1) DOI: 10.1038/s41598-017-01397-w
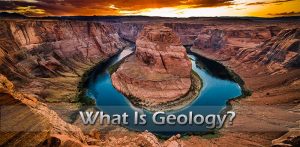
Geology is an earth science concerned with the solid Earth, the rocks of which it is composed, and the processes by which they change over time. Geology can also refer generally to the study of the solid features of any terrestrial planet (such as the geology of the Moon or Mars).
Geology gives insight into the history of the Earth by providing the primary evidence for plate tectonics, the evolutionary history of life, and past climates. Geology is important for mineral and hydrocarbon exploration and exploitation, evaluating water resources, understanding of natural hazards, the remediation of environmental problems, and for providing insights into past climate change. Geology also plays a role in geotechnical engineering and is a major academic discipline.
What do geologists do?
Mapping & Fieldwork
Field mapping:Geologists traditionally record in field notebooks their observations, including sketches, measurements (for example, the angle of tilted strata), and narratives. The validity of these observations remains; however, digital photographs now frequently supplement sketches, and instrumentation enhances measurement accuracy (for example, more precise locations are possible with a global positioning system instrument than with simple reference to position in relation to topographic and cultural features). Increasingly, field narratives are written and organized on a notebook computer or a personal digital assistant (PDA).
Sampling: Geological sample preparation is a vital stage in the analytical process, given the highly variable nature of mineral samples. The purpose of sample preparation is the production of homogeneous sub-sample, representative of the material submitted to the laboratory.
Geotechnical mapping assesses the engineering properties of a rock and its stability prior to undertaking any sort of construction or modification of the rocks (such as building a tunnel).
Logging
Well logging, also known as borehole logging is the practice of making a detailed record (a well log) of the geologic formations penetrated by a borehole. The log may be based either on visual inspection of samples brought to the surface (geological logs) or on physical measurements made by instruments lowered into the hole (geophysical logs). Some types of geophysical well logs can be done during any phase of a well’s history: drilling, completing, producing, or abandoning. Well logging is performed in boreholes drilled for the oil and gas, groundwater, mineral and geothermal exploration, as well as part of environmental and geotechnical studies.
Some types of logging include:
Rock core logging (or rock chip logging): Core logging is a highly specialized skill requiring careful observation and accurate recording. Geophysical logging of the hole created in the drilling process is sometimes done without the collection of the core.
Mud logging: Mud logging is the creation of a detailed record (well log) of a borehole by examining the cuttings of rock brought to the surface by the circulating drilling medium (most commonly drilling mud).
Geotechnical logging: this assesses how strong or weak rocks are below the ground using rock core.
Laboratory Work
Many geologists undertake laboratory work in their careers. A lot of what we know about the geology of the world and other planets has been discovered in laboratories. Researchers and those who work for some geology-related companies work in laboratories. There are also some geoscientists employed specifically in commercial laboratories that a huge number of geology-related companies (e.g. mining, oil & gas, engineering and environmental companies) use to acquire data.
Laboratory work can include:
Microscope: work looking at very fine details of rocks and fossils
Geochemical analyses: using chemical methods to reveal details about samples (such as their metal content or the quality of oil).
Geomechanical tests: testing the strength of rocks.
Computer-based work
All geologists will do a lot of their work on computer, often using specialist software, mostly in offices but field-based computer work is becoming more common. This can include:
Geographical Information Systems (GIS) – essentially, this is field mapping on computers – producing a digital database of the field data acquired by geologists.
Database management – Geologists spend a lot of time ensuring databases are up to date. This can be vital for the modelling processes described below.
Modelling programs – this has become increasingly important for geologists, both those who do research and in commercial companies. This means many geologists are trained in specialist software or programming. Geologists produce and maintain these for a range of purposes:
* Modelling geological processes (often for research purposes)
* Producing a 3-D model of a mineral deposit, oil field or aquifer.
* Modelling the subsurface geology that an engineering project will modify.
Geology as a Career
Earth Science Teachers: teach ‘earth science’ (a mixture of geology, oceanography and climatology) in junior and senior high schools. A teaching certificate from a professional education program is also normally required.
Economic Geologists: explore for and help produce metallic (iron, copper, gold, etc.) and non-metallic (coal, granite dimension stone, limestone aggregate, sand and gravel, etc.) rock and mineral resources of economic value.
Engineering Geologists: investigate the engineering properties of rock, sediment and soil below man-made structures such as roads, bridges, high-rise buildings, dams, airports, etc.
Environmental Geologists: study the environmental affects of pollution on ground and surface waters and surficial materials (rock, sediment and soil), and also recommend solutions to environmental problems. They are also interested in understanding, predicting and mitigating the effects of natural hazards, such as flooding, erosion, landslides, volcanic eruptions, earthquakes, etc.
Geochemists: investigate the chemical composition and properties of earth materials, especially polluted ground and surface waters, fossil fuels (such as petroleum and coal) and other resources of economic value.
Geology Professors: teach geology courses and conduct research in colleges and universities.
Geomorphologists: study the origin and evolution of landscapes on the continental surfaces.
Geophysicists: use the principles of physics to investigate the structure of the Earth’s deep interior, explore for economic resources in the subsurface, and monitor pollution in ground water.
Glacial or Quaternary Geologists: study the history of geologically recent (Quaternary period) glaciers as well as the sediment deposits and landforms they produced.
Hydrogeologists: are concerned with water in the Earth’s subsurface, including its sources, quality, abundance and movement.
Hydrologists: are concerned with water on the Earth’s surface, including its precipitation, evaporation and runoff, and its abundance and quality in streams and lakes.
Marine Geologists: study the physical, chemical and biological characteristics of the sediments deposited on the ocean floors and the rocks that underlie them.
Mineralogists: investigate the origins, properties and uses of the minerals occurring within the Earth’s rocks.
Paleontologists: study the remains of ancient animals and plants (fossils) in order to understand their behaviors, environmental circumstances, and evolutionary history.
Petroleum Geologists: explore for and help produce petroleum and natural gas from sedimentary rocks.
Petrologists: study the origins and characteristics of igneous, metamorphic and sedimentary rocks.
Sedimentologists: investigate the origins and characteristics of sediment deposits and the sedimentary rocks that form from them.
Seismologists: are geophysicists who study earthquakes, both to better understand the physical processes involved and to interpret the deep internal structure of the Earth.
Stratigraphers: investigate the time and space relationships among sedimentary and other rocks on local to global scales, and are also interested in the geochronology (absolute dating by radiometric methods) and fossil content of rock layers.
Structural Geologists: study the folding, fracturing, faulting and other forms of deformation experienced by rocks below the Earth’s surface, and are also interested in how these processes relate to global Plate Tectonics.
Volcanologists: investigate volcanoes, especially their eruptions and deposits, in order to better understand physical processes involved and to predict volcanic eruptions.
What is Geologist Salary?
The American Association of Petroleum Geologists reports every year on average salaries spanning years experience and degree acquired. You will notice that entry-level geologists earn on average $92,000, $104,400, and $117,300 for a bachelor, masters, and PhD degree in geology, respectively.
How to Become an Geologist?
To become a geologist, you need to begin by earning a Bachelor of Science degree in Geology or a closely related field such as Environmental Science. Completing coursework geology, mathematics and physics is a great way to build an educational foundation for your prospective career as a geologist.
Depending on where your career ambitions and interests lie, you will likely need a graduate degree in geology to become a senior level geologist. Employers also usually accept a degree in Environmental Engineering provided the candidate has experience in geology.
Depending on the requirements of the employer, a Master’s degree in Geology or Environmental Science is typically sufficient for many applied research positions. To become a geologist who works in research and university teaching positions a PhD in Geology or Environmental Science is needed.
Geologists must also complete continuing education throughout their careers in order to keep their skills current stay up to date with advancements in the field.
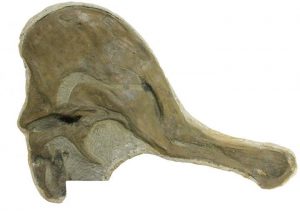
The Corythosaurus skull, collected in 1920 by George Sternberg, is in the University of Alberta’s Paleontology Museum. Credit: Katherine Bramble
After being headless for almost a century, a dinosaur skeleton that had become a tourist attraction in Dinosaur Provincial Park was finally reconnected to its head.
Researchers at the University of Alberta have matched the headless skeleton to a Corythosaurus skull from the university’s Paleontology Museum that had been collected in 1920 by George Sternberg to the headless dinosaur.
“In the early days of dinosaur hunting and exploration, explorers only took impressive and exciting specimens for their collections, such as skulls, tail spines and claws,” explained graduate student Katherine Bramble, adding the practice was commonly referred to as head hunting. “Now, it’s common for paleontologists to come across specimens in the field without their skulls.”
A surprising discovery
The headless Corythosaurus skeleton has been a tourist attraction in Dinosaur Provincial Park since the 1990s. In the early 2010s, a group of scientists noticed newspaper clippings dating back to the 1920s in the debris around the site. Among them was Darren Tanke, technician at the Royal Tyrrell Museum and co-author on the paper, who began to wonder if this skeleton could be related to the skull at the University of Alberta. That was where Bramble and her supervisor Philip Currie came in, along with former post-doctoral fellow Angelica Torices.
“Using anatomical measurements of the skull and the skeleton, we conducted a statistical analysis,” Bramble explained. “Based on these results, we believed there was potential that the skull and this specimen belonged together.”
In 2012, the skull and skeleton of the Corythosaurus were reunited. Whole once more, the specimen resides at the University of Alberta.
Reunited and it feels so good
As natural erosion takes place and human activity digs up new specimens, more headless dinosaur skeletons continue to crop up. “It’s becoming more and more common,” said Bramble. “One institution will have one part of a skeleton. Years later, another will collect another part of a skeleton that could belong to the same animal.”
The reasons are many, ranging from the historical practice of head hunting to a lack of resources for exploration to new parts of skeletons becoming exposed.
This discovery highlights a growing field of study in paleontology, Bramble noted.
“Researchers are now trying to develop new ways of determining whether or not disparate parts of skeletons come from the same animal,” she explained. “For this paper, we used anatomical measurements, but there are many other ways of matching, such as conducting a chemical analysis of the rock in which the specimens are found.”
As scientists develop new methods for matching specimens, Bramble hopes more dinosaurs skeletons will be reunited as well.
The entire story is explained in detail in the paper, “Reuniting the ‘head hunted’ Corythosaurus excavatus (Dinosauria: Hadrosauridae) holotype skull with its dentary and postcranium,” which was published in the April 2017 edition of Cretaceous Research.
Reference:
Katherine Bramble, Philip J. Currie, Darren H. Tanke, Angelica Torices. Reuniting the “head hunted” Corythosaurus excavatus (Dinosauria: Hadrosauridae) holotype skull with its dentary and postcranium. Cretaceous Research, 2017; 76: 7 DOI: 10.1016/j.cretres.2017.04.006
Note: The above post is reprinted from materials provided by University of Alberta. The original article was written by Katie Willis.