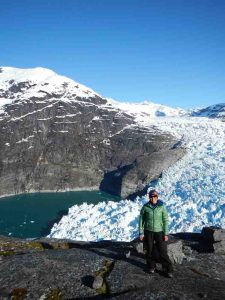
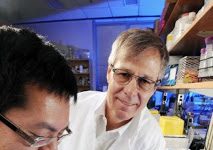
Twila Moon is pictured during field work to study ice-ocean interaction at the LeConte Glacier, Alaska. Credit: Twila Moon/NSIDC
Glaciers around the world are disappearing before our eyes, and the implications for people are wide-ranging and troubling, Twila Moon, a glacier expert at the University of Colorado Boulder, concludes in a Perspectives piece in the journal Science today.
The melting of glacial ice contributes to sea-level rise, which threatens to “displace millions of people within the lifetime of many of today’s children,” Moon writes. Glaciers also serve up fresh water to communities around the world, are integral to the planet’s weather and climate systems, and they are “unique landscapes for contemplation or exploration.”
And they’re shrinking, fast, writes Moon, who returned to the National Snow and Ice Data Center this month after two years away. Her analysis, “Saying goodbye to glaciers,” is published in the May 12 issue of Science.
Moon admits she was pretty giddy when an editor at Science reached out to her to write a perspective piece on the state of the world’s glaciers, because of her research knowledge and extensive publication record. “There was some serious jumping up and down,” Moon says. “I thought, ‘I’ve made it!’ Their invitation was an exciting recognition of my hard work and expertise.”
But the topic, itself, is far from a happy one. Moon describes the many ways researchers study glacier dynamics, from in-place measurements on the ice to satellite-based monitoring campaigns to models. And she describes sobering trends: The projection that Switzerland will lose more than half of its small glaciers in the next 25 years; the substantial retreat of glaciers from the Antarctic, Patagonia, the Himalayas, Greenland and the Arctic; the disappearance of iconic glaciers in Glacier National Park, Montana, or reduction to chunks of ice that no longer move (by definition, a glacier must be massive enough to move).
In her piece, Moon calls for continued diligence by the scientific community, where ice research is already becoming a priority.
Moon says she got hooked on glaciers as an undergraduate in geological and environmental sciences at Stanford University, when she spent a semester abroad in Nepal. “For the first time I saw a big valley glacier, flowing through the Himalaya,” she said, “and I thought it was about the coolest thing ever. After studying geology, the movement and sound of the ice, right now, made it feel almost alive.'”
That experience kicked off a research career that has taken Moon to Greenland, Alaska, Norway, and to conferences around the world. She began her work “merely” as a geologist and glaciologist, interested in ice itself, Moon said. Only later did the influence of climate change come to play in her work.
“I think I’m about as young as you can get for being a person who started in glaciology at a time when climate change was not a primary part of the conversation,” says Moon, who is 35.
She is consistently sought out by journalists hoping to understand Earth’s ice, and she’s sought out in the scientific community as well, recognized as someone who likes to collaborate across disciplinary boundaries. She recently worked with a biologist in Washington, for example, on a paper about how narwhals use glacial fronts in summertime—the tusked marine mammals appear to be attracted to glaciers with thick ice fronts and freshwater melt that’s low in silt, though it’s not yet clear why.
After a couple of post-doctoral research years, at the National Snow and Ice Data Center and then the University of Oregon, Moon and her husband headed to Bristol, England, where she took a faculty position at the University of Bristol’s School of Geographical Sciences. When it became clear that her husband’s work wouldn’t transfer, the two determined to head back to the Rocky Mountains.
Moon started back as a researcher at CU Boulder’s National Snow and Ice Data Center, part of CIRES, May 1.
The Berzelian mineral classification system was named in honor of the Swedish chemist and mineralogist Jons Jakob Berzelius (1779-1848). The Berzelian system categorizes mineral species according to the main anion group present in their chemical structure. All mineral species of a certain class are therefore chemically similar because they possess the same main anion group. Mineral classes may then be further subdivided according to physical features, which cations are present, the presence or absence of water or the hydroxyl anion, or internal structure.
The main classes which are recognized under Berzelius’ scheme include the native elements; sulfides and sulfosalts; oxides and hydroxides; halides; carbonates, nitrates and borates; sulfates; phosphates; and silicates. The antimonides, arsenides, selenides, and tellurides closely resemble the sulfides in composition, while the chromates, molybdates and tungstates resemble the sulfates. The arsenates and vanadates are closely akin to the phosphates.
1. Native Elements
The native elements are those minerals formed wholely from elements which occur in an uncombined state. No ionic or covalent bonding may join atoms of one element to atoms of another within the lattice structure of such a mineral. Usually only one type of atom is present in the molecular structure of these species. However, the metal alloys, which contain two or more metals in solid solution, are also classified as native elements because the different species of atom present in their lattices are joined only by metallic bonds, not by ionic or covalent bonds. The native elements are further categorized into subgroups containing metals, semimetals, and nonmetals.
Metals
Metallic elements which are found in the native state include gold, silver, copper, lead, iron, nickel, platinum, and the rarer elements palladium, iridium, and osmium. Mercury, tantalum, tin, and zinc have also been found. The uncombined atoms of the metals act as perfect spheres and are relatively inert; they tend to form lattices of face-centered cubic, body-centered cubic or hexagonal close-packed structure. The lattice structures of these native metals are composed of metallic bonds, which are relatively weak and produce soft, malleable, ductile, and sectile substances with rather low melting points. Because many electrons are free to move about within the lattice the native metals are very conductive, and because light cannot propagate inside a good conductor the metals possess the characteristic highly reflective ‘metallic’ luster.
The most common native metals are members of the gold group. These include the elements gold (Au), silver (Ag), copper (Cu), and lead (Pb). Mineral species composed of uncombined atoms of the gold group elements possess face-centered cubic lattices, which schema is also known as cubic closest packing. This cubic closest packing results in a high number of atoms per unit volume and thus in a mineral of relatively high density. In such lattices there exist no atomic planes distinguished by higher or lower density; minerals of the gold group therefore demonstrate hackly fracture and possess no cleavage.
Gold and silver atoms possess equal 1.44 angstrom atomic radii. These two substances are thus mutually soluble, and occur in mixtures with a wide range of relative compositions. Copper, however, has a radius of 1.28 angstrom. For this reason it is present only in tiny amounts within mixtures of gold and silver and conversely contains only tiny amounts of gold and silver in solution.
The iron group contains iron (Fe) and nickel (Ni). These metals possess a body-centered cubic structure. Nickel and iron are mutually soluble because their atomic radii are both equal to 1.24 angstrom. This solid solution is frequently found in meteorites and probably constitutes much of the earth’s core.
Platinum (Pt), palladium (Pd), iridium (Ir), and osmium (Os) number among the less common metallic native elements and are classified as the platinum group. The mineral species which form from the uncombined atoms of these elements are platinum, palladium, platiniridium and iridosmine. Platiniridium is a rare alloy of iridium and platinum, while iridosmine is an equally rare alloy of iridium and osmium. Both alloys possess hexagonal close-packed structure, while platinum and palladium are cubic close packed. The metals of the platinum group are harder and possess higher melting points than those of the gold group.
Semimetals
The native semi-metals include arsenic (As), antimony (Sb), and bismuth (Bi), as well as the less common elements selenium (Se) and tellurium (Te). Arsenic, antimony and bismuth crystallize in the hexagonal-scalenohedral class while selenium and tellurium crystallize in the trigonal-trapezoidal class. Natural crystals of all three species are rare. The semimetals are brittle, and conduct heat and electricity poorly compared to the metals. However, like the metals they display a metallic luster.
The lattices of the semimetals are composed of bonds intermediate in type between metallic and covalent. Such bonds are stronger than metallic bonds but are also more directional. The structure of the hexagonal semimetals is therefore based on a distorted form of cubic closest packing in which sheets of atoms parallel to the base of the crystal separate into pairs. This sheetlike structure results in perfect basal cleavage, or perfect cleavage along the paired planes.
The distorted form of cubic closest packing found in the semimetal lattice possesses a greater volume than the close packing which composes the liquid form of the substances. The semimetals thus display the unusual property of expansion upon crystallization.
Nonmetals
The native nonmetals include carbon (C), in the form of diamond and graphite, and sulphur (S).
Polymorphism in Diamond and Graphite
The mineral species diamond and graphite offer a spectacular example of the trait of polymorphism. Polymorphism occurs when two or more mineral species contain exactly the same elements in exactly the same proportions, and therefore share a chemical formula, yet possess dissimilar lattice structures. Two polymorphic minerals possess identical chemical formulae but different crystal structures; the minerals may therefore exhibit very different physical traits.
Chemically the two species diamond and graphite are identical. Both are native elements composed wholely of elemental carbon; both may be burned to carbon dioxide at high temperatures; and both contain closely similar carbon-carbon bonds. However, the two substances are structurally very different. Diamond possesses an exceptionally strong lattice in which each carbon atom is bonded by four covalent bonds to four neighboring carbon atoms, which occupy the apices of a regular tetrahedron. All four valence electrons are taken up by covalent bonds, so that none are free to conduct electricity; hence diamond forms a highly successful insulator. Graphite, on the other hand, is composed of sheets of six-atom rings in which each carbon has three neighboring atoms positioned at the corners of an equilateral triangle. Three valence electrons are occupied by covalent bonds; the fourth is free to act as a conductor of electricity. Graphite thus conducts relatively well. The sheets are stacked a distance much greater than one angstrom apart, and the van der Waals forces which bind the stacked sheets together are very weak. The wide separation and weak binding forces between parallel sheets result in perfect basal cleavage.
The two nonmetallic native elemental species graphite and diamond possess identical chemical formulae but, because of their differing lattice structures, demonstrate widely disseparate physical traits. They thus provide an apt example of polymorphism.
2. Sulfides, Antimonides, Arsenides, Selenides, Tellurides, and Sulfosalts
Sulfides
Sulfide minerals are compounds of one or more metal or semimetal elements with the nonmetallic element sulfur (S). In a sulfide, the sulfur anion (S2+) is thus combined with metallic cations such as iron (Fe), cobalt (Co), nickel (Ni), copper (Cu), zinc (Zn), molybdenum (Mo), silver (Ag), cadmium (Cd), tin (Sn), platinum (Pt), gold (Au), mercury (Hg), tellurium (Tl), lead (Pb), and the semimetals arsenic (As), antimony (Sb), and bismuth (Bi). Compounds of sulfur and one of the semimetals are termed semimetal sulfides. Most sulfides are structured by ionic bonds, although some may contain metallic bonding and display metallic properties.
Antimonides, Arsenides, Selenides, Tellurides
The nonmetal sulfur (S) and the semimetals selenium (Se) and tellurium (Te) consistently play the electronegative, anionic role in their compounds. However, the semimetals arsenic (As) and antimony (Sb) may either play the anionic role often filled by sulfur or else act as a cation by donating electrons and forming a compound with sulfur.
When the semimetals antimony (Sb), arsenic (As), selenium (Se), and tellurium (Te) occupy the role of a nonmetal and substitute for the sulfur anion, the minerals formed possess a chemical structure very similar to that of the sulfides. These are classified respectively as antimonides, arsenides, selenides, and tellurides according to which semimetal is present. When the semimetals arsenic (As) and antimony (Sb) form compounds with sulfur, however, they occupy the role of a metal cation and the minerals which contain them are termed semimetal sulfides. If a metal, a semimetal, and nonmetallic sulfur are all present then the mineral is categorized as one of the rare sulfosalts.
If both a metal and a semimetal such as arsenic or antimony are present in a compound and there is no sulfur anion present, then the semimetal replaces sulfur in order to play the electronegative role. In this case the mineral is classified as an antimonide, arsenide, selenide, or telluride. For example, niccolite (NiAs) contains the metal nickel and the semimetal arsenic, which acts as an nonmetal and provides the anion. Niccolite is therefore an arsenide. The mineral breithauptite (NiSb) contains nickel and the semimetal antimony, which acts as the electronegative, nonmetallic element of the compound. Breithauptite is thus an antimonide. The mineral calaverite (AuTe2), in turn, contains the metallic element gold and the semimetal tellurium, which provides an anion; calaverite is a telluride.
If only sulfur and either arsenic or antimony are present then the semimetal acts as a cation by donating electrons as it combines with the sulfur. For example, the mineral realgar (AsS) is a sulfide which contains only the semimetal arsenic (As) and the nonmetal sulfur (S). In this case, the arsenic acts as a metal by donating electrons to the electronegative sulfur. This type of compound is considered a semimetal sulfide; other examples are orpiment (As2S3) and bismuthinite (Bi2S3).
Sulfosalts
The rare minerals which are compounds of sulfur (S), a semimetal such as arsenic (As) or antimony (Sb), and one or more metals are termed sulfosalts. In these species the semimetal plays the role of a metal. The mineral cobaltite, which possesses the chemical formula CoAsS, is a sulfosalt. The metallic element in this compound is cobalt (Co); the semimetal, which also donates electrons, is arsenic (As), and the nonmetal sulfur receives the electrons donated by both the cobalt and the arsenic. Pyrargyrite (“dark ruby silver”, chemical formula Ag3SbS3), is also a sulfosalt. Its metallic element is silver (Ag), the semimetal is antimony (Sb), and the nonmetal is sulfur. Proustite (Ag3AsS3; “light ruby silver”) is another sulfosalt with a chemical formula and structure very similar to that of pyrargyrite, differing only because the semimetal antimony (Sb) has been replaced by arsenic (As).
Most of the sulfides contain ionic bonding. Others contain a degree of metallic bonding. Typical sulfides and sulfosalts are soft, dark, heavy, and brittle, possessing a distinct metallic luster and high conductivity. Most are opaque, demonstrating the distinctive colors and colored streak derived from the presence of chromophores (iron (Fe), cobalt (Co), nickel (Ni), and copper (Cu)). Those sulfides which are not opaque (cinnabar, realgar, and orpiment) are transparent only in very thin sections. Some species such as pyrite emit a sulfurous odor when they are struck with a mallet.
Categorization by Ratio of Metal to Nonmetal
The sulfides, antimonides, arsenides, selenides, tellurides, and sulfosalts may be grouped according to the ratio of metal to nonmetal contained in their chemical formulae. Let the letter A represent a metal or a semimetal acting as a cation, while X represents a nonmetal or a semimetal acting as an anion. Then the formulae may be categorized as AX, AX2, A2X, and so on according to the ratio of metal to nonmetal contained. Galena (PbS), sphalerite (ZnS), chalcopyrite (CuFeS2), covellite (CuS), and cinnabar (HgS) are examples of sulfides whose formulae possess the ratio AX. In all of these the nonmetallic element sulfur bonds to various metals such as lead, zinc, copper, iron, and mercury. In the semimetal sulfide realgar (AsS) arsenic fills the role of a metal and bonds with sulfur. Niccolite (NiAs) offers an example of an AX-type arsenide, in which arsenic plays the nonmetal, electronegative role while nickel donates electrons. Breithauptite (NiSb) in turn is an AX antimonide in which antimony fills the nonmetal role and bonds with nickel. Chalcocite (Cu2S) provides an example of an A2X sulfide, while pyrite (FeS2), and molybdenite (MoS2) are sulfides possessing formulae of the AX2 type. The mineral species cobaltite (CoAsS) is a sulfosalt and calaverite (AuTe2) is a telluride of the AX2 type. Species of the A2X3 type include the semimetal sulfides orpiment (As2S3) and bismuthinite (Bi2S3) while the sulfosalts pyrargyrite (Ag3SbS3) and proustite (Ag3AsS3) are of the form A4X3.
Secondary Enrichment of Sulfides
Many of the sulfide minerals are water soluble. Such minerals can be dissolved and transported underground by heated groundwater. This hydrothermal transportation of minerals is the mechanism by which secondary enrichment occurs. (Please refer to the discussion of secondary enrichment in Section 5.) Sulfides and arsenides are frequently altered to produce the secondary sulfates and arsenates.
3. Oxides and Hydroxides
Simple and Multiple Oxides
Members of the oxide class are minerals in which an oxygen anion is combined with one or more metals. The oxides can be divided into two categories consisting of simple oxides, which contain a single metallic element, and multiple oxides, which are compounds of oxygen and two or more metals.
Simple oxides are compounds of a single metallic element and oxygen. Examples of such species include zincite (ZnO), tenorite (CuO), cuprite (Cu2O), rutile (TiO2), uraninite (UO2), corundum (Al2O3), hematite (Fe2O3), and magnetite (Fe3O4). Ice (H2O) provides an unusual example of a simple oxide in which hydrogen replaces a metal in order to act as the cation.
Only one type of metal is present in combination with oxygen in each simple oxide species. Multiple oxides, in contrast, are compounds of oxygen with two or more metallic elements. Examples are ilmenite (FeTiO3), spinel (MgAl2O4), chromite (FeCr2O4), and chrysoberyl (BeAl2O4). Many of these species are colorful, relatively hard, and may be used as gemstones.
The oxide class contains several metal ores of great economic importance. Among these are the iron ores, hematite and magnetite; chromite, an ore of chromium; manganite (MnO(OH)), which provides manganese; zincite, which contains zinc; and gibbsite (Al(OH)3), which offers a source of aluminum.
The oxides can be usefully divided into the two categories of simple oxides, which contain only a single cation, and multiple oxides, which contain two or more metals. However, the oxides may alternatively be subdivided so that the chemical formula of each mineral species is categorized according to the ratio of metal to oxygen which it contains. If the capital letter A represents a metal atom, then the formulae AO, A2O, AO2, A2O3, and A3O4 each represent the chemical formulae of a group of mineral species. Examples of the AO type are provided by zincite (ZnO) and tenorite (CuO), while cuprite (Cu2O) offers an example of the A2O type. Species of the AO2 type are rutile (TiO2) and uraninite (UO2). The A2O3 type is represented by corundum (Al2O3), hematite (Fe2O3), and ilmenite (FeTiO3), while the A3O4 type is represented by spinel (MgAl2O4), magnetite (Fe3O4), chromite (FeCr2O4), and chrysoberyl (BeAl2O4).
Hydroxides are compounds of metallic elements with water or the hydroxyl anion (OH)-. Examples of hydroxides are manganite (MnO(OH)), goethite (FeO(OH)), and gibbsite (Al(OH)3; one of the main components of bauxite). Minerals of the hydroxide class are typically softer than oxides and are of low to medium density.
In terms of chemical composition, quartz (SiO2) is a member of the oxide class. However in terms of molecular structure, which in the Berzelian classification system is considered to be more fundamental than chemical composition, quartz is classified as a silicate.
4. Halides
The halide class is composed of minerals in which an element of the halogen group such as fluorine (F), chlorine (Cl), bromine (Br), or iodine (I) provides the anion. These elements form relatively large, lightly charged, easily polarized ions. The halogen ions then bond to large, weakly polarized cations of sodium (Na), potassium (K), magnesium (Mg) or calcium (Ca), and sometimes aluminum (Al), copper (Cu), or silver (Ag). Halides are therefore constructed entirely of ionic bonds. Both cations and anions behave as almost spherical bodies which pack in a highly symmetric manner; most common halites possess isometric hexoctahedral crystalline structure.
The halides tend to be soft, brittle, easily soluble in water, and possess medium to high melting points. They are poor conductors of heat and electricity when in solid state but good conductors when molten. (When molten, ions are liberated and may then transport charges. Molten halides thus conduct by electrolysis, or the transportation of charge by free-moving ions.)
Example members of the halide class are the mineral species halite (NaCl; also known as rock salt), sylvite (KCl), fluorite (CaF2), and chlorargyrite (AgCl, also known as horn silver).
5. Carbonates
Mineral species which are members of the carbonate class are compounds of a metal or semimetal with the carbonate anion (CO3)2-. In these substances plane triangular (CO3)2- anion groups are linked together by various cations. Each oxygen atom is bonded more strongly to its associated carbon than to any other atom of the structure, and oxygen atoms are not shared between the carbonate anions. The plane triangular carbonate anions thus form the basic unit from which carbonate minerals are constructed.
The bond between the carbon and the two oxygen atoms of the (CO3)2- anion is strong. However, when brought in contact with the hydrogen ion (H+) the carbonate radical decomposes, producing carbon dioxide and water. Minerals of the carbonate class thus react easily with acids such as hydrochloric acid (HCl). For example, calcite (calcium carbonate, CaCO3) effervesces when placed in an aqueous solution of HCl, producing carbon dioxide and calcium chloride:
CaCO3 (s) + 2HCl (aq) ——-> CaCl2 (s) + CO2 (g) + H2O (l)
This reaction provides a means for the identification of carbonate species which is easily applicable in the field.
Anhydrous Carbonates
The anhydrous carbonates lack both the hydroxyl anion (OH-) and water (H2O) in their chemical formulae. These carbonates are divided into three isostructural groups, called the calcite group, the dolomite group, and the aragonite group.
The calcite group contains calcite (CaCO3), magnesite (MgCO3), rhodocrosite (MnCO3), and siderite (FeCO3). Each of these minerals is composed of the carbonate anion and cations of a single metal. Although the bonds within the carbonate anion are covalent, the bonds between the carbonate anion and the metal cation are ionic. The structure of the minerals of the calcite group is composed of alternate layers of metal cations and carbonate anions. All members of the group are isostructural, possessing unit cells which are completely analogous in structure and differ only in the identity of the constituent atoms. Because the calcite minerals are isostructural, they form solid solutions of varying proportions in which magnesium (radius 0.66 angstrom), manganese (0.80 angstrom) and iron (0.74 angstrom) substitute for one another. Calcium, however, does not substitute so readily for these elements because of its larger radius (0.99 angstrom). Members of the calcite group are also called the rhombohedral carbonates, because the unit cell and the cleavage both form rhombohedra.
The dolomite group contains the minerals dolomite (CaMg(CO3)2) and ankerite (CaFe(CO3)2). Each of these species contains the semimetal calcium and a metal cation together with the carbonate anion. The structure of the dolomite minerals is composed of layers in which carbonate anions alternate with metal cations. In this way members of the dolomite group are similar in structure to the calcite group. However, the dolomites are more highly ordered than the calcites because their cation layers consist of layers of calcium alternating with layers of magnesium or iron. Due to its large atomic radius (0.99 angstrom) in comparison to the radii of iron (0.74 angstrom) or magnesium (0.66 angstrom) calcium is unable to form a solid solution with these metals, and the calcium separates out from the iron and magnesium to produce its own layer. Like the members of the calcite group, those of the dolomite group adhere to the rhombohedral crystal system.
The aragonite group is composed of the orthorhombic carbonates, of which aragonite (CaCO3), strontianite (SrCO3) and cerussite (PbCO3) provide examples. The members of this group are isostructural and may form a solid solution in which strontium, lead, and calcium may substitute for one another.
Like the members of the calcite group, the aragonite minerals each contain the carbonate anion and ions of a single metal. However, the members of the aragonite group adhere to the orthorhombic crystal system rather than the rhombohedral crystal system preferred by the calcite and dolomite groups. Structurally calcite and aragonite are thus quite different. (Please refer to the discussion of crystal system in Section 3 for details on the orthorhombic and rhombohedral (hexagonal) systems.)
Polymorphism and Pseudomorphism in Calcite and Aragonite
The two different mineral species calcite and aragonite both possess the chemical formula CaCO3. Although chemically identical, these two species are structurally very different; calcite crystalizes according to the rhombohedral crystal system while aragonite crystallizes according to the orthorhombic crystal system. Aragonite is harder and has a higher specific gravity than calcite. Two mineral species such as calcite and aragonite which are chemically identical and yet differ structurally and possess different physical properties are said to be polymorphs.
The structure of a carbonate is determined by the radius of its constituent cation. Those carbonates which contain smaller cations form rhombohedral structures while those possessing larger cations occupy orthorhombic structures. Magnesium, manganese, and iron are small cations, and the carbonates such as magnesite, rhodocrosite, and siderite which contain them adhere to the rhombohedral crystal system. Lead and strontium, on the other hand, are large cations, and species such as strontianite and cerussite which contain them belong to the orthorhombic crystal system. The radius of calcium occupies a unique position near the critical radius which distinguishes between the two possible crystal systems. Carbonate species which contain the calcium anion may thus crystallize according to either structural system. For this reason the compound calcium carbonate (CaCO3) crystallizes with rhombohedral crystal structure as calcite and with orthorhombic structure as aragonite. The fact that the calcium cation is of approximately the critical radius leads to the ability of calcium carbonate to crystallize in either system. This trait explains the polymorphism of calcite and aragonite, both of which possess the chemical formula CaCO3 but which crystallize according to the differing rhombohedral and orthorhombic crystal systems.
Aragonite is less stable than calcite and therefore less common. Aragonite begins to invert to calcite at temperatures as low as 400° Celcius; in contact with water of aqueous solutions containing calcium carbonate it may even invert at room temperatures. For this reason pseudomorphs of calcite after aragonite are often observed. In such cases the unit cells of the original aragonite have been gradually replaced by those of calcite while the original crystal shape remains intact.
Hydrous Carbonates
The hydrous carbonates consist of the copper carbonates, which contain both copper and the hydroxyl radical (OH-). Also contained within this subgroup are the hydrated carbonates such as thermonatrite (Na2CO3•H2O) and Trona (Na3H(CO3)2•2H2O, which contain water (H2O) within their lattice structures.
The copper carbonates azurite (Cu3(CO3)2(OH)2), malachite (Cu2CO3(OH)2), and aurichalcite (Cu5(CO3)2(OH)6) contain both copper and the hydroxyl anion (OH-). The element copper is a strong pigmenting agent and renders azurite a bright, distinctive azure blue, malachite a vivid green, and aurichalcite green to blue. Both azurite and malachite are of the monoclinic crystal system while aurichalcite is of the orthorhombic crystal system. Malachite frequently forms a pseudomorph of azurite; azurite is less stable than malachite, and gradually inverts to it over long periods of time.
6. Nitrates
The nitrates are chemically closely akin to the carbonates. Nitrogen bonds to three oxygen atoms in a structure very similar to the carbonate anion group (CO3)2-. This nitrate radical, (NO3)-, forms the basic building block of the nitrates.
Because nitrogen is more electronegative than carbon, the nitrate anion group (NO3)- is less stable than (CO3)2-. Mineral species of the nitrate class thus tend to occur less frequently in geologic formations than do the carbonates. (NO3)- is less charged than (CO3)2-; the nitrates tend therefore to be softer than the carbonates and also to possess lower melting points. The nitrates yield oxygen as the nitrate anion decomposes upon heating.
Several mineral species of the nitrate class form structures analogous to certain of the carbonates. For example, nitratine (or soda niter; NaNO3) and the carbonate calcite (CaCO3) are isostructural and possess the same rhombohedral cleavage. (Nitratine is softer than calcite and melts ar a lower temperature, both of which are expected of a nitrate as compared to a carbonate). Niter (KNO3, known colloquially as saltpeter) is in turn isostructural with the orthorhombic carbonate aragonite (CaCO3). To complete the analogy with calcite and aragonite, nitratine (NaNO3) possesses a polymorph which is also of chemical formula NaNO3. The polymorph of rhombohedral nitratine is isostructural with orthorhombic niter (KNO3). Nitratine’s polymorphism is thus analogous to that of the rhombohedral carbonate calcite and the orthorhombic carbonate aragonite, both of chemical formula CaCO3.
7. Borates
The boron atom joins to three oxygen atoms to form the borate radical, (BO3)3-. After this anion group has formed, each oxygen atom still has one electron available for bonding. Thus the oxygen atoms of the borate radical may, unlike those of the carbonate or nitrate radicals, be shared between anion groups. Borate radicals may therefore be linked into polymerized chains, sheets, or multiple groups. The most common borate minerals are composed of sheets of radicals which are linked together through the sharing of all three oxygen atoms. The sheets are then separated by layers of water molecules (H2O) and linked together by sodium (Na+) or calcium (Ca2+) ions.
Two example members of the borate class are borax, which possesses the chemical formula Na2B4O7•10H2O, and colemanite, Ca2B5O11•5H2O.
8. Sulfates
The sulfur anion (S2-) may bond to a positive metallic or semimetallic ion, receiving two electrons in order to fill its valence shell. Mineral species of the sulfide class are compounds of this nature. Alternately, the six electrons of sulfur’s unfilled valence shell may be ejected, resulting in the small, highly charged (S6+) cation. The sulfur cation may then form very strong bonds with four oxygen atoms, producing the anion group (SO4)2-. This sulfate radical forms the basic structural unit of the minerals of the sulfate class.
All members of the sulfate class contain the tetrahedral sulfate radical (SO4)2-. These tightly bound anion groups do not share oxygen atoms and cannot polymerize.
Anhydrous Sulfates
Anhydrous sulfates contain neither water molecules (H2O) nor the hydroxyl anion (OH-) within their lattice structures. The anhydrous sulfates consist of the barite group and the mineral species anhydrite (CaSO4). The members of the barite group include barite (BaSO4), celestite (SrSO4), and anglesite (PbSO4). These species are isostructural and may form a solid solution by exchanging atoms of strontium and lead for those of barium. The minerals of the barite group all possess orthorhombic symmetry, as does anhydrite. Anhydrite is not, however, isostructural with the barite minerals because the calcium ion possesses a radius smaller than that of barium, strontium, or lead.
Barite (BaSO4) sometimes produces groups of divergent tabluar crystals known as “desert roses.” The barite mineral anglesite (PbSO4) is formed through the oxidation of lead-bearing veins and in particular the alteration of the lead sulfide galena (PbS). Specimens of concretionary habit have been found consisting of concentric layers often containing a core of unaltered galena.
Hydrous Sulfates
Gypsum (CaSO4•2H2O) is the most prevalent and important of the hydrous sulfates. It possesses a sheetlike structure which consists of layers of calcium ions and sulfate anions separated by water molecules (H2O). Gypsum demonstrates perfect cleavage along planes parallel to its sheetlike layers. If the water is driven out of the gypsum structure, the mineral will collapse into the configuration of anhydrite (CaSO4) with a marked decrease in volume and loss of the perfect cleavage. Gypsum is frequently formed during the alteration of anhydrite.
Chalcanthite (CuSO4•5H2O, also known as blue vitriol), melanterite (FeSO4•7H2O, known colloquially as copperas), epsomite (MgSO4•5H2O), antlerite (Cu3(OH)4SO4), linarite (PbCu(SO4)(OH)2), cyanotrichite (Cu4Al2SO4(OH)12•2H2O), and alunite (KAl3(OH)6(SO4)2; known as potassium alum) also belong to the hydrous sulfates.
Chalcanthite, antlerite, linarite, and cyanotrichite are copper ores which are found in the oxidized and hydrothermally altered regions of copper veins. Due to the pigmenting effect of copper, chalcanthite, linarite and cyanotrichite are a deep azure blue in color. Antlerite may be emerald to very dark green and has a pale green streak. All four minerals may form as the product of secondary alteration of copper sulfides such as chalcocite (Cu2S). Melanterite is an iron ore which is formed by the oxidation and hydrothermal alteration of pyrite (FeS2) or other iron sulfide minerals. This species is yellow green to deep green due to the presence of iron.
9. Chromates
Minerals of the chromate class are compounds of metallic cations with the chromate anion group (CrO4)2-. The species of this class of minerals are very rare.
The lead chromate crocoite (PbCrO4) is isostructural with the sulfates of the barite group (BaSO4). This rare mineral is found in the oxidized zones of lead-bearing veins, particularly in places where lead veins have encountered rocks containing chromite. Due to the strong pigmenting capabilities of chromium, crocoite is a bright orange-red in color while its streak is orange.
10. Molybdates and Tungstates
Just as sulfur and chromium form the anion groups (SO4)2- and (CrO4)2-, the ions of molybdenum (Mo) and tungsten (W) bond with oxygen atoms to create the anion groups (MoO4)2- and (WO4)2-. These anion groups then bond with metal cations to form the minerals of the molybdate and tungstate classes. However, the atomic radii of molybdenum and tungsten are larger than that of sulfur. For this reason the ionic groups containing molybdenum and tungsten do not form regular tetrahedra. Instead, the tetrahedra occupied by the metal cation and the oxygen atoms are flattened and deformed. Molybdenum and tungsten possess equal atomic radii and may therefore freely substitute for one another within the ionic groups (MoO4)2- and (WO4)2-, allowing the formation of series of solid solution. Molybdenum and tungsten may not, however, substitute for sulfur within the sulfate radical (SO4)2- or form solid solution with minerals of the sulfate class.
Minerals containing the molybdate or tungstate anion groups are categorized as members of the molybdate or tungstate classes. These two classes are then further subdivided into the wolframite and scheelite groups. Minerals of either class may be placed into each group according to the relative size of the metallic cation which they contain. Species of the molybdate and tungstate classes are typically heavy, soft, and brittle. They tend to be dark or vividly colored.
Mineral species belonging to the wolframite group contain small cations such as magnesium, manganese, iron, cobalt, and nickel. The tungstates huebnerite (MnWO4) and ferberite (FeWO4) are considered to be end members of a series of solid solution in which manganese may substitute for various quantities of iron and vice versa. Both huebnerite and ferberite belong to the wolframite group.
Mineral species belonging to the scheelite group form compounds containing larger ions such as calcium. The tungstates scheelite (CaWO4) and stolzite (PbWO4) and the molybdates powellite (CaMoO4) and wulfenite (PbMoO4) are all members of the scheelite group. The lead molybdate wulfenite is a bright red color and is found in the oxidized portion of lead veins.
Because molybdenum and tungsten possess equal atomic radii, they may freely substitute for one another within the ionic groups (MoO4)2- and (WO4)2-. One series of solid solution exists between powellite (CaMoO4) and scheelite (CaWO4), while another occurs between wulfenite (PbMoO4) and stolzite (PbWO4). However, despite the similarity in atomic radii the difference in atomic weights between the two elements is significant. Molybdenum possesses an atomic mass of 96 amu, while tungsten’s mass is 184 amu. For this reason the two elements are often separated out by the force of gravity during the formation of the primary minerals which bear them. In primary mineral species, therefore, molybdate and tungstate species usually occur separately rather than in mixture. The two elements are more often found in solid solution in secondary minerals which result from the alteration of primary minerals.
11. Phosphates, Arsenates, and Vanadates
Like sulfur, the elements phosphorous (P), arsenic (As), and vanadium (V) form tetrahedral anion groups in combination with oxygen. The resulting phosphate radical, (PO4)3-, provides the basic structural unit of the minerals of the phosphate class; the arsenate and vanadate radicals (AsO4)3- and (VaO4)3- form the basic structural units of the arsenate and vanadate classes. The mineral species of these three classes are thus composed of the respective phosphate, arsenate, and vanadate radicals linked by various metal and semimetal cations. Phosphate, arsenic and vanadium ions may substitute for one another within the three anion groups, forming series of solid solution.
The apatite group contains mineral species of each of the phosphate, arsenate, and vanadate classes. Among the minerals of the apatite group number the three lead ores pyromorphite (Pb5Cl(PO4)3), mimetite (Pb5Cl(AsO4)3), and vanadinite (Pb5Cl(VO4)3). Each of these species contains both lead and chlorine. The three minerals are isostructural, differing only according to whether they contain phosphor, arsenic, or vanadium within the radical. Pyromorphite is thus a phosphate, mimetite is an arsenate, and vanadinite is a vanadate. These three species form a complete series of solid solution in which arsenic and vanadium may replace phosphor. The mineral vanadinite is bright orange-red due to the presence of the chromophore vanadium; all three species are found in the oxidized areas of lead veins.
The apatite group also contains the three species fluorapatite (Ca5F(PO4)3), chlorapatite (Ca5Cl(PO4)3), and hydroxylapatite (Ca5(OH)(PO4)3). These species are all calcium phosphates, because they contain the calcium cation (Ca2+) and the phosphate radical (PO43-). However, each species contains a different anion. Fluorapatite contains fluorine (F-), chlorapatite contains chlorine (Cl-), and hydroxylapatite contains the hydroxyl anion (OH-). The three minerals are isostructural, differing only according to which anion fills the requisite space in the unit cell. They form a complete series of solid solution in which chlorine or the hydroxyl anion may replace fluorine.
Example phosphates which do not belong to the apatite group class are amblygonite (LiAlF(PO4)), the hydrous phosphate wavellite (Al3(PO4)2(OH)3), and the hydrous iron phosphate vivianite (Fe3(PO4)2•8H2O). Vivianite is colorless before exposure to light; after exposure to light it assumes a blue or green color due to the presence of iron. Its streak is blue. Tirquoise (CuAl6(PO4)4(OH)8•2H2O) is a hydrous copper and aluminum phosphate which may be sky blue, bright blue or tirquoise blue in color and is pigmented by copper. Lazulite ((Fe,Mg)Al2(OH)2(PO4)2) is a ferric and magnesian phosphate which is a characteristic azure blue in color.
The mineral species erythrite (Co3(AsO4)2•8H2O is a hydrous cobalt arsenate. Erythrite is a vivid crimson or pink in color due to presence of the pigmenting agent cobalt; its streak is pale red or pink. The mineral is often found in the form of characteristic pink crusts called “cobalt bloom”. Erythrite occurs as a secondary product of cobalt arsenides such as skutterudite (CoAs3). Nickel may substitute for the cobalt in erythrite to form the mineral annabergite (Ni3(AsO4)2•8H2O), sometimes called “nickel bloom”. Annabergite is isostructural with erythrite; both minerals are hydrous arsenates and differ only according to whether they contain cobalt or nickel. Annabergite is a secondary mineral derived from nickel arsenides such as niccolite (NiAs). Nickel, like cobalt, is a chromophore: due to its presence, annabergite is light green in color.
Conichalcite (CaCu(AsO4)(OH)) is a copper arsenate which is grass green in color and possesses a green streak. It is pigmented by copper. Olivenite (Cu2AsO4(OH)) is another copper arsenate which is usually olive green.
The descloizite series includes the vanadates descloizite (PbZnVO4(OH)) and mottramite (PbCu(VO4(OH))). Both minerals are lead vanadates, containing the vanadium radical (VaO4)3- and a lead cation; they differ in that descloizite contains a zinc cation whereas mottramite contains a copper cation. Descloizite and mottramite are isostructural, forming a series of solid solution in which mottramite’s copper substitutes for descloizite’s zinc. Mottramite (PbCu(VO4)(OH)) is grass green or olive green in color due to the pigmenting action of copper; it possesses a green streak. Descloizite and mottramite are found in the oxidized portions of lead, copper, and vanadium veins.
12. Silicates
The fundamental constituent of the minerals of the silicate class is the silicate radical (SiO4)4-. This anion group is composed of one silicon atom bonded to four oxygen atoms, which occupy the apices of a regular tetrahedron. The bond which holds the silicon and oxygen atoms together within the silicate radical is partially ionic and partially covalent. This bond originates in the attraction of oppositely charged ions for one another, but it also involves the sharing of electrons and significant overlap of electron clouds.
The various species of the silicate class are grouped according to their structural type. The silicate anions may exist as isolated tetrahedra, paired tetrahera, single or double chains, rings, sheets, or three-dimensional boxlike structures. Groups of minerals containing such structures are given the respective terms nesosilicates, sorosilicates, inosilicates, cyclosilicates, phyllosilicates and tectosilicates.
Minerals of the silicate class are responsible for providing the bulk material out of which the earth’s crust and mantle are formed. (Silicates form 95% of the crust and 97% of the mantle). Silicate minerals are usually of relatively great hardness, and single crystals are often translucent.
Polymerization
The bond between silicon and oxygen utilizes only one of oxygen’s available bonding electrons. It is therefore possible that each oxygen atom within a silicate radical may bond with another silicon ion, becoming part of a second silicate radical and cementing the two disseparate ion groups together. One, two, three, or four of the oxygen atoms in each silicate radical may bind to different external silicon anion groups in this way. (Two or more oxygen atoms are never shared between the same adjacent silicate tetrahedra.) This bonding system opens up many structural possibilities; silicate radicals may remain structurally isolate, join together in pairs, or link into rings, chains, sheets, or frameworks. The process of linking series of anion groups togehter into chains, sheets, or ring structures through the sharing of oxygens is called polymerization.
In general, the higher the temperature at which a mineral specimen formed the lower the amount of polymerization which will be present. The silicate minerals in igneous rock undergo a definite sequence of crystallization beginning with those rocks possessing the least amount of polymerization and ending with those which possess most.
The element aluminum plays a prominent role in the construction of silicate minerals. Aluminum may, like silicon, join to four oxygen atoms; however, it may also bond with six oxygens. An aluminum atom joined to four oxygen ions (AlO4) occupies the same volume of space which is needed by a silicate (SiO4)4- radical; the aluminum anion group may therefore replace the silicate anion within chains or polymers. When joined to six oxygen atoms, however, aluminum can instead cement separate silicate tetrahedra together by forming ionic bonds. The ionic bonds thus formed are much weaker than the ionic-covalent bonds within the silicate and aluminate radicals. Aluminum is not the only element which may bond with oxygen and help to join silicate radicals together. The elements magnesium (Mg), iron (Fe), manganese (Mn), aluminum (Al), and titanium (Ti) may all occur joined to six oxygen atoms within the structure of the silicate minerals.
Nesosilicates
The nesosilicates or island silicates contain isolated (SiO4)4- tetrahedra. In the minerals of this group there is no direct linkage between separate silicate anion groups; the silicate tetrahedra are held together only by ionic bonds with various metallic cations.
Examples of the nesosilicates are provided by members of the olivine group, which contains forsterite (Mg2(SiO4)) and fayalite (Fe2(SiO4)); as well as members of the garnet group; zircon (Zr(SiO4)); and topaz (Al2(SiO4)(F,OH)2).
The garnets provide an interesting example of an isostructural group. The minerals of this group possess the general chemical formula A3B2(SiO4)3. The A lattice site is occupied by large ions such as calcium (Ca), magnesium (Mg), iron (Fe), and manganese (Mn) which possess two bonding electrons. The B lattice site is dedicated to smaller ions possessing three bonding electrons such as aluminum (Al), iron (Fe), titanium (Ti), and chromium (Cr). The magnesium, iron, and manganese inhabitants of the A lattice site are completely interchangeable because they possess almost equal atomic radii. Calcium, however, possesses a differing atomic radius and does not substitute for these three elements. Substitution between aluminum, iron and chromium occurs within the B lattice site.
The pyralspite garnets all have aluminum in the B lattice position; magnesium, iron and manganese may substitute for one another in the A lattice site to produce pyrope (Mg3Al2(SiO4)3), almandite (Fe3Al2(SiO4)3), and spessartite (Mn3Al2(SiO4)3). The ugrandite garnets all contain calcium in the A lattice position; aluminum, iron, and chromium may substitute for one another in the B lattice position. The ugrandite subgroup thus contains grossularite (Ca3Al2(SiO4)3), andradite (Ca3Fe2(SiO4)3), and uvarovite (Ca3Cr2(SiO4)3). The six garnet species are isostructural, possessing lattice configurations which are completely analogous and differ only in the identity of their constituent atoms.
Sorosilicates
In the sorosilicates or couplet silicates two silicate tetrahedra are linked into a pair by sharing a single oxygen ion. The most prevalent sorosilicates are members of the epidote group and are characterized by the mineral epidote, Ca2(Al,Fe)Al2O(SiO4)(Si2O7)(OH).
Cyclosilicates
The cyclosilicates or ring silicates are composed of (SiO4)4- tetrahedra linked into closed cyclic rings by the sharing of oxygen atoms. These rings possess a silicon to oxygen ratio of 1:3. Three possible ring configurations exist; these are the Si3O9 ring, observed only in the rare titanosilicate benitoite (BaTiSi3O9); the Si4O12 ring; and the Si6O18 ring, which is found in beryl and tourmaline. The Si6O18 rings are hexagonal and arranged in planar sheets. In beryl these parallel sheets are so strongly bonded together by beryllium and aluminum cations that they demonstrate only poor cleavage.
Two example members of the cyclosilicate group are beryl (Be3Al2(Si6O18)), of which varieties are known as aquamarine, morganite, and emerald, and tourmaline (Na(Mg,Fe)3Al6(BO3)3(Si6O18)(OH,F)4).
Inosilicates
The silicate anion groups of the inosilicates or chain silicates are linked together into single or double chains. In order to form single chains each silicate radical must share two out of its four oxygen atoms with neighboring radicals. In order to form double chains, half of the silicate radicals share three oxygens rather than two,while the other half continue to share two; the extra bonds affix two chains together into a double chain. Sheaves of parallel single or double chains of silicate tetrahedra are then bound together by metallic cations such as calcium (Ca), magnesium (Mg), or iron (Fe).
Those inosilicate species which are composed of single chains are classified as the pyroxenes, while those which are constructed of double chains are termed the amphiboles. Both groups may contain the same set of cations, which means that many pyroxenes are analogous to a species of the amphibole group and vice versa. For example, the pyroxene hypersthene ((Mg,Fe)2(Si2O6)), which contains magnesium and iron in solid solution, is analogous to the amphibole anthophyllite ((Mg,Fe)7(Si8O22)(OH)2), which contains the same cations. The difference between the two species lies in the ratio of silicon to oxygen, which is a legacy of the respective single or double chain structures, and in the presence of the hydroxyl radical (OH-) characteristic of amphiboles.
Example pyroxene species include the minerals enstatite (Mg2(Si2O6)), diopside (CaMg(Si2O6)), spodumene (LiAl(Si2O6)), and jadeite (NaAl(Si2O6)). The amphiboles include tremolite (Ca2Mg5(Si8O22)(OH)2), and glaucophane (Na2Mg3Al2(Si8O22)(OH)2). Wollastonite (Ca(SiO3)) and rhodonite (Mn(SiO3)) are also inosilicates. However, these two minerals share the structure of neither pyroxenes nor amphiboles, but are instead classified as members of the pyrorenoid group. Rhodonite is rose-red in color due to the presence of manganese.
Phyllosilicates
The phyllosilicates or layer silicates contain sheetlike planes of (SiO4)4- tetrahedra in which three of the four possible oxygen atoms are shared between different silicate tetrahedra. The term ‘phyllosilicate’ is derived from the Greek word phyllon, or ‘leaf’; because of their sheeted structure the phyllosilicates tend to cleave into flakes or leaves. All members of the phyllosilicate group therefore have platy or flaky habit and display a single, prominent cleavage. Such minerals are soft and possess a low specific gravity.
Example members of the phyllosilicate class are kaolinite (Al4(Si4O10)(OH)4), which is a major component of clay, serpentine (Mg6(Si4O10)(OH)8), talc (Mg3(Si4O10)(OH)2), and muscovite or white mica (KAl2(AlSi3O10)(OH)2).
Tectosilicates
The tectosilicates or framework silicates are constructed in the form of a three-dimensional framework of (SiO4)4- tetrahedra. In this structure all four of the oxygen ions belonging to each silicate tetrahedra are shared with nearby tetrahedra, forging a stable and strongly bonded network. The ratio of silicon to oxygen in this type of structure is 1:2.
The silica minerals are a subgroup of the tectosilicates. These include the nine different polymorphs of silicon dioxide, SiO2: stishovite, coesite, quartz, keatite, cristobalite, tridymite, lechatelierite, and opal. (Please refer below for a discussion of polymorphism in the silica minerals.)
The feldspar group forms another subgroup of the tectosilicates. The feldspars are aluminum silicates which contain potassium (K), sodium (Na), or calcium (Ca) cations. Orthoclase (K(AlSi3O8)) and albite (Na(AlSi3O8)) offer two examples of feldspar minerals. Aluminum cations couple to four oxygen atoms to form a tetrahedral anion group, (AlO4)5-, which is structurally equivalent to that of the silicate radical (SiO4)4-. This aluminum anion group may then substitute for silicate radicals within the three-dimensional tectosilicate framework. In order to maintain electrical neutrality during the substitution of (AlO4)5- for (SiO4)4-, metal cations such as potassium, sodium, or calcium must be included.
A third subgroup of the tectosilicates is composed of the zeolites, which are hydrous aluminum silicates. Natrolite (Na2(Al2Si3O10)•2H2O) and stilbite (Ca(Al2Si7O18)•7H2O) are two examples of this group.
Polymorphism in the Silicas
There are nine different ways in which the silicate tetrahedra may be arranged in a continuous and electrically neutral structure in order to share all four oxygen ions. Therefore there exist nine different polymorphs of silicon dioxide, SiO2. Each of these polymorphs possesses exactly the same chemical formula (SiO2) as all the others, yet is built according to a different structural plan. The polymorphs adhere to different crystal systems and possess differing specific gravities. Which polymorph is stable in a particular environment is determined by the ambient temperature of the environment and the lattice energy of the polymorph. Those forms which are stable at higher temperatures possess more open, expanded lattices with greater lattice energies. The higher-temperature polymorphs of silicon dioxide therefore tend to display lower density and specific gravity.
The three major polymorphs of silicon dioxide are quartz, which possesses the most dense lattice and the lowest symmetry; tridymite, which has a less dense lattice and higher symmetry; and cristobalite, which has the most open lattice and the highest symmetry. A quantity of crystalline silicon dioxide may be transformed from one of these structural types to another only when the silicon-oxygen bonds are broken. The transition between cristobalite, tridymite and quartz thus takes place only over long periods of time or at extremes of temperature change. However, quartz, tridymite, and cristobalite also possess high- and low- temperature structural variations which are differentiated by shorter or longer bond lengths between the silicon and oxygen ions. Transitions between these high and low-temperature variations are fast and completely reversible.
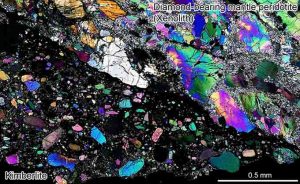
Photomicrograph of Siberian kimberlite with diamond-bearing mantle peridotite xenolith. Credit: Tatsuki Tsujimori
Earth’s history should include ‘pre-plate tectonic’ and ‘plate tectonic’ phases beginning less than a billion years ago, according to a team of geoscientists in the journal Geology.
Earth formed about 4.6 billion years ago. As the surface cooled, it formed a crust over a molten magma interior. Geoscientists disagree over when plate tectonics began—specifically when the top layer of the crust, the lithosphere, began to slide over the underlying mantle. Estimates range from as early as a few tens of millions of years after the Earth formed, to as late as 750 million years ago.
Part of the debate surrounds how to define plate tectonics. Geologist Tatsuki Tsujimori at Tohoku University and colleagues from Canada and the United States suggest ‘true plate tectonics’ began only 750 million years ago. They argue plate tectonics should be defined primarily by subduction: when a tectonic plate slides beneath another plate, steeply descending into the mantle below.
The steep angle is key because it takes water and carbon dioxide deep into the extremely hot mantle. Released water and carbon dioxide accumulate in the mantle, resulting in volatile pressure increases in the mantle, which are released by exploding through the lithosphere in a pipe.
These explosion pipes are called kimberlites, and some contain diamonds. Kimberlites and related igneous rocks are formed only inside old continents such as South Africa, Siberia, and North America. Most kimberlites found today are less than 1 billion years old, suggesting that the accumulation of water and carbon dioxide needed for this kind of eruption, and thus the modern style of subduction, began relatively recently.
This paper stimulated a “Discussion and Reply” in the journal. In their reply, Tsujimori and his colleagues lay out their theory in a graphic that breaks up the Earth’s history into five stages, the last of which is plate tectonics. This timeline is different from those developed by many other geologists, who argue that plate tectonics encompasses not just deep subduction, but also shallow subduction and other styles of surface recycling that geoscientists call “stagnant lid tectonics”.
Stagnant lid tectonics is proposed for tectonically and magmatically vigorous planets like Venus that do not have plate tectonics. Such a tectonic regime likely occurred early on when Earth was still much hotter and the lithosphere was thinner, so plates were not dense enough to sink deep into the Earth or strong enough to hold together as a plate.
Reference:
Title: Kimberlites and the start of plate tectonics, R.J. Stern, M.I. Leybourne, and T. Tsujimori, Geology, DOI: 10.1130/G38024.1
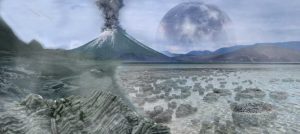
Artistic representation of the Earth in the Archean. Stromatolites, the first signs of life, are present in the shallow water. Credit: Tim Bertelink
For the first time, ETH scientists have successfully recreated the formation of continental crust in the Archean using a computer simulation. The model helps scientists to better understand processes that took place three to four billion years ago.
The present-day formation of continental crust can be investigated in the framework of plate tectonics; however, it is unclear how continental crust could have formed in the Archean, a period three to four billion years ago, when there was no plate tectonics.
In the journal Nature, geophysicists led by Antoine Rozel, a senior assistant at the Institute of Geophysics at ETH Zurich, have now presented a computer model that is likely to add fuel to the scientific debate. With their model, they were able to recreate the origination of earlier continental crust for the first time, something which until now had proven particularly challenging.
Venus or Io?
For their computer model, the researchers took inspiration from two opposing explanatory approaches. One approach postulates that the Archean crustal material was built up through volcanic activity alone, as it has been suggested to happen on Jupiter’s moon Io. The other approach, by contrast, assumes that new crust was formed by the accumulation of magma remaining warm in the crust might be the case on Venus.
The ETH researchers’ simulations could not confirm either extreme position, since neither of the two approaches produces a continental crust that is composed as it should be based on field observations.
Temperature and pressure narrowly defined
“The rocks of the original continental crust could only form under relatively narrowly defined temperature and pressure conditions. In both extremes, these conditions do not exist,” explains Rozel. “If a new crust is formed solely by volcanoes, whereby the magma cools immediately on the Earth’s surface, the crust would be too cold. Conversely, the crust in the other approach would be hotter than it should be.”
By contrast, the ideal situation is when the crust is created through a mixture of the two mechanisms, preferably when around 30 percent of the new crust is formed by volcanism. This results in a rock composition similar to what can be found on the west coast of Greenland, for example.
Two-dimensional and global
For the researchers to calculate their model, however, they had to make some compromises. Although their model is global, it is only two-dimensional. “If we had wanted a high regional resolution and a three-dimensional model, we would have had to run the calculations on a supercomputer for ten years,” says Rozel.
In their model, the researchers considered various quantities, such as temperature, pressure, water content of the rock and its viscosity, and simulated the processes up to 100 times to test the parameters with various values.
Reference:
A. B. Rozel et al. Continental crust formation on early Earth controlled by intrusive magmatism, Nature (2017). DOI: 10.1038/nature22042
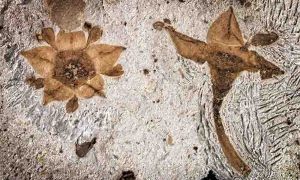
Two fossilized flowers next to each were discovered in shales of the Salamanca Formation in Chubut Province, Patagonia, Argentina. Credit: Nathan Jud/Provided
Around 66 million years ago, at the end of the Cretaceous period, a giant asteroid crashed into the present-day Gulf of Mexico, leading to the extinction of the non-avian dinosaurs. How plants were affected is less understood, but fossil records show that ferns were the first plants to recover many thousands of years afterward.
Now, an international team that includes Cornell researchers reports the discovery of the first fossilized flowers from South America, and perhaps the entire Southern Hemisphere, following the extinction event. The fossils date back to the early Paleocene epoch, less than one million years after the asteroid struck. They were discovered in shales of the Salamanca Formation in Chubut Province, Patagonia, Argentina.
The researchers identified the fossilized flowers as belonging to the buckthorn family (Rhamnaceae). Today, the family is found worldwide.
The study was published May 10 in the online journal PLOS One.
“The fossilized flowers provide a new window into the earliest Paleocene communities in South America, and they are giving us the opportunity to compare the response to the extinction event on different continents,” said Nathan Jud, the paper’s first author and a postdoctoral researcher in Maria Gandolfo’s lab, a senior research associate at the L.H. Bailey Hortorium and a co-author of the paper.
The finding also helps resolve an ongoing debate in the field of paleobotany on the origin of the Rhamnaceae plant family. Scientists have argued about whether early buckthorns originated in an ancient supercontinent called Gondwana, which later split and includes most of the Southern Hemisphere landmasses today; or whether the family originated in another supercontinent called Laurasia that accounts for most of today’s Northern Hemisphere landmasses.
“This, and a handful of other recently-discovered fossils from the Southern Hemisphere, supports a Gondwanan origin for Rhamnaceae in spite of the relative scarcity of fossils in the Southern Hemisphere relative to the Northern Hemisphere,” Jud said.
Fossils found in Colombia and Southern Mexico offer evidence that plants from the Rhamnaceae family first appeared in the Late Cretaceous epoch shortly before the extinction event, Jud said. Though there was likely some extinction when the asteroid struck, especially near the crater where everything was destroyed by impact-generated wildfires, he added.
One scenario is that Rhamnaceae first appeared in the tropics of Gondwana, but survived the extinction in Patagonia, and then spread from there after the extinction event as plants re-colonized the most affected areas, Jud said.
The Salamanca Formation is among the most precisely-dated sites from that era in the world. The age of the fossils was corroborated by radiometric dating (using radioactive isotopes), the global paleomagnetic sequence (signatures of reversals of Earth’s magnetic field found in the samples), and fossil correlations (age of other fossils).
“These are the only flowers of Danian age [an age that accounts for about 5 million years following the extinction event] for which we have good age control,” said Jud. Researchers have discovered other fossilized flowers in India and China from around the Danian age, but their dates are not as precise, he said.
To determine that the fossilized flowers from Argentina belonged to the Rhamnaceae family, the authors noticed that the organization of the petals and stamens in the fossil is found in Rhamnaceae and a few other families. They found examples of 10 of the 11 living Rhamnaceae tribes in the L.H. Bailey Hortorium Herbarium at Cornell University, which then were compared with morphological features in the fossil flowers to identify them.
Reference:
Nathan A. Jud et al. Flowering after disaster: Early Danian buckthorn (Rhamnaceae) flowers and leaves from Patagonia, PLOS ONE (2017). DOI: 10.1371/journal.pone.0176164
A nesting gigantic cassowary-like dinosaur named Beibeilong is in the act of incubating its eggs. Credit: Zhao Chuang.
A new species of giant bird-like dinosaur—which tended to enormous nests that were bigger than a monster truck tire—has been discovered in Henan, China.
The new species, named Beibeilong, lived about 90 million years ago during the Cretaceous Period. It is described by a joint Chinese-Canadian-Slovakia team based on a number of large eggs and an associated embryo that were collected in China in the early 1990s but then exported out of the country.
At one time, many fossil eggs collected in Henan were being exported out of China to other countries. “This particular fossil was outside the country for over 20 years and its return to China finally allowed us to properly study the specimen and name a new dinosaur species, Beibeilong sinensis or baby dragon from China.” says Prof. Lü Junchang, a paleontologist at the Institute of Geology, Chinese Academy of Geological Sciences.
The eggs are up to 45 centimeters long and weighed about five kilograms, making them some of the largest dinosaur eggs ever discovered. They were found in a ring-shaped clutch, which was part of a nest that was about 2-3 meters in diameter and probably contained two dozen or more eggs.
“For many years it was a mystery as to what kind of dinosaur laid these enormous eggs and nests. Because fossils of large theropods, like tyrannosaurs, were also found in the rocks in Henan, some people initially thought the eggs may have belonged to a tyrannosaur,” says Dr. Darla Zelenitsky, a professor at the University of Calgary who was part of the research team that described the fossil. “Thanks to this fossil, we now know that these eggs were laid by a gigantic oviraptorosaur, a dinosaur that would have looked a lot like an overgrown cassowary. It would have been a sight to behold with a three ton animal like this sitting on its nest of eggs.”
Study of the bones of an embryo that died while hatching out of one of the eggs reveals that the egg-layer is a new species of oviraptorosaur, a type of feathered, wing-bearing, beaked dinosaur closely related to birds. Although bones of the adult are not known, it was probably in the ballpark of eight meters long and 3 tons in body mass, based on comparison to close relatives.
Because fossils of smaller-bodied, close relatives have been fossilized while sitting on top of their eggs, the authors describe the new giant oviraptorosaur species as the largest known dinosaur to have sat on its nest and cared for its young.
“The fossils were originally collected by farmers in Henan Province of China in 1993, but were subsequently exported out of China to the USA. The eggs and embryo gained worldwide fame when they were featured in a National Geographic article in 1996, but it was impossible to describe them in a scientific journal—and to name the new species—until the fossils were repatriated to China,” says Prof. Philip Currie, a professor and research chair at the University of Alberta.
Recently the fossils were returned to China and permanently accessioned into the Henan Geological Museum. This allowed the Chinese-Canadian team to study them, and they present their results today in a paper in the leading journal Nature Communications.
Reference:
Perinate and eggs of a giant caenagnathid dinosaur from the Late Cretaceous of central China, Nature Communications (2017). DOI:10.1038/ncomms14952
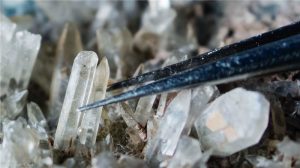
Calcite crystals precipitated in response to microbial activity. Tweezers shown for scale. Size of crystals ~5 mm (height). Credit: Henrik Drake
It is becoming more and more appreciated that a major part of the biologic activity is not going on at the ground surface, but is hidden underneath the soil down to depths of several kilometres in an environment coined the “deep biosphere.” Studies of life-forms in this energy-poor system have implications for the origin of life on our planet and for how life may have evolved on other planets, where hostile conditions may have inhibited colonization of the surface environment. The knowledge about ancient life in this environment deep under our feet is extremely scarce.
In numerous cracks down to depths of 1700 meter that have been partly sealed by crystals grown in them, an international team of researchers led by Dr. Henrik Drake from Linnaeus University, Sweden, has traced fundamental ancient microbial processes, including production and consumption of the greenhouse gas methane. The multi-disciplinary approach included micro-scale measurement of stable isotopes coupled with geochronology within minerals formed in response to microbial activity at several Swedish granitic rock sites. This is the most extensive study on ancient microbial activity in the continental crust yet and the findings suggest that microbial methane formation and consumption are widespread in the bedrock.
Henrik Drake explains how they tapped the stable isotope archive of minerals to decipher ancient microbial processes: “It is well known from other environments that methane formation and consumption result in diagnostic isotope ratios in carbonate minerals formed in association with microbial processes. The micro-analyses within calcite crystals showed an extreme range in carbon-isotope compositions, which can only be explained by microbial methane formation and consumption.”
This new knowledge of a deep source and sink for methane of widespread nature in space and time calls for a re-evaluation of the carbon cycling within the vast continental crust and may be significant in a long-term global warming perspective. Christine Heim of University of Göttingen, Germany, a co-author of the study, says: “It is intriguing that we could find biomarkers of ancient organic remains of surficial origin (e.g. land plants) preserved within calcite at great depth and that the nutrient source for the microbes at least partly seems to have been coming from the surface. This connection to the surface biosphere may explain why the marks of microbial activity abruptly disappear at around 700 to 800 m depth.”
Direct timing constraint of the microbial processes reveals for the first time when the biologic activities occurred — at ca 400, 350 and 170 Million years ago. This was facilitated by newly developed dating techniques of high spatial resolution, which is needed for delicately zoned crystals investigated in the study. Life in the subsurface environment of the continental crust has evidently thrived over geological eons, and provides clues about how life sustains in energy poor systems, which is relevant when searching for life in subsurface environments of other planets. Henrik Drake summarizes: “Our multi-phased methodology is clearly well suited for application to extra-terrestrial environments.”
Co-author Thomas Zack from the University of Gothenburg adds: “Cracks in the Earth and on other planets are omnipresent, and our findings indicate that they may be the perfect graveyards for past biologic activities. Who would have thought that? ”
Reference:
Henrik Drake, Christine Heim, Nick M.W. Roberts, Thomas Zack, Mikael Tillberg, Curt Broman, Magnus Ivarsson, Martin J. Whitehouse, Mats E. Åström. Isotopic evidence for microbial production and consumption of methane in the upper continental crust throughout the Phanerozoic eon. Earth and Planetary Science Letters, 2017; DOI: 10.1016/j.epsl.2017.04.034
Yellowstone Lake is the largest body of water in Yellowstone National Park. The lake is 7,732 feet (2,357 m) above sea level and covers 136 square miles (350 km2) with 110 miles (180 km) of shoreline. While the average depth of the lake is 139 ft (42 m), its greatest depth is at least 390 ft (120 m). Yellowstone Lake is the largest freshwater lake above 7,000 ft (2,100 m) in North America.
In winter, ice nearly 3 ft (0.91 m) thick covers much of the lake except where shallow water covers hot springs. The lake freezes over by early December and can remain frozen until late May or early June.
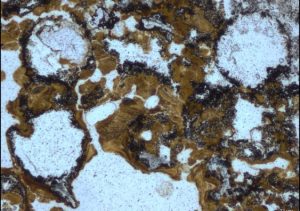
Spherical bubbles preserved in 3.48 billion-year-old rocks in the Dresser Formation in the Pilbara Craton in Western Australia provide evidence for early life having lived in ancient hot springs on land. Credit: UNSW
Fossils discovered by UNSW scientists in 3.48 billion year old hot spring deposits in the Pilbara region of Western Australia have pushed back by 580 million years the earliest known existence of microbial life on land.
Previously, the world’s oldest evidence for microbial life on land came from 2.7- 2.9 billion-year-old deposits in South Africa containing organic matter-rich ancient soils.
“Our exciting findings don’t just extend back the record of life living in hot springs by 3 billion years, they indicate that life was inhabiting the land much earlier than previously thought, by up to about 580 million years,” says study first author, UNSW PhD candidate, Tara Djokic.
“This may have implications for an origin of life in freshwater hot springs on land, rather than the more widely discussed idea that life developed in the ocean and adapted to land later.”
Scientists are considering two hypotheses regarding the origin of life. Either that it began in deep sea hydrothermal vents, or alternatively that it began on land in a version of Charles Darwin’s “warm little pond.”
“The discovery of potential biological signatures in these ancient hot springs in Western Australia provides a geological perspective that may lend weight to a land-based origin of life,” says Ms Djokic.
“Our research also has major implications for the search for life on Mars, because the red planet has ancient hot spring deposits of a similar age to the Dresser Formation in the Pilbara.
“Of the top three potential landing sites for the Mars 2020 rover, Columbia Hills is indicated as a hot spring environment. If life can be preserved in hot springs so far back in Earth’s history, then there is a good chance it could be preserved in Martian hot springs too.”
The study, by Ms Djokic and Professors Martin Van Kranendonk, Malcolm Walter and Colin Ward of UNSW Sydney, and Professor Kathleen Campbell of the University of Auckland, is published in the journal Nature Communications.
The researchers studied exceptionally well-preserved deposits which are approximately 3.5 billion years old in the ancient Dresser Formation in the Pilbara Craton of Western Australia.
They interpreted the deposits were formed on land, not in the ocean, by identifying the presence of geyserite – a mineral deposit formed from near boiling-temperature, silica-rich, fluids that is only found in a terrestrial hot spring environment. Previously, the oldest known geyserite had been identified from rocks about 400 million years old.
Within the Pilbara hotspring deposits, the researchers also discovered stromatolites – layered rock structures created by communities of ancient microbes. And there were other signs of early life in the deposits as well, including fossilised micro-stromatolites, microbial palisade texture and well preserved bubbles that are inferred to have been trapped in a sticky substance (microbial) to preserve the bubble shape.
“This shows a diverse variety of life existed in fresh water, on land, very early in Earth’s history,” says Professor Van Kranendonk, Director of the Australian Centre for Astrobiology and head of the UNSW school of Biological, Earth and Environmental Sciences.
“The Pilbara deposits are the same age as much of the crust of Mars, which makes hot spring deposits on the red planet an exciting target for our quest to find fossilised life there.”
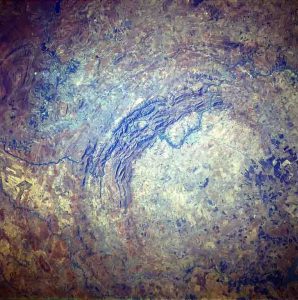
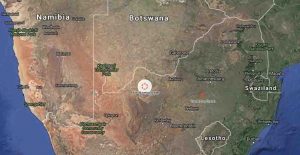
Vredefort Dome, Free State, South Africa. Image #STS51I-33-56AA. Credit: Júlio Reis
Asteroid impact date: Estimated 2 billion years ago
Location: Free State, South Africa
Specs: Also known as the Vredefort Dome, the Vredefort crater has an estimated radius of 118 miles (190 kilometers), making it the world’s largest known impact structure. This crater was declared a UNESCO World Heritage Site in 2005.
2. Sudbury Basin
The Sudbury and Wanapitei impact craters in Ontario, Canada. Sudbury is the large, elliptical structure (60 x 30 km), Wanapitei is the lake filled crater at upper right. It’s diameter is 8km, it’s age 37 million yeras. Created with NASA WorldWind by Vesta using Landsat 7 (Visible Color) satellite image.
Asteroid impact date: Estimated 1.8 billion years ago
Location: Ontario, Canada
Specs: The Sudbury Basin is considered one of largest impact structures on Earth, with an estimated diameter of 81 miles (130 kilometers). Dating back 1.8 billion years, it is also one of the oldest known impact structures in the world.
3. Acraman Crater
Lake Acraman (impact crater) in South Australia. Oblique Landsat image drapped over digital elevation model, looking east towards Flinders Ranges, 10x vertical exaggeration. Credit: Screen capture from NASA World Wind
Asteroid impact date: Estimated 580 million years ago
Location: South Australia, Australia
Specs: Located in what is now Lake Acraman, this impact structure has an estimated diameter of 56 miles (90 kilometers).
4. Woodleigh Crater
Asteroid impact date: Estimated 364 million years ago
Location: Western Australia, Australia
Specs: This crater is not exposed at the surface and has led to many discrepancies regarding its actual size. Reports on its diameter vary from 25 to 75 miles (40 to 120 kilometers).
5. Manicouagan Crater
View from orbit. Image courtesy NASA
Asteroid impact date: Estimated 215 million years ago
Location: Quebec, Canada
Specs: This impact crater formed what is now Lake Manicouagan. Even with erosion, it’s considered one of the largest and best-preserved craters on Earth, with an estimated diameter of 62 miles (100 kilometers).
6. Morokweng Crater
Asteroid impact date: Estimated 145 million years ago
Location: North West, South Africa
Specs: Located near the Kalahari Desert in South Africa, this crater contained the fossilized remains of the meteorite that created it.
7. Kara Crater
Image of the Kara meteor structure in the Yugorsky Peninsula, Nenetsia, Russia. Credit: NASA
Asteroid impact date: Estimated 70.3 million years ago
Location: Nenetsia, Russia
Specs: Now greatly eroded, the Kara crater is a non-exposed impact structure in Russia. Some have claimed that the impact structure actually consists of two adjacent craters: the Kara and the Ust-Kara crater.
8. Chicxulub Crater
Asteroid impact date: Estimated 65 million years ago
Location: Yucatán, Mexico
Specs: Located on the Yucatán Peninsula in Mexico, many scientists believe that the meteorite that left this crater caused or contributed to the extinction of the dinosaurs. Estimates of its actual diameter range from 106 to a whooping 186 miles (170 to 300 kilometers), which if proved right could mean it’s the biggest.
9. Popigai Crater
Credit: NASA
Asteroid impact date: Estimated 35.7 million years ago
Location: Siberia, Russia
Specs: Russian scientists claim that this crater site contains trillions of carats of diamonds, making it one of the largest diamond deposits in the world. These diamonds have been referred to as “impact diamonds.”
10. Chesapeake Bay Crater
Boundaries of the crater
Asteroid impact date: Estimated 35 million years ago
Location: Virginia, United States
Specs: Discovered in the early 1980s, the Chesapeake Bay Crater is located approximately 125 miles (201 kilometers) from Washington, D.C. Some estimates suggest this crater is 53 miles (85 kilometers) wide.
Zircon crystals as old as 4.4 billion years were found in sandstone at Jack Hills of Western Australia. Credit: Stuart Hay, ANU
Scientists at The Australian National University (ANU) say the early Earth was likely to be barren, flat and almost entirely under water with a few small islands, following their analysis of tiny mineral grains as old as 4.4 billion years.
Lead researcher Dr Antony Burnham said the team studied zircon mineral grains that were preserved in sandstone rocks in the Jack Hills of Western Australia and which were the oldest fragments of the Earth ever found.
“The history of the Earth is like a book with its first chapter ripped out with no surviving rocks from the very early period, but we’ve used these trace elements of zircon to build a profile of the world at that time,” said Dr Burnham from the ANU Research School of Earth Sciences.
“Our research indicates there were no mountains and continental collisions during Earth’s first 700 million years or more of existence – it was a much more quiet and dull place.
“Our findings also showed that there are strong similarities with zircon from the types of rocks that predominated for the following 1.5 billion years, suggesting that it took the Earth a long time to evolve into the planet that we know today.”
Dr Burnham said the zircon grains that eroded out of the oldest rocks were like skin cells found at a crime scene.
“We used the granites of southeast Australia to decipher the link between zircon composition and magma type, and built a picture of what those missing rocks were,” he said.
The first known form of life emerged some time later, around 3.8 billion years ago.
Dr Burnham said the zircon formed by melting older igneous rocks rather than sediments.
“Sediment melting is characteristic of major continental collisions, such as the Himalayas, so it appears that such events did not occur during these early stages of Earth’s history,” he said.
Dr Burnham said scientists in the field were able to build on each other’s work to gain a better understanding of early Earth.
“The samples of zircon from Jack Hills have been collected over the course of several decades by many people, while chemical analyses carried out by an ANU research group 20 years ago have proved invaluable,” he said.
The study, ‘Formation of Hadean granites by melting of igneous crust’, is published in Nature Geoscience. Journalists can receive a copy of the research paper, upon request.
Reference:
Formation of Hadean granites by melting of igneous crust, Nature Geoscience (2017). DOI:10.1038/ngeo2942
A volunteer creates an ancient Acheulean hand axe wearing a cap designed to measure brain activity. Credit: Shelby S. Putt
By using highly advanced brain imaging technology to observe modern humans crafting ancient tools, an Indiana University neuroarchaeologist has found evidence that human-like ways of thinking may have emerged as early as 1.8 million years ago.
The results, reported May 8 in the journal Nature Human Behavior, place the appearance of human-like cognition at the emergence of Homo erectus, an early apelike species of human first found in Africa whose evolution predates Neanderthals by nearly 600,000 years.
“This is a significant result because it’s commonly thought our most modern forms of cognition only appeared very recently in terms of human evolutionary history,” said Shelby S. Putt, a postdoctoral researcher with The Stone Age Institute at Indiana University, who is first author on the study. “But these results suggest the transition from apelike to humanlike ways of thinking and behaving arose surprisingly early.”
The study’s conclusions are based upon brain activity in modern individuals taught to create two types of ancient tools: simple Oldowan-era “flake tools” — little more than broken rocks with a jagged edge — and more complicated Acheulian-era hand axes, which resemble a large arrowhead. Both are formed by smashing rocks together using a process known as “flintknapping.”
Oldowan tools, which first appeared about 2.6 million years ago, are among the earliest used by humanity’s ancestors. Acheulian-era tool use dates from 1.8 million to 100,000 years ago.
Putt said that neuroarchaeologists look to modern humans to understand how pre-human species evolved cognition since the act of thinking — unlike fossilized bones or ancient artifacts — leave no physical trace in the archaeological record.
The methods used to conduct studies on modern humans crafting ancient tools was limited until recently by brain imaging technology. Previous studies depended on placing people within the confines of a functional magnetic resonance imaging machine — essentially a narrow mental tube — to observe their brain activity while watching videos of people crafting tools.
Putt’s study, by contrast, employed more advanced functional near-infrared spectroscopy — a device that resembles a lightweight cap with numerous wires used to shine highly sensitive lasers onto the scalp — to observe brain activity in people as they learned to craft both types of tools with their hands.
In the study, 15 volunteers were taught to craft both types of tools through verbal instruction via videotape. An additional 16 volunteers were shown the same videos without sound to learn toolmaking through nonverbal observation. These experiments were conducted in the lab of John P. Spencer at the University of Iowa, where Putt earned her Ph.D. before joining IU. Spencer is now a faculty member at the University of East Anglia.
The resulting brain scans revealed that visual attention and motor control were required to create the simpler Oldowan tools. A much larger portion of the brain was engaged in the creation of the more complex Acheulian tools, including regions of the brain associated with the integration of visual, auditory and sensorimotor information; the guidance of visual working memory; and higher-order action planning.
“The fact that these more advanced forms of cognition were required to create Acheulean hand axes — but not simpler Oldowan tools — means the date for this more humanlike type of cognition can be pushed back to at least 1.8 million years ago, the earliest these tools are found in the archaeological record,” Putt said. “Strikingly, these parts of the brain are the same areas engaged in modern activities like playing the piano.”
Reference:
Shelby S. Putt, Sobanawartiny Wijeakumar, Robert G. Franciscus, John P. Spencer. The functional brain networks that underlie Early Stone Age tool manufacture. Nature Human Behaviour, 2017; 1: 0102 DOI: 10.1038/s41562-017-0102
The projected paths of global temperatures with a positive and negative Interdecadal Pacific Oscillation.
Global temperatures could break through the 1.5°C barrier negotiated at the Paris conference as early as 2026 if a slow-moving, natural climate driver known as the Interdecadal Pacific Oscillation (IPO) has, as suspected, moved into a positive phase.
New research published in Geophysical Research Letters by University of Melbourne scientists at the ARC Centre of Excellence for Climate System Science shows that a positive IPO would likely produce a sharp acceleration in global warming over the next decade.
Since 1999, the IPO has been in a negative phase but consecutive record-breaking warm years in 2014, 2015 and 2016 have led climate researchers to suggest this may have changed. In the past, these positive phases have coincided with accelerated global warming.
“Even if the IPO remains in a negative phase, our research shows we will still likely see global temperatures break through the 1.5°C guardrail by 2031,” said lead author Dr Ben Henley.
“If the world is to have any hope of meeting the Paris target, governments will need to pursue policies that not only reduce emissions but remove carbon from the atmosphere.”
“Should we overshoot the 1.5°C limit, we must still aim to bring global temperatures back down and stabilise them at that level or lower.”
The IPO has a profound impact on our climate because it is a powerful natural climate lever with a lot of momentum that changes very slowly over periods of 10-30 years.
During its positive phase the ocean temperatures in the tropical Pacific are unusually warm and those outside this region to the north and south are often unusually cool. When the IPO enters a negative phase, this situation is reversed.
In the past, we have seen positive IPOs from 1925-1946 and again from 1977-1998. These were both periods that saw rapid increases in global average temperatures. The world experienced the reverse — a prolonged negative phase — from 1947-1976, when global temperatures stalled.
A striking characteristic of the most recent 21st Century negative phase of the IPO is that on this occasion global average surface temperatures continued to rise, just at a slower rate.
“Although the Earth has continued to warm during the temporary slowdown since around 2000, the reduced rate of warming in that period may have lulled us into a false sense of security. The positive phase of the IPO will likely correct this slowdown. If so, we can expect an acceleration in global warming in the coming decades,” Dr Henley said.
“Policy makers should be aware of just how quickly we are approaching 1.5°C. The task of reducing emissions is very urgent indeed.”
Reference:
Benjamin J. Henley, Andrew D. King. Trajectories toward the 1.5°C Paris target: Modulation by the Interdecadal Pacific Oscillation. Geophysical Research Letters, 2017; DOI: 10.1002/2017GL073480
Kīlauea is a currently active shield volcano in the Hawaiian Islands, and the most active of the five volcanoes that together form the island of Hawaiʻi. Located along the southern shore of the island, the volcano is between 300,000 and 600,000 years old and emerged above sea level about 100,000 years ago.
It is the second youngest product of the Hawaiian hotspot and the current eruptive center of the Hawaiian–Emperor seamount chain. Because it lacks topographic prominence and its activities historically coincided with those of Mauna Loa, Kīlauea was once thought to be a satellite of its much larger neighbor.
Structurally, Kīlauea has a large, fairly recently formed caldera at its summit and two active rift zones, one extending 125 km (78 mi) east and the other 35 km (22 mi) west, as an active fault of unknown depth moving vertically an average of 2 to 20 mm (0.1 to 0.8 in) per year.
More than 90% of Earth’s continental crust is made up of silica-rich minerals, such as feldspar and quartz. But where did this silica-enriched material come from? And could it provide a clue in the search for life on other planets?
Conventional theory holds that all of the early Earth’s crustal ingredients were formed by volcanic activity. Now, however, McGill University earth scientists Don Baker and Kassandra Sofonio have published a theory with a novel twist: some of the chemical components of this material settled onto Earth’s early surface from the steamy atmosphere that prevailed at the time.
First, a bit of ancient geochemical history: Scientists believe that a Mars-sized planetoid plowed into the proto-Earth around 4.5 billion years ago, melting the Earth and turning it into an ocean of magma. In the wake of that impact — which also created enough debris to form the moon — the Earth’s surface gradually cooled until it was more or less solid. Baker’s new theory, like the conventional one, is based on that premise.
The atmosphere following that collision, however, consisted of high-temperature steam that dissolved rocks on the Earth’s immediate surface — “much like how sugar is dissolved in coffee,” Baker explains. This is where the new wrinkle comes in. “These dissolved minerals rose to the upper atmosphere and cooled off, and then these silicate materials that were dissolved at the surface would start to separate out and fall back to Earth in what we call a silicate rain.”
To test this theory, Baker and co-author Kassandra Sofonio, a McGill undergraduate research assistant, spent months developing a series of laboratory experiments designed to mimic the steamy conditions on early Earth. A mixture of bulk silicate earth materials and water was melted in air at 1,550 degrees Celsius, then ground to a powder. Small amounts of the powder, along with water, were then enclosed in gold palladium capsules, placed in a pressure vessel and heated to about 727 degrees Celsius and 100 times Earth’s surface pressure to simulate conditions in the Earth’s atmosphere about 1 million years after the moon-forming impact. After each experiment, samples were rapidly quenched and the material that had been dissolved in the high temperature steam analyzed.
The experiments were guided by other scientists’ previous experiments on rock-water interactions at high pressures, and by the McGill team’s own preliminary calculations, Baker notes. Even so, “we were surprised by the similarity of the dissolved silicate material produced by the experiments” to that found in the Earth’s crust.
Their resulting paper, published in the journal Earth and Planetary Science Letters, posits a new theory of “aerial metasomatism” — a term coined by Sofonio to describe the process by which silica minerals condensed and fell back to earth over about a million years, producing some of the earliest rock specimens known today.
“Our experiment shows the chemistry of this process,” and could provide scientists with important clues as to which exoplanets might have the capacity to harbor life Baker says.
“This time in early Earth’s history is still really exciting,” he adds. “A lot of people think that life started very soon after these events that we’re talking about. This is setting up the stages for the Earth being ready to support life.”
Reference:
Don R. Baker, Kassandra Sofonio. A metasomatic mechanism for the formation of Earth’s earliest evolved crust. Earth and Planetary Science Letters, 2017; 463: 48 DOI: 10.1016/j.epsl.2017.01.022
Massive volcanic eruptions occurred as the supercontinent Pangea started to split and crack. With eruptions fumes of greenhouse gases were released from the Earth’s interior, causing catastrophic climate change Photo: Cai Tjeenk Willink/Wikimedia Commons
Bedrock of Earth got severely beaten up by hothouse climate conditions during one of planet’s mass extinctions some 200 million years ago. But the process also allowed life to bounce back.
One of the Big Five mass extinction events occurred some 200 million years ago. Giant volcanic eruptions and an asteroid impact have been blamed for causing the disastrous change of climate, killing off nearly half of the species on Earth.
The time epoch is called late Triassic. Amounts of carbon dioxide released through the volcanic activity during this time were staggering. Concentrations of CO2 in the atmosphere were up to 1000 ppm or so due to the volcanic activities of the period. For comparison, we have just recently reached 410 ppm of CO2 in the atmosphere today, a concentration that worries many scientists.
“In addition to the warming effects of the CO2 release, dissociation of massive amounts of methane hydrates had intensified the warming effect during the mass extinction. “ says Jochen Knies of CAGE and Geological Survey of Norway. He is a coauthor on recent Nature Communication study that has found evidence of impact of hothouse climate conditions of the late Triassic in Scandinavia.
Precisely dating deeply impacted bedrock
Published in Nature Communications by Ola Fredin (Geological Survey of Norway) and colleagues, these new findings shed light on how high greenhouse gas concentrations caused the bedrock to disintegrate through chemical weathering. Chemical weathering is caused by water reacting with the mineral grains in rocks to form new minerals, such as clay mineral illite. These reactions occur particularly when the water is acidic, as is the case when the CO2 levels are high.
“We have managed to precisely date deeply weathered crystalline bedrock from the North Sea and across Scandinavia, which then was part of the supercontinent Pangea. We did this by detailed geomorphological and mineralogical analyses of weathered rocks combined with the dating of clay mineral illite”, says Knies.
All the dated samples show that intensive and widespread chemical weathering occurred under hothouse conditions during the late Triassic. The bedrock was slowly transformed, and the transformation co-occurred with emerging volcanic activity.
Bedrock eventually removes CO2
The hothouse conditions of this mass extinction caused oceans to eventually become depleted of oxygen, and thus become unbearable to live in. But weathering of silicate in the bedrock of Pangea, and subsequent formation of carbonate, tied up the CO2 into the minerals, slowly removing the greenhouse gas from the atmosphere.
“Transport of loose material towards the ocean may have stimulated both end of life through formation of oxygen-depleted waters as well as recovery of life through stabilization of the greenhouse effect through CO2 removal.” says Knies.
Reference:
Ola Fredin, Giulio Viola, Horst Zwingmann, Ronald Sørlie, Marco Brönner, Jan-Erik Lie, Else Margrethe Grandal, Axel Müller, Annina Margreth, Christoph Vogt, Jochen Knies. The inheritance of a Mesozoic landscape in western Scandinavia. Nature Communications, 2017; 8: 14879 DOI: 10.1038/ncomms14879
This is a spiny acritarch from the Doushantuo biota imaged using synchrotron tomography. The affinities of these fossils are unknown. Credit: John Cunningham, University of Bristol
A team of researchers, led by the University of Bristol, has uncovered that ancient fossils, thought to be some of the world’s earliest examples of animal remains, could in fact belong to other groups such as algae.
The Weng’an Biota is a fossil Konservat-Lagerstätte in South China that is around 600 million-years-old and provides an unparalleled snapshot of marine life during the interval in which molecular clocks estimate that animal groups had evolved.
However, all fossil evidence from this time has met with controversy.
Dr John Cunningham from the University of Bristol’s School of Earth Sciences, said: “Dated at around 600 million years old, these rocks preserve an assemblage of microscopic fossils, perfectly-aged to be candidates for the oldest evidence of animal life.
“These fossils aren’t recognisable as remains of fully grown animals, but some resemble embryos, ranging from single cells to clusters of thousands.
“The preservation is so exquisite, that even sub-cellular structures can be identified, including possible nuclei.
Dr Kelly Vargas, a postdoctoral researcher from the University of Bristol and one of the paper’s co-authors, said: “But with the lack of adult forms that could indicate their identity, paleontologists have to rely on information from cellular anatomy to determine whether these tiny fossils belong to animals or to a different group.”
Now scientists have reviewed all the evidence pointing towards an animal identity of the Weng’an fossils.
Their findings have revealed that none of the characteristics previously used to define the fossils as animals are actually unique to animals alone, opening up the possibility for alternative identifications.
Professor Philip Donoghue, another Bristol co-author, added: “Many proponents of animal affinity have argued that the Y-shaped junctions between the cells in the fossils are an important animal character, but this a feature common to many multicellular groups, including algae, that are very distant relatives of animals.”
Dr Cunningham added: “It could be that the fossils belong to other groups, such as algae, and these possibilities need to be investigated carefully.”
Despite these results, paleontologists are continuing to make new discoveries from the Weng’an Biota, and these are helping to refine our knowledge of evolution during the Ediacaran.
Dr Cunningham concluded: “It might be possible that we’ll find definite animals in the Doushantuo Formation, but it’ll be like finding a needle in a haystack, or should we say an embryo in a really, really big quarry.”
Reference:
John A. Cunningham, Kelly Vargas, Zongjun Yin, Stefan Bengtson, Philip C. J. Donoghue. The Weng’an Biota (Doushantuo Formation): an Ediacaran window on soft-bodied and multicellular microorganisms. Journal of the Geological Society, 2017; jgs2016-142 DOI: 10.1144/jgs2016-142
This is a Chenanisaurus barbaricus. Credit: Dr Nick Longrich, Milner Centre for Evolution, University of Bath
One of the last dinosaurs living in Africa before their extinction 66 million years ago has been discovered in a phosphate mine in northern Morocco. A study of the fossil, led by the Milner Centre for Evolution at the University of Bath, suggests that following the breakup of the supercontinent Gondwana in the middle of the Cretaceous period, a distinct dinosaur fauna evolved in Africa.
The new species, Chenanisaurus barbaricus, was of one of the last dinosaurs on Earth and among those species wiped out when an asteroid hit 66 million years ago
It is the smaller African contemporary of the North American T. rex
Fossil is evidence of distinct fauna in southern hemisphere at this time
Almost nothing is known about the dinosaurs that lived in Africa at the end of the Cretaceous period 66 million years ago, just before they were wiped out by the impact of a giant asteroid. At this time sea levels were high, and so most of the fossils come from marine rocks.
Among these are the phosphate deposits of Morocco — remains of an ancient seabed, laid down 66 million years ago. The phosphate is harvested from vast strip mines and is used in everything from fertilizer to cola drinks.
Last year, Dr Nick Longrich, from the Milner Centre for Evolution and the Department of Biology & Biochemistry at the University of Bath, studied a rare fragment of a jaw bone that was discovered in the mines at Sidi Chennane in the Oulad Abdoun Basin, Morocco. In collaboration with colleagues based in Morocco, France, and Spain, Longrich identified it as belonging to an abelisaur.
Abelisaurs were two-legged predators like T. rex and other tyrannosaurs, but with a shorter, blunter snout, and even tinier arms. While the tyrannosaurs dominated in North America and Asia, the abelisaurs were the top predators at the end of the Cretaceous in Africa, South America, India, and Europe.
Dr Longrich explained: “This find was unusual because it’s a dinosaur from marine rocks — it’s a bit like hunting for fossil whales, and finding a fossil lion. It’s an incredibly rare find — almost like winning the lottery. But the phosphate mines are so rich, it’s like buying a million lottery tickets, so we actually have a chance to find rare dinosaurs like this one.”
“We have virtually no dinosaur fossils from this time period in Morocco — it may even be the first dinosaur named from the end-Cretaceous in Africa. It’s also one of the last dinosaurs in Africa before the mass extinction that wiped out the dinosaurs.
“It’s an exciting find because it shows just how different the fauna was in the Southern hemisphere at this time.”
Named Chenanisaurus barbaricus, the newly discovered dinosaur stood on two legs and had stumpy arms. Dr Longrich added: “Abelisaurs had very short arms. The upper arm bone is short, the lower arm is shorter, and they have tiny little hands.”
The teeth from the fossil were worn as if from biting into bone, suggesting that like T. rex, Chenanisaurus was a predator. However, unlike the partially feathered T. rex, Chenanisaurus had only scales, its brain was smaller, and its face was shorter and deeper.
The research project was carried out as part of an international scientific collaboration that is helping create and study paleontology collections in Morocco with the aim of conserving the country’s rich fossil heritage. The specimens used for this study are conserved in the Office Chérifien de Phosphates paleontological collection in Morocco.
Reference:
Nicholas R. Longrich, Xabier Pereda-Suberbiola, Nour-Eddine Jalil, Fatima Khaldoune, Essaid Jourani. An abelisaurid from the latest Cretaceous (late Maastrichtian) of Morocco, North Africa. Cretaceous Research, 2017; 76: 40 DOI: 10.1016/j.cretres.2017.03.021
A fungus gnat trapped in amber some 45-55 million years ago is carrying on the upper portion of its severed leg a pollen sac from an orchid — the oldest evidence of the flower ever discovered. Credit: George Poinar, Oregon State University
The orchid family has some 28,000 species — more than double the number of bird species and quadruple the mammal species. As it turns out, they’ve also been around for a while.
A newly published study documents evidence of an orchid fossil trapped in Baltic amber that dates back some 45 million years to 55 million years ago, shattering the previous record for an orchid fossil found in Dominican amber some 20-30 million years old.
Results of the discovery have just been published in the Botanical Journal of the Linnean Society.
“It wasn’t until a few years ago that we even had evidence of ancient orchids because there wasn’t anything preserved in the fossil record,” said George Poinar, Jr., a professor emeritus of entomology in the College of Science at Oregon State University and lead author on the study. “But now we’re beginning to locate pollen evidence associated with insects trapped in amber, opening the door to some new discoveries.”
Orchids have their pollen in small sac-like structures called pollinia, which are attached by supports to viscidia, or adhesive pads, that can stick to the various body parts of pollinating insects, including bees, beetles, flies and gnats. The entire pollination unit is known as a pollinarium.
In this study, a small female fungus gnat was carrying the pollinaria of an extinct species of orchid when it became trapped in amber more than 45 million years ago. The pollinaria was attached to the base of the gnat’s hind leg. Amber preserves fossils so well that the researchers could identify a droplet of congealed blood at the tip of the gnat’s leg, which had been broken off shortly before it was entombed in amber.
At the time, all of the continents hadn’t even yet drifted apart.
The fossil shows that orchids were well-established in the Eocene and it is likely that lineages extended back into the Cretaceous period. Until such forms are discovered, the present specimen provides a minimum date that can be used in future studies determining the evolutionary history and phylogeny of the orchids.
How the orchid pollen in this study ended up attached to the fungus gnat and eventually entombed in amber from near the Baltic Sea in northern Europe is a matter of speculation. But, Poinar says, orchids have evolved a surprisingly sophisticated system to draw in pollinating insects, which may have led to the gnat’s demise.
“We probably shouldn’t say this about a plant,” Poinar said with a laugh, “but orchids are very smart. They’ve developed ways to attract little flies and most of the rewards they offer are based on deception.”
Orchids use color, odor and the allure of nectar to draw in potential pollinating insects. Orchids will emit a scent that suggests to hungry insects the promise of food, but after entering the flower they will learn that the promise of nourishment was false.
Likewise, female gnats may pick up a mushroom-like odor from many orchids, which attracts them as a place to lay their eggs because the decaying fungal tissue is a source of future nutrition. Alas, again it is a ruse. In frustration, they may go ahead and lay their eggs, dooming their offspring to a likely death from a lack of food.
Finally, male insects are attracted by the ersatz scent of female flies and they actually will attempt to copulate with a part of the orchid they think is a potential mate.
All three of these processes are based on deception, Poinar said, and they all have the same end result.
“Though the deception works in different ways, the bottom line is that the orchid is able to draw in pollinating insects, which unwittingly gather pollen that becomes attached to their legs and other body parts, and then pass it on to the next orchid flowers that lure them in,” he said.
“Orchids are, indeed, pretty smart.”
Reference:
George Poinar, Finn N. Rasmussen. Orchids from the past, with a new species in Baltic amber. Botanical Journal of the Linnean Society, 2017; 183 (3): 327 DOI: 10.1093/botlinnean/bow018
This is a map of recent Hawaiian volcanism, highlighting the Loa and Kea tracks. Credit: Tim Jones, ANU
A study led by The Australian National University (ANU) has solved the 168-year-old mystery of how the world’s biggest and most active volcanoes formed in Hawaii.
The study found that the volcanoes formed along twin tracks due to a shift in the Pacific Plate’s direction three million years ago.
Lead researcher Tim Jones from ANU said scientists had known of the existence of the twin volcanic tracks since 1849, but the cause of them had remained a mystery until now.
“The discovery helps to better reconstruct Earth’s history and understand part of the world that has captivated people’s imagination,” said Mr Jones, a PhD student from the ANU Research School of Earth Sciences (RSES).
“The analysis we did on past Pacific Plate motions is the first to reveal that there was a substantial change in motion 3 million years ago. It helps to explain the origin of Hawaii, Earth’s biggest volcanic hotspot and one of the most popular tourist destinations in the world.”
Twin volcanic tracks exist in other parts of the Pacific, including Samoa, and the study found that these also emerged three million years ago.
Mr Jones said this kind of volcanic activity was surprising because it occurred away from tectonic plate boundaries, where most volcanoes are found.
“Heat from the Earth’s core causes hot columns of rock, called mantle plumes, to rise under tectonic plates and produce volcanic activity on the surface,” he said.
“Mantle plumes have played a role in mass extinctions, the creation of diamonds and the breaking up of continents.”
Co-researcher Dr Rhodri Davies from RSES said the twin volcanic tracks emerged because the mantle plume was out of alignment with the direction of the plate motion.
“Our hypothesis predicts that the plate and the plume will realign again at some stage in the future, and the two tracks will merge to form a single track once again,” Dr Davies said.
“Plate shifts have been occurring constantly, but irregularly, throughout Earth’s history. Looking further back in time we find that double tracks are not unique to young Hawaiian volcanism — indeed, they coincide with other past changes in plate motion.”
Hawaii sits at the south-eastern limit of a chain of volcanoes and submerged seamounts which get progressively older towards the north west.
The researchers worked with the National Computational Infrastructure at ANU to model the Pacific Plate’s change in direction and formation of the twin volcanic tracks through Hawaii.
Reference:
T. D. Jones, D. R. Davies, I. H. Campbell, G. Iaffaldano, G. Yaxley, S. C. Kramer, C. R. Wilson. The concurrent emergence and causes of double volcanic hotspot tracks on the Pacific plate. Nature, 2017; DOI: 10.1038/nature22054
Note: The above post is reprinted from materials provided by Australian National University.