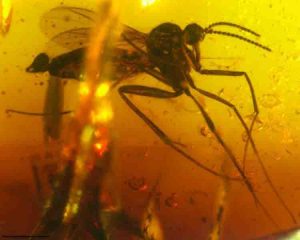
This is Palaeognoriste orientale, a new species of Lygistorrhinidae in Indian amber, which has its closest relatives in European Baltic amber. Scale bar: 0.5 mm. Credit: Frauke Stebner; CC BY 4.0
A new species of fungus gnat in Indian amber closely resembles its fossil relatives from Europe, disproving the concept of a strongly isolated Indian subcontinent.
Researchers have identified three new species of insects encased in Cambay amber dating from over 54 million years ago. In a new study published by PeerJ, researchers describe the new species of fungus gnats, which provide further clues to understanding India’s past diversity and geological history.
The most interesting finding from the discovery of these new gnat species is related to India´s plate tectonic history: Palaeognoriste orientale in Cambay amber belongs to a group that has previously been reported from slightly younger Baltic amber only. The species in Indian amber closely resembles its fossil relatives from Europe and therefore adds further evidence to regular faunal exchange between India and Europe while disproving the concept of a strongly isolated Indian subcontinent.
India, which was one part of the ancient supercontinent, Gondwana, started separating and heading north about 130 million years ago, finally collided with Asia some 59 million years ago, resulting in the Himalayan mountains. The time of formation of this amber (or at least its burial) is most likely around the time of collision of the Indian subcontinent with Asia.
The fossils of long beaked fungus gnats (Lygistorrhinidae) found in the Cambay amber are an exciting discovery. The name of this group refers to one of their most conspicuous characters: an elongated proboscis, which is presumably for feeding from flowers. This small family of tropical flies is known by only seven fossil and eight living genera. Given the rareness of this group Indian amber has revealed a surprising diversity with three species in three different fossil and modern genera. This even exceeds the number of known species in the well-studied Baltic amber, from which only two species are reported.
Cambay amber from India has only been studied for a few years, but is already providing an important role in uncovering secrets regarding the origins of India´s fauna. For many years, the well-established theory stated that India formed an isolated continent during its drift, allowing a highly endemic biota to develop. However, flies and other insects entrapped in Indian amber continue to reveal faunal connections to different epochs and regions of the world.
Though the exact mechanisms of faunal exchange remain unclear so far, dispersal might have been facilitated by an island chain system between India and Europe, as has already been suggested for biting midges.
Reference:
Frauke Stebner, Hukam Singh, Jes Rust, David A. Grimaldi. Lygistorrhinidae (Diptera: Bibionomorpha: Sciaroidea) in early Eocene Cambay amber. PeerJ, 2017; 5: e3313 DOI: 10.7717/peerj.3313
Note: The above post is reprinted from materials provided by PeerJ.
The resurrection of vanished species — through cutting-edge technologies such as gene-editing — should be targeted towards recently extinct species rather than ancient ones, according to a leading University of Otago conservation biologist.
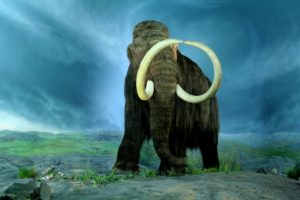
In a guest editorial newly published online in the journal Functional Ecology, Professor Philip Seddon of the University’s Department of Zoology suggests that long-gone species such as the woolly mammoth would not be the best focus for de-extinction efforts.
Professor Seddon says the prospect of resurrecting species through cloning or genetic reconstruction through tools such as CRISPR gene-editing has caught the imagination of scientists and the public alike.
“However, while the idea of resurrecting mammoths, for example, might hold a ‘wow-factor’ appeal, efforts would likely be better directed instead towards species where the conservation benefits are clearer.
“The ecological niches in which mammoths — or moa for instance — once lived, no longer exist in any meaningful way. If we were to bring such species back, apart from just as scientific curios, these animals would likely be inherently maladapted to our modern eco-systems.”
Instead, using cloning techniques to re-establish ‘proxies’ of species that have recently become extinct should be the focus, along with determined efforts to prevent endangered species dying out in the first place, he says.
“The money and considerable effort required to resurrect, reintroduce, and manage in the wild, viable populations of once-extinct species means there will inevitably be fewer resources available to manage threats facing the very many species that are currently at risk of dying out, but could still be saved.”
Professor Seddon suggests that de-extinction projects will inevitably be pursued.
“The reality of the idea is too sexy to ignore, and it could be driven by aesthetic, commercial, scientific, or some other hitherto unanticipated imperatives and motivations,” he suggests.
Commenting on the de-extinction papers appearing in the special issue of Functional Ecology, Professor Seddon concludes that there are two principal messages arising from the articles.
“The first is that the risks and the uncertainties involved will be hugely reduced, and hence the likelihood of achieving a conservation benefit from the production and release of resurrected species will be enhanced, if de-extinction candidates are drawn from the most recent extinctions.
“Second, and perhaps most importantly, extinction of any species marks a significant threshold that once crossed, cannot be fully reversed, despite the apparent promise of powerful new technologies.
“Our primary conservation objective must therefore be, as it always has been, avoiding species loss, and one the most significant contributions to be made by ‘de-extinction technology’ might well be to prevent extinctions in the first place.”
Reference:
Philip J. Seddon. The ecology of de-extinction. Functional Ecology, 2017; 31 (5): 992 DOI: 10.1111/1365-2435.12856
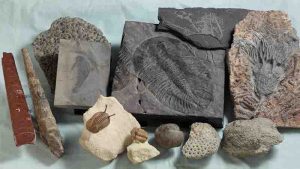
These are Ordovician-Silurian marine fossils from the museum of Tohoku University. Credit: Kunio Kaiho
Researchers in the USA and Japan say they may have found the cause of the first mass extinction of life.
There have been five mass extinctions since the divergent evolution of early animals 600 -450 million years ago. The cause of the third and fourth was volcanic activity, while an asteroid impact led to the fifth. But triggers of the first and second mass extinctions had, until now, been unknown.
The first mass extinction occurred at the end of the Ordovician. This age is between the divergence of the Ordovician and land invasion of vascular land plant and animals. Animals in the Ordovician-Silurian comprised marine animals like corals, trilobites, sea scorpion, orthoceras, brachiopods, graptolite, crinoid and jawless fish. Approximately 80% of species disappeared at the end of the Ordovician.
A team led by Dr. David S. Jones of Amherst College and Professor Kunio Kaiho of Tohoku University, looked into possible triggers of the first mass extinction. They took sedimentary rock samples from two places — North America and southern China — and analyzed the mercury (Hg) in them. They found Hg enrichments coinciding with the mass extinction in both areas.
This, they believe, is the product of large volcanic eruptions because Hg anomaly was also observed in other large igneous province volcanisms.
Huge volcanic eruptions can produce sulfate aerosols in the stratosphere. Sulfate aerosols are strong, light-reflecting aerosols, and cause global cooling. This rapid climate change is believed to be behind the loss of marine creatures.
Kaiho’s team is now studying the second mass extinction in the hopes of further understanding the cause and processes behind it.
Reference:
David S. Jones, Anna M. Martini, David A. Fike, Kunio Kaiho. A volcanic trigger for the Late Ordovician mass extinction? Mercury data from south China and Laurentia. Geology, 2017; G38940.1 DOI: 10.1130/G38940.1
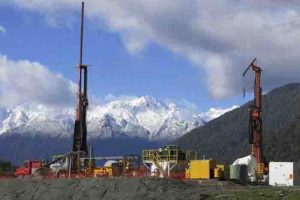
This Oct. 3, 2014 photo shows the drilling site of an earthquake fault near Franz Josef Glazier on the South Island in New Zealand. The scientists found the water in the Alpine Fault was much hotter than expected, and could potentially be harnessed to generate electricity or provide direct heating in industries like dairy farming. (John Townend/Victoria University via AP)
When researchers in New Zealand drilled deep into an earthquake fault, they stumbled upon a discovery they say could provide a significant new energy source for the South Pacific nation.
The scientists found the water in the Alpine Fault was much hotter than expected, and could potentially be harnessed to generate electricity or provide direct heating in industries like dairy farming.
The finding was surprising because geothermal energy is usually associated with volcanic activity, but there are no volcanoes where the scientists drilled. Because the Alpine Fault stretches for hundreds of kilometers (miles) like a spine along the country’s South Island, the energy source could be enormous.
Led by Victoria University of Wellington professor Rupert Sutherland, the study was published Thursday in the journal Nature.
Sutherland said the intention of the study near the popular tourist destination of Franz Josef Glacier was to collect rock cores and install monitoring equipment rather than gauge water temperatures, but researchers are excited about their unexpected findings.
“Economically, it could be very significant for New Zealand,” Sutherland told The Associated Press in an interview. “It’s a totally new paradigm.”
In their study, the scientists say they believe two actions are creating the hot water.
First, they say, previous earthquakes have moved hot rocks up from deep within the Earth into the mountains along the fault line.
Second, the shaking has broken up the rocks, allowing rain water and snow melt to quickly percolate through the hot interior of the mountains, which concentrates the heat beneath the valleys.
Sutherland said they found the water in the fault reached 100 degrees Celsius (212 Fahrenheit) at a depth of 630 meters (2,100 feet). Water typically gets progressively hotter with depth, but under normal conditions it doesn’t reach that temperature until about 3 kilometers (2 miles) underground.
One hundred Celsius is boiling point on the Earth’s surface, although water doesn’t boil underground because it remains under pressure, much like the liquid inside a pressure cooker.
The Alpine Fault is among the most active faults in the world. It typically creates large earthquakes about once every 300 years, and scientists figure there is about a one-third chance it will rupture again in the next few decades. The resulting quake could devastate some New Zealand towns, although the fault is not located near any large cities.
Sutherland said the discovery of the hot water doesn’t have any bearing on predicting when the next quake might hit.
He said before any commercial ventures begin, scientists will need to determine the extent of the hot water, what purposes it could be used for, how easy it is to extract, and whether it can be done safely. He said he didn’t think removing water from the fault would risk triggering a quake but scientists would need to study that question as well.
New Zealand already generates about 15 percent of its electricity from geothermal sources, most of it from the Taupo volcanic zone in the central North Island. Sutherland said the declining coal mining industry in the South Island could provide needed expertise, engineering and infrastructure for any new geothermal ventures on the Alpine Fault.
He said the hot water could potentially be used by the dairy industry as a heating source to dry milk. Milk powder is one of the nation’s largest exports.
Dave Craw, a professor at New Zealand’s University of Otago who was not involved in the study, said that in a global context, the high temperatures found in the fault are very unusual.
“The famous San Andreas Fault of California was drilled in a similar way to this New Zealand borehole, and the temperatures and thermal gradient encountered there were much lower than the Alpine Fault,” Craw wrote in an email. “The Alpine Fault is a spectacular thermal anomaly for an area without active volcanic activity.”
Bill Ellsworth, a professor at Stanford University who helped review safety aspects of the study but who was not involved in the research, said that because elevated fluid pressures weaken faults, the study’s findings also have important implications for understanding the workings of quakes on similar faults around the world.
Note: The above post is reprinted from materials provided by Associated Press.
“1964 Quake: The Great Alaska Earthquake” is an eleven minute video highlighting the impacts and effects of America’s largest recorded earthquake. It is an expanded version of the four minute video “Magnitude 9.2”. Both were created as part of USGS activities acknowledging the fifty year anniversary of the quake on March 27, 2014. The video features USGS geologist George Plafker, who, in the 1960’s, correctly interpreted the quake as a subduction zone event.
This was a great leap forward in resolving key mechanisms of the developing theory of plate tectonics. Landslide impacts and the extreme tsunami threat posed by these quakes are also discussed. Loss of life and destruction from the earthquake and accompanying tsunamis was the impetus for things like the NOAA Tsunami Warning Centers and the USGS Earthquake Hazards Program.
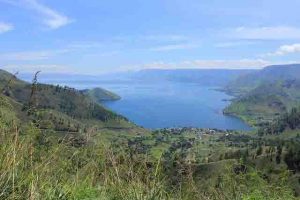
Southward view of the northern third of the Lake Toba depression produced by the supereruption 74,000 years ago. Credit: Oregon State University
The rare but spectacular eruptions of supervolcanoes can cause massive destruction and affect climate patterns on a global scale for decades – and a new study has found that these sites also may experience ongoing, albeit smaller eruptions for tens of thousands of years after.
In fact, Oregon State University researchers were able to link recent eruptions at Mt. Sinabung in northern Sumatra to the last eruption on Earth of a supervolcano 74,000 years ago at the Toba Caldera some 25 miles away.
The findings are being reported this week in the journal Nature Communications.
“The recovery from a supervolcanic eruption is a long process, as the volcano and the magmatic system try to re-establish equilibrium – like a body of water that has been disrupted by a rock being dropped into it,” said Adonara Mucek, an Oregon State doctoral candidate and lead author on the study.
“At Toba, it appears that the eruptions continued for at least 15,000 to 20,000 years after the supereruption and the structural adjustment continued at least until a few centuries ago – and probably is continuing today. It is the magmatic equivalent to aftershocks following an earthquake.”
This is the first time that scientists have been able to pinpoint what happens following the eruption of a supervolcano. To qualify as a supervolcano, the eruption must reach at least magnitude 8 on the Volcano Explosivity Index, which means the measured deposits for that eruption are greater than 1,000 cubic kilometers, or 240 cubic miles.
When Toba erupted, it emitted a volume of magma 28,000 times greater than that of the 1980 eruption of Mount St. Helens in Washington state. It was so massive, it is thought to have created a volcanic winter on Earth lasting years, and possibly triggering a bottleneck in human evolution.
Other well-known supervolcano sites include Yellowstone Park in the United States, Taupo Caldera in New Zealand, and Campi Flegrei in Italy.
“Supervolcanoes have lifetimes of millions of years during which there can be several supereruptions,” said Shanaka “Shan” de Silva, an Oregon State University volcanologist and co-author on the study. “Between those eruptions, they don’t die. Scientists have long suspected that eruptions continue after the initial eruption, but this is the first time we’ve been able to put accurate ages with those eruptions.”
Previous argon dating studies had provided rough ages of eruptions at Toba, but those eruption dates had too much range of error, the researchers say. In their study, the OSU researchers and their colleagues from Australia, Germany, the United States and Indonesia were able to decipher the most recent volcanic history of Toba by measuring the amount of helium remaining in zircon crystals in erupted pumice and lava.
The helium remaining in the crystals is a remnant of the decaying process of uranium, which has a well-understood radioactive decay path and half-life.
“Toba is at least 1.3 million years old, its supereruption took place about 74,000 years ago, and it had at least six definitive eruptions after that – and probably several more,” Mucek said. “The last eruption we have detected occurred about 56,000 years ago, but there are other eruptions that remain to be studied.”
The researchers also managed to estimate the history of structural adjustment at Toba using carbon-14 dating of lake sediment that has been uplifted up to 600 meters above the lake in which they formed. These data show that structural adjustment continued from at least 30,000 years ago until 2,000 years ago – and may be continuing today.
The study also found that the magma in Toba’s system has an identical chemical fingerprint and zircon crystallization history to Mt. Sinabung, which is currently erupting and is distinct from other volcanoes in Sumatra. This suggests that the Toba system may be larger and more widespread than previously thought, de Silva noted.
“Our data suggest that the recent and ongoing eruptions of Mt. Sinabung are part of the Toba system’s recovery process from the supereruption,” he said.
The discovery of the connection does not suggest that the Toba Caldera is in danger of erupting on a catastrophic scale any time soon, the researchers emphasized. “This is probably ‘business as usual’ for a recovering supervolcano,” de Silva said. It does emphasize the importance of having more sophisticated and frequent monitoring of the site to measure the uplift of the ground and image the magma system, the researchers note.
“The hazards from a supervolcano don’t stop after the initial eruption,” de Silva said. “They change to more local and regional hazards from eruptions, earthquakes, landslides and tsunamis that may continue regularly for several tens of thousands of years.
“Toba remains alive and active today.”
As large as the Toba eruption was, the reservoir of magma below the caldera is much, much greater, the researchers say. Studies at other calderas around Earth, such as Yellowstone, have estimated that there is between 10 and 50 times as much magma than is erupted during a supereruption.
Reference:
Adonara E. Mucek et al, Post-supereruption recovery at Toba Caldera, Nature Communications (2017). DOI: 10.1038/ncomms15248
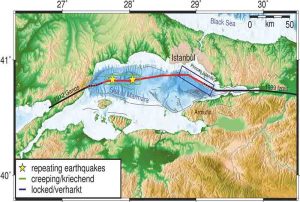
Marmara Sea region in northwestern Turkey with the North Anatolian Fault Zone (NAFZ) separating Eurasia from Anatolian. The offshore Marmara fault where a major earthquake is overdue is indicated by the red line. The black lines to either side are the two last major ruptures of the region, the 1912 Ganos and the 1999 Izmit earthquakes. The Marmara section has not produced a large earthquake since 1766 but is know to rupture every ~250 years based on historical records. The yellow stars mark the repeating earthquakes found in the now published study indicating fault creep (green rectangle) while the fault portion offshore of Istanbul (blue rectangle) is locked. Credit: Christopher Wollin/GFZ
The city of Istanbul is focus of great concern for earthquake researchers. This 15-million metropole is situated very close to the so-called North Anatolian Fault Zone which runs just outside of the city gates below the Marmara Sea. Here in the underground there is a constant build-up of energy which results from an interlocking of the tectonic plates causing plate movement to come to a halt until a great tremor releases this energy. Scientists, therefore, reckon with an earthquake with a magnitude of 7 or greater in this region in the coming years.
The extent of such seismic threat to this Turkish city of Istanbul actually depends on how strongly the plates are entangled and on the exact nucleation point of the earthquake. A team led by Marco Bohnhoff from the GFZ German Research Centre for Geoscience now presents a study indicating that the next major earthquake is more likely to originate in Istanbul’s eastern Marmara Sea. “This is both good news and bad news for the city with over 15 million inhabitants. The good news: “The rupture propagation will then run eastwards i.e. away from the city”, explains the researcher. “The bad news is that there will only be a very short early warning phase of a few seconds.” Early warning times are extremely important in order to switch traffic lights to red, to block tunnels and bridges or to shut down critical infrastructure. The research results are now published in the scientific journal “Geophysical Journal International”.
The estimations presented by Marco Bohnhoff and his team are based on the analysis of numerous small quakes along the Marmara fault. Results have shown that the degree of locking in the western part of the fracture zone is lower and that the two tectonic plates are creeping past one another at a very slow rate. During this process small tremors of the same signature, so-called “repeaters”, occur at distinct recurrence times. Further east, close to Istanbul, however, repeaters have not been observed and the tectonic plates appear to be completely locked here. This leads to a build-up of tectonic energy and increases the probability of a large earthquake there.
Such observations were possible due to a new high-precision seismicity catalog for the region. For this purpose, the researchers have thoroughly evaluated the earthquake activity by combining the two major Turkish Earthquake Measurement Networks with measurement data from the GFZ Plate Boarder Observatory within the framework of a German-Turkish cooperation project. “In this way we have found recurring earthquakes below the western Marmara Sea” says Bohnhoff. “From this we deduce that below the western Marmara Sea the two tectonic plates (for the most part—25-75%) are moving slowly past each other thus accumulating less energy than if they were completely locked.”
And what will happen if it actually comes to the feared strong earthquake below the western Marmara Sea? “In such a case there would likewise be good news and bad news,” says Bohnhoff. Good would be a somewhat longer early warning period, bad would be the fact that the rupture propagation would then take place in the direction of Istanbul resulting in more severe ground shaking than if the origin was further east. However, the current data obtained suggests the opposite: an earthquake with an epicenter at the gates of the city, which would allow the people only very little time to find protection, but which would trigger less powerful ground movements.
Reference:
Marco Bohnhoff et al, Repeating Marmara Sea Earthquakes: Indication for fault creep, Geophysical Journal International (2017). DOI: 10.1093/gji/ggx169
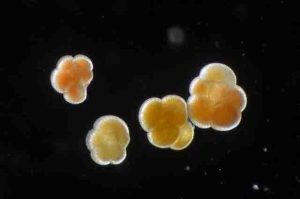
N. dutertrei grown in a laboratory. Credit: Oregon State University
Scientists cannot travel into the past to take the Earth’s temperature so they use proxies to discern past climates, and one of the most common methods for obtaining such data is derived from the remains of tiny marine organisms called foraminifera found in oceanic sediment cores.
These “forams,” as they are called, are sand-grained-sized marine protists that make shells composed of calcite. When they grow, they incorporate magnesium from seawater into their shells. When ocean temperatures are warmer, forams incorporate more magnesium; less when the temperatures are cooler. As a result, scientists can tell from the amount of magnesium what the temperature of the seawater was thousands, even millions of years ago. These proxies are important tools for understanding past climate.
However, studies of live forams reveal that shell magnesium can vary, even when seawater temperature is constant. A new study published this week in the journal Nature Communications affirms that magnesium variability is linked to the day/night (light/dark) cycle in simple, single-celled forams and extends the findings to more complex multi-chambered foraminifera.
To understand how forams develop and what causes magnesium variability, the team of scientists from Oregon State, University of California, Davis, University of Washington and Pacific Northwest National Laboratory grew the multi-chambered species, Neogloboquadrina dutertrei, in a laboratory under highly controlled conditions. They used high-resolution imaging techniques to “map” the composition of these lab-grown specimens.
“We found that high-magnesium is precipitated at night, and low-magnesium is added to the shells during the day, similar to the growth patterns of the single-chambered species,” said Jennifer S. Fehrenbacher, an ocean biogeochemist and paleoceanographer at Oregon State University and lead author on the study. “This confirms that magnesium variability is driven by the same mechanism in two species with two different ecological niches. We can now say with some level of confidence that magnesium-banding is intrinsically linked to shell formation processes as opposed to other environmental factors.
“The variability in magnesium content of the shells doesn’t change the utility of forams as a proxy for temperature. Rather, our results give us new insights into how these organisms build their shells and lends confidence to their utility as tools for reconstructing temperatures.”
Reference:
Jennifer S. Fehrenbacher et al. Link between light-triggered Mg-banding and chamber formation in the planktic foraminifera Neogloboquadrina dutertrei, Nature Communications (2017). DOI: 10.1038/ncomms15441
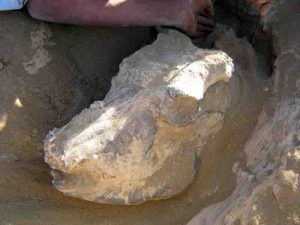
This wildebeest fossil skull was excavated at the Ledi-Geraru research site, Ethiopia. Credit: Josh Robinson
In 2013, an ASU research team found the oldest known evidence of our own genus, Homo, at Ledi-Geraru in the lower Awash Valley of Ethiopia. A jawbone with teeth was dated to 2.8 million years ago, about 400,000 years earlier than previously known fossils of Homo. After the discovery, attention turned to reconstructing the environment of this ancient human ancestor to understand why there and why then.
But how do you re-create specific environments from millions of years ago to understand where our ancient ancestors lived?
Paleoanthropologists use animal fossils like proxy time machines to re-create what past environments were like. If animal fossils indicate browsing on tree leaves, like giraffes and monkeys do, then they know that the environment was characterized by woody trees and significant rainfall. If the fossils suggest grazing on grass, as many antelopes do, then the environments would have been open and arid with grassy plains.
Scientists have long suggested that global cooling and the spread of grassy environments set the stage for the beginnings of Homo.
“A growing body of evidence has hinted at this connection,” said Joshua Robinson, postdoctoral researcher with the Institute of Human Origins, “but, until now, we had no direct environmental data for the origins of Homo now that its been pushed back in time.”
Following the discovery of the Ledi-Geraru jaw, an intensive environmental study of the eastern African Plio-Pleistocene — from around 3.5 million years ago to 1.0 million years ago — was conducted in order to investigate these long-standing hypotheses.
The study, coauthored by ASU researchers Joshua Robinson, John Rowan, Christopher Campisano and Kaye Reed with University of South Florida researcher Jonathan Wynn, in the journal Nature Ecology and Evolution, offers the first comprehensive assessment of the ecological contexts of the transition from Australopithecus to Homo.
The time period around 2.8 million years ago is particularly important for the human fossil record of eastern Africa. Thirty kilometers to the west of Ledi-Geraru is Hadar, where the famous “Lucy” fossil of Australopithecus afarensis was found in 1974 by ASU professor Donald Johanson and dated to 3.2 million years ago. The geological sequence at Hadar, however, ends around 2.95 million years ago and is thus missing the important transitional period between the end of Australopithecus and earliest Homo.
Using stable isotopes of fossil teeth, the researchers found that early Homo at Ledi-Geraru was indeed associated with open and arid grassy environments. Results show that almost all animals found with early Homo at Ledi-Geraru fed on grass, including some that consumed substantial amounts of tree leaves prior to 2.8 million years ago. The diet of early Homo at Ledi-Geraru, however, appears to be indistinguishable from that of the earlier Australopithecus, implying that a change in diet is not a characteristic of the origins of Homo.
“We weren’t necessarily surprised that the diet of early Homo was similar to Australopithecus,” said Chris Campisano, research associate with the Institute of Human Origins and associate professor in the School of Human Evolution and Social Change. “But we were surprised that its diet didn’t change when those of all the other animals on the landscape did.”
Placing Ledi-Geraru in a regional context indicates that eastern Africa environments at this time were not homogeneous. The ecology of the lower Awash Valley shifted from a wet and wooded environment at the time of the disappearance of Australopithecus around three million years ago to a dry and open landscape at the time of early Homo 2.8 million years ago.
“Although Lucy’s species persisted through many environmental changes in the Hadar sequence,” School of Human Evolution and Social Change graduate student John Rowan said, “it seems the species was unable to persist as really open environments spread in the Afar during the late Pliocene.”
Furthermore, these results indicate that the spread of grassy environments at Ledi-Geraru occurred earlier than in the Turkana Basin of Kenya and Ethiopia, which continued to have wooded regions that supported browsers and other mammals that fed on both trees and grasses.
“By using several different habitat proxies, we were able to refine previous ecosystem reconstructions in each basin so that we were able to identify the details of the spread of grasslands,” said Kaye Reed, President’s Professor and director of the School of Human Evolution and Social Change. Reed is also a research associate with the Institute of Human Origins. “We are planning to compare other East African hominin sites using these same methodologies.”
Reference:
Joshua R. Robinson, John Rowan, Christopher J. Campisano, Jonathan G. Wynn, Kaye E. Reed. Late Pliocene environmental change during the transition from Australopithecus to Homo. Nature Ecology & Evolution, 2017; 1: 0159 DOI: 10.1038/s41559-017-0159
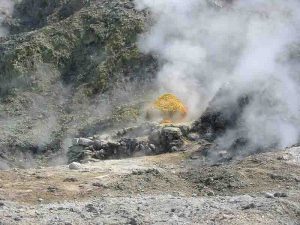
Sulfur at the Solfatara crater “Campi Flegrei”. Credit: Donar Reiskoffer
The Campi Flegrei volcano in southern Italy may be closer to an eruption than previously thought, according to new research by UCL and the Vesuvius Observatory in Naples.
The volcano has been restless for 67 years, with two-year periods of unrest in the 1950s, 1970s and 1980s causing small, local earthquakes and ground uplift. Similar unrest occurred over 500 years ago, when it took a century to build up to an eruption in 1538.
The authors of the study, published today in Nature Communications, used a new model of volcano fracturing developed at UCL to investigate whether Campi Flegrei may again be preparing to erupt.
They found that the unrest since the 1950s has had a cumulative effect, causing a build-up of energy in the crust and making the volcano more susceptible to eruption. Previously, it was generally thought that the energy needed to stretch the crust was eventually lost after each period of unrest.
“By studying how the ground is cracking and moving at Campi Flegrei, we think it may be approaching a critical stage where further unrest will increase the possibility of an eruption, and it’s imperative that the authorities are prepared for this,” explained Dr Christopher Kilburn, Director of the UCL Hazard Centre.
“We don’t know when or if this long-term unrest will lead to an eruption, but Campi Flegrei is following a trend we’ve seen when testing our model on other volcanoes, including Rabaul in Papua New Guinea, El Hierro in the Canary Islands, and Soufriere Hills on Montserrat in the Caribbean. We are getting closer to forecasting eruptions at volcanoes that have been quiet for generations by using detailed physical models to understand how the preceding unrest develops.”
Movement of magma three kilometres below the volcano has caused the episodes of unrest. An eruption becomes more likely when the ground has been stretched to its breaking point, because the molten rock can escape to the surface when the ground splits apart. It is difficult to predict when an eruption may occur because, even if the ground breaks, it is possible for the magma to stall before reaching the surface.
The unrest has already caused severe social upheaval in Campi Flegrei. The three episodes of uplift have together pushed the port of Pozzuoli, near the centre of unrest, more than three metres out of the sea.
“The unrest in 1970 and 1983 caused tens of thousands of people to be evacuated from Pozzuoli itself,” said study co-author Dr Stefano Carlino from the Vesuvius Observatory.
The whole of Campi Flegrei covers more than 100 square kilometres outside the western suburbs of Naples and is the closest historically-active volcano to London. It is a large caldera, which means it appears as a giant depression in the surface rather than a conical mountain. An eruption today would affect the 360,000 people living across the caldera and Naples’ population of nearly one million.
“Most damage in previous crises was caused by the seismic shaking of buildings. Our findings show that we must be ready for a greater amount of local seismicity during another uplift and that we must adapt our preparations for another emergency, whether or not it leads to an eruption,” explained study co-author Professor Giuseppe De Natale, former Director of the Vesuvius Observatory, which belongs to Italy’s National Research Institute (INGV) for the study of earthquakes and volcanoes.
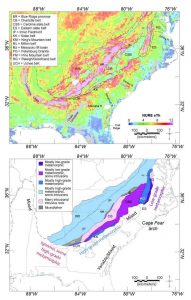
Figure caption: Top: National Uranium Resource Evaluation (NURE) radiometric equivalent Th (eTh; background) shows high values in parts of the Atlantic Coastal Plain inferred to contain elevated monazite and xenotime (red outlines); grayed areas represent carbonate rocks (also associated with eTh highs). Black lines delineate belts of the Piedmont and Blue Ridge Provinces. Bottom: Belts of the Piedmont and Blue Ridge colored according to rock type. Heavy mineral sands in the Atlantic Coastal Plain show regional compositional variations that suggest they were derived from specific rock types. These rock types correspond to Piedmont or Blue Ridge units adjacent to Atlantic Coastal Plain sediments. Dashed shapes delineate areas believed to contain elevated monazite and xenotime concentrations. A larger version is available. Credit: Shah et al. and Geological Society of America Bulletin
Rare earth elements have become increasingly important for advanced technologies, from cell phones to renewable energy to defense systems. Mineral resources hosted in heavy mineral sand deposits are especially attractive because they can be recovered using well-established mechanical methods, making extraction, processing, and remediation relatively simple.
In their study just published online in the Geological Society of America Bulletin, A.K. Shah and colleagues examine rare earth mineral resource potential within heavy mineral sands in the southeastern United States.
Using geophysical and geochemical data that cover this very wide region, the team mapped the areas most likely to host accumulations of these minerals. Additionally, their analyses of co-minerals provide constraints on broad sedimentary provenance. These constraints suggest that a large percentage of the heavy mineral sands are derived from a relatively small part of the Piedmont province via coastal processes during Atlantic opening, and that a much smaller amount of heavy mineral sands are delivered via rivers and streams.
Reference:
Rare earth mineral potential in the southeastern U.S. Coastal Plain from integrated geophysical, geochemical, and geological approaches A.K. Shah et al., U.S. Geological Survey, DFC MS 964, Box 25046, Denver, Colorado 80225, USA, [email protected], DOI: 10.1130/B31481.1.
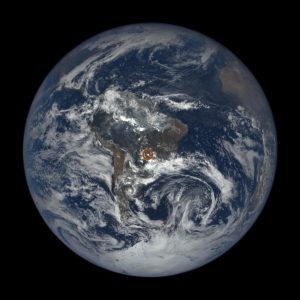
Sun glints off atmospheric ice crystals (circled in red) in this view captured by NASA’s EPIC instrument on NOAA’s DISCOVR satellite. Credit: NASA’s Goddard Space Flight Center
One million miles from Earth, a NASA camera is capturing unexpected flashes of light reflecting off our planet. The homeward-facing instrument on NOAA’s Deep Space Climate Observatory, or DSCOVR, launched in 2015, caught hundreds of these flashes over the span of a year. As keen observers from outside NASA wrote in, questioning the source of these lights, scientists deciphered the tiny cause to the big reflections: high-altitude, horizontally oriented ice crystals.
NASA’s Earth Polychromatic Imaging Camera (EPIC) instrument aboard DSCOVR is taking almost-hourly images of the sunlit planet from its spot between Earth and the sun. Alexander Marshak, DSCOVR deputy project scientist at NASA’s Goddard Space Flight Center in Greenbelt, Maryland, first noticed light flashes occasionally appearing over oceans as he looked through that day’s EPIC images.
Investigating the flashes, Marshak and his colleagues found that similar reflections from our pale blue dot caught the attention of astronomer Carl Sagan in 1993. Sagan was looking at images taken by the Galileo spacecraft, which launched in 1989 to study Jupiter and its moons. During one if its gravitational-assist swings around Earth, Galileo turned its instruments on this planet and collected data. Sagan and his colleagues used that to test a key question: Whether spacecraft could detect signatures of life from afar.
“Large expanses of blue ocean and apparent coastlines are present, and close examination of the images shows a region of [mirror-like] reflection in ocean but not on land,” they wrote of the glints.
Flashes of light reflected off oceans — like those referenced by Sagan — could have a simple explanation, Marshak said: Sunlight hits a smooth part of an ocean or lake, and reflects directly back to the sensor, like taking a flash-picture in a mirror.
But when the scientists took another took a look at the Galileo images, they saw something Sagan and his colleagues apparently missed — bright flashes of light over land as well. And those flashes appeared in the EPIC images as well. As the contact listed on the website that posts all EPIC images, Marshak started getting emails from people curious about what the flashes were.
“We found quite a few very bright flashes over land as well,” he said. “When I first saw it I thought maybe there was some water there, or a lake the sun reflects off of. But the glint is pretty big, so it wasn’t that.”
Instead, he and his colleagues Tamas Varnai of the University of Maryland, Baltimore County, and Alexander Kostinski of Michigan Technological University, thought of water elsewhere in the Earth system: ice particles high in the atmosphere. The scientists conducted a series of experiments, detailed in a new paper published in Geophysical Research Letters, to confirm the cause of the distant flashes.
First, the researchers cataloged all of the prospective sunlight glints over land in images from the EPIC camera. The flashes show up in three distinct colors because the camera takes the red, green and blue images several minutes apart. In all, the scientists found 866 bursts between DSCOVR’s launch in June 2015 and August 2016.
The scientists reasoned that if these 866 flashes were caused by reflected sunlight, they would be limited to certain spots on the globe — spots where the angle between the sun and Earth is the same as the angle between the spacecraft and Earth, allowing for the spacecraft to pick up the reflected light. When they plotted the locations of the glints with where those angles would match, given Earth’s tilt and the spacecraft’s location, the two matched.
This helped confirm that it wasn’t something like lightning causing the flashes, Marshak said: “Lightning doesn’t care about the sun and EPIC’s location.” The researchers also plotted angles to determine that the light was reflecting off of ice particles floating in the air nearly horizontally.
Another feature of the EPIC data helped confirm that the flashes were from a high altitude, not simply water on the ground. Two channels on the instrument are designed to measure the height of clouds, and when the scientists went to the data they found high cirrus clouds, 3 to 5 miles (5 to 8 kilometers) where the glints were located.
“The source of the flashes is definitely not on the ground. It’s definitely ice, and most likely solar reflection off of horizontally oriented particles,” Marshak said.
Detecting glints like this from much farther away than in this case could be used by other spacecraft to study exoplanets, he said. As an Earth scientist, however, Marshak is now investigating how common these horizontal ice particles are, and whether they’re common enough to have a measureable impact on how much sunlight passes through the atmosphere. If so, it’s a feature that could be incorporated into computer models of how much heat is reaching and leaving Earth.
Yellowstone National Park is a national park located in the U.S. states of Wyoming, Montana and Idaho. It was established by the U.S. Congress and signed into law by President Ulysses S. Grant on March 1, 1872. Yellowstone was the first National Park in the U.S. and is also widely held to be the first national park in the world. The park is known for its wildlife and its many geothermal features, especially Old Faithful Geyser, one of its most popular features. It has many types of ecosystems, but the subalpine forest is the most abundant. It is part of the South Central Rockies forests ecoregion.
An NPS film portraying Yellowstone’s extreme geologic forces as they create unique landscapes that support an abundance of life.
The Zilantophis schuberti is a newly identified snake species found in eastern Tennessee. This small creature lived roughly 5 million years ago. Credit: Image by Steven Jasinski
An ancient sink hole in eastern Tennessee holds the clues to an important transitional time in the evolutionary history of snakes. Among the fossilized creatures found there, according to a new paper co-authored by a University of Pennsylvania paleontologist, is a new species of snake that lived 5 million years ago.
Steven Jasinski, lead author of the new study, is a doctoral student in Penn’s Department of Earth and Environmental Science in the School of Arts & Sciences and acting curator of paleontology and geology at the State Museum of Pennsylvania. He is completing his Ph.D. under Peter Dodson, a professor of paleontology in Arts & Sciences and professor of anatomy in the School of Veterinary Medicine at Penn.
The fossils come from the Gray Fossil Site near East Tennessee State University, where Jasinski and co-author David Moscato pursued their master’s degrees.
This study, published in the Journal of Herpetology, involved many hours of close examination of hundreds of dark mineral-stained snake fossils. In the end, the biggest surprise was the discovery of vertebrae that don’t match any known species of snake, living or extinct. The researchers named the new genus and species Zilantophis schuberti.
“Snakes don’t have arms or legs, but they have high numbers of vertebrae,” Jasinski said. “These are often the bones that paleontologists use to identify fossil snakes.”
Zilantophis bore uniquely broad wing-shaped projections on the sides of its vertebrae. In life, these were likely attachment sites for back muscles. These features are what inspired the name of the new genus, derived from Zilant, a winged serpent in Russian mythology.
The species name, schuberti, honors Blaine Schubert, executive director of East Tenneessee State’s Don Sundquist Center of Excellence in Paleontology and advisor to both authors during their studies there. The name roughly translates to “Schubert’s Winged Snake” or “Schubert’s Winged Serpent.”
Zilantophis was a small snake, about 12-16 inches long.
“It’s about as large around as your pointer finger,” said Jasinski. “This animal was probably living in leaf litter, maybe doing a bit of digging and either eating small fish or more likely insects. It was too small to be eating a normal-sized rodent.”
“These snake vertebrae are tiny,” Moscato said. “Before we can study them, they have to be meticulously separated from the sediment and other bones. This work is done by dedicated museum workers, students and volunteers.”
Based on features of its vertebrae, this new species is thought to be most closely related to rat snakes (Pantherophis) and kingsnakes (Lampropeltis), both of which are relatively common in North America today.
The Gray Fossil Site is one of the richest fossil localities in the United States, particularly from the Neogene period, which spans from 23 million to 2.58 million years ago. Based on the extinct species found there, researchers estimate it to be between 7 and 4.5 million years old, straddling the boundary between the Miocene (23 to 5.33 million years ago) and Pliocene (5.33 to 2.58 million years ago) epochs. It is one of the only sites of this age in the entire eastern U.S., making it an important window into a poorly-known part of prehistory.
At the time that Zilantophis dwelled there, the site was a sinkhole surrounded by forest, attracting a variety of animals. The local fauna included ancient representatives of familiar North American creatures such as bears, beavers and salamanders. Others were more exotic, including unique species of rhinoceros, alligator and the site’s famous red panda.
“This is a time when the world was moving in the direction of a modern climate and modern fauna,” Jasinski said.
The snakes, too, were a mix of familiar and strange. In addition to the new species, there were ancient species of garter snake (Thamnophis), water snake (Nerodia), rat snake (Pantherophis), pine snake (Pituophis) and whip snake (Masticophis), among others. In total, the researchers identified seven different snake genera at the site, many of which are still found in east Tennessee today.
“Back in its day, the Gray Fossil Site was a great environment for living animals to thrive and for dead animals to fossilize,” Moscato said. “This makes for a paleontology goldmine, positively packed with bones.”
This is the first survey of snakes at this fossil site, and it focused specifically on identifying snakes of the family Colubridae, the largest snake family, which includes about two-thirds of all known living snake species.
“The Miocene was a time when the snake fauna of North America was undergoing significant changes,” Jasinski said.
In earlier times, boas, a group known for their robust vertebrae, were widespread and common across northern ecosystems, but as time went on the boas gradually retreated while colubrids, typically smaller than boas, took over. This shift coincided with continent-wide environmental change, including the replacement of forests with grasslands and the spread of small mammals that may have provided a food supply that fueled the expansion of colubrids.
“Zilantophis is part of this period of change,” Jasinski said. “It helps show that colubrids were diversifying at this time, including forms that did not make it to the present day.”
The find and continued investigations in this site help fill in details about the rich biodiversity of an ancient ecosystem as it underwent a shift in climate — details that can inform our understanding of the future as well.
“Snakes are important parts of their ecosystems, both today and in the past,” Jasinski said. “Every fossil helps tell a story, and all those pieces of evidence give scientists a clearer picture of the past, as well as tools to predict how living communities may respond to changes in the future.”
Reference:
Steven E. Jasinski and David A. Moscato3. Late Hemphillian Colubrid Snakes (Serpentes, Colubridae) from the Gray Fossil Site of Northeastern Tennessee. Journal of Herpetology, June 2017, Vol. 51, No. 2, pp. 245-257
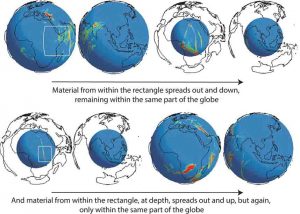
Earth’s mantle information is shown. Credit: University of Leicester
New insights into the convection patterns of the Earth’s mantle and its chemical makeup have been revealed by a researcher from the University of Leicester.
The new findings suggest that the mantle does not flow ubiquitously, as has been previously thought — and that it is instead divided into two very large domains that convect only within themselves, with little evidence of them mixing together.
The research, led by Dr Tiffany Barry from the University of Leicester, Department of Geology and published in the journal Scientific Reports, Nature, suggests that one of these domains is found under the Pacific Ocean while the other exists outside of it.
The research suggests that upper mantle material flows to lower parts of the mantle when it reaches a subduction zone, where one tectonic plate descends beneath another one.
This descending slab of material acts as a sort of curtain, preventing upper mantle material mixing all the way around the globe and keeping the two domains separate.
Dr Barry explained: “One of the ways our planet is unique is in the amazing way it has mobile plates at the surface that move and jostle about over time. This movement of the plates results in the process we call plate tectonics, and no other planet we know shows evidence of this process. Why or how plate tectonics started on this planet is not understood, but it has been utterly essential in the production of the crust and oceans that we recognise as Earth today. What is also not well constrained is what effect plate tectonics has on the internal workings of the Earth.
“We have found that when mantle material reaches the bottom of the mantle, at the outer core, it does not spread out and go anywhere around the core, but instead returns to the same hemisphere of the globe from where it came. We have modelled this dominantly up-down motion of convection and found that it can persist for 100’s millions of years.
“On the basis of past plate motions and geochemical evidence, we speculate that this process of mantle convection could have been a dominant process since at least 550 million years ago, and potentially since the start of plate tectonics.”
The researchers combined spherical numerical computer models (3D finite element modelling) with the best available reconstructions of how Earth’s plates have moved over the past 200 million years to track mathematical particles placed at different depths of the modelled mantle.
With these models they examined where the mantle freely moves to during the history of plates moving around at the surface. Having tracked where particles flow in the models, the team then examined chemical isotope evidence from past ocean basins, which are a good analogy for the composition of the upper mantle in the past.
With this data they were able to test whether former ocean basins, that are no longer present, had the same or different composition to subsequent basins that formed geographically in the same region of the globe.
Dr Barry added: “I’m incredibly excited by this work; it has been a research question I’ve been pondering for nearly two decades. It feels like a real privilege to have been able to piece together a robust and convincing model that can explain the feature of the chemical differences in ocean floor crust.
“This new research overturns our understanding of how the inside of the earth convects and stirs, and how it is divided up, and for the first time explains observations that were first noted in the late 1980s.”
Reference:
T. L. Barry, J. H. Davies, M. Wolstencroft, I. L. Millar, Z. Zhao, P. Jian, I. Safonova, M. Price. Whole-mantle convection with tectonic plates preserves long-term global patterns of upper mantle geochemistry. Scientific Reports, 2017; 7 (1) DOI: 10.1038/s41598-017-01816-y
Leading hospital “superbugs,” known as the enterococci, arose from an ancestor that dates back 450 million years — about the time when animals were first crawling onto land (and well before the age of dinosaurs), according to a new study led by researchers from Massachusetts Eye and Ear, the Harvard-wide Program on Antibiotic Resistance and the Broad Institute of MIT and Harvard. Published online today in Cell, the study authors shed light on the evolutionary history of these pathogens, which evolved nearly indestructible properties and have become leading causes of modern antibiotic-resistant infections in hospitals.
Antibiotic resistance is now a leading public health concern worldwide. Some microbes, often referred to as “superbugs,” are resistant to virtually all antibiotics. This is of special concern in hospitals, where about 5 percent of hospitalized patients will fight infections that arise during their stay. As researchers around the world are urgently seeking solutions for this problem, insight into the origin and evolution of antibiotic resistance will help inform their search.
“By analyzing the genomes and behaviors of today’s enterococci, we were able to rewind the clock back to their earliest existence and piece together a picture of how these organisms were shaped into what they are today” said co-corresponding author Ashlee M. Earl, Ph.D., group leader for the Bacterial Genomics Group at the Broad Institute of MIT and Harvard. “Understanding how the environment in which microbes live leads to new properties could help us to predict how microbes will adapt to the use of antibiotics, antimicrobial hand soaps, disinfectants and other products intended to control their spread.”
The picture the researchers pieced together begins with the dawn of life. Bacteria arose nearly 4 billion years ago, and the planet has teemed with them ever since, including the sea. Animals first arose in the sea during the time known as the Cambrian Explosion, 542 million years ago. As animals emerged in a sea of bacteria, bacteria learned to live in and on them. Some bacteria protect and serve the animals, as the healthy microbes in our intestines do today; others live in the environment, and still others cause disease. As animals crawled onto land about 100 million years later, they took their microbes with them.
The authors of the Cell study found that all species of enterococci, including those that have never been found in hospitals, were naturally resistant to dryness, starvation, disinfectants and many antibiotics. Because enterococci normally live in the intestines of most (if not all) land animals, it seemed likely that they were also in the intestines of land animals that are now extinct, including dinosaurs and the first millipede-like organisms to crawl onto land. Comparison of the genomes of these bacteria provided evidence that this was indeed the case. In fact, the research team found that new species of enterococci appeared whenever new types of animals appeared. This includes when new types of animals arose right after they first crawled onto land, and when new types of animals arose right after mass extinctions, especially the greatest mass extinction, the End Permian Extinction (251 million years ago).
From sea animals, like fish, intestinal microbes are excreted into the ocean, which usually contains about 5,000 mostly harmless bacteria per drop of water. They sink to the seafloor into microbe-rich sediments, and are consumed by worms, shellfish and other sea scavengers. Those are then eaten by fish, and the microbes continue to circulate throughout the food chain. However, on land, intestinal microbes are excreted as feces, where they often dry out and most die over time.
Not the enterococci, however. These microbes are unusually hardy and can withstand drying out and starvation, which serves them well on land and in hospitals where disinfectants make it difficult for a microbe.
“We now know what genes were gained by enterococci hundreds of millions of years ago, when they became resistant to drying out, and to disinfectants and antibiotics that attack their cell walls,” said study leader Michael S. Gilmore, Ph.D., senior scientist at Mass. Eye and Ear and Director of the Harvard Infectious Disease Institute.
“These are now targets for our research to design new types of antibiotics and disinfectants that specifically eliminate enterococci, to remove them as threats to hospitalized patients,” added Francois Lebreton, Ph.D., first author of the study and project leader for the Gilmore team.
In addition to Drs. Earl, Gilmore and Lebreton, authors on the Cell paper include Abigail L. Manson, Ph.D., and Timothy J. Straub, of the Broad Institue of MIT and Harvard, and Jose T. Saavedra, of Massachusetts Institute of Technology.
This research study was supported by Department of Health and Human Services/National Institutes of Health/National Institute of Allergy and Infectious Diseases grants AI072360, AI083214, HHSN272200900018C and U19AI110818.
Reference:
François Lebreton, Abigail L. Manson, Jose T. Saavedra, Timothy J. Straub, Ashlee M. Earl, Michael S. Gilmore. Tracing the Enterococci from Paleozoic Origins to the Hospital. Cell, 2017; DOI: 10.1016/j.cell.2017.04.027
Dramatic drops in oceanic oxygen, which cause mass extinctions of sea life, come to a natural end — but it takes about a million years.
The depletion of oxygen in the oceans is known as “anoxia,” and scientists from the University of Exeter have been studying how periods of anoxia end.
They found that the drop in oxygen causes more organic carbon to be buried in sediment on the ocean floor, eventually leading to rising oxygen in the atmosphere which ultimately re-oxygenates the ocean.
Scientists believe the modern ocean is “on the edge of anoxia” — and the Exeter researchers say it is “critical” to limit carbon emissions to prevent this.
“Once you get into a major event like anoxia, it takes a long time for the Earth’s system to rebalance,” said lead researcher Sarah Baker, a geographer at the University of Exeter.
“This shows the vital importance of limiting disruption to the carbon cycle to regulate the Earth system and keep it within habitable bounds.”
The researchers, who also include Professor Stephen Hesselbo from the Camborne School of Mines, studied the Toarcian Oceanic Anoxic Event, which took place 183 million years ago and was characterized by a major disturbance to the global carbon cycle, depleted oxygen in Earth’s oceans and mass extinction of marine life.
Numerical models predicted that increased burial of organic carbon — due to less decomposition and more plant and marine productivity in the warmer, carbon-rich environment — should drive a rise in atmospheric oxygen, causing the end of an anoxic event after one million years.
To test the theory, the scientists examined fossil charcoal samples to see evidence of wildfires — as such fires would be more common in oxygen-rich times.
They found a period of increased wildfire activity started one million years after the onset of the anoxic event, and lasted for about 800,000 years.
“We argue that this major increase in fire activity was primarily driven by increased atmospheric oxygen,” said Baker.
“Our study provides the first fossil-based evidence that such a change in atmospheric oxygen levels could occur in a period of one million years.”
The increase in fire activity may have also helped end ocean anoxia by burning and reducing the amount of plants on land.
This is because plants can help to erode rocks on the land that contain nutrients needed for marine life — therefore with fewer plants, fewer nutrients are available to be carried to the sea and used to support marine life in the oceans.
Less marine life — that would use oxygen to breathe — would mean less oxygen being used in the oceans, and could therefore help the oceans to build up a higher oxygen content, ending anoxia.
It may therefore be essential to maintain the natural functioning of wildfire activity to help regulate the Earth system in the long-term, the researchers say.
The charcoal sediment tests were carried out at Mochras in Wales and Peniche, Portugal.
The research was funded by the Natural Environment Research Council (NERC).
Reference:
Sarah J. Baker, Stephen P. Hesselbo, Timothy M. Lenton, Luís V. Duarte, Claire M. Belcher. Charcoal evidence that rising atmospheric oxygen terminated Early Jurassic ocean anoxia. Nature Communications, 2017; 8: 15018 DOI: 10.1038/ncomms15018
Changes in tectonic activity may have shaped composition of Panama Canal rocks
Changes in the composition of magma may have caused variations in the Panama Canal volcanic rock formations, according to a study published May 10, 2017 in the open-access journal PLOS ONE by David Farris from Florida State University, and colleagues.
The Earth’s crust is divided into tectonic plates and a chain of volcanoes can often appear in areas where one plates is pushed under another. Studying these locations can improve our understanding of how the Earth’s crust is formed.
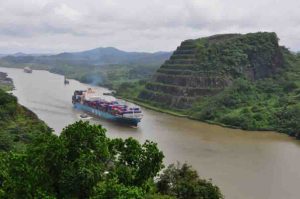
The authors of the present study examined volcanic formations along the Panama Canal, which formed when the Panama block and South America collided approximately 21 to 25 million years ago. The researchers constructed geochemical models of these rock formations, and they identified some significant differences in their physical structure and chemical composition.
The researchers found that the Oligocene Bas Obispo Formation and other older rock types had more abundant water-borne elements compared to the younger Pedro Miguel volcanic rocks. This Miocene unit is composed of multiple shallow ‘maar’ volcanic craters with alternating layers of explosively formed pyroclastic rocks, and fine-grained dark basaltic rock, formed from cooling lava flows. These layers suggest that multiple episodes of magma eruption and recharge occurred within the Pedro Miguel rock formation.
The authors suggest that along the Panama Canal, changing tectonic conditions were brought about by the collision of the Panama block and South America. They state that changes in the composition of volcanic rocks likely drove a transition from water-bearing magmas to dry, hot magmas over time, and these magmas in turn caused different types of volcanoes to form. Additional research could further explore the relationship between magma composition, physical properties and volcanic forms in other areas of the world.
Dr Farris notes: “This study examines the relationship between arc magmatism and tectonic change in a sequence of volcanic rocks along the Panama Canal. These rocks contain a change from wet to dry arc magmatism associated with the onset of collision between the Panama block and South America. In addition, the onset of hot, dry magmatism led to formation of explosive maar volcanic structures.”
Reference:
David W. Farris, Agustin Cardona, Camilo Montes, David Foster, Carlos Jaramillo. Magmatic evolution of Panama Canal volcanic rocks: A record of arc processes and tectonic change. PLOS ONE, 2017; 12 (5): e0176010 DOI: 10.1371/journal.pone.0176010
Note: The above post is reprinted from materials provided by PLOS.
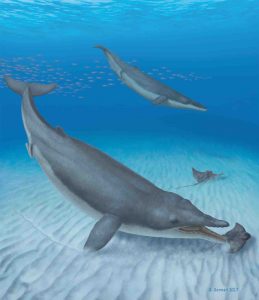
This illustration shows two Mystacodon selenensis individuals diving down to catch eagle rays along the seafloor of a shallow cove off the coast of present-day Peru. Credit: Alberto Gennari
Modern whales’ ancestors probably hunted and chased down prey, but somehow, those fish-eating hunters evolved into filter-feeding leviathans. An analysis of a 36.4-million-year-old whale fossil suggests that before baleen whales lost their teeth, they were suction feeders that most likely dove down and sucked prey into their large mouths. The study published on May 11 in Current Biology also shows that whales most likely lost the hind limbs that stuck out from their bodies more recently than previously estimated.
The specimen, which researchers unearthed in the Pisco Basin in southern Peru, is the oldest known member of the mysticete group, which includes the blue whale, the humpback whale, and the right whale. At 3.75-4 meters long, this late Eocene animal was smaller than any of its living relatives, but the most important difference was in the skull. Modern mysticetes have keratin fibers — called baleen — in place of teeth that allow them to trap and feed on tiny marine animals such as shrimp. However, the newly described whale has teeth, so the paleontologists dubbed it Mystacodon, meaning “toothed mysticete.”
“This find by our Peruvian colleague Mario Urbina fills a major gap in the history of the group, and it provides clues about the ecology of early mysticetes,” says paleontologist and study co-author Olivier Lambert of the Royal Belgian Institute of Natural Sciences. “For example, this early mysticete retains teeth, and from what we observed of its skull, we think that it displays an early specialization for suction feeding and maybe for bottom feeding.”
Mystacodon’s teeth exhibit a pattern of wear that differs from more archaic whales, the basilosaurids. Many basilosaurids were probably active hunters, similar to modern orcas, with mouths that were suited for biting and attacking, but Mystacodon has a mouth more suited for sucking in smaller animals, leading the researchers to conclude that Mystacodon most likely represents an intermediate step between raptorial and filter feeding and between the ancient basilosaurids and modern mysticetes.
“For a long time, Creationists took the evolution of whales as a favorite target to say that, ‘Well, you say that whales come from a terrestrial ancestor, but you can’t prove it. You can’t show the intermediary steps in this evolution,'” says Lambert. “And that was true, maybe thirty years ago. But now, with more teams working on the subject, we have a far more convincing scenario.”
Mystacodon bolsters that argument by displaying features of both basilosaurids and mysticetes. “It perfectly matches what we would have expected as an intermediary step between ancestral basilosaurids and more derived mysticetes,”says Lambert. “This nicely demonstrates the predictive power of the theory of evolution.”
Lambert and his colleagues think that Mystacodon may have started suction feeding in response to ecological changes. In illustrated reconstructions, Mystacodon is depicted diving down to the sea floor in a shallow cove, but based on this initial analysis, the researchers aren’t sure to which extent Mystacodon was adapted to bottom feeding. “We will look inside the bone to see if we can find some changes that may be correlated with this specialized behavior,” says Lambert. “Among marine mammals, when a slow-swimming animal is living close to the sea floor, generally the bone is much more compact, and this is something we want to test with these early mysticetes.”
The fossil’s pelvis offered another surprise: Mystacodon had fully articulated, tiny vestigial hind limbs that would have stuck out away from the whale’s body. Previously, paleontologists had thought that whales lost the hip articulation during the basilosaurid phase of their evolution, before baleen whales and modern toothed whales diverged. Though Mystacodon’s hind limbs were already tiny and well down the path toward being vestigial and useless, their articulation with the pelvis suggests that mysticetes and modern toothed whales may have lost this feature independently.
“For a long time, our comprehension of whale evolutionary history was hampered by the fact that most paleontologists were searching for bones relatively close to home, in Europe and North America,” Lambert says. “However, key steps in whales’ evolution happened in areas now occupied by India, Pakistan, Peru, and even Antarctica.” Lambert and his colleagues plan to return to the excavation site in Peru to see if they can find more whale fossils from different epochs.
Reference:
Olivier Lambert, Manuel Martínez-Cáceres, Giovanni Bianucci, Claudio Di Celma, Rodolfo Salas-Gismondi, Etienne Steurbaut, Mario Urbina, Christian de Muizon. Earliest Mysticete from the Late Eocene of Peru Sheds New Light on the Origin of Baleen Whales. Current Biology, 2017; DOI: 10.1016/j.cub.2017.04.026
Note: The above post is reprinted from materials provided by Cell Press.