Home Blog Page 123

Tree rings pinpoint eruption of Icelandic volcano to half a century before human settlement

Drumbabót forest in Iceland. Credit: Ulf Büntgen

An international group of researchers has dated a large volcanic eruption in Iceland to within a few months. The eruption, which is the oldest volcanic eruption to be precisely dated at high northern latitudes, occurred shortly before the first permanent human settlements were established, when parts of the now mostly treeless island were still covered with forest.

The team, which included volcanologists, climatologists, geographers and historians among others, used a combination of scientific and historical evidence to pinpoint the eruption date of the Katla volcano between late 822 CE and early 823 CE, decades before the earliest settlers arrived. Their results are reported in the journal Geology.

In a similar way to how fossils can be used to understand the development and evolution of life on Earth, different types of environmental evidence can be used to understand what the Earth’s climate was like in the past and why. The ‘fingerprints’ contained in tree rings and ice cores help scientists to estimate past climatic conditions and extend our understanding of the interaction between humans and the environment hundreds and thousands of years back in time.

“In our work, we’re trying to reconstruct past natural temperature and precipitation variability from tree rings – trying to reveal when it was cold and wet or warm and dry for instance,” said Professor Ulf Büntgen of Cambridge’s Department of Geography, the paper’s lead author. “We’re also interested in detecting and understanding key drivers of the Earth’s climate dynamics and their possible linkages with changes in human history.”

Currently, Iceland is for the most part treeless. However, before the first permanent settlers arrived in the late 9th century, it was most likely covered by extensive woodland. Early settlers harvested most of the trees they found on the island to establish an agricultural-based society, and the trees never recovered.

In 2003, a spring flood of the Thverá River exposed hundreds of birch trees which had been buried for centuries beneath layers of volcanic sediment. The so-called Drumbabót forest is the best-preserved prehistoric forest in Iceland, and had been buried by an eruption of the nearby Katla volcano, Iceland’s most active volcanic system.

Volcanic eruptions are often responsible for an abrupt period of cooling, but only with a precise date of eruption can researchers definitively account for the variability in climate. Büntgen, who uses the information locked within tree rings to reconstruct past climate conditions, used the trees exposed by the 2003 flood to pinpoint when this particular eruption took place.

The team behind the current work have previously confirmed that in 775 CE, a large solar flare caused a spike in radiocarbon levels in the Earth’s atmosphere, which would be stored in the wood of trees that were alive at the time. By measuring the radiocarbon levels in one of the Drumbabót trees, Büntgen and his colleagues were able to pinpoint the year 775 in the tree rings, and measure outward to the bark to count the number of years to the Katla eruption, when the tree died. The outermost tree ring had completely formed and a new one had not yet started, meaning that the eruption occurred after autumn 822 and before spring 823, before the next year’s growth had begun. Iceland was not settled until around 870, so this particular forest was destroyed almost half a century before humans arrived.

The unique tree ring results were then linked with those of co-authors Professors Christine Lane and Clive Oppenheimer, also from Cambridge’s Department of Geography. Lane and Oppenheimer used independent lines of ash (tephra) and ice core evidence to detect fingerprints of the Katla eruption.

In addition to the scientific results, the team also involved historians who analysed written documentary evidence from Europe and Asia, and found that there was a severe cold spell consistent with the timing of the reconstructed Katla eruption.

“It was a happy coincidence that we were able to use all these different archives and techniques to date this eruption,” said Büntgen. “Data and methods we are using are constantly getting better, and by building more links with the humanities, we can see the real effects volcanoes have on human society.”

Reference:
Büntgen et al. ‘Multi-proxy dating of Iceland’s major pre-settlement Katla eruption to 822-823 CE.’ Geology (2017). DOI: 10.1130/G39269.1

Note: The above post is reprinted from materials provided by University of Cambridge.

Study examines geology of Oklahoma’s largest earthquake

Radar measurements of Pawnee quake deformation based on before/after satellite data analysis. Red/pink areas moved west and up; blue areas moved east or down. Black lines are previously mapped faults; aftershocks are purple; magenta line is Sooner Lake Fault; water is grey; cyan line is Highway 412. Credit: Copernicus/NASA-JPL/Caltech/OGS

Oklahomans are no strangers to Mother Nature’s whims. From tornadoes and floods to wildfires and winter storms, the state sees more than its share of natural hazards. But prior to 2009, “terra firma” in Oklahoma meant just that—earthquakes rarely shook the state.

Then, after decades of seismic quiet where the state averaged less than two quakes of magnitude 3 or greater a year, Oklahoma suddenly saw a sharp uptick, to 20 such quakes in 2009. By 2013 there were 109 such quakes. Since then, the numbers have soared, reaching 903 in 2015 before dipping last year to 623. In the process, Oklahoma has surpassed California to become the most seismically active of the lower 48 U.S. states.

In 2011, a magnitude 5.7 quake and two related magnitude 5.0 quakes struck near the Oklahoma town of Prague, causing damage and injuries. Then last Sept. 3, a magnitude 5.8 quake struck a few miles northwest of the city of Pawnee, population 2,200. That quake, which occurred on a previously unmapped fault, was the strongest ever measured by instruments in Oklahoma. It shook a large area of north-central Oklahoma and was felt throughout the Midwest and as far away as Phoenix and Pittsburgh.

A Seismic Detective Story, With Satellites

Even before NASA studied the Pawnee earthquake, studies published since late last year by the United States Geological Survey and other institutions suggested that the earthquake was human-induced due to increases in wastewater injection related to petroleum operations. Injection wells place fluids underground into porous geologic formations, which scientsts believe can sometimes enter buried faults that are ready to slip.

To shed additional light on the source of the Pawnee quake, a team led by geophysicist Eric Fielding of NASA’s Jet Propulsion Laboratory in Pasadena, California, used enhanced seismic data and satellite image analysis to more accurately estimate the location and extent of the fault responsible for the quake, its hypocenter (the point below Earth’s surface where the quake began) and its aftershocks, and to measure how the fault moved. Results of their study were published recently in Seismological Research Letters.

To help pinpoint which fault ruptured and where the main quake started, Fielding’s team updated the locations of earthquakes published in an Oklahoma Geological Survey catalog of aftershocks. The catalog included nearly 2,200 earthquakes of greater than magnitude 1.0 within about 31 miles (50 kilometers) of the Sept. 3 main shock.

Around Pawnee, the main faults are oriented in a northeast or north direction. But most of the aftershocks to the Sept. 3 quake occurred along a line trending east-southeast from the epicenter. As reported in earlier studies and confirmed by Fielding’s team, this told scientists the main shock didn’t occur on a previously mapped fault, but on a new fault called the Sooner Lake Fault.

To determine which parts of the fault slipped in the earthquake, Fielding’s team analyzed interferometric synthetic aperture radar (InSAR) data from the Copernicus Sentinel-1A and Sentinel-1B satellites operated by the European Space Agency and the McDonald, Dettweiler and Associates Ltd RADARSAT-2 satellite. The team compared InSAR data from multiple satellite overpasses before and after the main shock to create images of ground deformation known as interferograms. The Pawnee earthquake is the first Oklahoma earthquake to be observed using radar satellite data.

“Radar satellites allow us to study details of earthquakes on faults that were not previously mapped and don’t reach the surface,” Fielding said. “This allows us to learn more about the processes that cause earthquakes.”

Interferograms created by the team from the InSAR data showed the ground deformed in a pattern consistent with slip along an east-to-southeast trending fault. The interferograms also showed the quake did not rupture Earth’s surface, consistent with field reports.

Seeing the Unseeable: Creating Computer Models of a Buried Fault

Fielding’s team next input the aftershock and InSAR data into a computer to create models of the fault’s likely location and of which parts of the fault slipped during the quake.

Their preferred model of the Sooner Lake Fault calculates that it dips vertically and is 11 miles (18 kilometers) long and 9 miles (15 kilometers) wide. The model also calculates that the movement on the fault took place deeper than 1.4 miles (2.3 kilometers) beneath the surface, and that the parts that moved the most were located deeper than 2.8 miles (4.5 kilometers). These findings are consistent with a main fault rupture taking place in crystalline basement rock beneath more shallow sedimentary rock layers.

Clues Point to a Human-Induced Quake

The team’s results show the main shock began at a depth of about 2.8 miles (4.5 kilometers) below the surface and moved downward to a depth of at least 6.2 miles (10 kilometers) and perhaps as much as 8.7 miles (14 kilometers), into the basement rocks below the sedimentary layer. This downward rupture direction is unusual for natural earthquakes. The fault slipped horizontally about 2 feet (60 centimeters) at a depth of 7.5 miles (12 kilometers).

“Our results showing a downward fault rupture are consistent with a human-induced earthquake resulting from wastewater injection, rather than a naturally caused quake,” said Fielding.

Fielding said the research may help better manage induced seismicity. “By understanding how and where earthquakes are induced by wastewater injection, we may be able to mitigate their risk by identifying zones that should be avoided for injection,” he said.

The NASA-ISRO SAR (NISAR) mission, planned for launch in 2021, may help scientists identify faults responsible for earthquakes and learn more about their causes, both natural and human-induced. It will provide frequent coverage of all land areas twice every 12 days.

Note: The above post is reprinted from materials provided by NASA.

Brooding dinosaurs

Prepared oviraptorosaur egg with preserved embryo skeleton. Scale 1cm. Credit: Romain Amiot

A new method used to perform geochemical analysis of fossilized eggs from China has shown that oviraptorosaurs incubated their eggs with their bodies within a 35-40° C range, similar to extant birds today. This finding is the result of Franco-Chinese collaboration coordinated by Romain Amiot of the Laboratoire de géologie de Lyon: Terre, planètes et environnement (CNRS/ENS de Lyon/Université Claude Bernard Lyon 1).

Dinosaurs’ reproductive strategies, and in particular the way they incubated their eggs, still raise numerous scientific questions. Until now, interpretations have been based on indirect indices such as the morphology of fossilized eggshells or the organization of nests. Researchers from Lyon, working in collaboration with a Chinese team, have developed a method based on the geochemical analysis of fossilized eggs and have calculated for the first time that the oviraptorosaur eggs were incubated within a 35-40° C temperature range.

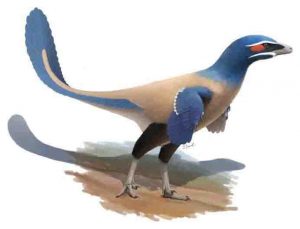
Oviraptorosaurs were feathered bipedal dinosaurs with a beak, giving them an appearance reminiscent of certain birds. A member of the theropod group,[1] they weighed a few dozen kilos and could measure up to two meters in length. In order to determine the temperature at which these dinosaurs incubated their eggs, the researchers analyzed seven fossilized eggs recovered from southern China. These 70-million-year-old eggs still contain embryos. Both the eggshells and the embryo bones were analyzed in order to determine their oxygen isotope composition.[2] During the formation of the embryo skeletons, oxygen from the egg fluids was transferred to the embryo bones, the isotopic abundance of which would depend on the temperature of the egg. Taking these measurements into account, the researchers — assisted by a physiologist colleague — were able to model the different developmental stages integrating the oxygen isotope compositions. In doing so, they were able to ascertain the temperature at which the egg was formed: between 35 and 40° C. By way of comparison, crocodiles, which bury their eggs, incubate their eggs at a temperature of around 30° C, while hen’s eggs are incubated at 37.5° C. According to the researchers, the incubation temperature calculated for the oviraptorosaurs eggs is thus coherent with the way these dinosaurs are thought to have incubated their eggs.

This result confirms the discovery made in the 1990s of fossilized oviraptorosaurs stretched across their clutch, suggesting that they incubated their eggs. The work also opens new avenues for research in paleontology: the method employed makes it possible to ascertain the incubation strategies adopted by other dinosaurs. No doubt some dinosaurs, weighing several dozen metric tons, could not lie on their eggs to incubate them, but they may have used other external heat sources, for example by covering their clutch with a mound of plant matter, which would have provided heat as it decomposed. The estimated incubation temperature will be a reflection of the incubation strategy employed, subject to being able access these rare and precious fossils for corroborative purposes.

This research, which is part of the above-mentioned Franco-Chinese collaboration, involved the Laboratoire de géologie de Lyon : Terre, planètes et environnement (CNRS/ENS de Lyon/Université Claude Bernard Lyon 1), the Laboratoire de biologie et de biométrie évolutive (CNRS/Université Claude Bernard Lyon 1/VetAgroSup) as well as the Laboratoire d’écologie des hydrosystèmes naturels anthropisés (CNRS/Université Claude Bernard Lyon 1/ENTPE).

[1] The current classification distinguishes two groups of dinosaurs: ornithischians and saurischians. Theropod dinosaurs form a group within the order of saurischian dinosaurs. Characterized by their bipedal posture, most were carnivorous.

[2] The oxygen isotope composition refers to the relative abundance of oxygen’s two main stable isotopes, oxygen-16 (16O) and oxygen-18 (18O).

Reference:
Romain Amiot, Xu Wang, Shuo Wang, Christophe Lécuyer, Jean-Michel Mazin, Jinyou Mo, Jean-Pierre Flandrois, François Fourel, Xiaolin Wang, Xing Xu, Zhijun Zhang, Zhonghe Zhou. δ18O-derived incubation temperatures of oviraptorosaur eggs. Palaeontology, 2017; DOI: 10.1111/pala.12311

Note: The above post is reprinted from materials provided by CNRS.

‘Bulges’ in volcanoes could be used to predict eruptions

Kilauea is pictured. Credit: Clare Donaldson

A team of researchers from the University of Cambridge have developed a new way of measuring the pressure inside volcanoes, and found that it can be a reliable indicator of future eruptions.

Using a technique called ‘seismic noise interferometry’ combined with geophysical measurements, the researchers measured the energy moving through a volcano. They found that there is a good correlation between the speed at which the energy travelled and the amount of bulging and shrinking observed in the rock. The technique could be used to predict more accurately when a volcano will erupt. Their results are reported in the journal Science Advances.

Data was collected by the US Geological Survey across Kīlauea in Hawaii, a very active volcano with a lake of bubbling lava just beneath its summit. During a four-year period, the researchers used sensors to measure relative changes in the velocity of seismic waves moving through the volcano over time. They then compared their results with a second set of data which measured tiny changes in the angle of the volcano over the same time period.

As Kīlauea is such an active volcano, it is constantly bulging and shrinking as pressure in the magma chamber beneath the summit increases and decreases. Kīlauea’s current eruption started in 1983, and it spews and sputters lava almost constantly. Earlier this year, a large part of the volcano fell away and it opened up a huge ‘waterfall’ of lava into the ocean below. Due to this high volume of activity, Kīlauea is also one of the most-studied volcanoes on Earth.

The Cambridge researchers used seismic noise to detect what was controlling Kīlauea’s movement. Seismic noise is a persistent low-level vibration in the Earth, caused by everything from earthquakes to waves in the ocean, and can often be read on a single sensor as random noise. But by pairing sensors together, the researchers were able to observe energy passing between the two, therefore allowing them to isolate the seismic noise that was coming from the volcano.

“We were interested in how the energy travelling between the sensors changes, whether it’s getting faster or slower,” said Clare Donaldson, a PhD student in Cambridge’s Department of Earth Sciences, and the paper’s first author. “We want to know whether the seismic velocity changes reflect increasing pressure in the volcano, as volcanoes bulge out before an eruption. This is crucial for eruption forecasting.”

One to two kilometres below Kīlauea’s lava lake, there is a reservoir of magma. As the amount of magma changes in this underground reservoir, the whole summit of the volcano bulges and shrinks. At the same time, the seismic velocity changes. As the magma chamber fills up, it causes an increase in pressure, which leads to cracks closing in the surrounding rock and producing faster seismic waves — and vice versa.

“This is the first time that we’ve been able to compare seismic noise with deformation over such a long period, and the strong correlation between the two shows that this could be a new way of predicting volcanic eruptions,” said Donaldson.

Volcano seismology has traditionally measured small earthquakes at volcanoes. When magma moves underground, it often sets off tiny earthquakes, as it cracks its way through solid rock. Detecting these earthquakes is therefore very useful for eruption prediction. But sometimes magma can flow silently, through pre-existing pathways, and no earthquakes may occur. This new technique will still detect the changes caused by the magma flow.

Seismic noise occurs continuously, and is sensitive to changes that would otherwise have been missed. The researchers anticipate that this new research will allow the method to be used at the hundreds of active volcanoes around the world.

Reference:
Clare Donaldson, Corentin Caudron, Robert G. Green, Weston A. Thelen and Robert S. White. Relative seismic velocity variations correlate with deformation at Kīlauea volcano. Science Advances, 2017 DOI: 10.1126/sciadv.1700219

Note: The above post is reprinted from materials provided by University of Cambridge. The original story is licensed under a Creative Commons License.

Darwin’s ‘strangest animal ever’ finds a family

Image received from the American Museum of Natural History shows an artist’s impression of Macrauchenia patachonica, the creature Charles Darwin called the ‘strangest animal ever discovered’

Charles Darwin, Mr. Evolution himself, didn’t know what to make of the fossils he saw in Patagonia so he sent them to his friend, the renowned paleontologist Richard Owen.

Owen was stumped too. Little wonder.

“The bones looked different from anything he knew,” said Michael Hofreiter, senior author of a study published Tuesday in Nature Communications that finally situates in the tree of life what Darwin called the “strangest animal ever discovered”.

“Imagine a camel without a hump, with feet like a slender rhino, and a head shaped like a saiga antelope,” Hofreiter, a professor at the University of Potsdam, told AFP.

Macrauchenia patachonica—literally, “long-necked llama”—also had a long rubbery snout and with its nostrils high on the skull just above its eyes.

For nearly two centuries, biologists and taxonomists argued over the pedigree of this bizarre beast, which weighed 400 to 500 kilos (850 to 1100 pounds), lived in open landscapes, and snacked on grass and leaves.

But its mixed bag of body features, and a paucity of DNA evidence, made it nearly impossible to determine whether M. patachonica was truly related the llama after which it was named.

As it turns out, not really.

Evolutionary dead end

A new kind of genetic analysis revealed that Macrauchenia was more akin to an ancient placental order known as Perissodactyla that includes horses, rhinos and tapirs.

“We had a difficult problem to solve here,” said lead author of the new study Michael Westbury, also at the University of Potsdam.

“When ancient DNA is so degraded and full of unwanted environmental DNA, we rely on being able to use the genomes of close relatives as a kind of scaffold to reconstruct fossil sequences,” he said in a statement.

But Macrauchenia—itself an evolutionary dead end—didn’t have any close cousins that we know of.

To solve the puzzle, Westbury and a 20-strong team of scientists used mitochondrial DNA extracted from a fossil found in southern Chile to decode the extinct mammal’s origins.

Inherited from the mother alone, the mitochondrial genome is smaller and has more copies in the cell—and thus in fossils—than DNA from the more complex nuclear genome, Hofreiter explained.

“Mitochondrial DNA is very useful for evaluating the degree of relatedness among species,” he said.

The team eventually pieced together almost 80 percent of the total genome, making it possible to situate Macrauchenia in an evolutionary timeline.

The creature’s lineage, they concluded, split with that of modern perissodactyls some 66 million years ago, about the same time a massive asteroid slammed into Earth and wiped out non-avian dinosaurs.

Macrauchenia survived until the late Pleistocene, 20,000 to 11,000 years ago.

“Why it disappeared we really don’t know—it is still an open question whether it was humans, climate change, or a combination of the two,” said Hofreiter.

Note: The above post is reprinted from materials provided by AFP.

Ramsö En-echelon Dyke Apophyses Kosterhavet Sweden

Photo Copyright © Thomas Eliasson of Geological Survey of Sweden

Apophyses (branches) of dark-coloured dolerite dykes in Kosterhavet National Park on Ramsö island in the Koster Islands in Sweden.

The dykes intruded between the Gothian orogeny (1.64 to 1.52 Ga) and the Sveconorwegian orogeny (1,2 to 0.9 Ga) at about 1.44 Ga.

Photo Copyright © Thomas Eliasson of Geological Survey of Sweden

Predicting eruptions using satellites and math

Each set of fringe corresponds to a ground movement of ~3 cm. Credit: Courtesy of the Institut des Sciences de la Terre (ISTerre).

Volcanologists are beginning to use satellite measurements and mathematical methods to forecast eruptions and to better understand how volcanoes work, shows a new article in Frontiers in Earth Science.

As magma shifts and flows beneath the earth’s surface, the ground above flexes and quivers. Modern satellite technologies, similar to GPS, can now track these movements, and geoscientists are beginning to decipher what this reveals about what’s happening underground—as well as what is likely to happen in the future.

“We’re the first to have developed a strategy using data assimilation to successfully forecast the evolution of magma overpressures beneath a volcano using combined ground deformation datasets measured by Global Navigation Satellite System (more commonly known as GPS) and satellite radar data,” explains Mary Grace Bato, lead author of the study and a researcher at the Institut des Sciences de la Terre (ISTerre) in France.

Bato and her collaborators are among the first to test whether data assimilation, a method used to incorporate new measurements with a dynamical model, can also be applied in volcano studies to make sense of such satellite data. Meteorologists have long used a similar technique to integrate atmospheric and oceanic measurements with dynamical models, allowing them to forecast the weather. Climate researchers have also used the same method to estimate the long-term evolution of the climate due to carbon emissions. But volcanologists are just beginning to explore whether the technique can also be used to forecast volcanic eruptions.

“The amount of satellite and ground-based geodetic data (i.e. GPS data) has tremendously increased recently,” says Bato. “The challenge is how to use these data efficiently and how to integrate them with models in order to have a deeper understanding of what occurs beneath the volcano and what drives the eruption so that we can determine near-real-time and accurate predictions of volcanic unrest.”

In their latest research, Bato and her colleagues have begun answering these questions by simulating one type of volcano—those which erupt with limited “explosivity” due to the build-up of underlying magma pressure. Through their exploratory simulations, Bato was able to correctly predict the excess pressure that drives a theoretical volcanic eruption, as well as the shape of the deepest underground magma reservoir and the flow rate of magma into the reservoir. Such reservoirs are typically miles below the surface and, as such, they’re nearly impossible to study with existing methods.

Geoscientists still need to improve current volcanic models before they can be widely applied to real-life volcanoes, but Bato and her colleagues are already beginning to test their methods on the Grímsvötn Volcano in Iceland and the Okmok Volcano in Alaska. They believe that their strategy will be a key step towards more accurate predictions of volcanic behavior.

“We foresee a future where daily or even hourly volcanic forecasts will be possible—just like any other weather bulletin,” says Bato.

This research is part of a broader collection of articles focused on volcanic hazard assessment.

Reference:
M. Grace Bato et al, Assimilation of Deformation Data for Eruption Forecasting: Potentiality Assessment Based on Synthetic Cases, Frontiers in Earth Science (2017). DOI: 10.3389/feart.2017.00048

Note: The above post is reprinted from materials provided by Frontiers.

Distant earthquakes can cause underwater landslides

Cascadia Subduction Zone. Data derived from NaturalEarthData.com, 10m datasets. Projected into NAD83 UTM 9N. Credit: Wikimedia Commons

New research finds large earthquakes can trigger underwater landslides thousands of miles away, weeks or months after the quake occurs.

Researchers analyzing data from ocean bottom seismometers off the Washington-Oregon coast tied a series of underwater landslides on the Cascadia Subduction Zone, 80 to 161 kilometers (50 to 100 miles) off the Pacific Northwest coast, to a 2012 magnitude-8.6 earthquake in the Indian Ocean – more than 13,500 kilometers (8,390 miles) away. These underwater landslides occurred intermittently for nearly four months after the April earthquake.

Previous research has shown earthquakes can trigger additional earthquakes on other faults across the globe, but the new study shows earthquakes can also initiate submarine landslides far away from the quake.

“The basic assumption … is that these marine landslides are generated by the local earthquakes,” said Paul Johnson, an oceanographer at the University of Washington in Seattle and lead author of the new study published in the Journal of Geophysical Research: Solid Earth, a journal of the American Geophysical Union. “But what our paper said is, ‘No, you can generate them from earthquakes anywhere on the globe.'”

The new findings could complicate sediment records used to estimate earthquake risk. If underwater landslides could be triggered by earthquakes far away, not just ones close by, scientists may have to consider whether a local or a distant earthquake generated the deposits before using them to date local events and estimate earthquake risk, according to the study’s authors.

The submarine landslides observed in the study are smaller and more localized than widespread landslides generated by a great earthquake directly on the Cascadia margin itself, but these underwater landslides generated by distant earthquakes may still be capable of generating local tsunamis and damaging underwater communications cables, according to the study authors.

A happy accident

The discovery that the Cascadia landslides were caused by a distant earthquake was an accident, Johnson said.

Scientists had placed ocean bottom seismometers off the Washington-Oregon coast to detect tiny earthquakes, and also to measure ocean temperature and pressure at the same locations. When Johnson found out about the seismometers at a scientific meeting, he decided to analyze the data the instruments had collected to see if he could detect evidence of thermal processes affecting seafloor temperatures, such as methane hydrate formation.

Johnson and his team combined the seafloor temperature data with pressure and seismometer data and video stills of sediment-covered instruments from 2011-2015. Small variations in temperature occurred for several months, followed by large spikes in temperature over a period of two to 10 days. They concluded these changes in temperature could only be signs of multiple underwater landslides that shed sediments into the water. These landslides caused warm, shallow water to become denser and flow downhill along the Cascadia margin following the 8.6-magnitude Indian Ocean earthquake on April 11, 2012, causing the temperature spikes.

The Cascadia margin runs for more than 1,100 kilometers (684 miles) off the Pacific Northwest coastline from north to south, encompassing the area above the underlying subduction zone, where one tectonic plate slides beneath another.

Steep underwater slopes hundreds of feet high line the margin. Sediment accumulates on top of these steep slopes. When the seismic waves from the Indian Ocean earthquake reached these steep underwater slopes, they jostled the thick sediments piled on top of the slopes. This shaking caused areas of sediment to break off and slide down the slope, creating a cascade of landslides all along the slope. The sediment did not fall all at once so the landslides occurred for up to four months after the earthquake, according to the authors.

The steeper-than-average slopes off the Washington-Oregon coast, such as those of Quinault Canyon, which descends 1,420 meters (4,660 feet) at up to 40-degree angles, make the area particularly susceptible to submarine landslides. The thick sediment deposits also amplify seismic waves from distant earthquakes. Small sediment particles move like ripples suspended in fluid, amplifying the waves.

“So these things are all primed, ready to collapse, if there is an earthquake somewhere,” Johnson said.

Disrupting the sediment record

The new finding could have implications for tsunamis in the region and may complicate estimations of earthquake risk, according to the study’s authors.

Subduction zones like the Cascadia margin are at risk for tsunamis. As one tectonic plate slides under the other, they become locked together, storing energy. When the plates finally slip, they release that energy and cause an earthquake. Not only does this sudden motion give any water above the fault a huge shove upward, it also lowers the coastal land next to it as the overlying plate flattens out, making the shoreline more vulnerable to the waves of displaced water.

Submarine landslides increase this risk. They also push ocean water out of the way when they occur, which could spark a tsunami on the local coast, Johnson said.

Scientists also use underwater sediment records to estimate earthquake risk. By drilling sediment cores offshore and calculating the age between landslide deposits, scientists can create a timeline of past earthquakes used to predict how often an earthquake might occur in the region in the future and how intense it could be.

An earthquake off the Pacific Northwest would create submarine landslides all along the coast from British Columbia to California. But the new study found that a distant earthquake might only result in landslides up to 20 or 30 kilometers (12 to 19 miles) wide. That means when scientists take sediment cores to determine how frequent local earthquakes occur, they may not be able to tell if the sediment layers arrived on the seafloor as a result of a distant or local earthquake.

Johnson says more core sampling over a wider range of the margin would be needed to determine a more accurate reading of the geologic record and to update estimates of earthquake risk.

Reference:
H. Paul Johnson et al, Sediment gravity flows triggered by remotely generated earthquake waves, Journal of Geophysical Research: Solid Earth (2017). DOI: 10.1002/2016JB013689

Note: The above post is reprinted from materials provided by University of Washington.

Sensitive faces helped dinosaurs eat, woo and take temperature, suggests study

Complex anastomosing neurovasculature surrounding infilled dental alveoli of the premaxilla of Neovenator. (A) Volume rendering of left premaxilla in lateral view with foramina highlighted (blue). (B) Volume rendering of infilled voids.

Dinosaurs’ faces might have been much more sensitive than previously thought, according to a University of Southampton study – helping them with everything from picking flesh from bones to wooing potential mates.

Experts used advanced X-ray and 3-D imaging techniques at the University’s μ-VIS X-Ray Imaging Centre to look inside the fossilised skull of Neovenator salerii – a large carnivorous land-based dinosaur found on the Isle of Wight, and currently housed in the Dinosaur Isle museum – and found evidence that it possessed an extremely sensitive snout of a kind previously only associated with aquatic feeders.

The blood vessels and nerves that supply the head are poorly documented in dinosaur fossils, but the new study published in online journal Scientific Reports shows that Neovenator may have possessed pressure receptors in the skin of its snout – similar to those which allow crocodiles to forage in murky water.

However, nothing about the 125-million-year-old dinosaur suggests it was an aquatic feeder, so researchers believe it must have developed such a sensitive snout for other purposes.

University of Southampton graduate Chris Barker, who was studying for his Masters degree in Vertebrate Palaeontology when he carried out the research, said: “The 3-D picture we built up of the inside of Neovenator’s skull was more detailed than any of us could have hoped for, revealing the most complete dinosaur neurovascular canal that we know of.

“The canal is highly branched nearest the tip of the snout. This would have housed branches of the large trigeminal nerve – which is responsible for sensation in the face – and associated blood vessels. This suggests that Neovenator had an extremely sensitive snout – a very useful adaptation, as dinosaurs used their heads for most activities.”

As well as being sensitive to touch, Neovenator might also have been able to receive information relating to stimuli such as pressure and temperature, which would have come in useful for many activities – from stroking each other’s faces during courtship rituals to precision feeding.

Images of the wear pattern on the dinosaur’s teeth appear to show that it actively avoided bone while removing flesh from bones.

Chris added: “Some modern-day species, such as crocodilians and megapode birds, use their snout to measure nest temperature, and in the case of crocodiles even pick up their young with extreme care, despite their huge mouths. Neovenator might well have done the same.

“Having such a sensitive snout could have had a social use too. Many birds – which are the descendants of dinosaurs – use their beaks in social display, and there is plenty of evidence that carnivorous dinosaurs engaged in face-biting among themselves, perhaps targeting the sensitivity of the face to make a point.”

Elis Newham, a University of Southampton PhD researcher who was also involved in the study, commented: “This finding comes at an exciting time in palaeontology, where we are using state-of-the-art technology to shed new light on the physiologies of extinct animals.

“Our results add a new level of detail to our understanding of the way large predatory dinosaurs interacted with the world around them. The range of exciting possibilities for such facial sensitivity show just how far we have come in our re-assessment of dinosaurs from lumbering beasts to complex, highly adapted organisms.”

Reference:
Chris Tijani Barker et al. Complex neuroanatomy in the rostrum of the Isle of Wight theropod Neovenator salerii, Scientific Reports (2017). DOI: 10.1038/s41598-017-03671-3

Note: The above post is reprinted from materials provided by University of Southampton.

Previously unknown extinction of marine megafauna discovered

Fossils from the Pliocene: shark tooth from carchahinus leucas on the left, from negaprion on the right. Credit: UZH

The disappearance of a large part of the terrestrial megafauna such as saber-toothed cat and the mammoth during the ice age is well known. Now, researchers at the University of Zurich and the Naturkunde Museum in Berlin have shown that a similar extinction event had taken place earlier, in the oceans.

New extinction event discovered

The international team investigated fossils of marine megafauna from the Pliocene and the Pleisto-cene epochs (5.3 million to around 9,700 years BC). “We were able to show that around a third of marine megafauna disappeared about three to two million years ago. Therefore, the marine megafaunal communities that humans inherited were already altered and functioning at a diminished diversity,” explains lead author Dr. Catalina Pimiento, who conducted the study at the Paleontological Institute and Museum of the University of Zurich.

Above all, the newly discovered extinction event affected marine mammals, which lost 55 per cent of their diversity. As many as 43 per cent of sea turtle species were lost, along with 35 per cent of sea birds and 9 per cent of sharks. On the other hand, the following new forms of life were to develop during the subsequent Pleistocene epoch: Around a quarter of animal species, including the polar bear Ursus, the storm petrel Oceanodroma or the penguin Megadyptes, had not existed during the Pliocene. Overall, however, earlier levels of diversity could not be reached again.

Effects on functional diversity

In order to determine the consequences of this extinction, the research team concentrated on shallow coastal shelf zones, investigating the effects that the loss of entire functional entities had on coastal ecosystems. Functional entities are groups of animals not necessarily related, but that share similar characteristics in terms of the function they play on ecosystems. The finding: Seven functional entities were lost in coastal waters during the Pliocene.

Even though the loss of seven functional entities, and one third of the species is relatively modest, this led to an important erosion of functional diversity: 17 per cent of the total diversity of ecological functions in the ecosystem disappeared and 21 per cent changed. Previously common predators vanished, while new competitors emerged and marine animals were forced to adjust. In addition, the researchers found that at the time of the extinction, coastal habitats were significantly reduced due to violent sea levels fluctuations.

Large warm-blooded marine animals are more vulnerable to global environmental changes

The researchers propose that the sudden loss of the productive coastal habitats, together with oceanographic factors such as altered sea currents, greatly contributed to these extinctions. “Our models have demonstrated that warm-blooded animals in particular were more likely to become extinct. For example, species of sea cows and baleen whales, as well as the giant shark Carcharocles megalodon disappeared,” explains Dr. Pimiento. “This study shows that marine megafauna were far more vulnerable to global environmental changes in the recent geological past than had previously been assumed.” The researcher also points to a present-day parallel: Nowadays, large marine species such as whales or seals are also highly vulnerable to human influences.

Reference:
Catalina Pimiento, John N. Griffin, Christopher F. Clements, Daniele Silvestro, Sara Varela, Mark D. Uhen, Carlos Jaramillo. The Pliocene marine megafauna extinction and its impact on functional diversity. Nature Ecology & Evolution, 2017; DOI: 10.1038/s41559-017-0223-6

Note: The above post is reprinted from materials provided by University of Zurich.

A skull with history: A fossil sheds light on the origin of the neocortex

A figure, which shows the skull of Kawingasaurus. Credit: Michael Laaß / Verlag Wiley-VCH

According to a recent study an early relative of mammals already possessed an extraordinarily expanded brain with a neocortex-like structure. This has been discovered by Michael Laaß from the Institute of General Zoology at the University of Duisburg-Essen (UDE).

Today, mammals possess large and efficient brains. But, what was the bauplan of the brain of their far relatives, the therapsids? When and why evolved the neocortex?

For his doctoral thesis the palaeontologist Michael Laaß invesitgated a ca. 255 million years old fossil skull of the therapsid Kawingasaurus fossilis in collaboration with Dr. Anders Kaestner from the Paul Scherrer Institute in Switzerland by means of neutron tomography and reconstructed the internal cranial anatomy in 3D.

The results were amazing: The relative brain volume of Kawingasaurus was about two or three-times larger than in other non-mammalian therapsids. Laaß: “Interestingly, Kawingasaurus already possessed a large forebrain with two distinct cerebral hemispheres.” Obviously, a neocortex-like structure at the forebrain similar to the mammalian neocortex was present in this animal.

Why is this brain structure evolved in Kawingasaurus? “Kawingasaurus was a burrower and special sensory adaptations were crucial for life under ground,” explained the UDE scientist. For example, this therapsid possessed frontally placed eyes, which were probably useful for binocular vision in dimlight environments as it is known from modern cats and owls. Furthermore, extremely ramified trigeminal nerve endings penetrated the snout, which might be an indication for a well developed sense of touch. The inner ear vestibules were also very large, which suggests that Kawingasaurus was well adapted to detect seismic vibrations from the ground.

Laaß: “These special sensory adaptaions also required a more efficient neural processing of the brain than in other therapsids.” It seems reasonable that these special adaptations of the sense organs and the brain to underground life triggered the expansion of the brain. Interestingly, a similar scenario for the origin of the neocortex has been also proposed for early mammals. Consequently, the recent study at the UDE supports this hypothesis.

Moreover, the new discovery also shows that a neocortex-like structure already developed in the therapsid Kawingasaurus about 25 million years earlier before the emergence of the first mammals. However, Kawingasaurus was not a direct ancestor of mammals. Consequently, neocortex-like structures evolved several times independently in pre-mammalian and mammalian evolution.

Reference:
Michael Laaß, Anders Kaestner. Evidence for convergent evolution of a neocortex-like structure in a late Permian therapsid. Journal of Morphology, 2017; DOI: 10.1002/jmor.20712

Note: The above post is reprinted from materials provided by Universität Duisburg-Essen.

Biodiversity loss from deep-sea mining will be unavoidable

Vent shrimp, a species found around hydrothermal vents on the seafloor, which are also rich in commercially valuable polymetallic sulfide deposits. Credit: NOAA Office of Ocean Exploration and Research

Biodiversity losses from deep-sea mining are unavoidable and possibly irrevocable, an international team of 15 marine scientists, resource economists and legal scholars argue in a letter published today in the journal Nature Geoscience.

The experts say the International Seabed Authority (ISA), which is responsible under the UN Law of the Sea for regulating undersea mining in areas outside national jurisdictions, must recognize this risk. They say it must also communicate the risk clearly to its member states and the public to inform discussions about whether deep-seabed mining should proceed, and if so, what standards and safeguards need to be put into place to minimize biodiversity loss.

“There is tremendous uncertainty about ecological responses to deep-sea mining,” said Cindy L. Van Dover, Harvey W. Smith Professor of Biological Oceanography at Duke University’s Nicholas School of the Environment. “Responsible mining needs to rely on environmental management actions that will protect deep-sea biodiversity and not on actions that are unproven or unreasonable.”

“The extraction of non-renewable resources always includes tradeoffs,” said Linwood Pendleton, International Chair in Marine Ecosystem Services at the European Institute of Marine Studies and an adjunct professor at Duke’s Nicholas School. “A serious trade-off for deep-sea mining will be an unavoidable loss of biodiversity, including many species that have yet to be discovered.”

Faced with this inevitable outcome, it’s more important than ever that we understand deep-sea ecosystems and have a good idea of what we stand to lose before mining alters the seafloor forever, said Pendleton, who also serves as a senior scholar in the Oceans and Coastal Policy Program at Duke’s Nicholas Institute for Environmental Policy Solutions.

Time is of the essence, the experts stress.

“Undersea deposits of metals and rare earth elements are not yet being mined, but there has been an increase in the number of applications for mining contracts,” said Elva Escobar of the National Autonomous University of Mexico’s Institute of Marine Sciences and Limnology. “In 2001, there were just six deep-sea mineral exploration contracts; by the end of 2017, there will be a total of 27 projects.”

These projects include 18 contracts for polymetallic nodules, six for polymetallic sulfides and four for ferromanganese crusts, Escobar said. Of these, 17 would take place in the Clarion-Clipperton Zone in the Pacific Ocean between Hawai’i and Central America.

Industry estimates that billions of tons of manganese, copper, nickel and cobalt lie on or beneath the seafloor. These metals are used in electrical generators and motors, metal alloys, batteries, paints, and many other products.

Some mining proponents have argued that companies could offset the inevitable damage their activities will cause by restoring coastal ecosystems or creating new artificial offshore reefs. “But this is like saving apple orchards to protect oranges,” Van Dover said.

“The argument that you can compensate for the loss of biological diversity in the deep sea with gains in diversity elsewhere is so ambiguous as to be scientifically meaningless,” said Craig Smith, professor of oceanography at the University of Hawai’i at Manoa.

Deep-sea ecosystems and species can take decades or even centuries to recover from a disturbance, if they recover at all, Van Dover noted.

The scale of some proposed mining operations — the largest of which will cover more than 83,000 square kilometers, an area larger than Maine — and the depths at which some mining is to be conducted (three miles or more below the sea surface) will make reclamation of the affected sites so cost-prohibitive as to be unrealistic, the authors argue. And the approaches needed to perform restorative action are still largely untested.

Deep-sea scientists and legal experts from the United States, Mexico, France, the United Kingdom, the Netherlands, Poland and Australia co-wrote the peer-reviewed correspondence with Van Dover, Pendleton, Escobar and Smith.

Reference:
C. L. Van Dover, J. A. Ardron, E. Escobar, M. Gianni, K. M. Gjerde, A. Jaeckel, D. O. B. Jones, L. A. Levin, H. J. Niner, L. Pendleton, C. R. Smith, T. Thiele, P. J. Turner, L. Watling, P. P. E. Weaver. Biodiversity loss from deep-sea mining. Nature Geoscience, 2017; DOI: 10.1038/ngeo2983

Note: The above post is reprinted from materials provided by Duke University.

Study details evidence for past large earthquakes in the Eastern Tennessee seismic zone

Clay-filled fissure in sediments at Douglas Lake, Tennessee. Credit: Randel Cox

The Eastern Tennessee Seismic Zone (ETSZ), a zone of small earthquakes stretching from northeastern Alabama to southwestern Virginia, may have generated earthquakes of magnitude 6 or greater within the last 25,000 years, according to a study published June 27 in the Bulletin of the Seismological Society of America.

The ETSZ is the second-most active natural seismic zone in the central and eastern United States, behind the New Madrid Seismic Zone in the Mississippi River region that produced the 1811-1812 magnitude 7+ earthquakes. In historic times, the ETSZ has not produced earthquakes larger than magnitude 4.8.

The ETSZ region is home to several nuclear power plants and hydroelectric dams related to the Tennessee Valley Authority, along with major population centers such as Knoxville and Chattanooga, making it important to determine whether the region is capable of a large damaging earthquake.

Randel Cox of the University of Memphis and colleagues searched for signs of ancient earthquakes below the muddy waterline of Douglas Lake, a 1943 Tennessee Valley Authority lake created by impounding the French Broad River. The level of the lake is drawn down in winter to accommodate snowmelt, which exposes river sediments and the signs of past seismic activity.

At two sites along the lake, the researchers uncovered clay-filled fractures, signs of soil liquefaction and polished rock shear fractures called slickenlines, that point to at least three past earthquakes in the area. At one site, a thrust fault with one meter displacement suggests that one of the earthquakes could have been magnitude 6 or even larger.

A combination of features convinced Cox and colleagues that they were looking at a record of past earthquakes rather than signs of an ancient landslide. The researchers are collecting data now indicating that these features cross valley floors, which “strongly corroborate the results of this paper, that these features are related to earthquakes,” said Cox.

Using a technique called optically stimulated luminescence to assign dates to the minerals contained in sediments surrounding these seismic features, Cox and colleagues narrowed the possible ages of these earthquakes to between 25,000 and 15,000 years ago. This would place them in the late Pleistocene, during the last North American ice age.

“I think we’ve got a pretty good case that this is related to active faulting, and that it does demonstrate that at least in periods of time in the past there have been strong earthquakes in the ETSZ,” said Cox.

Cox said it might be possible that these large earthquakes were only active during the late Pleistocene, when seismic stresses in the crust changed with the advance and retreat of massive ice sheets. “But we don’t have enough data right now to say whether or not this is some kind of ephemeral or maybe periodic activity,” he noted.

Post-ice age sediments, which might tell us more about the current potential for large earthquakes in the region, are mostly underwater as a result of Tennessee Valley Authority projects, Cox added.

Cox and colleagues also note that their study adds to a body of research suggesting that the Appalachian Mountains are undergoing a new period of uplift. “The ETSZ is right along the Smoky Mountains, which are a subrange of the Appalachians,” Cox said. “We may have found a fault that is accommodating the uplift of the Smokies.”

Reference:
“Paleoseismic evidence for multiple Mw 6 earthquakes in the Eastern Tennessee seismic zone during the late Quaternary,” Bulletin of the Seismological Society of America (2017). DOI: 10.1785/0120160161

Note: The above post is reprinted from materials provided by Seismological Society of America.

Hydraulic fracturing rarely linked to felt seismic tremors

Geophysicist Mirko Van der Baan is pictured at the University of Alberta, studies microseismicity, or tiny seismic events. Credit: John Ulan for the University of Alberta

New research suggests hydraulic fracturing and saltwater disposal has limited impact on seismic events.

For the past two years, UAlberta geophysicist Mirko Van der Baan and his team have been poring over 30 to 50 years of earthquake rates from six of the top hydrocarbon-producing states in the United States and the top three provinces by output in Canada: North Dakota, Ohio, Oklahoma, Pennsylvania, Texas, West Virginia, Alberta, British Columbia, and Saskatchewan.

With only one exception, the scientists found no province- or state-wide correlation between increased hydrocarbon production and seismicity. They also discovered that human-induced seismicity is less likely in areas that have fewer natural earthquakes.

The anomaly was in Oklahoma, where seismicity rates have changed dramatically in the last five years, with strong correlation to saltwater disposal related to increased hydrocarbon production.

“It’s not as simple as saying ‘we do a hydraulic fracturing treatment, and therefore we are going to cause felt seismicity.’ It’s actually the opposite. Most of it is perfectly safe,” said Van der Baan, who is also director of the Microseismicity Industry Consortium.

The findings, as well as continued monitoring, will help point industry experts toward developing mitigation strategies for the oft-maligned practice.

“What we need to know first is where seismicity is changing as it relates to hydraulic fracturing or saltwater disposal. The next question is why is it changing in some areas and not others,” continued Van der Baan. “If we can understand why seismicity changes, then we can start thinking about mitigation strategies.”

Though Van der Baan noted that hydraulic fracturing has been in practice since the 1950s, it has come under increased scrutiny in the last handful of years due to both increased production as well as the use of the increased treatment volumes. He said an important next step will be continued monitoring.

“Hydraulic fracturing is not going away. The important thing is that we need to find the balance between the economic impact and environmental sustainability of any industry,” he said.

Van der Baan will be sharing the studies’ findings extensively with industry and university students this fall when he travels to 25 different cities in North America to meet with as many different professional societies as this year’s Society for Exploration Geophysicists honorary lecturer.

“Human-induced seismicity and large-scale hydrocarbon production in the USA and Canada” appeared in the scientific journal Geochemistry, Geophysics, Geosystems, published by the American Geophysical Union.

Reference:
Mirko van der Baan, Frank J. Calixto. Human-induced seismicity and large-scale hydrocarbon production in the USA and Canada. Geochemistry, Geophysics, Geosystems, 2017; DOI: 10.1002/2017GC006915

Note: The above post is reprinted from materials provided by University of Alberta. Original written by Jennifer Pascoe.

Origins of Cu-Pb-Zn-bearing and W-bearing granites

Genetic model of the Middle-Late Jurassic Cu-Pb-Zn-bearing and W-bearing granites in the Nanling Range. Credit: Science China Press

The Nanling Range of South China is world famous for its widely developed, multiple-aged granitic magmatism and related polymetallic mineralization. Various kinds of granites have distinct diversities in terms of metallogenic specialization. A recent study revealed the different origins of the Middle-Late Jurassic Cu-Pb-Zn-bearing and W-bearing granites in the Nanling Range.

The study was reported in Science China Earth Sciences as the cover paper authored by the research group led by Prof. LU JianJun of Nanjing University.

The Middle-Late Jurassic Cu-Pb-Zn-bearing and W-bearing granites in the Nanling Range are obviously different in terms of their petrography and geochemistry. However, the mechanism that created these differences has not been well understood. In general, the W-bearing granites are considered to be the products of partial melting of an old metasedimentary basement. However, the petrogenesis of the Cu-Pb-Zn-bearing granites is still controversial. There is a time gap of about 5 Ma between the two types of ore-bearing granites, the significance of which still requires further investigation.

Based on detailed geochronological and geochemical studies of both the Tongshanling Cu-Pb-Zn-bearing and Weijia W-bearing granites in southern Hunan Province and combined with the other Middle-Late Jurassic Cu-Pb-Zn-bearing and W-bearing granites in the Nanling Range, a genetic model of the two different types of ore-bearing granites has been proposed (Figure 1). Asthenosphere upwelling and basaltic magma underplating were induced by the subduction of the palaeo-Pacific plate. The underplated basaltic magmas provided heat to cause a partial melting of the mafic amphibolitic basement in the lower crust, resulting in the formation of granodioritic magmas related Cu-Pb-Zn mineralization. As the underplating of basaltic magmas developed, the muscovite-rich metasedimentary basement in the upper-middle crust was partially melted to generate W-bearing granitic magmas. The compositional difference of granite sources accounted for the metallogenic specialization, and the non-simultaneous partial melting of one source followed by the other brought about a time gap of about 5 Ma between the Cu-Pb-Zn-bearing and W-bearing granites.

This research provides a new viewpoint for understanding the metallogenic specialization of granites. It not only improves the knowledge of the metallogenesis of granites and enlightens prospecting and exploration in the Nanling Range, but also provides valuable reference for the study of granite-related metallogenesis in South China and even in the world.

Reference:
XuDong Huang et al, Petrogenetic differences between the Middle-Late Jurassic Cu-Pb-Zn-bearing and W-bearing granites in the Nanling Range, South China: A case study of the Tongshanling and Weijia deposits in southern Hunan Province, Science China Earth Sciences (2017). DOI: 10.1007/s11430-016-9044-5

Note: The above post is reprinted from materials provided by Science China Press.

A Landslide-Induced Tsunami Hit Nuugaatsiaq, Greenland

“June 17, 2017” Over the weekend, a M=4.1 earthquake on Greenland’s western coast caused a massive landslide, triggering a tsunami that inundated small settlements on the coast.

At this stage, four people are feared to have died, nine others were injured, and 11 buildings were destroyed. In the hardest hit village, Nuugaatsiag, which is home to around 100 people, 40 people have been evacuated to Uummannaq, the eleventh-largest town in Greenland.

While this earthquake appears to be tectonic in nature, according to Professor Meredith Nettles of the Lamont-Doherty Earth Observatory at Columbia University, Greenland also experiences what are known as glacial earthquakes.


Earthquake in Greenland triggers fatal landslide-induced tsunami

A screen image of video shows houses close to Nuugaatsiag, Greenland, flooded by waves likely caused by an earthquake. Photograph credit: Oline Nielsen/AFP/Getty Images

“June 17, 2017” Over the weekend, a M=4.1 earthquake on Greenland’s western coast caused a massive landslide, triggering a tsunami that inundated small settlements on the coast. At this stage, four people are feared to have died, nine others were injured, and 11 buildings were destroyed. In the hardest hit village, Nuugaatsiag, which is home to around 100 people, 40 people have been evacuated to Uummannaq, the eleventh-largest town in Greenland “Video” .

While this earthquake appears to be tectonic in nature, according to Professor Meredith Nettles of the Lamont-Doherty Earth Observatory at Columbia University, Greenland also experiences what are known as glacial earthquakes. Glacial earthquakes are a relatively new class of seismic event, and are often linked to the calving of large outlet glaciers. While this type of event has also been observed in Antarctica, the majority have been recorded off the coast of Greenland, and show a strong seasonality, with most of them occurring late in the summer.

Because glacial earthquakes have a different mechanism than normal earthquakes, standard earthquake monitoring techniques cannot be used to detect them, which explains why they were not known about until 2003. Additionally, while a tectonic M=5 quake typically lasts about 2 seconds, a comparable M=5 glacial earthquake can emit long-period (great than 30 seconds) seismic waves. It is because of this, that they have a separate classification.

In order for a glacial earthquake to occur, a large-scale calving event has to take place. When a glacier calves, there is both a sudden change in glacial mass and motion. While a glacier is technically a river of ice, meaning it slowly flows downhill, when a large calving event take place, there is a brief period when horizontal motion reverses. Couple this with a downward deflection of the glaciers terminus, which causes a upward force on earth’s surface, and you have the recipe for a glacial earthquake. These earthquakes tend to be M=4.6-5.1.

Despite the fact that this tectonic quake was by no means large, it was big enough to trigger a massive landslide into the ocean, and the ensuing displacement of water was enough to form a tsunami that devastated parts of Nuugaatsiag. Prof. Nettles said to us, “The M=4.1 earthquake does not explain the large, long-period (slow) seismic signal detected by seismometers around the globe. The long-period signal appears to be due to a landslide, and the time of the long-period signal is later than the time of the high-frequency (earthquake) signal. It is possible the earthquake triggered the landslide.” What this means is that both the earthquake and landslide generated seismic signals, but that the earthquake signal appeared first, suggesting the quake triggered the slide. The video below shows a view of the landslide, while the photos show the landslide and the devastation caused by the tsunami. In response to this event, and the risk of aftershocks, people have been advised to stay away from the coastline.

Note: The above post is reprinted from materials provided by Temblor. The original article was written by David Jacobson.

Research Into New Metamaterial That Provides Earthquake Protection

Damage done to an office building by a 2010 earthquake in Concepción, Chile. Credit: Penn State

Earthquakes and explosions damage thousands of structures worldwide each year, destroying countless lives in their wake, but a team of researchers at Penn State is examining a completely new way of safeguarding key infrastructure, thanks to a $50,000 Multidisciplinary Research Seed Grant provided by the College of Engineering.

“The goal of the project is to protect critical structures,” said Cliff Lissenden, professor of engineering science and mechanics. “The structural design for earthquakes now requires the whole building to shake, which you can design for, but it’s quite an expensive proposition. Our idea is that if you can dissipate the earthquake before it gets to the structure, then you don’t have to design it to resist that ground motion.”

Parisa Shokouhi, principal investigator on the project and associate professor of civil engineering, and Lissenden will use a mixture of numerical and experimental study to evaluate the effectiveness of a proposed metamaterial in filtering, dissipating and averting surface waves caused by natural and man-made sources.

“What we are developing right now is a very simple model,” said Shokouhi. “We are considering a plate with rods that would act as local resonators, and we are looking into what combination and what geometry of rods will dissipate the incoming energy that is traveling through the plane.”

The first step to their project, a numerical study, will focus on finding the ideal size and arrangement of holes and their core elements. The researchers will do that by performing 2D and 3D finite element modeling and simulations. The model parameters will be systematically changed until they can obtain the most desired arrangement.

Based on the outcome of the numerical study, the researchers will then build and test a small-scale simplified model using the recommended formation. They will test a small aluminum plate with punched holes and steel rods to simulate the resonating units. A shaker or stack of piezo elements mounted on the plate will serve as the stimulus. The wave field across the plate will then be recorded.

Then, the team will replicate a scaled-down version of a life-size scenario using a soil-filled box on a shake table. The holes will be drilled in the compacted soil and the steel or wooden rods will be inserted. This will allow the team to study the effects of soil heterogeneity, non-elastic and nonlinear behavior, and water saturation on the performance of the metamaterial.

If the results are favorable, this research could lead to a fundamental change in the way engineers design structures to combat the damaging effects of earthquakes and explosions.

“I think there is a lot of potential, but we are trying to investigate the phenomenon from the bottom up to really understand what’s going on,” said Shokouhi. “We want to know exactly how these resonators stop these waves, so that we can design them effectively.”

Established in 2014, the Multidisciplinary Research Seed Grant program aims to help faculty attract high-impact multidisciplinary and center-level research funding from the state and federal government, industry or foundations. This one-year project will conclude in January 2018.

Note: The above post is reprinted from materials provided by Penn State College of Engineering.

Faulted Sedimentary Rock Layers, Guatemala

Photograph copyright J.K. Nakata, August, 1988

Photograph of faulted sedimentary rock layers exposed in a roadcut in Guatemala. The sedimentary rocks originally were deposited as horizontal layers of sand and gravel in streams and debris flows.

After their deposition, the consolidated sediment was broken by a moderately-dipping normal-slip fault that has dropped layers left of the fault down about 3 meters relative to layers to the right; note the small subsidiary fault that dips even more shallowly and joins the main fault above the person’s head.

These kinds of relations are common where rocks of the earth’s crust are stretched and pulled apart (extended), yielding faults like these that have normal dip-slip geometry.

Photo Copyright © J.K. Nakata, August, 1988/USGS

Australian origin likely for iconic New Zealand tree

GF Fruit Platter MKI: Metrosideros fossil fruits from 16-33 million years ago in Tasmania. Credit: Myall Tarran

Ancestors of the iconic New Zealand Christmas Tree, Pōhutukawa, may have originated in Australia, new fossil research from the University of Adelaide suggests.

Published in the American Journal of Botany, the research describes two new fossil species of Metrosideros, the scientific name for Pōhutukawa and related species. The fossils, found near St Helens, East Coast Tasmania, come from roughly the middle of the Cenozic era of about 25 million years ago.

“The Rātā, the most famous of which is the Pōhutukawa otherwise known as the New Zealand Christmas Tree, is one of New Zealand’s most iconic flowering plants, holding a special place in the hearts of Kiwis and is of particular significance in Maori culture,” says researcher Myall Tarran, PhD candidate in the University of Adelaide’s School of Biological Sciences. His research has been supervised by Professor Bob Hill, Executive Dean of the Faculty of Sciences at the University of Adelaide, and Dr Peter Wilson, a Principal Research Scientist at the Royal Botanic Gardens Sydney, in collaboration with Associate Professor Greg Jordan, University of Tasmania, and Honorary Associate Professor Mike Macphail, Australian National University.

“It is also one of, if not the, most widely spread flowering plant groups in the Pacific. It grows in Hawaii, Papua New Guinea, New Caledonia, Tahiti, the Bonin Islands near Japan, on sub-Antarctic islands, and many other islands in between, as well as having single representatives in Africa and South America.”

But surprisingly, Myall Tarran says considering the species’ unique and highly effective seed dispersal biology, Pōhutukawa is not found in Australia. In fact, Australia is the only major vegetated landmass in the Southern Hemisphere where Metrosideros does not occur today.

“The Rātā’s lightweight and robust seeds are able to be blown by light winds, survive freezing temperatures in the atmosphere and up to 30 days in salt water and still germinate,” he says. “This makes it hard to pin down where the genus might have originated. Metrosideros seems to have achieved most of its present distribution relatively recently through dispersal.”

“Previous work we have done described the oldest fossils of Metrosideros from the earlier Eocene-Oligocene (35-40 million years ago) in Tasmania, showing that the genus once did occur in Australia but has since become extinct,” says Mr Tarran.

“This new research, which identifies two new fossil species of Metrosideros from Tasmania from about 25 million years ago, shows that a diversity of the trees once grew in Australia. But these more recent fossils belong to a subgenus of Metrosideros that is less widely distributed than the earlier fossils, mainly in areas that were part of the great supercontinent Gondwana – in Papua New Guinea, the Philippines, New Caledonia and New Zealand.

“These species may not have been as well adapted for long-distance dispersal as those other species, and so it is likely that they originated here”

“The fact that fossils with affinities to both subgenera of Metrosideros have been found in Australia now is strong evidence that the diversity of Rātā first evolved in Australia, and that the genus may have had an Australian origin. The question still remains as to why they became extinct in Australia.”

Reference:
Myall Tarran et al. Two fossil species of(Myrtaceae) from the Oligo-Miocene Golden Fleece locality in Tasmania, Australia, American Journal of Botany (2017). DOI: 10.3732/ajb.1700095

Note: The above post is reprinted from materials provided by University of Adelaide.

Related Articles