Home Blog Page 124

Role aerosols play in climate change unlocked by spectacular Icelandic volcanic eruption

Image courtesy of Anja Schmidt / University of Leeds.

A spectacular six-month Icelandic lava field eruption could provide the crucial key for scientists to unlock the role aerosols play in climate change, through their interactions with clouds.

An international team of climate scientists, led by the University of Exeter, have meticulously studied the effects that the 2014-15 eruption at Holuhraun, in Iceland had on cloud formations in the surrounding region.

They found that the 2014-15 Holuhraun fissure eruption, the largest since Laki which erupted for eight months in 1783-4, emitted sulphur dioxide at a higher rate than all 28 European countries added together causing a massive plume of sulphate aerosol particles over the North Atlantic.

As would be expected, these aerosols reduced the size of cloud droplets, but contrary to expectations did not increase the amount of water in the clouds.

The researchers believe these startling results could significantly reduce uncertainties in future climate projections by outlining the impact of sulphate aerosols formed from human industrial emissions on climate change.

The pioneering study is published in leading scientific journal, Nature, on Thursday 22 June.

Dr Florent Malavelle, lead author of the study and from the Mathematics department at the University of Exeter said: “The huge volcanic eruption provided the perfect natural experiment in which to calculate the interaction between aerosols and clouds.

“We know that aerosols potentially have a large effect on climate, and particularly through their interactions with clouds. However the magnitude of this effect has been uncertain. This study not only gives us the prospect of ending this uncertainty but, more crucially, offers us the chance to reject a number of existing climate models, which means we can predict future climate change far more accurately than ever before.”

Aerosols play a pivotal role in determining the properties of clouds as they act as the nuclei on which water vapour in the atmosphere condenses to form clouds.

Sulphate aerosol has long been recognised as the most significant atmospheric aerosol from industrial sources, but other natural sources of sulphate aerosol also exist, including that formed from sulphur dioxide release as a result of volcanic eruptions.

The 2014-15 Holuhraun eruption is thought to have emitted between 40,000-100,000 tons of sulphur dioxide every single day during its eruptive phase. Using state-of-the-art climate system models, combined with detailed satellite retrievals supplied by NASA and the Université libre de Bruxelles, the research team were able to study the complex nature of the cloud cover formed as a result of the eruption.

They found that the size of the water droplets produce was reduced, which in turn led to cloud brightening – which results in an increased fraction of incoming sunlight being reflected back into space and, ultimately, providing a cooling effect on the climate.

Crucially however, these aerosols had no discernible effect on many other cloud properties, including the amount of liquid water that the clouds hold and the cloud amount. The team believe the research shows that cloud systems are “well buffered” against aerosol changes in the atmosphere.

Professor Jim Haywood, co-author of the paper and also from the University of Exeter added: “Explosive and effusive volcanic eruptions are very different. The massive explosive eruption of Pinatubo in 1991, which injected aerosol to altitudes of 25km+ into the stratosphere, has been the go-to event for improving our model simulations of the impact of explosive volcanic eruptions on climate.

“Now volcanoes have provided a new clue in the climate problem: how aerosols emitted at altitudes similar to those from human emissions impact the climate. Without a doubt, the effusive eruption at Holuhraun will become the go-to study in this regard.”

Reference:
Strong constraints on aerosol-cloud interactions from volcanic eruptions, Nature (2017). DOI :10.1038/nature22974

Note: The above post is reprinted from materials provided by University of Exeter.

Fossil holds new insights into how fish evolved onto land

3D yaw of main skull block of Lethiscus stocki (MCZ 2185). Scale is in millimeters.

“It’s like a snake on the outside, but a fish on the inside.”

The fossil of an early snake-like animal — called Lethiscus stocki — has kept its evolutionary secrets for the last 340-million years.

Now, an international team of researchers, led by the University of Calgary, has revealed new insights into the ancient Scottish fossil that dramatically challenge our understanding of the early evolution of tetrapods, or four-limbed animals with backbones.

Their findings have just been published in the research journal Nature. “It forces a radical rethink of what evolution was capable of among the first tetrapods,” said project lead Jason Anderson, a paleontologist and Professor at the University of Calgary Faculty of Veterinary Medicine (UCVM).

Before this study, ancient tetrapods — the ancestors of humans and other modern-day vertebrates — were thought to have evolved very slowly from fish to animals with limbs.

“We used to think that the fin-to-limb transition was a slow evolution to becoming gradually less fish like,” he said. “But Lethiscus shows immediate, and dramatic, evolutionary experimentation. The lineage shrunk in size, and lost limbs almost immediately after they first evolved. It’s like a snake on the outside but a fish on the inside.”

Lethicus’ secrets revealed with 3D medical imaging

Using micro-computer tomography (CT) scanners and advanced computing software, Anderson and study lead author Jason Pardo, a doctoral student supervised by Anderson, got a close look at the internal anatomy of the fossilized Lethiscus. After reconstructing CT scans its entire skull was revealed, with extraordinary results.

“The anatomy didn’t fit with our expectations,” explains Pardo. “Many body structures didn’t make sense in the context of amphibian or reptile anatomy.” But the anatomy did make sense when it was compared to early fish.

“We could see the entirety of the skull. We could see where the brain was, the inner ear cavities. It was all extremely fish-like,” explains Pardo, outlining anatomy that’s common in fish but unknown in tetrapods except in the very first. The anatomy of the paddlefish, a modern fish with many primitive features, became a model for certain aspects of Lethiscus’ anatomy.

Changing position on the tetrapod ‘family tree’

When they included this new anatomical information into an analysis of its relationship to other animals, Lethiscus moved its position on the ‘family tree’, dropping into the earliest stages of the fin-to-limb transition. “It’s a very satisfying result, having them among other animals that lived at the same time,” says Anderson.

The results match better with the sequence of evolution implied by the geologic record. “Lethiscus also has broad impacts on evolutionary biology and people doing molecular clock reproductions of modern animals,” says Anderson. “They use fossils to calibrate the molecular clock. By removing Lethiscus from the immediate ancestry of modern tetrapods, it changes the calibration date used in those analyses.”

Reference:
Jason D. Pardo, Matt Szostakiwskyj, Per E. Ahlberg, Jason S. Anderson. Hidden morphological diversity among early tetrapods. Nature, 2017; DOI: 10.1038/nature22966

Note: The above post is reprinted from materials provided by University of Calgary. Original written by Collene Ferguson.

Top Radioactive Minerals

What Are Radioactive Minerals?

Radioactivity in minerals are caused by the inclusion of naturally-occurring radioactive elements in the mineral’s composition. The degree of radioactivity is dependent on the concentration and isotope present in the mineral. For the most part, minerals that contain potassium (K), uranium (U), and thorium (Th) are radioactive.

There are four main radioactive isotopes that have lasted as long as the Earth:

  1. Uranium-239 (over 99% of all uranium) with a half-life of 4.5 billion years
  2. Uranium-235 (less than 1% of all uranium) with a half-life of 700 million years
  3. Thorium-232 (100% of Thorium) with a half-life of 14 billion years
  4. Potassium-40 (0.01% of all potassium) with a half-life of 1.28 billion years.

Top Radioactive Minerals

Minerals containing Thorium:

  • THORITE (Thorium Uranium Silicate)
  • THOROGUMMITE (Thorium Uranium Silicate Hydroxide)
  • MONAZITE (Cerium Lanthanum Thorium Neodymium Yttrium Phosphate)

Minerals containing Uranium:

  • URANINITE (Uranium Oxide)
  • AUTUNITE (Hydrated Calcium Uranyl Phosphate)
  • URANOPILITE (Hydrated Uranyl Sulfate Hydroxide)
  • ANDERSONITE (Hydrated Sodium Calcium Uranyl Carbonate)
  • BETAFITE (Calcium Sodium Uranium Titanium Niobium Tantalum Oxide Hydroxide Fluoride)
  • CARNOTITE (Hydrated Potassium Uranyl Vanadate)
  • COCONINOITE (Hydrated Iron Aluminum Uranyl Phosphate Sulfate Hydroxide)
  • META-ANKOLEITE (Hydrated Potassium Uranyl Phosphate)
  • META-AUTUNITE (Hydrated Calcium Uranyl Phosphate)
  • META-TORBERNITE (Hydrated Copper Uranyl Phosphate)
  • META-URANOCIRCITE (Hydrated Barium Uranyl Phosphate)
  • META-ZEUNERITE (Hydrated Copper Uranyl Arsenate)
  • PHOSPHURANYLITE (Hydrated Calcium Uranyl Phosphate Hydroxide)
  • TORBERNITE (Hydrated Copper Uranyl Phosphate)
  • TYUYAMUNITE (Hydrated Calcium Uranyl Vanadate)
  • URANOCIRCITE (Hydrated Barium Uranyl Phosphate)
  • WALPURGITE (Hydrated Bismuth Uranyl Arsenate Oxide)
  • ZEUNERITE (Hydrated Copper Uranyl Arsenate)
  • BOLTWOODITE (Hydrated Potassium Uranyl Silicate Hydroxide)
  • CUPROSKLODOWSKITE (Hydrated Copper Uranyl Silicate)
  • SKLODOWSKITE (Hydrated Magnesium Uranyl Silicate)
  • URANOPHANE (Hydrated Calcium Uranyl Silicate)
  • CLIFFORDITE (Uranium Tellurite)
  • MOCTEZUMITE (Lead Uranyl Tellurite)
  • SCHMITTERITE (Uranyl Tellurite)
  • ZIPPEITE (Hydrated Potassium Uranyl Sulfate Hydroxide)


Signs of past California ‘mega-quakes’ show danger of the Big One on San Andreas Fault

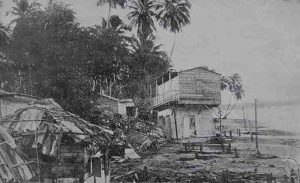
Ruins from the 1906 San Francisco earthquake, remembered as one of the worst natural disasters in United States history. Credit: Public Domain

As Interstate 10 snakes through the mountains and toward the golf courses, housing tracts and resorts of the Coachella Valley, it crosses the dusty slopes of the San Gorgonio Pass.

The pass is best known for the spinning wind turbines that line it. But for geologists, the narrow desert canyon is something of a canary in the coal mine for what they expect will be a major earthquake coming from the San Andreas Fault.

The pass sits at a key geological point, separating the low desert from the Inland Empire, and, beyond that, the Los Angeles Basin.

Through it runs an essential aqueduct that feeds Southern California water from the Colorado River as well as vital transportation links. It’s also the path for crucial power transmission lines.

California earthquake experts believe what happens at the San Gorgonio Pass during a major rupture of the San Andreas Fault could have wide-ranging implications for the region and beyond.

They worry a huge quake could sever lifelines at the pass for weeks or months, cutting Southern California off from major highway and rail routes as well as sources of power, oil and gas. Southern California’s cities are surrounded by mountains, making access through narrow passes like the San Gorgonio essential.

Experts have also expressed grave concerns about the Cajon Pass, where Interstate 15 and key electric and fuel lines run. Other problem spots are the Tejon Pass, through which Interstate 5 passes, and the Palmdale area, through which the California Aqueduct crosses.

One of the most dire scenarios geologists have studied is a quake that begins at the Salton Sea. Such a quake would be particularly dangerous because the fault’s shape points shaking energy toward Los Angeles.

Southern California has not seen an earthquake like this since humans started recording history here. But the geological evidence of such quakes is all around us.

Signs of megaquakes

In Desert Hot Springs, hints of the mighty San Andreas Fault lie all over: The rise of mountains that created the Coachella Valley. The oases and palm trees – made possible only because earthquakes pulverized rocks that allowed springs to burst to the surface.

A geologist’s trained eye can even spot exactly where the fault is located. In one exposed cliff, USGS research geologist Kate Scharer showed how one side of a hill has moved northward and skyward compared with the right side – and the gouge in the hillside between them was the fault.

Farther away, Scharer described how an old lower canyon was severed from the upper canyon and its ancient source of water.

Direction matters

There’s a reason why this particular scenario vexes scientists:

An earthquake arriving from this direction would point cataclysmic shaking directly into the heart of L.A., a kind of disaster that has not been seen since humans began recording history in California. Shaking could last for as long as three minutes.

In a magnitude 8.2 scenario, the earthquake would begin at the Salton Sea, and then – like a big rig driving on a freeway – speed up the San Andreas Fault toward Los Angeles County.

“It’s shooting all of that energy straight into the L.A. Basin,” Scharer said.

Why a quake that begins so far away matters

An earthquake that begins more than 100 miles from L.A. might seem like something you might not worry about.

But a magnitude 8.2 earthquake is no ordinary earthquake.

The traditional image of an earthquake might be to show the epicenter – the point at which the earthquake begins.

But that doesn’t tell the whole story.

A better representation of a large earthquake would show how the earthquake travels up the fault. And this becomes more important for large earthquakes, which require an incredible amount of area in which the sides of the fault move against each other.

So, according to seismologist Lucy Jones, if a San Andreas earthquake began at the Salton Sea and …

-ended at Mount San Gorgonio, it would be a 7.3 earthquake.

-stopped at the Cajon Pass, it would be a magnitude 7.6 or 7.7 seismic event.

-traveled up to Lake Hughes, the earthquake would clock in at 7.8.

-and “if it goes all the way from the way from the Salton Sea to near Paso Robles, we’d get an 8.2. So that’s probably the biggest we can have,” Jones said.

“I think it’s going to go all the way to Paso Robles,” Jones said of the next Big One.

Jones cited a recent study by Scharer that found that earthquakes happen at the San Andreas around the Grapevine on average every 100 years. It has been 160 years since the last major earthquake on that section of the fault.

Hope for L.A.

Here in the Coachella Valley and across the West Coast, scientists have been busy installing new seismic equipment as they construct an earthquake early warning system, which could give places like L.A. seconds – or even a minute or more – of warning before the shaking waves arrive from an earthquake.

The project, however, is in danger of losing funding. President Donald Trump’s proposed budget suggests ending federal funding for the early warning system. Southern California’s elected officials in Congress have voiced support for continuing funding of the project.

Here are some more answers to questions given by Jones and Scharer as they gave a tour to elected officials on a trip organized by the Southern California Association of Governments:

Why are we so concerned about the San Andreas Fault, when other faults are closer to cities?

The worst thing about an 8.2 on the San Andreas is that all of Southern California would be hit hard at the same time. San Bernardino, for instance, wouldn’t be able to call for help from Los Angeles, which would have its own problems.

“With 300 miles of fault all going in the same earthquake, you then have everybody affected at the same time,” Jones said. “The San Andreas is the one that will produce the earthquake that’s going to cause damage in every city” in Southern California – including Santa Barbara and San Diego.

Why is the San Andreas considered so likely to rupture?

Because it’s California’s fastest-moving fault.

“It’s a little bit like – the moron who is driving the fastest is the most likely to get into an accident,” Scharer said.

If a couple were holding hands across the San Andreas Fault, what would happen when the earthquake hits?

Here in Desert Hot Springs, the couple would be thrown down. The ground would shatter. And in a matter of seconds the two would be separated by as much as 30 feet, Scharer said, almost the entire length of a city bus.

One would lurch toward San Francisco, and the other toward the Mexican border.

Can the San Andreas trigger aftershocks on other faults closer to the city?

Yes. One scenario of a San Andreas earthquake results in aftershocks on the Newport-Inglewood fault, which runs between L.A.’s Westside through Orange County, and the Sierra Madre fault in the San Gabriel Valley. “We even had one in Sacramento,” Jones said.

Even the Hayward fault in the San Francisco Bay Area could be set off by an earthquake on the southern San Andreas Fault, Jones said.

This has happened before. The great 1906 San Francisco earthquake, estimated at being magnitude 7.7 to 7.9, sent a 5.5 aftershock to Santa Monica Bay and a magnitude 6 earthquake to Imperial County, near the Mexican border.

Can you explain how the San Andreas Fault works?

Western California – San Diego, Los Angeles, Santa Barbara – is moving to the northwest. Areas to the east of the fault are moving to the southeast.

How fast has the San Andreas Fault moved in the last million years?

It has moved about 22 miles in the last million years, Jones said.

When will the Big One hit?

We just don’t know. “Things don’t happen like clockwork,” Scharer said.

The San Andreas Fault does not slice under the city of Los Angeles. So why should Angelenos worry?

Los Angeles sits on a basin filled with sand and gravel.

So when shaking waves come, they “bang up against the side of the mountains and reverberate back out across the basin,” Scharer said. “Those waves are very effective at traveling through piles of gravel.”

Can scientists develop something that could absorb all the shaking energy from a massive earthquake before the city is hit?

No. The energy produced by a large San Andreas earthquake, “it’s like the size of a small nuclear bomb,” Scharer said.

An 8.2 earthquake would produce far more energy than what was produced by the nuclear bomb dropped on Hiroshima.

Do small earthquakes relieve pressure on the faults?

No. “Little earthquakes don’t get rid of big ones,” Jones said. “The more little earthquakes you have, the more you have to have bigger ones.”

How should cities cope with the earthquake risk?

Jones said utilities, such as water, electricity and gas, require more attention. “If we don’t deal with utilities … we aren’t going to be able and stay here and work,” she said.

Are California’s building codes equipped to deal with big earthquakes?

A few California cities have boosted safety regulations for older buildings in response to earthquakes. In recent years, several cities, including Los Angeles and San Francisco, began requiring retrofits of vulnerable apartment buildings. L.A. is even requiring retrofits of brittle concrete buildings.

But Jones is critical of minimum building standards for new construction in California, which she said allow for a 10 percent chance of new buildings collapsing and killing people in an earthquake.

Jones favors increasing standards for new construction, ordering new buildings designed so that they can be immediately occupied after an earthquake. She said that would increase costs by 1 percent.

“I think you need to be safe enough to walk into a building, so that you don’t lose the use of it – and so your neighbors don’t lose the use of their buildings,” she said.

Are new buildings built better elsewhere?

Jones says new buildings are stronger, for example, in Chile. That’s because the country makes those who build new buildings responsible if the structure suffers earthquake damage in the first decade after it is completed.

As a result, owners have insisted on strong construction, Jones said. And the country rode out a recent magnitude 8.8 earthquake well.

Note: The above post is reprinted from materials provided by Los Angeles Times. Distributed by Tribune Content Agency, LLC.

Tiny fossils reveal backstory of the most mysterious amphibian alive

Chinlestegophis jenkinsi was a tiny subterranean carnivore and is an ancient relative of frogs and salamanders. Credit: Jorge Gonzalez

Researchers have determined that the fossils of an extinct species from the Triassic Period are the long-missing link that connects Kermit the Frog’s amphibian brethren to wormlike creatures with a backbone and two rows of sharp teeth.

Named Chinlestegophis jenkinsi, the newfound fossil is the oldest relative of the most mysterious group of amphibians: caecilians. Today, these limbless, colorful serpentine carnivores live underground and range in size from 6 inches to 5 feet.

“Our textbook-changing discovery will require paleontologists to re-evaluate the timing of the origin of modern amphibian groups and how they evolved,” said Adam Huttenlocker, senior author of the study and an assistant professor in the Department of Integrative Anatomical Sciences at the Keck School of Medicine of USC.

The study, published in Proceedings of the National Academy of Sciences on June 19, expands the known history of frogs, toads and salamanders by at least 15 million years and closes a major gap in early caecilian evolution by connecting them to stereospondyls, animals with toilet-seat heads that were the most diverse amphibian group during the Triassic era more than 200 million years ago.

Scientists previously believed the story of the stereospondyl order was a dead-end because, although widespread during the Triassic Period, the animals were believed to be unrelated to anything alive today. The two recently discovered fossils dispel that theory and suggest that the amphibian lineage of today evolved from a common ancestor some 315 million years ago.

“Caecilians are hard to find in the fossil record because most are so small,” Huttenlocker said. “Chinlestegophis jenkinsi still preserves a lot of the primitive morphology that is shared with other Triassic amphibians, namely their four legs.”

Before C. jenkinsi, scientists had found only two other caecilian fossils from the Age of Dinosaurs and—unlike the two recently unearthed—those came later and had reduced limbs, more closely resembling their contemporary living relatives.

“It’s possible that the things that frog and salamander tissue can do when it comes to scarless healing are also present in human DNA but may be turned off,” said Jason Pardo, lead author of the study and a doctoral candidate in the Faculty of Veterinary Medicine at the University of Calgary in Alberta, Canada. “Because humans are also vertebrates, we enhance our understanding of our own evolutionary history and genetic heritage when we gain understanding of the amphibian lineage.”

Solving mysteries in vertebrate evolution

There are currently fewer than 200 species of caecilians, which live in the wet, tropical regions of South America, Africa and Southeast Asia. But the two ancient fossil amphibians found in the late 1990s by Bryan Small, study co-author and a research associate at Texas Tech University, were preserved in the fossilized burrows of Eagle County, Colo.

The paleontologists used 3-D X-rays to reassemble the fossil remains of two C. jenkinsi specimens. Parts of a skull, spinal column, ribs, shoulder and legs survived in the fossils of the first specimen. Only the skull was distinguishable in the second specimen.

“Twenty to 30 years ago, we weren’t even sure of the origins of birds,” Pardo said. “Now we are solving some of the final remaining mysteries when it comes to what sorts of animals the major vertebrate groups evolved from. Caecilians, turtles and some fish are the only major vertebrate groups that paleontologists still have questions about.”

Characteristics of the ancient caecilian

The burrows these fossils were preserved in were almost 2 inches wide, meaning they could not have been very big. Their bullet-shaped skulls were just under 1 inch long, so the ancient caecilian was probably about the size of a small salamander, Huttenlocker said.

The length of the animal is unknown because researchers do not have the full fossil remains of the animal, but Pardo estimates that the ancient caecilian was between 6 inches to a foot long. As a small carnivore, it probably ate insects.

Its eyes would have been functional but tiny. Some of today’s caecilians do not have eyes or they are hidden under moist skin.

During the summer, this central Colorado area would have been scorching, which is probably why these subterranean animals thrived. Big dinosaurs like early relatives of the Tyrannosaurus rex and Triceratops could not have existed in such conditions, Huttenlocker said.

“The ancient caecilians lived in these burrows deep in the soil down to about the level of the water table so that they could keep wet and avoid the extreme aridity from the dry season,” Huttenlocker said. “I’m going back to Colorado this summer and hope to find more animals with more complete skeletons. We’ll find one. This is just the initial report.”

Reference:
Jason D. Pardo el al., “Stem caecilian from the Triassic of Colorado sheds light on the origins of Lissamphibia,” PNAS (2017). DOI: 10.1073/pnas.1706752114

Note: The above post is reprinted from materials provided by University of Southern California.

Volcanic eruptions triggered dawn of the dinosaurs

Image credit: Shutterstock

Huge pulses of volcanic activity are likely to have played a key role in triggering the end Triassic mass extinction, which set the scene for the rise and age of the dinosaurs, new Oxford University research has found.

The Triassic extinction took place approximately 200 million years ago, and was proceeded by the dinosaur era. One of the largest mass extinctions of animal life on record, the casualty list includes large crocodile-like reptiles and several marine invertebrates. The event also caused huge changes in land vegetation, and while it remains a mystery why the dinosaurs survived this event, they went on to fill the vacancies left by the now extinct wildlife species, alongside early mammals and amphibians. This mass extinction has long been linked to a large and abrupt release of carbon dioxide into the atmosphere, but the exact source of this emission has been unknown.

Following the discovery of volcanic rocks of the same age as the extinction, volcanic carbon dioxide (CO2) emissions had previously been suggested as an important contributor to this extinction event. Previous studies have also shown that this volcanism might have occurred in pulses, but the global extent and potential impact of these volcanic episodes has remained unknown. These volcanic rocks covered a huge area, across four continents, representing the Central Atlantic Magmatic Province (CAMP).

Researchers from the Oxford University Department of Earth Science worked in collaboration with the Universities of Exeter and Southampton to trace the global impact of major volcanic gas emissions and their link to the end of the Triassic period. The findings link volcanism to the previously observed repeated large emissions of carbon dioxide that had a profound impact on the global climate, causing the mass extinction at the end of the Triassic Period, as well as slowing the recovery of animal life afterwards.

By investigating the mercury content of sedimentary rocks deposited during the extinction, the study findings revealed clear links in the timing of CAMP volcanism and the end-Triassic extinction. Volcanoes give off mercury gas emissions, which spread globally through the atmosphere, before being deposited in sediments. Any sediments left during a large volcanic event would therefore be expected to have unusually high mercury content.

The team sourced six sediment deposits were sourced from the UK, Austria, Argentina, Greenland, Canada and Morocco, and their mercury levels analysed. Five of the six records showed a large increase in mercury content beginning at the end-Triassic extinction horizon, with other peaks observed between the extinction horizon and the Triassic-Jurassic boundary, which occurred approximately 200 thousand years later.

Elevated mercury emissions also coincided with previously established increases in atmospheric CO2 concentrations, indicating CO2 release from volcanic degassing.

Lawrence Percival, Lead author and Geochemistry Graduate student at Oxford University, said: “These results strongly support repeated episodes of volcanic activity at the end of the Triassic, with the onset of volcanism during the end-Triassic extinction.

“This research greatly strengthens the link between the Triassic mass extinction and volcanic emissions of CO2. This further evidence of episodic emissions of volcanic CO2 as the likely driver of the extinction enhances our understanding of this event, and potentially of other climate change episodes in Earth’s history.”

The full paper features in the journal Proceedings of the National Academy of Sciences.

Reference:
Lawrence M. E. Percival el al., “Mercury evidence for pulsed volcanism during the end-Triassic mass extinction,” PNAS (2017). DOI: 10.1073/pnas.1705378114

Note: The above post is reprinted from materials provided by University of Oxford.

World’s Deepest Undersea Volcano

Hot magma blows up into the water before settling to the seafloor. Foreground: Jason remotely-operated vehicle with sampling hoses. Image is about 6-10 feet across in an eruptive area about 100 yards that runs along the summit. Credit: NOAA and NSF

Scientists funded by NOAA and the National Science Foundation recorded the deepest erupting volcano yet discovered, describing high-definition video of the undersea eruption as “spectacular.” Eruption of the West Mata volcano, discovered in May, occurred nearly 4,000 feet below the surface of the Pacific Ocean, in an area bounded by Fiji, Tonga and Samoa.

Imagery includes large molten lava bubbles approximately three feet across bursting into cold seawater, glowing red vents explosively ejecting lava into the sea, and the first-observed advance of lava flows across the deep-ocean seafloor. Sounds of the explosive eruption were recorded by a hydrophone and later matched to the video footage.

“We found a type of lava never before seen erupting from an active volcano, and for the first time observed molten lava flowing across the deep-ocean seafloor,” said the mission’s Chief Scientist Joseph Resing, a chemical oceanographer at the University of Washington who collaborates with NOAA through the Joint Institute for the Study of the Atmosphere and Ocean. “Though NOAA and partners discovered a much shallower eruption in 2004 in the Mariana Arc, the deeper we get, the closer the eruption is to those that formed most of the oceanic crust.”

“It was an underwater Fourth of July – a spectacular display of fireworks nearly 4,000 feet deep,” said Co-Chief Scientist Bob Embley, a marine geologist based in the Newport, Ore., office of NOAA’s Pacific Marine Environmental Laboratory. “Since the water pressure at that depth suppresses the violence of the volcano’s explosions, we could get the underwater robot within feet of the active eruption. On land, or even in shallow water, you could never hope to get this close and see such great detail,” he said.

Mission scientists released the video and discussed their scientific observations at a Dec. 17 news conference at the American Geophysical Union’s annual fall meeting in San Francisco.

“For the first time we have been able to examine, up close, the way ocean islands and submarine volcanoes are born,” says Barbara Ransom, program director in NSF’s Division of Ocean Sciences. “The unusual primitive compositions of the West Mata eruption lavas have much to tell us.”

The West Mata volcano is producing Boninite lavas, believed to be among the hottest erupting on Earth in modern times, and a type only seen before on extinct volcanoes older than a million years. University of Hawaii geochemist Ken Rubin believes this active Boninite eruption provides a unique opportunity to study magma formation at volcanoes and how the Earth recycles material where one tectonic plate is subducted under another – a long-term goal of many Earth scientists.

Water from the volcano is very acidic, with some samples collected directly above the eruption measuring somewhere between battery acid and stomach acid. Julie Huber, a microbiologist at the Marine Biological Laboratory, found diverse microbes even in such extreme conditions.

Tim Shank, a biologist at the Woods Hole Oceanographic Institution (WHOI), found shrimp were the only animals thriving in the acidic vent water near the eruption. Shank is analyzing shrimp DNA to determine if they are the same species as those found at eruptive seamounts more than 3,000 miles away.

Mission scientists believe 80 percent of eruptive activity on Earth takes place in the ocean, and most volcanoes are in the deep ocean. Until this discovery, NOAA and NSF had sponsored research on submarine volcanoes for 25 years without observing a deep-ocean eruption. Scientists believe further study of active deep-ocean eruptions will provide a better understanding of oceanic cycles of carbon dioxide and sulfur gases, how heat and matter are transferred from the interior of the Earth to its surface, and how life adapts to some of the harshest conditions on Earth.

The science team operated from the University of Washington’s research vessel Thomas Thompson, and deployed Jason, a remotely-operated underwater robot operated by WHOI that is recognized as one of the most capable in the world. Jason collected samples using its manipulator arms and obtained imagery using a prototype still and HD imaging system developed and operated by the Advanced Imaging and Visualization Lab at WHOI.

Other participants included Oregon State University, Monterey Bay Aquarium Research Institute, Western Washington University, Portland State University, Harvard University, the University of Tulsa, California State University’s Moss Landing Marine Laboratory, the University of California Santa Cruz and Lamont Doherty Earth Observatory.

The National Science Foundation is an independent U.S. government agency responsible for promoting science and engineering through research programs and education projects.

NOAA understands and predicts changes in the Earth’s environment, from the depths of the ocean to the surface of the sun, and conserves and manages our coastal and marine resources.

Note: The above post is reprinted from materials provided by National Oceanic and Atmospheric Administration.

Researchers develop advanced 3D models of bite data to Study Dinosaurs, Birds, Crocodiles

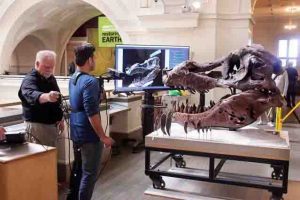
Casey Holliday and his team developed three-dimensional models of the skull of the American alligator using cutting-edge imaging and computational tools. Credit: Casey Holliday

The skulls of alligators protect their brains, eyes and sense organs while producing some of the most powerful bite forces in the animal kingdom. The ability to bite hard is critical for crocodilians to eat their food such as turtles, wildebeest and other large prey; therefore, their anatomy is closely studied by veterinarians and paleontologists who are interested in animal movements and anatomy. Now, researchers at the University of Missouri and the University of Southern Indiana have developed three-dimensional models of the skull of the American alligator using cutting-edge imaging and computational tools. The researchers validated their simulations using previously reported bite-force data proving their accuracy. These models also can assist scientists in studying the origins and movements of extinct species and other animals.

“Collecting bite data from live animals like alligators can be pretty dangerous and potentially deadly, so accurate 3-D models are the best way for biomechanists, veterinarians, and paleontologists interested in the function and evolution of these amazing animals to study them,” said Casey M. Holliday, associate professor of pathology and anatomical sciences in the MU School of Medicine. “It is impossible to analyze the bite forces in extinct hard-biting species like the giant Cretaceous crocodile Deinosuchus, or the famous bone-crunching dinosaur Tyrannosaurus rex, so precise models are imperative when studying extinct species.”

The team’s approach was to first report naturalistic, three-dimensional computational modeling of the jaw muscles that produce forces within the alligator skulls to better understand how bite forces change during growth. Then, they compared their findings to previously reported bite forces collected from live alligators.

“Because alligators and crocodilians have had such extreme feeding performance for millions of years, they have been a popular topic of study for paleontologists and biologists,” said Kaleb Sellers, a doctoral student in Holliday’s lab. “Our models stand out because we’re the first to distribute loads of their huge muscles across their attachment surfaces on the alligator skull. This lets us better understand how muscle forces and bite forces impact the skull.”

These new methods and findings pave the way to better understanding the 3-D biomechanical environment, development and evolution of the skull of not only alligators, but other crocodilians, birds, dinosaurs and other vertebrates, Holliday said.

Reference:
Kaleb C. Sellers et al. Ontogeny of bite force in a validated biomechanical model of the American alligator, The Journal of Experimental Biology (2017). DOI: 10.1242/jeb.156281

Note: The above post is reprinted from materials provided by University of Missouri-Columbia.

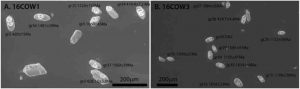
Volcanic Crystals Give a New View of Magma

Zircon crystals deposited in a New Zealand eruption record a cooler volcanic history below the surface than expected. Credit: Kari Cooper/UC Davis

Volcanologists are gaining a new understanding of what’s going on inside a shallow magma reservoir that lies below an active volcano and they’re finding a colder, more solid place than previously thought, according to new research published June 16 in the journal Science. It’s a new view of how volcanoes work, and could eventually help volcanologists get a better idea of when a volcano poses the most risk.

Chad Deering, an assistant professor of geology at Michigan Technological University, is one of the co-authors who helped lead field research on New Zealand’s North Island. The team extracted zircon minerals from volcanic rocks around the slopes of Mt. Tarawera, deposited during the Kaharoa eruption in 1314, which is New Zealand’s largest eruption in the last millennia.

“It takes a long time to build up a magma body,” Deering said. “But it may not be in an eruptible state that whole time.”

He adds that ongoing research shows that a lot of magma–particularly silicic magma that freezes completely into granite or reaches a melt-rich state and explodes in big eruptions–is more like mush than pure liquid. The Kaharoa zircons were in contact with liquid, and their crystals record a history of long spans of cooling with only punctuated periods of heating that leave the magma in an eruptible state.

Black Box of Magma

It’s hard to study magma directly. Even at volcanic sites, it lies miles beneath the Earth’s surface and while geologists have occasionally drilled into magma by accident or design, heat and pressure destroy any instrument you could try to put into it.

Instead, Deering along with corresponding author Kari Cooper from the University of California-Davis and their colleagues study the chemical log recorded in the zircon crystals from Mt. Tarawera. The Kaharoa eruption, roughly five times the size of Mt. St Helens in 1980, brought the zircons up, which had been exposed to much of the record of temperature and chemistry changes in the magma reservoir history. Once on the surface, that record of the past was frozen in place.

The crystals are like a “black box” flight recorder for studying volcanic eruptions, Cooper said. “Instead of trying to piece together the wreckage, the crystals can tell us what was going on while they were below the surface, including the run up to an eruption.”

By studying trace components within seven zircon crystals, they could determine when the crystals first formed and how long during their life within the magma reservoir they were exposed to high heat (over 700 degrees Celsius). The crystals give information about the state of the part of the magma reservoir in which they resided.

The researchers found that all but one of the seven crystals were at least tens of thousands of years old, but had spent only a small percentage (less than about four percent) exposed to molten magma.

A Snowcone Not A Molten Lake

The picture that emerges, Cooper said, is less a seething mass of mostly liquid molten rock than something like a snowcone: mostly solid and crystalline, with a little liquid seeping through it.

To create an eruption, a certain amount of that solid, crystalline magma has to melt and mobilize, possibly by interacting with hotter liquid stored elsewhere in the reservoir. The pre-eruption magma likely draws material from different parts of the reservoir, and it happens very quickly in geological time – over decades to centuries. That implies that it may be possible to identify volcanoes that pose the highest risk of eruption by looking for those where the magma is most mobile.

Interestingly, all the crystals studied had remained unmelted in Mt. Tarawera’s magma reservoir through a gigantic eruption that occurred about 25,000 years ago, before being blown out in the smaller eruption 700 years ago. That shows that magma mobilization must be a complex process.

“To understand volcanic eruptions, we need to be able to decipher signals the volcano gives us before it erupts,” says Jennifer Wade, a program director in the National Science Foundation’s Division of Earth Sciences, which funded the research. “This study backs up the clock to the time before an eruption, and uses signals in crystals to understand when magma goes from being stored to being mobilized for an eruption.”

Reference:
A.E. Rubin el al., “Rapid cooling and cold storage in a silicic magma reservoir recorded in individual crystals,” Science (2017). DOI: 10.1126/science.aam8720

Note: The above post is reprinted from materials provided by Michigan Technological University.
Japanese slow earthquakes could shed light on tsunami generation

Map of the area at the subduction zone where the bore holes are located. Small map gives general location and pull out map shows detail of the layout. Credit: Demian Saffer, Penn State

Understanding slow-slip earthquakes in subduction zone areas may help researchers understand large earthquakes and the creation of tsunamis, according to an international team of researchers that used data from instruments placed on the seafloor and in boreholes east of the Japanese coast.

“This area is the shallowest part of the plate boundary system,” said Demian Saffer, professor of geosciences, Penn State. “If this region near the ocean trench slips in an earthquake, it has the potential to generate a large tsunami.”

Two tectonic plates meet here, the Pacific Plate and the Eurasian Plate, in a subduction zone where the Pacific plate slides beneath the Eurasian plate. This type of earthquake zone forms the “ring of fire” that surrounds the Pacific Ocean, because once the end of the plate that is subducting — sliding underneath — reaches the proper depth, it triggers melting and forms volcanoes. Mt. St. Helens in the American Cascade Mountains is one of these volcanoes, as is Mt. Fuji, about 60 miles southwest of Tokyo. Subduction zones are often also associated with large earthquakes.

The researchers focused their study on slow earthquakes, slip events that happen over days or weeks. Recent research by other groups has shown that these slow earthquakes are an important part of the overall patterns of fault slip and earthquake occurrence at the tectonic plate boundaries and can explain where some of the energy built up on a fault or in a subduction zone goes.

“These valuable results are important for understanding the risk of a tsunami,” says James Allan, program director in the National Science Foundation’s Division of Ocean Sciences, which supports IODP. “Such tidal waves can affect the lives of hundreds of thousands of people and result in billions of dollars in damages, as happened in Southeast Asia in 2004. The research underscores the importance of scientific drillship-based studies, and of collecting oceanographic and geologic data over long periods of time.”

In 2009 and 2010, the IODP (Integrated Ocean Drilling Program, now the International Ocean Discovery Program) NanTroSEIZE project drilled two boreholes in the Nankai Trough offshore southwest of Honshu, Japan, and in 2010 researchers installed monitoring instruments in the holes that are part of a network including sensors on the seafloor. Saffer and Eiichiro Araki, senior research scientist, Japan Agency for Marine-Earth Science and Technology, co-lead authors, published their results today (June 16) in Science. The two boreholes were 6.6 miles apart, straddling the shallow boundary of slip in the last major earthquake in this area, which occurred in 1944 and measured magnitude 8.1. The accompanying tsunami that hit Tokyo was 26 feet in height.

“Until we had these data, no one knew if zero percent or a hundred percent of the energy in the shallow subduction zone was dissipated by slow earthquakes,” said Saffer. “We have found that somewhere around 50 percent of the energy is released in slow earthquakes. The other 50 percent could be taken up in permanent shortening of the upper plate or be stored for the next 100- or 150-year earthquake. We still don’t know which is the case, but it makes a big difference for tsunami hazards. The slow slip could reduce tsunami risk by periodically relieving stress, but it is probably more complicated than just acting as a shock absorber.”

The researchers found a series of slow slip events on the plate interface seaward of recurring magnitude 8 earthquake areas east of Japan. These slow earthquakes lasted days to weeks, some triggered by other unconnected earthquakes in the area and some happening spontaneously. According to the researchers, this family of slow earthquakes occurred every 12 to 18 months.

“The area where these slow earthquakes take place is uncompacted, which is why it has been thought that these shallow areas near the trench act like a shock absorber, stopping deeper earthquakes from reaching the surface,” said Saffer. “Instead we have discovered slow earthquakes of magnitude 5 or 6 in the region that last from days to weeks.”

These earthquakes typically go unnoticed because they are so slow and very far offshore.

The researchers also note that because earthquakes that occur at a distance from this subduction zone, without any direct connection, can trigger the slow earthquakes, the area is much more sensitive than previously thought. The slow earthquakes are triggered by the shaking, not by any direct strain on the area.

“The question now is whether it releases stress when these slow earthquakes occur,” said Saffer. “Some caution is required in simply concluding that the slow events reduce hazard, because our results also show the outer part of the subduction area can store strain. Furthermore, are the slow earthquakes doing anything to load deeper parts of the area that do cause big earthquakes? We don’t know.”

Note: The above post is reprinted from materials provided by Penn State.

Animal evolution: Hot start, followed by cold shock

Red Sea Sponge. Credit: Image Gert Wörheide

The initial phases of animal evolution proceeded faster than hitherto supposed: New analyses suggest that the first animal phyla emerged in rapid succession — prior to the global Ice Age that set in around 700 million years ago.

The fossil record reveals that almost all of the animal phyla known today had come into existence by the beginning of the Cambrian Period some 540 million years ago. The earliest known animal fossils already exhibit complex morphologies, which implies that animals must have originated long before the onset of the Cambrian. However, taxonomically assignable fossils that can be confidently dated to pre-Cambrian times are very rare. In order to determine what the root of their family tree looked like, biologists need reliable dating information for the most ancient animal subgroups — the sponges, cnidarians, comb jellies and placozoans. Dr. Martin Dohrmann and Professor Gert Wörheide of the Division of Palaeontology and Geobiology in the Department of Earth and Environmental Sciences at Ludwig-Maximilians-Universitaet (LMU) in Munich have now used a new strategy based on the so-called molecular-clock to investigate the chronology of early animal evolution and produce a new estimate for the ages of the oldest animal groups. Their findings appear in the journal Scientific Reports.

The molecular clock approach is based on the principle that mutations accumulate in the genomes of all organisms over the course of time. The extent of the genetic difference between two lineages should therefore depend on the time elapsed since they diverged from their last common ancestor. “Our study is based on a combination of genetic data from contemporary animals and information derived from well dated fossils, which we analyzed with the help of complex computer algorithms,” Dohrmann explains. For the study, the researchers used an unusually large dataset made up of the sequences of 128 proteins from 55 species, including representatives of all the major animal groups, focusing in particular on those that diverged very early.

The analysis confirms the conclusion reached in an earlier study, which dated the origin of animals to the Neoproterozoic Era, which lasted from 1000 to 540 million years ago. However, much to their surprise, the results also suggested that the earliest phyla, and the ancestors of all bilateral animal species (the so-called Bilateria), originated within the — geologically speaking — short time-span of 50 million years. “In addition, this early phase of evolutionary divergence appears to have preceded the extreme climate changes that led to Snowball Earth, a period marked by severe long-term global glaciation that lasted from about 720 to 635 million years ago,” Dohrmann says. In order to assess the plausibility of the new findings, the researchers plan to carry out further analyses using more extensive datasets and improved statistical methods.” To arrive at well-founded conclusions with respect to the morphology and ecology of the earliest animals, we also need to know more about the environmental conditions that prevailed during the Neoproterozoic, and we need more fossils that can be confidently assigned to specific taxonomic groups,” Wörheide says.

Reference:
Martin Dohrmann, Gert Wörheide. Dating early animal evolution using phylogenomic data. Scientific Reports, 2017; 7 (1) DOI: 10.1038/s41598-017-03791-w

Note: The above post is reprinted from materials provided by Ludwig-Maximilians-Universität München.

Ancient otter tooth found in Mexico suggests mammals migrated across America

A rendering of the ancient sea otter’s skull. Credit: Jack Tseng, University at Buffalo

Late in the afternoon on a hot March day in central Mexico, a paleontologist uncovered a jaw bone and called over to Jack Tseng.

Tseng, PhD, assistant professor in the Department of Pathology and Anatomical Sciences in the Jacobs School of Medicine and Biomedical Sciences at the University at Buffalo, was on the dig researching intercontinental immigration of fossil mammals.

“I thought it was a badger,” Tseng said, “but a colleague on the site had just finished a study of otters, and he said it was sea otter-like. But what would a sea otter be doing in central Mexico?”

Turns out the otter, from about 6 million years ago, may have been part of an immigration event from Florida to California. Based on the discovery, Tseng and his colleagues have written a paper to be published June 13 in the journal Biology Letters. They propose a new east-west passage for the otter, and potentially other mammals, along the northern edge of the Trans-Mexican Volcanic Belt, which runs across the country at the latitude of Mexico City.

“This is an entirely new idea that no one else has proposed,” Tseng said. “We think it’s very likely other animals utilized this route.”

The right tooth

Like many breakthroughs, this one came from a fortunate tiny detail. The jawbone held several teeth.

“One tooth was a lower first molar, the most diagnostic tooth in a carnivore,” Tseng said. “If we are lucky enough to find a fossil molar tooth that is complete, there is a lot of useful information.”

The tooth was almost identical to a tooth from another Enhydritherium terraenovae (an ancient sea otter) fossil found in Florida. Similar finds had only been made along the coasts, in Florida and California, but paleontologists did not know how the animals got across the continent. One hypothesis was that they moved up and around through northern Canada, an 8,000 kilometer trip. Another was they made it down to Panama and crossed over to the west.

The possibility of an east-west migratory route in Mexico in the Miocene geologic epoch (roughly 23 million to 5.3 million years ago) has implications for a much larger biologic event — the Great American Biotic Interchange, when land bridges were formed and animals dispersed to and from North America and South America. It shows that the region’s fossil sites could have recorded details of this biological interchange of historic proportions.

But why don’t we know more about this already?

“Compared to the U.S., Mexico is a blank slate in terms of paleontology,” Tseng said. The region is difficult to work in because of the topography and flora, like cactus. So not many long-term field projects exist there.

“This is the beginning of the study,” Tseng said. “Now that we have this evidence of these animals moving through Mexico, we can now look for evidence of other animals doing the same.”

Expanding ranges

Adolfo Pacheco-Castro, a PhD student at the Universidad Nacional Autonoma de Mexico, Centro de Geociencias, and an author of the study, found the jawbone at the dig site in the Juchipila Basin, about 535 miles southeast of Laredo, Texas. The bone was taken to the university in Mexico, cleaned off and studied.

“We compared it to the original tooth from Florida, based on the cusps and the size, it couldn’t be anything else,” Tseng said. The fossils in Florida are older than those in California, so researchers speculate that immigrations went east to west.

But why did they travel at all?

“Animals tend to expand their range when and where there is opportunity,” Tseng said. “As in when there is a geographic connection to suitable habitats. So as populations expand their range, they can move across a continent, or even between continents.”

The Miocene-Pliocene transitional period was a time of disturbance, Tseng said. The plains of America would have been like Africa, with many large mammals. But the first ice age was approaching.

Many large mammals perished in the ice age from environmental and anthropogenic causes, but relatives of the smaller Enhydritherium — about the size of a small to medium dog — survived into modern times and still live around central Mexico today.

New area of study

Tseng said he expects some people will not agree with the new interpretation of an east-west corridor through Mexico for other mammals. But more research may confirm it.

“We are aware it is a single discovery,” he said. “It essentially opens up a can of worms. We are throwing a different factor in. We now have a connection between Florida and California, and it’s not in a straight line.”

Reference:
Z. Jack Tseng, Adolfo Pacheco-Castro, Oscar Carranza-Castañeda, José Jorge Aranda-Gómez, Xiaoming Wang, Hilda Troncoso. Discovery of the fossil otter Enhydritherium terraenovae (Carnivora, Mammalia) in Mexico reconciles a palaeozoogeographic mystery. Biology Letters, 2017; 13 (6): 20170259 DOI: 10.1098/rsbl.2017.0259

Note: The above post is reprinted from materials provided by University at Buffalo. Original written by Grove Potter.

Brazilian carnivorous mammal-like reptile fossil may be new Aleodon species

This is an artistic reconstruction and skeleton made by Voltaire Paes Neto. Credit: Voltaire Paes Neto; CC-BY

Some Late Triassic Brazilian fossils of mammal-like reptiles, previously identified as Chiniquodon, may in fact be the first Aleodon specimens found outside Africa, according to a study published June 14, 2017 in the open-access journal PLOS ONE by Agustín Martinelli from the Universidade Federal of Rio Grande do Sul, Brazil, and colleagues.

Aleodon is a genus of probainognathian cynodont, a taxon which evolved in the Triassic period, co-existed with dinosaur precursors and other archosaurs and eventually gave rise to mammals. The Aleodon genus was first described using fossils from Tanzania and Namibia, but it was not clear if it belonged within the family of carnivorous mammal-like reptiles known as Chiniquodontids, which includes the morphologically similar Chiniquodon.

The authors of the present study examined the skulls, jaws and teeth of Middle-Late Triassic fossil specimens from the Dinodontosaurus Assemblage Zone in Rio Grande do Sul, Brazil, most of which were previously thought to be Chiniquodontids, and compared them to a known African Aleodon species, A. brachyrhamphus.

The researchers used tooth morphology to identify one of the specimens as a new Aleodon species, which they named A. cromptoni after Dr Alfred “Fuzz” Crompton, who described the Aleodon genus. They also identified as Aleodon seven Brazilian specimens, previously thought to be chiniquodontids or traversodontids, and possibly one Namibian specimen, noting that this may call the reliability of Chiniquodon identification into question. Phylogenetic analysis indicated that Aleodon cromptoni may be, as suspected, a species in the Chiniquodonidae family.

Whilst the analysis was limited by the partial nature of some of the specimens, the authors note that the identification of these Late Triassic Aleodon specimens in Brazil strengthens the correlation between probainognathians from this epoch in South America and in Africa.

Reference:
Agustín G. Martinelli, Christian F. Kammerer, Tomaz P. Melo, Voltaire D. Paes Neto, Ana Maria Ribeiro, Átila A. S. Da-Rosa, Cesar L. Schultz, Marina Bento Soares. The African cynodont Aleodon (Cynodontia, Probainognathia) in the Triassic of southern Brazil and its biostratigraphic significance. PLOS ONE, 2017; 12 (6): e0177948 DOI: 10.1371/journal.pone.0177948

Note: The above post is reprinted from materials provided by PLOS.

Hot rocks, not warm atmosphere, led to relatively recent water-carved valleys on Mars

Lyot Crater, rendered here with elevations exaggerated, is home to relatively recent water-carved valleys (denoted in white). New research suggests that water came from melting snow and ice present at the time of the crater-forming impact. Credit: David Weiss/Brown/NASA

Present-day Mars is a frozen desert, colder and more arid than Antarctica, and scientists are fairly sure it’s been that way for at least the last 3 billion years. That makes a vast network of water-carved valleys on the flanks of an impact crater called Lyot — which formed somewhere between 1.5 billion and 3 billion years ago — something of a Martian mystery. It’s not clear where the water came from.

Now, a team of researchers from Brown University has offered what they see as the most plausible explanation for how the Lyot valley networks formed. They conclude that at the time of the Lyot impact, the region was likely covered by a thick layer of ice. The giant impact that formed the 225-kilometer crater blasted tons of blazing hot rock onto that ice layer, melting enough of it to carve the shallow valleys.

“Based on the likely location of ice deposits during this period of Mars’ history, and the amount of meltwater that could have been produced by Lyot ejecta landing on an ice sheet, we think this is the most plausible scenario for the formation of these valleys” said David Weiss, a recent Ph.D. graduate from Brown and the study’s lead author.

Weiss co-authored the study, which is published in Geophysical Research Letters, with advisor and Brown planetary science professor Jim Head, along with fellow graduate students Ashley Palumbo and James Cassanelli.

There’s plenty of evidence that water once flowed on the Martian surface. Water-carved valley networks similar to those at Lyot have been found in several locations. There’s also evidence for ancient lake systems, like those at Gale Crater where NASA’s Curiosity rover is currently exploring and at Jezero Crater where the next rover may land.

Most of these water-related surface features, however, date back to very early in Mars’ history — the epochs known as the Noachian and the Hesperian, which ended about 4 billion and 3 billion years ago respectively. From about 3 billion years ago to the present, Mars has been in a bone-dry period called the Amazonian.

The valley networks at Lyot therefore are a rare example of more recent surface water activity. Scientists have dated the crater itself to the Amazonian, and the valley networks appear to have been formed around the same time or shortly after the impact. So the question is: Where did all that water come from during the arid Amazonian?

Scientists have posited a number of potential explanations, and the Brown researchers set out to investigate several of the major ones.

One of those potential explanations, for example, is that there might have been a vast reservoir of groundwater when the Lyot impact occurred. That water, liberated by impact, could have flowed onto the surface along the periphery of the crater and carved the valleys. But based on geological evidence, the researchers say, that scenario is unlikely

“If these were formed by deep groundwater discharge, that water would have also flowed into the crater itself,” Weiss said. “We don’t see any evidence that there was water present inside the crater.”

The researchers also looked at the possibility of transient atmospheric effects following the Lyot impact. A collision of this size would have vaporized tons of rock, sending a plume of vapor into the air. As that hot plume interacted with the cold atmosphere, it could have produced rainfall that some scientists think might have carved the valleys.

But that, too, appears unlikely, the researchers concluded. Any rain related to the plume would have fallen after the rocky impact ejecta had been deposited outside the crater. So if rainwater carved the valleys, one would expect to see valleys cutting through the ejecta layer. But there are almost no valleys directly on the Lyot ejecta. Rather, Palumbo said, “The vast majority of the valleys seem to emerge from beneath the ejecta on its outer periphery, which casts serious doubt on the rainwater scenario.”

That left the researchers with the idea that meltwater, produced when hot ejecta interacted with an icy surface, carved the Lyot valleys.

According to models of Mars’ climate history, ice now trapped mainly at the planet’s poles often migrated into the mid-latitude regions where Lyot is located. And there’s evidence to suggest that an ice sheet was indeed present in the region at the time of the impact.

Some of that evidence comes from the scarcity of secondary craters at Lyot. Secondary craters form when big chunks of rock blasted into the air during a large impact fall back to the surface, leaving a smattering of small craters surrounding the main crater. At Lyot, there far fewer secondary craters than one would expect, the researchers say. The reason for that, they suggest, is that instead of landing directly on the surface, ejecta from Lyot landed on a thick layer of ice, which prevented it from gouging the surface beneath the ice. Based on the terrain on the northern side of Lyot, the team estimates that the ice layer could have been anywhere from 20 to 300 meters thick.

The Lyot impact would have spat tons of rock onto that ice layer, some of which would have been heated to 250 degrees Fahrenheit or more. Using a thermal model of that process, the researchers estimate that the interaction between those hot rocks and a surface ice sheet would have produced thousands of cubic kilometers of meltwater — easily enough to carve the valley seen at Lyot.

“What this shows is a way to get large amounts of liquid water on Mars without the need for a warming of the atmosphere and any liquid groundwater,” Cassanelli said. “So we think this is a good explanation for how you get these channels forming in the Amazonian.”

And it’s possible, Head says, that this same mechanism could have been important before the Amazonian. Some scientists think that even in the early Noachian and Hesperian epochs, Mars was still quite cold and icy. If that was the case, then this meltwater mechanism might have also been responsible for at least some of the more ancient valley networks on Mars.

“It’s certainly a possibility worth investigating,” Head said.

Reference:
David K. Weiss, James W. Head, Ashley M. Palumbo, James P. Cassanelli. Extensive Amazonian-aged fluvial channels on Mars: Evaluating the role of Lyot crater in their formation. Geophysical Research Letters, 2017; DOI: 10.1002/2017GL073821

Note: The above post is reprinted from materials provided by Brown University.
Giant flying turkey once roamed Australia

The fossilised bone of a giant flying turkey (top) as compared with that of a regular turkey (bottom). The megapode birds lived during the Pleistocene era, between 1.6 million and 10,000 years ago.

A giant, flying turkey as tall as a kangaroo once roamed Australia, palaeontologists said Wednesday, after an analysis of fossils and bones from around the country revealed five extinct bird species.

A team from Flinders University in South Australia said they were all chunky relatives of today’s malleefowl and brush-turkeys.

The megapode birds lived during the Pleistocene era, between 1.6 million and 10,000 years ago, alongside other giant Australian animals like diprotodons, marsupial lions and short-faced kangaroos.

Scientists had initially thought the fossils, first found in the 1880s, represented a single ancient bird, but fresh examination has led them to conclude they belong to five different species.

Among them was a turkey weighing up to eight kilograms (17 pounds) and standing taller than a grey kangaroo, which can reach 1.3 metres (4ft 3ins)—four times the size of modern fowl.

“These discoveries are quite remarkable because they tell us that more than half of Australia’s megapodes went extinct during the Pleistocene, and we didn’t even realise it until now,” said researcher Elen Shute.

“We compared the fossils described in the 1880s and the 1970s with specimens discovered more recently, and with the benefit of new fossils, differences between species became really clear.”

The newly found birds fall into two categories—”tall turkeys” that had long, slender legs, and “nuggetty chickens” that had short legs and broad bodies.

Unlike many large extinct birds, such as dodos, these megapodes were not flightless.

While big and bulky, their long, strong wing bones showed they could all fly, and probably roosted in trees, unlike their modern ground-dwelling cousins which build mounds to incubate their eggs.

Two of the new species come from the Thylacoleo Caves beneath Australia’s vast Nullarbor Plain, which have proved a treasure trove since they were discovered 15 years ago.

“So far the Thylacoleo Caves have yielded seven new species of kangaroo, a frog, two giant ground-cuckoos, and now two new megapodes,” said Flinders professor Gavin Prideaux.

“The closer we look, the more we keep finding.”

Reference:
“Taxonomic review of the late Cenozoic megapodes (Galliformes: Megapodiidae) of Australia,” Royal society open science Published 14 June 2017.DOI: 10.1098/rsos.170233

Note: The above post is reprinted from materials provided by AFP.

Lake Superior Agate : What is Lake Superior agate? How it formed?

What is Lake Superior agate?

The Lake Superior agate is a type of agate stained by iron and found on the shores of Lake Superior. Its wide distribution and iron-rich bands of color reflect the gemstone’s geologic history in Minnesota, Wisconsin, and Michigan. In 1969 the Lake Superior agate was designated by the Minnesota Legislature as the official state gemstone.

The Lake Superior agate was selected because the agate reflects many aspects of Minnesota. It was formed during lava eruptions that occurred in Minnesota about a billion years ago. The stone’s predominant red color comes from iron, a major Minnesota industrial mineral found extensively throughout the Iron Range region. Finally, the Lake Superior agate can be found in many regions of Minnesota as it was distributed by glacial movement across Minnesota 10,000 to 15,000 years ago.

The Lake Superior agate is noted for its rich red, orange, and yellow coloring. This color scheme is caused by the oxidation of iron. Iron leached from rocks provided the pigment that gives the gemstone its beautiful array of color. The concentration of iron and the amount of oxidation determine the color within or between an agate’s bands. There can also be white, grey, black and tan strips of color as well.

The gemstone comes in various sizes. The gas pockets in which the agates formed were primarily small, about 1 cm in diameter. A few Lake Superior agates have been found that are 22 cm in diameter with a mass exceeding 10 kilograms. Very large agates are extremely rare.

The most common type of Lake Superior agate is the fortification agate with its eye-catching banding patterns. Each band, when traced around an exposed pattern or “face,” connects with itself like the walls of a fort, hence the name fortification agate.

A common subtype of the fortification agate is the parallel-banded, onyx-fortification or water-level agate. Perfectly straight, parallel bands occur over all or part of these stones. The straight bands were produced by puddles of quartz-rich solutions that crystallized inside the gas pocket under very low fluid pressure. The parallel nature of the bands also indicates the agate’s position inside the lava flow.

Probably the most popular Lake Superior agate is also one of the rarest. The highly treasured eye agate has perfectly round bands or “eyes” dotting the surface of the stone.

How Lake Superior agate formed?

More than a billion years ago, the North American continent began to split apart along plate boundaries. Magma upwelled into iron-rich lava flows throughout the Midcontinent Rift System, including what is now the Minnesota Iron Range region. These flows are now exposed along the north and south shores of Lake Superior. The tectonic forces that attempted to pull the continent apart, and which left behind the lava flows, also created the Superior trough, a depressed region that became the basin of Lake Superior.

The lava flows formed the conditions for creation of Lake Superior agates. As the lava solidified, water vapor and carbon dioxide trapped within the solidified flows formed a vesicular texture (literally millions of small bubbles). Later, groundwater transported ferric iron, silica, and other dissolved minerals passed through the trapped gas vesicles. These quartz-rich groundwater solutions deposited concentric bands of fine-grained quartz called chalcedony, or embedded agates.

Over the next billion years, erosion exposed a number of the quartz-filled, banded vesicles—agates—were freed by running water and chemical disintegration of the lavas, since these vesicles were now harder than the lava rocks that contained them. The vast majority, however, remained lodged in the lava flows until the next major geologic event that changed them and Minnesota.

During the ensuing ice ages a lobe of glacial ice, the Superior lobe, moved into Minnesota through the agate-filled Superior trough. The glacier picked up surface agates and transported them south. Its crushing action and cycle of freezing and thawing at its base also freed many agates from within the lava flows and transported them, too. The advancing glacier acted like an enormous rock tumbler, abrading, fracturing, and rough-polishing the agates.

Where to find Lake Superior agates?

The Superior lobe spread agates and other debris throughout northeastern and central Minnesota and extreme northwestern Wisconsin.

Glaciers dispersed Minnesota’s official rock around the state into various settings where hikers, campers, hunters, and outdoor enthusiasts can readily collect them. Many beautiful specimens have been found in gravel banks along rivers and streams.

Popular hunting grounds include the Mississippi River and waters that empty into Lake Superior along the North Shore. The beaches along Lake Superior and hundreds of other lakes have produced many gems. Virtually any place with exposed gravel and rocks offers the chance of finding Lake Superior agates.

How to identify Lake Superior agate?

The following characteristics will help you identify agates in the field.

  • Band planes along which the agate has broken are sometimes visible, giving the rock a peeled texture. It appears as though the bands were partially peeled off like a banana skin.
  • Iron-oxide staining is found on nearly all agates to some degree, and generally covers much of the rock. Such staining can be many different colors, but the most common are shades of rust-red and yellow.
  • Translucence is an optical feature produced by chalcedony quartz, the principal constituent of agates. The quartz allows light to penetrate, producing a glow. Sunny days are best for observing translucence.
  • A glossy, waxy appearance, especially on a chipped or broken surface, is another clue.
  • A pitted texture often covers the rock surface. The pits are the result of knobs or projections from an initial layer of softer mineral matter deposited on the wall of the cavity in which the agate formed. Later, when the quartz that formed the agate was deposited in the cavity, these projections left impressions on the exterior.

Photos

Volcanic ‘plumerang’ could impact human health

Holuhraun eruption. Credit: Evgenia Ilyinskaya, University of Leeds

A new study has found a previously undetected potential health risk from the high concentration of small particles found in a boomerang-like return of a volcanic plume.

A team of scientists, led by Dr Evgenia Ilyinskaya at the University of Leeds, traced the evolution of the plume chemistry from the 2014-2015 Icelandic Holuhraun lava field eruption and found a second type of plume that impacts air quality.

This second plume had circled back to Icelandic cities and towns long after the health warning about the initial plume had been lifted.

Lead author, Dr Ilyinskaya from the Institute of Geophysics and Tectonics at Leeds, said: “The return of this second, mature, plume, which we referred to as a ‘plumerang’, showed that the volcanic sulphur had undergone a gas-to-particle conversion by spending time in the atmosphere. This conversion meant that the sulphur dioxide (SO2) levels of the plumerang were reduced and within the European Commission air quality standards and therefore there were no health advisory messages in place.

“However, our samples showed that the mature plume was instead very rich in fine particles which contained high concentrations of sulphuric acid and trace metals. The concentrations of these trace metals did not reduce as the plume matured and included heavy metals found in human-made air pollution that are linked to negative health effects.

“On at least 18 days during the 6-month long eruption the plumerang was in the capital city of Reykjavík, while the official forecast showed ‘no plume’.”

The fine particles found in the plumerang are so small they can penetrate deep into the lungs, potentially causing serious health problems such as exacerbating asthma attacks.

It is estimated that short and long-term exposure to this type of fine particles, from both human-made and natural sources, cause over three million premature deaths globally per year and remains the single largest environmental health risk in Europe.

Dr Ilyinskaya is currently researching the possible health impacts of the plumerang in collaboration with the University of Iceland. However there is already anecdotal evidence suggesting adverse effects.

Dr Ilyinskaya said: “We spoke to people living in Reykjavik who described a burning sensation in the throat and eyes when the SO2 levels would have been well within air quality standards but the particle-rich plumerang would have been over the city.”

During the six-month-long eruption, the Icelandic Meteorological Office’s daily forecasts of the plume dispersion accounted only for SO2 concentrations in the young plume. The mature plume was not forecast as part of volcanic air pollution monitoring.

The study, published in Earth and Planetary Science Letters, recommends that in future gas-rich eruptions both the young and mature plumes should be considered when forecasting air pollution and the dispersion and transport pattern of the plume.

Co-author Dr Anja Schmidt, from the Institute of Climate and Atmospheric Science as Leeds, said: “The Holuhraun eruption caused one of the most intense and widespread volcanogenic air pollution events in centuries. It’s estimated that the amount of sulphur dioxide released into the atmosphere was roughly two times that of a yearly total of SO2 emissions generated by the European Economic area.

“It gave us a rare opportunity to study volcanism of this style and scale using modern scientific techniques. The data we have gathered will be invaluable to preparing for a potential future event and its impacts on air quality and human health.”

Reference:
Evgenia Ilyinskaya, Anja Schmidt, Tamsin A. Mather, Francis D. Pope, Claire Witham, Peter Baxter, Thorsteinn Jóhannsson, Melissa Pfeffer, Sara Barsotti, Ajit Singh, Paul Sanderson, Baldur Bergsson, Brendan McCormick Kilbride, Amy Donovan, Nial Peters, Clive Oppenheimer, Marie Edmonds. Understanding the environmental impacts of large fissure eruptions: Aerosol and gas emissions from the 2014–2015 Holuhraun eruption (Iceland). Earth and Planetary Science Letters, 2017; DOI: 10.1016/j.epsl.2017.05.025

Note: The above post is reprinted from materials provided by University of Leeds.

World’s ‘first named dinosaur’ reveals new teeth with scanning tech

Artist’s impression of how Victorian palaeontologists thought the Megalosaurus looked (R) is compared with how we now understand it to have looked (L). Credit: University of Warwick/Mark Garlick

Pioneering technology has shed fresh light on the world’s first scientifically-described dinosaur fossil – over 200 years after it was first discovered – thanks to research by WMG at the University of Warwick and the University of Oxford’s Museum of Natural History.

Professor Mark Williams at WMG has revealed five previously unseen teeth in the jawbone of the Megalosaurus – and that historical repairs on the fossil may have been less extensive than previously thought.

Using state of the art CT scanning technology and specialist 3D analysis software, Professor Williams took more than 3000 X-ray images of the world-famous Megalosaurus jawbone, creating a digital three-dimensional image of the fossil.

In an unprecedented level of analysis, Professor Williams at WMG was able to see inside the jawbone for the first time, tracing the roots of teeth and the extent of different repairs.

Some damage occurred to the specimen when it was removed from the rock, possibly shortly after it was discovered.

Records at the Oxford University Museum of Natural History suggest that some restoration work may have been undertaken by a museum assistant between 1927 and 1931, while repairing the specimen for display – but there are no details about the extent of the repairs or the materials used.

The scans have revealed previously unseen teeth that were growing deep within the jaw before the animal died – including the remains of old, worn teeth and also tiny newly growing teeth.

The scans also show the true extent of repairs on the fossil for the first time, revealing that there may have been at least two phases of repair, using different types of plaster. This new information will help the museum make important decisions about any future restoration work on the specimen.

This research was made possible through a collaboration between Professor Williams’ research group at WMG, University of Warwick – including PhD researcher Paul Wilson – and Professor Paul Smith, director of the Oxford University Museum of Natural History.

Professor Williams commented:”Being able to use state-of-the-art technology normally reserved for aerospace and automotive engineering to scan such a rare and iconic natural history specimen was a fantastic opportunity.

“When I was growing up I was fascinated with dinosaurs and clearly remember seeing pictures of the Megalosaurus jaw in books that I read. Having access to and scanning the real thing was an incredible experience.”

The Megalosaurus jawbone is on display at the Oxford University Museum of Natural History alongside other bones from the skeleton.

Megalosaurus – which means ‘Great Lizard’ – was a meat-eating dinosaur which lived in the Middle Jurassic, around 167 million years ago. It would have been about 9 metres long and weighed about 1.4 tonnes (1400 kg).

The research was recently presented at the Institute of Electrical and Electronics Engineers (IEEE)’s International Instrumentation and Measurement Technology Conference in Torino, Italy.

Note: The above post is reprinted from materials provided by University of Warwick.

The mysterious bend in the Hawaiian-Emperor chain

The Hawaiian-Emperor Chain is an example of a hotspot track – a trail of volcanic islands and seamounts created on a lithospheric plate as the plate slowly shifts over a spot of localized melting sourced by a jet of hot material rising from the deep mantle (mantle plume). For more details see the release. Credit: T. Torsvik et al. (GFZ)

The volcanic islands of Hawaii represent the youngest end of a 80 million years old and roughly 6,000 kilometres long mountain chain on the ground of the Pacific Ocean. The so-called Hawaiian-Emperor chain consisting of dozens of volcanoes is well known for its peculiar 60 degrees bend. The cause for this bend has been heavily debated for decades. One explanation is an abrupt change in the motion of the Pacific tectonic plate, the opposite model states southward drift of the mantle plume that has sourced the chain since its beginning 80 million years ago. Apparently both processes play an important role, shows a new study in Nature Communications, published by a group of scientists from the University of Oslo, German Research Centre for Geosciences GFZ Potsdam, and Utrecht University.
Many volcanic ocean islands are created by columnar shaped hot upwellings called mantle plumes that originate near the ~3000 km deep base of Earth’s mantle. Mantle plumes are not much influenced by surface motions of the tectonic plates that slowly move over them. Hence, long linear chains of plume-sourced volcanoes that get older and older with increasing distance from active hotspots can be tracked for hundreds to thousands of kilometres. In the Hawaiian hotspot trail, the Hawaii islands are the youngest in the chain that stretches nearly 6,000 km to Detroit seamount in the northwest Pacific, where volcanism occurred about 80 million years ago. An unprecedented 60 degrees bend characterizes the Hawaiian-Emperor Chain, dividing it into the older Emperor Chain and the younger Hawaiian Chain. The bend has been dated to 47 Ma (Fig. 1).

“The ultimate cause for the formation of the Hawaiian-Emperor Bend (HEB) was a prominent change in the Pacific plate motion at 47 Ma”, says the lead author of the new study, Trond Torsvik from the University of Oslo and visiting researcher at GFZ at the moment. The team affirms a hypothesis by the US-geophysicist Jason Morgan who proposed that already in the early 1970s. “But it is not that simple as it was suggested forty years ago”, says Torsvik.

Jason Morgan was the first to use hotspots as a reference frame for global plate motions. In his model mantle plumes—which are manifested by hotspots at the surface—were considered fixed in the mantle, and the Hawaiian-Emperor Bend was attributed to a simple directional change of the Pacific plate motion. But his plate model with fixed hotspots became challenged from the 1980s.

“Since the late 1990s it has become clear that hotspots are not totally fixed”, says GFZ´s Bernhard Steinberger, one of the co-authors of the paper. That is now generally accepted, he adds, and mantle flow models predict that the Hawaiian hotspot has drifted slowly to the south. “But some recent studies have argued that rapid southward motion of the hotspot before 47 Ma can explain the formation of the bend without requiring Pacific plate motion change”, he says. “Such a scenario has become attractive because the geology of the plates surrounding the Pacific shows no clear evidence for a Pacific plate motion change.”

The new study shows clearly why this simply does not work. It would require an unrealistically high rate of hotspot motion of about 42 cm/year which would be much faster than the average speed of tectonic plates. Moreover, this would imply that the Emperor Chain was created in just five million years and Detroit Seamount should only be 52 million years old (Fig. 2a). This prediction is obviously falsified by the recorded Detroit Seamount island ages of about 80 Ma (Fig. 1).

“Alternatively, a slower hotspot motion towards the WSW could explain both geometry and ages of the Emperor chain”, says Steinberger. However, such a direction of motion is inconsistent with mantle convection models.

“Our paper is a good example of how very simple simulations of plate and hotspot kinematics can be used to explore which geodynamic scenarios for the formation of the Hawaiian-Emperor Bend are possible, and which ones are not”, says Pavel Doubrovine from the University of Oslo, another co-author on the paper. “We cannot avoid the conclusion that the 60 degrees bend is predominantly caused by a directional change in the Pacific plate motion.” Yet, some southward plume motion is required (blue line in Fig. 2b), otherwise the Hawaiian-Emperor Chain would be around 800 kilometres shorter.

“Explaining the geometry, length and age progression of the Hawaiian-Emperor Chain, requires both: the change in the direction of plate motion and the movement of the hotspot”, states Torsvik. “If, after more than two decades of debating the end-member scenarios of plate motion change versus hotspot drift, geophysicists will be able to agree that neither of the two is satisfactory – then we can move forward and address a more interesting question: what actually drove the Pacific plate motion to change at about 47 million years ago?” Hopefully, it will not take further 40 years to get an answer to this, he adds.

Reference:
Trond H. Torsvik et al, Pacific plate motion change caused the Hawaiian-Emperor Bend, Nature Communications (2017). DOI: 10.1038/ncomms15660

Note: The above post is reprinted from materials provided by Helmholtz Association of German Research Centres.

High-pressure experiments solve meteorite mystery

Cristobalite crystals from Harvard Mineralogical Museum, found at Ellora caves in India. Credit: RRUFF Project / University of Arizona

With high-pressure experiments at DESY’s X-ray light source PETRA III and other facilities, a research team around Leonid Dubrovinsky from the University of Bayreuth has solved a long standing riddle in the analysis of meteorites from Moon and Mars. The study, published in the journal Nature Communications, can explain why different versions of silica can coexist in meteorites, although they normally require vastly different conditions to form. The results also mean that previous assessments of conditions at which meteorites have been formed have to be carefully re-considered.

The scientists investigated a silicon dioxide (SiO2) mineral that is called cristobalite. “This mineral is of particular interest when studying planetary samples, such as meteorites, because this is the predominant silica mineral in extra-terrestrial materials,” explains first author Ana Černok from Bayerisches Geoinstitut (BGI) at University Bayreuth, who is now based at the Open University in the UK. “Cristobalite has the same chemical composition as quartz, but the structure is significantly different,” adds co-author Razvan Caracas from CNRS, ENS de Lyon.

Different from ubiquitous quartz, cristobalite is relatively rare on Earth’s surface, as it only forms at very high temperatures under special conditions. But it is quite common in meteorites from Moon and Mars. Ejected by asteroid impacts from the surface of Moon or Mars, these rocks finally fell to Earth.

Surprisingly, researchers have also found the silica mineral seifertite together with cristobalite in Martian and lunar meteorites. Seifertite was first synthesised by Dubrovinsky and colleagues 20 years ago and needs extremely high pressures to form. “Finding cristobalite and seifertite in the same grain of meteorite material is enigmatic, as they form under vastly different pressures and temperatures,” underlines Dubrovinsky. “Triggered by this curious observation, the behaviour of cristobalite at high-pressures has been examined by numerous experimental and theoretical studies for more than two decades, but the puzzle could not be solved.”
Using the intense X-rays from PETRA III at DESY and the European Synchrotron Radiation Facility ESRF in Grenoble (France), the scientists could now get unprecedented views at the structure of cristobalite under high pressures of up to 83 giga-pascals (GPa), which corresponds to roughly 820,000 times the atmospheric pressure. “The experiments showed that when cristobalite is compressed uniformly or almost uniformly — or as we say, under hydrostatic or quasi-hydrostatic conditions — it assumes a high-pressure phase labelled cristobalite X-I,” explains DESY co-author Elena Bykova who works at the Extreme Conditions Beamline P02.2 at PETRA III, where the experiments took place. “This high-pressure phase reverts back to normal cristobalite when the pressure is released.”

But if cristobalite is compressed unevenly under what scientists call non-hydrostatic conditions, it unexpectedly converts into a seifertite-like structure, as the experiments have now shown. This structure forms under significantly less pressure than necessary to form seifertite from ordinary silica. “The ab initio calculations confirm the dynamical stability of the new phase up to high pressures,” says Caracas. Moreover it also remains stable when the pressure is released.

“This came as a surprise,” says Černok. “Our study clarifies how squeezed cristobalite can transform into seifertite at much lower pressure than expected. Therefore, meteorites that contain seifertite associated with cristobalite have not necessarily experienced massive impacts.” During an impact, the propagation of the shock wave through the rock can create very complex stress patterns even with intersecting areas of hydrostatically and non-hydrostatically compressed materials, so that different versions of silica can form in the same meteorite.

“These results have immediate implications for studying impact processes in the solar system,” underlines Dubrovinsky. “They provide clear evidence that neither cristobalite nor seifertite should be considered as reliable tracers of the peak shock conditions experienced by meteorites.” But the observations also show more generally that the same material can react very differently to hydrostatic and non-hydrostatic compression, as Dubrovinsky explains. “For materials sciences our results suggest an additional mechanism for the manipulation of the properties of materials: Apart from pressure and temperature, different forms of stress may lead to completely different behaviour of solid matter.”

Reference:
Ana Černok, Katharina Marquardt, Razvan Caracas, Elena Bykova, Gerlinde Habler, Hanns-Peter Liermann, Michael Hanfland, Mohamed Mezouar, Ema Bobocioiu, Leonid Dubrovinsky. Compressional pathways of α-cristobalite, structure of cristobalite X-I, and towards the understanding of seifertite formation. Nature Communications, 2017; 8: 15647 DOI: 10.1038/ncomms15647

Note: The above post is reprinted from materials provided by Deutsches Elektronen-Synchrotron DESY.

Related Articles