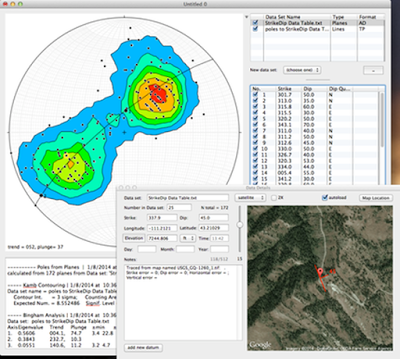
Stereonet 9 brings location and date tagging of individual measurements as well as a free form notes field. Points with location data can be plotted on a Google satellite (or terrain or roadmap) image right in the program. This version of Stereonet is compatible with all modern operating systems and has a modern user interface which has been modeled after OSXStereonet for Mac by Nestor Cardozo and me. It can read and write older Stereonet text files but has a new binary format for its native file.
Stereonet 9 for Macintosh uses the modern Mac OS X “Cocoa” architecture. The Macintosh version is being made available here for those users who need binary file compatibility with the Windows version. Stereonet 9 for Macintosh does not have the nifty 3D viewing of OSXStereonet, but does have Google satellite visualization. Stereonet 9 requires Mac OS X 10.7 (Lion) or higher.
For those hardy souls using Linux, you too can download a copy of Stereonet 9, though I have never seen it run on a Linux box and don’t know if there are any compatibility issues!
For long term viability of your data, however, you should still export any work as text files which will always be readable by a large number of programs.
A comprehensive manual is included with the zip archive. For Mac Users still on Mac OS X 10.5 and lower (Leopard, Tiger, etc.), you can download a Carbon version of Stereonet. Note that this version will not be kept up to date with the above Cocoa version.
Version History
Version 9.3.0 — 2015.05.13
- Major improvements to the Rose diagram functionality, including:
- Scale the petals by either length or area (new). Only length was possible before
- Calculation of the mean direction for axial data (i.e., data with no directional significance). this is sometimes referred to as Krumbein’s (1939) mean
- Half circle rose diagrams always show Krumbein’s mean; full circle diagrams can either depict vector azimuths or, if “treat data as axes” is checked in the Inspector, the full circle diagrams will be symmetric (this has been a highly requested feature that I’ve resisted until now!)
- Addition of a Von Mises Distribution option to the Calculations menu which displays the same 2D azimuthal statistics as the Rose diagram displays. The program now calculates the circular variance, kappa, and 1 sigma standard error for azimuthal data.
- Plots wil polar grids can now be saved as .pdf and .svg files
- Fixed a bug that occurred when planes were being entered in “DD” format and the data details window was opened.
Download Stereonet 9
Copyright © R. W. Allmendinger. Cornell University


