ParaViewGeo is a free, BSD-licensed, open source visualization package for the exploration and mining industry.
ParaView is an open-source, multi-platform data analysis and visualization application. ParaView users can quickly build visualizations to analyze their data using qualitative and quantitative techniques. The data exploration can be done interactively in 3D or programmatically using ParaView’s batch processing capabilities.
ParaView was developed to analyze extremely large datasets using distributed memory computing resources. It can be run on supercomputers to analyze datasets of petascale size as well as on laptops for smaller data, has become an integral tool in many national laboratories, universities and industry, and has won several awards related to high performance computation.
Large Data Visualization Made Easier
ParaView is an open-source, multi-platform data analysis and visualization application. ParaView users can quickly build visualizations to analyze their data using qualitative and quantitative techniques. The data exploration can be done interactively in 3D or programmatically using ParaView’s batch processing capabilities. ParaView was developed to analyze extremely large datasets using distributed memory computing resources. It can be run on supercomputers to analyze datasets of petascale as well as on laptops for smaller data. ParaView is an application framework as well as a turn-key application.
The ParaView code base is designed in such a way that all of its components can be reused to quickly develop vertical applications. This flexibility allows ParaView developers to quickly develop applications that have specific functionality for a specific problem domain. ParaView runs on distributed and shared memory parallel and single processor systems. It has been successfully deployed on Windows, Mac OS X, Linux, SGI, IBM Blue Gene, Cray and various Unix workstations, clusters and supercomputers. Under the hood, ParaView uses the Visualization Toolkit (VTK) as the data processing and rendering engine and has a user interface written using Qt® The goals of the ParaView team include the following:
Develop an open-source, multi-platform visualization application.
Support distributed computation models to process large data sets.
Create an open, flexible, and intuitive user interface.
Develop an extensible architecture based on open standards.
The History of ParaView
The ParaView project started in 2000 as a collaborative effort between Kitware Inc. and Los Alamos National Laboratory. The initial funding was provided by a three-year contract with the US Department of Energy ASCI Views program. The first public release, ParaView 0.6, was announced in October 2002.
Independent of ParaView, Kitware started developing a web-based visualization system in December 2001. This project was funded by Phase I and II SBIRs from the US Army Research Laboratory and eventually became the ParaView Enterprise Edition. PVEE significantly contributed to the development of ParaView’s client/server architecture.
Since the beginning of the project, Kitware has successfully collaborated with Sandia, Los Alamos National Laboratories, the Army Research Laboratory and various other academic and government institutions to continue development. The project is still going strong!
In September 2005, Kitware, Sandia National Labs and CSimSoft started the development of ParaView 3.0. This was a major effort focused on rewriting the user interface to be more user-friendly and on developing a quantitative analysis framework. ParaView 3.0 was released in May 2007.
Use ParaViewGeo For
Research
We encourage the use of ParaViewGeo by students, professors and researchers alike. Being an open source program, it is free of charge and licensing fees. The program can also be customized and modified by users with programming experience—the source code is readily available. As more and more people use ParaViewGeo, we hope to have a community to offer feedback and support in the ongoing development of the software. For examples of how Kitware’s ParaView is used for scientific and academic purposes, visit ParaView’s Applications page.
Mining
The benefits of visualization extend beyond the exploration process. Mine design, planning and scheduling are all tasks that can be undertaken with ParaViewGeo. The process is made easier thanks to the wide range of different files (over 50 formats) that can be imported as source data for your model.
Over the past 10 years, MIRARCO has proven the value of visualization in mining. A number of large mining companies have undertaken strategic technical property reviews and effective investor relations presentations in a Virtual Reality Laboratory.ParaViewGeo is making this tool accessible to mining companies of all sizes for a number of different purposes throughout the mining process.
Geoscience
Geoscience is a broad and diverse field but the use of visualization is a commonality you’ll find in many of the sub-disciplines.ParaViewGeo has been used for geological, seismic and geomagnetic applications but the possibilities go far beyond these areas.ParaViewGeo can read a large number of file formats so that geological databases can be read and integrated into detailed spatial visualizations. This can be done with datasets big and small; ParaViewGeo can handle terabyte-size datasets.
MIRARCO’s Seismic Excavation Hazard Mapping System is a prime example of ParaViewGeo’s value to professional geoscientists. The system relies on ParaViewGeo to create detailed hazard maps for ground control personnel.
Exploration
Visualization has become a standard tool in the mining exploration trade and ParaViewGeo was developed specifically to meet the needs of exploration professionals.
ParaViewGeo reads over 50 different file formats and allows for the creation of integrated 3D models that can be manipulated and customized as the user sees fit. The software’s ability to handle terabyte-size datasets allows users to integrate all pertinent data for the most comprehensive property analysis and profitable decision making.
A sample dataset of the Brunswick Mine is included with every ParaViewGeo download.
Screenshot
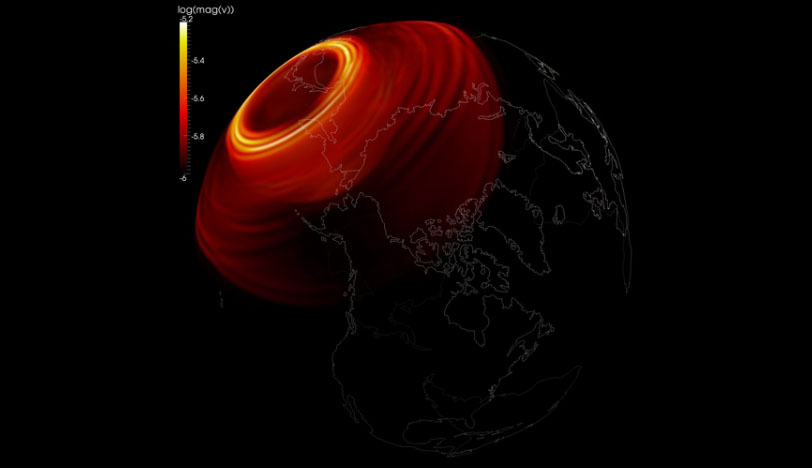
Global Seismic Wave Propagation Simulation Contributors from ICES, The University of Texas at Austin: Carsten Burstedde, Omar Ghattas, James R. Martin, Georg Stadler, Lucas C. Wilcox Visualization at the Texas Advanced Computing Center, the University of Texas at Austin by Greg Abram
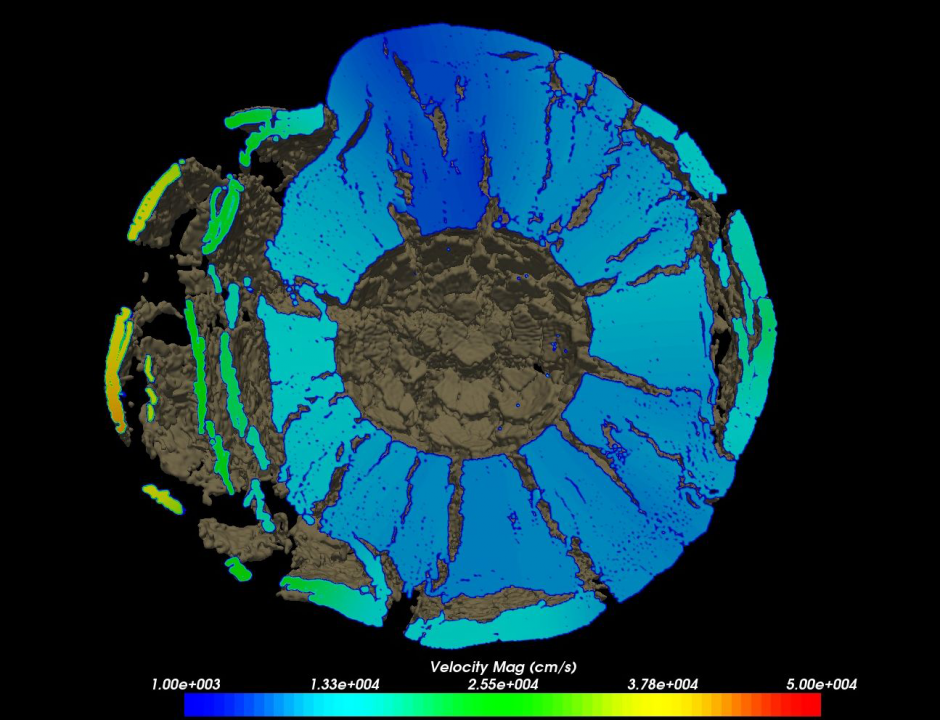
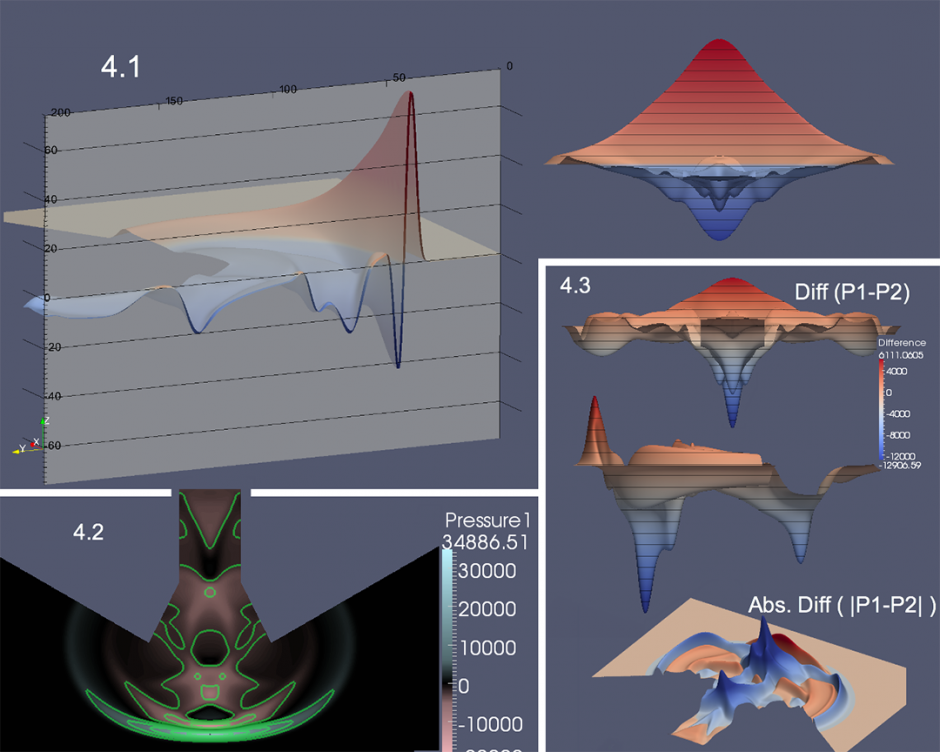
Golevka Asteroid Explosion Simulation. Image courtesy of Sandia Labs.Volcano-cone Acoustic-pressure Simulations ParaView was recently used in Russell Taylor’s Comp 715: Visualization in the Sciences class at the University of North Carolina at Chapel Hill. Author: Michael Garrett Larson and Alexander D. Hill Copyright: Data courtesy of Jonathan Lees and Keehoon Kim, UNC Geological Sciences


