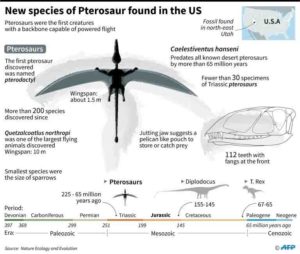
Factfile on Caelestiventus hanseni a new species of flying reptiles, known as Pterosaurs, discovered in US state of Utah.
Scientists on Monday unveiled a previously unknown species of giant pterosaur, the first creatures with a backbone to fly under their own power.
Neither dino nor bird, pterosaurs—more commonly known as pterodactyls—emerged during the late Triassic period more than 200 million years ago and lorded over primeval skies until a massive space rock slammed into Earth, wiping out the dinosaurs and most other forms of life some 65 million years ago.
The newly discovered member of the family, identified through remains found in northeastern Utah, had a wing-span of 1.5 metres (five feet) and 112 teeth, including fang-like spikes sticking out near the snout.
A jutting lower jaw suggests a pelican-like pouch, perhaps to scoop up fish and unsuspecting small reptiles.
“They are delicately framed animals that are built for flying,” said Brooks Britt, a paleontologist at Brigham Young University in Utah and lead author of a study in Nature Ecology & Evolution.
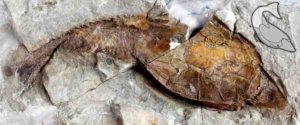
Caelestiventus hanseni—roughly, “heavenly wind”—is probably the most complete skeletal remains of a pterosaur ever found.
“Most pterosaurs bones look like road-kill,” Britt told AFP, noting that there are only 30-odd specimens worldwide from the Triassic period which lasted some 51 million years.
By contrast, the new specimen comprises dozens of intact bones and teeth, along with an entire brain casing.
The wings are in fact skin membranes largely held up by the fourth “finger”, or digit, of their forelimbs. Huge sockets suggest C. hanseni had “fantastic eyesight”, said Britt.
Saints & Sinners
When not soaring in search of a meal, it walked on all fours with its wings folded vertically.
The fossil remains are still encased in sandstone, but scientists generated accurate 3-D images and models of each bone using CAT-scan technology.
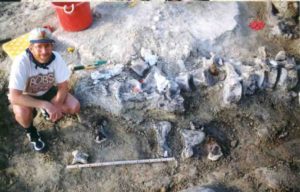
The site where C. hanseni was unearthed, known to fossil hunters as Saints & Sinners, reveals a dramatic story of survival and local extinction in the face of climate change, the researchers said.
The rocks it was found in were part of an oasis in a two-million square kilometre (775,000 square mile) desert covered with giant sand dunes.
“During droughts, large numbers of animals—including pterosaurs, predatory dinosaurs and crocodylomorphs—were drawn to the pond in the middle of the oasis, where they died as water dried up,” said Britt.
The result was a treasure trove of more than 18,000 bones and fragments from dozens of water-starved animals.
C. hanseni is not the biggest pterosaur ever found, but was likely the largest of its era, especially for a desert environment.
It also predates other desert-dwelling specimens by about 65 million years. Pterosaurs from the same period found so far came from ancient coastal areas in what is now Europe and Greenland.
That the high-flying creatures were spread across much of the globe may have helped them survive the end-of-Triassic mass extinction, which wiped out half of the species on land and in the sea.
Reference:
Brooks B. Britt et al. Caelestiventus hanseni gen. et sp. nov. extends the desert-dwelling pterosaur record back 65 million years, Nature Ecology & Evolution (2018). DOI: 10.1038/s41559-018-0627-y
Note: The above post is reprinted from materials provided by AFP.
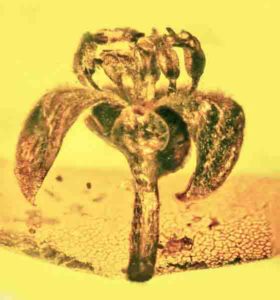
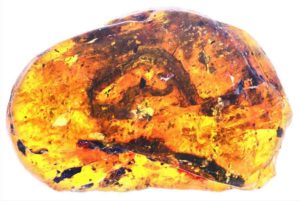
Glandular laurel in amber. Credit: Image courtesy of Oregon State University
The compounds behind the perfumes and colognes you enjoy have been eliciting olfactory excitement since dinosaurs walked the Earth amid the first appearance of flowering plants, new research reveals.
Oregon State University entomologist George Poinar Jr. and his son Greg, a fragrance collector, found evidence that floral scents originated in primitive flowers as far back as 100 million years ago as pollinator attractants — a role they still play even though today’s flowers also have colorful petals for luring pollinators.
“I bet some of the dinosaurs could have detected the scents of these early flowers,” George Poinar said. “In fact, floral essences from these early flowers could even have attracted these giant reptiles.”
The Poinars examined amber flowers from Burma, including the now extinct glandular laurel flower (Cascolaurus burmensis) and veined star flower (Tropidogyne pentaptera).
The research revealed that the flower-based chemical compounds that are the basis for the perfumes and colognes we use today have been providing olfactory excitement to pollinating insects and other animals since the mid-Cretaceous Period.
Without colorful petals, flowers from that period had to rely solely on scents to attract pollinators.
“You can’t detect scents or analyze the chemical components of fossil flowers, but you can find the tissues responsible for the scents,” said George Poinar, professor emeritus in the OSU College of Science.
The floral secretory tissues producing these scents include nectaries, glandular trichomes, eliaphores and osmophores.
Nectaries are glands that produce fragrances and sweet deposits that insects love. Glandular trichomes are hairs with cells that make and send out scented secretory products. Eliaphores are stalked aromatic oil glands. oOsmophores, also known as floral fragrance glands, are cell clusters specializing in scent emission.
The study also found that secretory tissues of these Cretaceous flowers are similar in structure to those of their modern descendants. That suggests modern and ancient flowers of the same lineages produced similar essences.
Some of flowers studied were even in the process of emitting compounds at the time they were engulfed by the tree resin that later became amber.
The study also included a milkweed flower (Discoflorus neotropicus) and an acacia flower (Senegalia eocaribbeansis) in 20- to 30-million-year-old Dominican Republic amber.
The anther glands on the fossil acacia flower were especially attractive to bees, one of which was fossilized while visiting the stamens. Today, honeybees are still visiting acacia flowers that have the same type of flora glands that existed in the ancient past.
“It’s obvious flowers were producing scents to make themselves more attractive to pollinators long before humans began using perfumes to make themselves more appealing to other humans,” George Poinar said.
Reference:
George Poinar, Greg Poinar. The antiquity of floral secretory tissues that provide today’s fragrances. Historical Biology, 2018; 1 DOI: 10.1080/08912963.2018.1502288
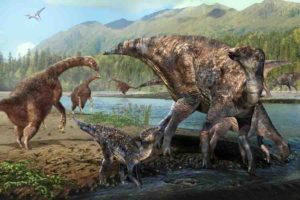
Artist’s rendering of therizinosaurs and hadrosaurs at Alaska’s Denali National Park during the Cretaceous Period. Credit: Illustration by Masato Hattori
An international team of paleontologists and other geoscientists has discovered the first North American co-occurrence of hadrosaur and therizinosaur tracks in the lower Cantwell Formation within Denali National Park, suggesting that an aspect of the continental ecosystem of central Asia was also present in this part of Alaska during the Late Cretaceous.
This comprehensive cross-disciplinary effort has resulted in a paper — entitled “An unusual association of hadrosaur and therizinosaur tracks within Late Cretaceous rocks of Denali National Park, Alaska” — published in Scientific Reports, an online open access scientific mega journal published by the Nature Publishing Group, covering all areas of the natural sciences.
Anthony R. Fiorillo, Ph.D., chief curator and vice president of research and collections at the Perot Museum of Nature and Science in Dallas, Texas, is the lead author. Co-authors are Paul J. McCarthy, Ph.D., University of Alaska, Department of Geosciences; Yoshitsugu Kobayashi, Ph.D., Hokkaido University Museum, Sapporo, Hokkaido, Japan; Carla S. Tomsich, graduate student, University of Alaska, Department of Geosciences; Ronald S. Tykoski, Ph.D., director of paleontology lab, Perot Museum of Nature and Science; Yuong-Nam Lee, Ph.D., School of Earth and Environmental Sciences, Seoul National University, South Korea; Tomonori Tanaka, graduate student, Hokkaido University Museum, Sapporo, Hokkaido, Japan; and Christopher R. Noto, Ph.D., Department of Biological Sciences, University of Wisconsin-Parkside, Kenosha, Wisconsin.
Fiorillo and a colleague published on a distinct single footprint in Denali National Park in 2012 that they determined to be made by a therizinosaur, an unusual predatory dinosaur thought to have become an herbivore. Therizinosaurs are best known from Asia. Upon his return in 2013 and 2014, they conducted a more detailed analysis of the area, and he and his colleagues unearthed dozens more tracks of therizinosaurs. What surprised Fiorillo and his team most was the co-occurrence of dozens of hadrosaurs, also known as duck-bill dinosaurs.
“Hadrosaurs are very common and found all over Denali National Park. Previously, they had not been found alongside therizinosaurs in Denali. In Mongolia, where therizinosaurs are best known — though no footprints have been found in association — skeletons of hadrosaurs and therizinosaurs have been found to co-occur from a single rock unit so this was a highly unusual find in Alaska, and it prompted my interest,” said Fiorillo. “From our research, we’ve determined that this track association of therizinosaurs and hadrosaurs is currently the only one of its kind in North America.”
The plant-eating therizinosaurs are rare and unusual creatures in the fossil record. The strange-looking dinosaurs had long skinny necks, little teeth, a small beak for cropping plants, and big torsos accompanied by large hind feet and long arms with “hands like Freddy Krueger.”
Though therizinosaurs are known from Asia and North America, the best and most diverse fossil record is from Asia — even up to the time of extinction — and therein is the connection. Fiorillo has long postulated that
Cretaceous Alaska could have been the thoroughfare for fauna between Western North America and Asia — two continents that shared each other’s fauna and flora in the latest stages of the Cretaceous.
“This study helps support the idea that Alaska was the gateway for dinosaurs as they migrated between Asia and North America,” said Dr. Kobayashi.
To support the theory, Fiorillo’s international team of scientists from across the U.S., Japan and South Korea worked to establish if the tracks were those of a therizinosaur and to study any unique aspects of the ecosystem. The members — including a sedimentologist, geologist, paleobotanist, paleoecologist and additional paleontologists including an expert on therizinosaurs — determined that this particular area of Denali was a wet, marsh-like environment and that one fossil in particular looked like a water lily, which supported the theory that there were ponds and standing water nearby. They suspect that both therizinosaurs and hadrosaurs liked these wetter locations.
Fiorillo believes that this Alaskan discovery may connect these animals environmentally and perhaps behaviorally to other therizinosaurs in central Asia. An Asian report of these animals being associated also came from an interval of rocks that was unusually ‘wet’ at the time, relative to rocks above and below it.
“This discovery provides more evidence that Alaska was possibly the superhighway for dinosaurs between Asia and western North America 65-70 million years ago,” added Fiorillo.
Reference:
Anthony R. Fiorillo, Paul J. McCarthy, Yoshitsugu Kobayashi, Carla S. Tomsich, Ronald S. Tykoski, Yuong-Nam Lee, Tomonori Tanaka, Christopher R. Noto. An unusual association of hadrosaur and therizinosaur tracks within Late Cretaceous rocks of Denali National Park, Alaska. Scientific Reports, 2018; 8 (1) DOI: 10.1038/s41598-018-30110-8
The chemical composition of gases emitted from volcanoes — which are used to monitor changes in volcanic activity — can change depending on the size of gas bubbles rising to the surface, and relate to the way in which they erupt. The results, published in the journal Nature Geoscience, could be used to improve the forecasting of threats posed by certain volcanoes.
A team of scientists, including a volcanologist and mathematician from the University of Cambridge, discovered the phenomenon through detailed observations of gas emissions from Kīlauea volcano in Hawaii.
At many volcanoes around the world, gas emissions are monitored routinely to help with forecasting eruptions. Changes in the output or proportions of different gases — such as carbon dioxide and sulphur dioxide — can herald shifts in the activity of a volcano. Volcanologists have considered that these chemical changes reflect the rise and fall of magma in the Earth’s crust but the new research reveals that the composition of volcanic gases depends also on the size of the gas bubbles rising up to the surface.
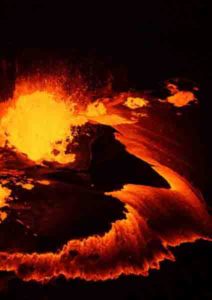
Until the latest spectacular eruption opened up fissures on the flank of the volcano, Kīlauea held a vast lava lake in its summit crater. The behaviour of this lava lake alternated between phases of fiery ‘spattering’ powered by large gas bubbles bursting through the magma, and more gentle gas release, accompanied by slow and steady motion of the lava.
In the past, volcanic gases have been sampled directly from steaming vents and openings called fumaroles. But this is not possible for the emissions from a lava lake, 200 metres across, and at the bottom of a steep-sided crater. Instead, the team used an infrared spectrometer, which is employed for routine volcano monitoring by co-authors of the study, Jeff Sutton and Tamar Elias from the Hawaiian Volcano Observatory (US Geological Survey).
The device was located on the edge of the crater, pointed at the lava lake, and recorded gas compositions in the atmosphere every few seconds. The emissions of carbon- and sulphur-bearing gases were measured during both the vigorous and mild phases of activity.
Each individual measurement was used to compute the temperature of the volcanic gas. What immediately struck the scientists was that the gas temperatures ranged from 1150 degrees Celsius — the temperature of the lava — down to around 900 degrees Celsius. “At this temperature, the lava would freeze,” said lead author Dr Clive Oppenheimer, from Cambridge’s Department of Geography. “At first, we couldn’t understand how the gases could emerge much colder than the molten lava sloshing in the lake.”
The clue to this puzzle came from the variation in calculated gas temperatures — they were high when the lava lake was placid, and low when it was bubbling furiously. “We realised it could be because of the size of the gas bubbles,” said co-author Professor Andy Woods, Director of Cambridge’s BP Institute. “Larger bubbles rise faster through the magma and expand rapidly as the pressure reduces, just like bubbles rising in a glass of fizzy drink; the gas cools down because of the expansion.” Larger bubbles form when smaller bubbles bump into each other and merge.
Woods and Oppenheimer developed a mathematical model to account for the process, which showed a very good fit with the observations.
But there was yet another surprising finding from the gas observations from Hawaii. As well as being cooler, the emissions from the large gas bubbles were more oxidised than expected — they had higher proportions of carbon dioxide to carbon monoxide.
The chemical balance of volcanic gases such as carbon dioxide and carbon monoxide (or sulphur dioxide and hydrogen sulphide) is generally thought to be controlled by the chemistry of the surrounding liquid magma but what the new findings showed is that when bubbles get large enough, most of the gas inside follows its own chemical pathway as the gas cools.
The ratio of carbon dioxide to carbon monoxide when the lava lake was in its most energetic state was six times higher than during the most stable phase. The scientists suggest this effect should be taken into account when gas measurements are being used to forecast major changes in volcanic activity.
“Gas measurements are critical to our monitoring and hazard assessment; refining our understanding of how magma behaves beneath the volcano allows us to better interpret our observations,” said co-author Tamar Elias from the Hawaiian Volcano Observatory.
And there is another implication of this discovery — not for eruptions today but for the evolution of the Earth’s atmosphere billions of years ago. “Volcanic emissions in Earth’s deep past may have made the atmosphere more oxidising than we thought,” said co-author Bruno Scaillet. “A more oxygen-rich atmosphere would have facilitated the emergence and viability of life on land, by generating an ozone layer, which shields against harmful ultraviolet rays from the sun.”
Reference:
Clive Oppenheimer, Bruno Scaillet, Andrew Woods, A. Jeff Sutton, Tamar Elias, Yves Moussallam. Influence of eruptive style on volcanic gas emission chemistry and temperature. Nature Geoscience, 2018; DOI: 10.1038/s41561-018-0194-5
Note: The above post is reprinted from materials provided by University of Cambridge. The original story is licensed under a Creative Commons License.
Iron-silica particles helped shield cyanobacteria like these, which played a key role in the oxygenation of Earth’s atmosphere according to new research from UAlberta. Credit: George Owttrim
The oxygenation of Earth’s atmosphere was thanks, in part, to iron and silica particles in ancient seawater, according to a new study by geomicrobiologists at the University of Alberta. But these results solve only part of this ancient mystery.
Early organisms called cyanobacteria produced oxygen through oxygenic photosynthesis, resulting in the oxygenation of Earth’s atmosphere. But cyanobacteria needed protection from the sun’s UV radiation in order to evolve. That’s where iron and silica particles in ancient seawater come in, according to Aleksandra Mloszewska, a former PhD student who conducted this research under the supervision of Kurt Konhauser, professor in the Department of Earth and Atmospheric Sciences, and George Owttrim, professor in the Department of Biological Sciences.
The research team characterized the effect of UV stress on cyanobacteria and the degree of radiation through the seawater medium through a combination of microbiological, spectroscopic, geochemical and modelling techniques. Their results show that the presence of high silica and iron concentrations in early sea water allowed for the formation of iron-silica precipitates that remained suspended in the ocean for extended periods of time.
“In effect, the iron-silica particles acted as an ancient ‘sunscreen’ for the cyanobacteria, protecting them from the lethal effects of direct UV exposure,” said Konhauser, the senior author from UAlberta. “This was critical on the early Earth before a sufficiently thick ozone layer was established that could enable marine plankton to spread across the globe, as is the case today.”
More missing pieces
But, the researchers explain, the iron-silica rich precipitates tell only part of the story.
“The accumulation of atmospheric oxygen from cyanobacterial facilitated the evolution of oxygen-based respiration and multicellular organisms,” says Owttrim. But the reason for the large amount of time that it took for free oxygen to accumulate permanently in the atmosphere after the initial evolution of cyanobacteria remains a mystery.
While iron-silica precipitates would have allowed early cyanobacteria to survive, UV radiation would still have prevented their widespread growth.
“It is likely that early cyanobacteria would not have been as productive as they are today because of the effects of UV stress. Until the accumulation of sufficient cyanobacteria-derived oxygen allowed a more permanent means of protection to develop, such as an ozone layer, UV stress may have played an even more important role in shaping the structure of the earliest ecosystems,” explained Mloszewska.
These new findings are helping researchers to understand not only how early cyanobacteria were affected by the high level of radiation on the early Earth but also the environmental dynamics that affected the oxygenation history of our atmosphere.
“These findings could also be used as a case study to help us understand the potential for the emergence of life on other planets that are affected by elevated UV radiation levels, for example Earth-sized rocky planets within the habitable zones of nearby M-dwarf star systems like TRAPPIST-1, Proxima Centauri, LHS 1140 and Ross 128 among others,” said Mloszewska.
The research was conducted in collaboration with colleagues at the University of Tuebingen and Yale University and was supported by the National Science and Research Council of Canada, and by the NASA Alternative Earths Astrobiology Institute. The paper, “UV radiation limited the expansion of cyanobacteria in early marine photic environments” is published in Nature Communications.
Reference:
Aleksandra M. Mloszewska, Devon B. Cole, Noah J. Planavsky, Andreas Kappler, Denise S. Whitford, George W. Owttrim, Kurt. O Konhauser. UV radiation limited the expansion of cyanobacteria in early marine photic environments. Nature Communications, 2018; 9 (1) DOI: 10.1038/s41467-018-05520-x
Artistic depiction of early Earth blasted by solar system debris. Credit: NASA/Goddard Image Lab
Early Earth was a hot, gaseous, dusty and dynamic planet with an atmosphere and an ocean. Then its surface cooled and stabilized enough for clouds, landmasses and early life to form about four billion years ago, during what’s called the isotopic age of rocks, or the Archean Period. Atmospheric chemical byproducts from that time traveled through the air and deposited inside the planet’s oldest rock, recording life’s earliest activities like photosynthesis and oxygen production.
Sulfur isotopes can serve as tracers of atmospheric oxygen, and new data collected from the present-day atmosphere in China by an international team of researchers, led by the University of California San Diego, indicate remarkable similarity to the isotopic footprint found in ancient rocks. This opens up new interpretations of the Archean Period’s sulfur isotope sedimentary signature—a proxy for the origins and evolution of atmospheric oxygen and early life on Earth.
The study led by Mark Thiemens, distinguished professor of chemistry and biochemistry; Mang Lin, a recent Ph.D. graduate from UC San Diego and Yanan Shen, a professor at the University of Science and Technology of China, is published in the current issue of the Proceedings of the National Academy of Sciences. Their research involved taking current sulfate aerosol measurements of five sulfur isotopes from samples of atmospheric aerosols collected at Mount Wuyi, a remote site in China, and Guangzhou, a megacity. The isotope measurements, performed at UC San Diego and the University of Science and Technology of China resolved the chemical mechanisms and transport of atmospheric aerosols at a new scientific level.
“By using the stable and radioactive isotopes, we were able to zero in on new sources of the isotope effect today and better define the early atmosphere and evolution of life,” Thiemens said.
Thiemens explained that in the Archean atmosphere the oxygen and ozone levels were low enough that ultraviolet (UV) light penetrated the Earth’s surface and dissociated sulfur dioxide, forensically producing a specific isotopic pattern. The study reveals that stable sulfur isotope compositions are anomalous and mimic measurements of ancient sulfur isotopes.
Additionally, Thiemens explained that the photo destruction of sulfur dioxide by UV light in the early Earth’s atmosphere provides a measure of oxygen levels. He said that the levels of oxygen and ozone levels of early Earth were sufficiently low so that UV light reached the Earth’s surface, dissociating the sulfur dioxide and producing the anomalies.
Measurement of sulfur anomalies in the oldest rocks as a measure of oxygen levels was discovered at the Thiemens Research Group laboratory at UC San Diego with James Farquhar and Huiming Bao. The method is widely used to track oxygen levels before around 2.2 billion years ago, when oxygen and ozone levels rose to such levels that UV light was filtered out and the anomaly disappeared from the rock record.
“A surprise from Mang Lin’s measurements was that with combined stratospheric tracer Sulfur-35 (a radioactive sulfur isotope), and another stable isotope of stable sulfur, there is no correlation,” said Thiemens. “It was demonstrated by correlation with known combustion products that the processes of biomass burning and combustion produce this specific isotope anomaly, which had not been known before, providing new interpretation of early Earth chemistry and suggesting there are other processes that occur in the early Earth, such as volcanoes, that could produce the anomalies along with UV light photolysis.”
According to Thiemens, this study provides “yet another quiver in the arrow” of parsing out processes that occur in the early Earth and defining both life’s origin and change.
Reference:
Mang Lin et al. Five-S-isotope evidence of two distinct mass-independent sulfur isotope effects and implications for the modern and Archean atmospheres, Proceedings of the National Academy of Sciences (2018). DOI: 10.1073/pnas.1803420115
Researchers have known for decades that deep earthquakes — those deeper than 60 kilometers, or about 37 miles below the Earth’s surface — radiate seismic energy differently than those that originate closer to the surface. But a systematic approach to understanding why has been lacking.
Now a team of researchers from the University of Houston has reported a way to analyze seismic wave radiation patterns in deep earthquakes to suggest global deep earthquakes are in anisotropic rocks, something that had not previously been done. The rock anisotropy refers to differences in seismic wave propagation speeds when measured along different directions.
Their findings were published Monday, July 30, by the journal Nature Geoscience.
Most earthquakes occur at shallow depths, according to the U.S. Geological Survey, and they generally cause more damage than deeper earthquakes. But there are still substantial questions about the causes of deep earthquakes.
Normal rocks are ductile, or pliable, at these great depths because of high temperature and thus aren’t able to rupture in an abrupt fashion to produce deep earthquakes, which occur below subduction zones where two tectonic plates collide at ocean trenches. The plate being pushed under is referred to as the subducting slab. The fact that deep earthquakes occur only in these slabs suggests some unusual process is happening within the slab.
Yingcai Zheng, assistant professor of seismic imaging in the UH College of Natural Sciences and Mathematics and corresponding author for the paper, said seismologists have sought to understand deep earthquakes since the phenomenon was discovered in 1926. Hypotheses include the effect of fluids, runaway thermal heating or solid-phase change due to sudden collapse of the mineral crystal structure.
In addition to Zheng, researchers involved in the work include the first author Jiaxuan Li, a Ph.D. candidate in the Department of Earth and Atmospheric Sciences; Leon Thomsen, research professor of geophysics; Thomas J. Lapen, professor of geology; and Xinding Fang, adjunct professor at UH and concurrently associate professor at the Southern University of Science and Technology China.
“Over the past 50 years, there has been growing evidence that a large proportion of deep earthquakes do not follow the double-couple radiation pattern seen in most shallow earthquakes,” Zheng said. “We set out to look at why that happens.” The double-couple pattern is caused by a shear rupture of a pre-existing fault.
The work, funded by the National Science Foundation, looked at potential reasons for the differing radiation patterns; Zheng said earlier theories suggest that deep earthquakes stem from a different rupture mechanism and possibly different physical and chemical processes than those that spark shallow earthquakes.
But after studying the radiation patterns of 1,057 deep earthquakes at six subduction zones worldwide, the researchers determined another explanation. They found that the surrounding rock fabric enclosing the deep quake alters the seismic radiation into a non-double-couple pattern. “Both the common double-couple radiation patterns and uncommon patterns of deep earthquakes can be explained simultaneously by shear rupture in a laminated rock fabric,” Li said.
Before the subducting plate enters the trench, it can absorb sea water to form hydrated anisotropic minerals. As the slab descends in the Earth’s mantle, the water can be expelled due to high pressure and high temperature conditions, a process known as dehydration. The dehydration and strong shearing along the slab interface can make the rock brittle and lead to rupture in intermediate-depth earthquakes, defined as those between 60 kilometers and 300 kilometers deep (37 miles to 186 miles).
“We found at these depths that the anisotropic rock fabric is always parallel to the slab surface, although the slab can change directions greatly from place to place,” Li said.
Anisotropy is also found in rocks at even greater depths, which suggests materials such as magnesite or aligned carbonatite melt pockets may be involved in generating the deep ruptures, the researchers said. Because the inferred anisotropy is high — about 25 percent — the widely believed meta-stable solid phase change mechanism is not able to provide the needed anisotropy inferred by the researchers.
Reference:
Jiaxuan Li, Yingcai Zheng, Leon Thomsen, Thomas J. Lapen, Xinding Fang. Deep earthquakes in subducting slabs hosted in highly anisotropic rock fabric. Nature Geoscience, 2018; DOI: 10.1038/s41561-018-0188-3
SEM micrograph of the volcanic mineral biotite, found in ancient pottery from the Hopewell site at Shawnee Lookout.
Supervolcanoes are one of Mother Nature’s deadliest phenomena, and when they erupt, they can change the climate of the entire planet.
To get a glimpse for how future catastrophic volcanic events might alter our lives, scientists at the University of Cincinnati dug deep into the past to find new evidence for volcanic related climate change.
The results of the study are published in the July issue of Scientific Reports titled “Positive platinum anomalies at three late holocene high magnitude volcanic events in Western Hemisphere sediments.”
“We looked at platinum particles as an indicator for how far volcanic ash has traveled,” says Kenneth Tankersley, UC associate professor of anthropology and geology and lead author on the study.
“The age of the sediment containing the platinum allowed our interdisciplinary team of anthropologists, geologists, geographers and biologists to directly pinpoint radical change in climate for eight different Western hemisphere archeological sites to three major catastrophic volcanoes from the beginning of the little ice age and Medieval Warming. The most recent dated to the 18th-century.”
Why is this important? Tankersley and the researchers hope studies like this can help the world better prepare for the next major eruption. As he says, “It’s not ‘if’ these catastrophic volcanic events will return, it’s ‘when.'”
“Can you imagine a year or even a decade with no summer?” asks Tankersley. “This happened consistently throughout the past 10,000 years.”
For example, Tankersley explains the Eldgjá eruption of (CE 934) as producing so much dust in the atmosphere, it filtered enough sun and heat to lower global temperatures significantly for a couple of years. What ensued were severe winters contributing to famine, epidemics, and loss of many lives. Over 900 years later a volcanic event on the Pacific island of Krakatoa caused Cincinnati to have an extremely cold winter and a very cool summer in the late 1800s.
Not all explosive volcanic eruptions result in the global distribution of particle spread, such as the most recent Kilauea volcano in Hawaii. However, Tankersley notes, there is a definite link between significant changes in climate conditions outside regular climate cycles and the high magnitude volcanic events explored in this research.
PLATINUM VALUE
A key player in this investigation is Platinum. According to the researchers, the rare element doesn’t occur naturally on the Earth’s surface. Instead, it occurs after a cosmic impact like a meteor, asteroid or a slice of a comet hits the earth.
Or, as in this case, platinum is revealed when volcanic ash spews along with fountains of incandescent lava and cow-pie shaped molten rock bombs. The resulting ash clouds contain platinum, evidence for the far-reaching effects of major volcanic eruptions.
The study looked at sediment samples from eight Western hemisphere archeological sites in the Ohio valley, the American southwest, the Caribbean and the Maya Lowland in Guatemala.
The interdisciplinary researchers from across UC’s campus and Kongju National University were able to successfully connect the radical climate change patterns from each of those sites to one or more of three high magnitude volcanic events including the Eldgjá volcano (CE 934) and the Laki volcano (CE 1783) in Iceland and Kuwae volcano on the island of Vanuatu off the coast of Eastern Africa (CE 1452).
All three catastrophic volcanic eruptions happened within the last 1,000 years or the late Holocene — the geological period we live in currently.
DATING SEDIMENT
Among UC’s research team is first-year anthropology grad student Dominique Sparks-Stokes who retrieved deep sediment samples from two of the Ohio Valley sites and identified botanical remains for radiocarbon dating.
After teasing out carbonized plants from the deep core samples, Sparks-Stokes and the researchers were able to count the number of carbon atoms — a process Tankersley says helps geochronologists put a precise date on where they are within the core.
In the lab, Sparks-Stokes works on trays filled with sandy colored dust and flakes. “See those tiny sparkling particles in this dust that looks like shiny sand? Much of that shiny material is quartz, feldspar and mica from volcanic dust preserved in the baked pottery.
“We have perfect conditions in these pocketed and protected environments where winds have little effect from erosion,” adds Sparks-Stokes, referring to the sinkholes in Serpent Mound and the Wynema site in the Ohio Valley areas.
“We dated the preserved sediments containing platinum and compared those dates to Western Hemisphere volcanic activity from the same era and associated that with erratic climate change patterns during that time as a result of those volcanic events.”
Identifying platinum particles within ancient volcanic ash is the first step. Dating the sediment using geochronology is the next, which is where UC geologist Lewis Owen comes in.
“In addition to radiocarbon dating, Owen added his optically stimulated luminescence expertise to a suite of scientific technology referred to as chronometric dating,” notes Tankersley. “We compared these findings to our typologically and temporally distinctive artifacts, which allowed us to pin down volcanic events that were already known from those epochs in time.”
BETWEEN A ROCK AND A “HOT” PLACE
Regular volcanoes eject millions of cubic feet of ash and debris over an entire state. But as Tankersley points out, supervolcanoes can devastate a whole continent, and half of the Earth’s super volcanoes happened in North America.
The last high magnitude eruption created a mini ice age that led to dramatic climate change. The greatest impact from another catastrophic event would come months after the explosion, however, as the deadliest result of these events is not so much the ash that falls to the ground but the gases that stay in the air, adds Tankersley.
“Explosive volcanoes blow materials up into the stratosphere,” explains research team member Warren Huff, UC professor emeritus of geology. “The explosion releases sulfur dioxide gas, which converts into sulfuric acid aerosol droplets that then travel through the earth’s atmosphere on wind currents.
“More than 200-million tons of sulfur dioxide, thrust into the air and spread worldwide by the stratospheric winds, can produce a veil covering the earth cutting out much of the sunlight. When the shade dims the heat from the sun for long periods of time the earth cools down.”
Volcanologists currently find an active supervolcano brewing under 3,400 square miles of protected wilderness in Northwest Wyoming’s Yellowstone National Park. It has exploded several times between 2.1 million years and 830,000 years ago.
“The concentrations of platinum from well-dated and well-stratified late Holocene sites provide an opportunity for more vigorous scientific evaluations of the impact of future high magnitude volcanic eruptions on climate change and society,” adds Tankersley.
Reference:
Kenneth Barnett Tankersley, Nicholas P. Dunning, Lewis A. Owen, Warren D. Huff, Ji Hoon Park, Changjoo Kim, David L. Lentz, Dominique Sparks-Stokes. Positive Platinum anomalies at three late Holocene high magnitude volcanic events in Western Hemisphere sediments. Scientific Reports, 2018; 8 (1) DOI: 10.1038/s41598-018-29741-8
This is a visualization of the continental plates around Greenland. Credit: NASA’s Goddard Space Flight Center
By mapping the heat escaping from below the Greenland Ice Sheet, a NASA scientist has sharpened our understanding of the dynamics that dominate and shape terrestrial planets.
Dr. Yasmina M. Martos, a planetary scientist at NASA’s Goddard Space Flight Center in Greenbelt, Maryland, mined publicly available magnetic field, gravity and other geologic information for clues about the amount and distribution of heat beneath the portion of the North American continent that is Greenland.
Her resulting heat map exposed a thermal track beneath Greenland that records the movement of a continent through Earth’s history.
Greenland is thought to have slowly moved over a mantle plume, a source of great heat, which left a diagonal scar of warm, dense rock below the surface as the tectonic plate shifted. Greenland moved from a more southern latitude toward the Arctic over 100 million years, a period when the supercontinent Pangaea was breaking up into the drifting continents of today. Eventually, the plume is thought to have formed Iceland above the surface of the ocean through countless volcanic eruptions — a visible trace of the plume’s existence, in contrast to Greenland’s hidden scar.
“I don’t think there is any other place on Earth where a plume history has been recorded by a piece of continent that hasn’t been affected by it at the surface,” Martos said. “But it’s there, so we can use thermal heat to understand the history of the region.”
Tracking these geodynamics of planets helps scientists understand their evolution. But more immediately, the heat information feeds sea-level-change models on Earth by helping scientists predict the behavior of ice. This is particularly important for the surface of land that, in the case of Greenland, is buried below kilometers of ice and so is hard to get to. More than 80 percent of the Greenland is covered by ice.
Where there’s heat, there might be a plume
In an Aug. 1 Geophysical Research Letters paper, Martos and her team mapped the geothermal heat flux, or rate of heat escape, in Greenland. Their models, surprisingly, showed regional variations, plus a path of heat along a peculiar route from the northwest to the southeast of the island.
“We would expect Greenland to have a more uniform signal of geothermal heat flow in its interior, but that’s not the case,” said Martos, the lead author on the paper.
Other authors include Tom A. Jordan and David G. Vaughan from the British Antarctic Survey; Manuel Catalán from the Royal Institute and Observatory of the Spanish Navy; Thomas M. Jordan from Stanford University and University of Bristol, and Jonathan L. Bamber, also from the University of Bristol.
The team suggests the scar was created as the tectonic plate, which includes Greenland, moved through the millennia over a mantle plume that is active below the lithosphere. The lithosphere is Earth’s outer layer; it includes the crust and upper part of the mantle. This plume is a channel of hot rock that starts hundreds of kilometers below the surface. It rises through the mantle and reaches the bottom of the lithosphere. The heat is then transported up through the lithosphere and alters its chemical composition, which thickens the crust.
Because the northwest region of Greenland moved off the plume earlier it appears in Martos’ models to be significantly cooler than the southeast. Though the southern region is slowly cooling off.
“The nice thing is that the heat is recorded there now, but probably in a hundred million years we’re not going to see that anymore,” Martos said.
A similar plume formed the Hawaiian Islands and is currently fueling the K?lauea volcano eruptions. The Hawaiian chain of islands and seamounts that were created when the Pacific Plate moved over the plume in the middle of the Pacific Ocean is a visible representation of the type of scar that Martos found beneath Greenland.
The heat beneath Earth’s surface
Plumes are one of several geothermal heat-transporting phenomena on Earth; their number is uncertain, but scientists think there could be as many as 20. Otherwise, the inner planet is heated evenly throughout by decaying radioactive elements in Earth’s top layers. There’s also primordial warmth left over from the formation of our planet 4.5 billion years ago, and from the meteorites that pummeled it. The team considered these heat sources, Martos said, but ruled out their role in producing the scar because they would have formed a uniform heat pattern across Greenland.
Another factor that can increase heat in a specific location is tectonic activity. This activity includes rifting — or the breaking apart of continental plates, which creates space for warmer mantle to bubble to the surface — and volcanic eruptions. But these phenomena also didn’t square with the team’s findings, said Martos, given that Greenland is a craton, or an ancient piece of continent with no major tectonic events on record there.
Measuring heat without touching the surface
Because Greenland is covered by an ice sheet that is up to 1.8 miles (3 kilometers) thick in the center, getting physical samples from the ground below the ice is nearly as difficult as getting them from the Moon. Remotely sensed data offers virtually the only window to Greenland’s subsurface dynamics.
Martos’s team decided to look at magnetic field information collected by magnetometers, instruments flown by airplanes that measure the strength of the magnetic field of Earth. The data revealed anomalies in the magnetism of rocks below Greenland.
Magnetism is related to temperature, thus rocks heated to certain temperatures lose their magnetism. This typically happens deep inside Earth. Because magnetite is the most abundant magnetic mineral in the lower part of the crust, the researchers studied that mineral exclusively. Magnetite loses its ferromagnetic properties, or magnetism, when heated to 1,076 degrees Fahrenheit (580 degrees Celsius), a point known as the Curie temperature. Accounting for this temperature’s effect on magnetite allowed the team to find the base of magnetism in the crust of Greenland. From there, they observed the depth variations of the location of the Curie temperature for magnetite to map the heat released all over the island.
Along the plume’s path, the team found that the Curie temperature occurred closer to the surface. This offered evidence that the plume had heated the bottom of the lithosphere, and that the heat was still there.
The team also used gravity data to model the features of the lithosphere and confirm the plume’s effect on crustal thickness.
In the central part of the island, the team estimated geothermal heat flux values around 60 to 70 milliwatts per meter squared, or up to 50 percent higher than the heat escaping parts of the island not affected by the plume. This is a tiny amount; a 100-watt light bulb, by comparison, generates three orders of magnitude — or 1,000 times — more heat.
Still, said Martos and her co-authors, the heat they found can melt ice at the base of the Greenland Ice Sheet. It does not, however, contribute to the accelerated melting of Greenland’s glaciers. Because the geothermal heat declines over such huge periods of time — tens of millions of years — there has likely been no change in heat flux since the ice fully formed on Greenland about 3 million years ago.
Martos’ modeling tools will help scientists better understand the effect of below-surface heat on things like melt or breakage at the base of ice sheets and glaciers on Earth. It will also help them study remote locations on Earth and other rocky bodies in our solar system.
Martos began this research while she was a Marie Curie fellow of the European Union at the British Antarctic Survey.
Reference:
Yasmina M. Martos Tom A. Jordan Manuel Catalan Thomas M. Jordan Jonathan L. Bamber David G. Vaughan. Geothermal heat flux reveals the Iceland hotspot track underneath Greenland. Geophysical Research Letters, 2018 DOI: 10.1029/2018GL078289
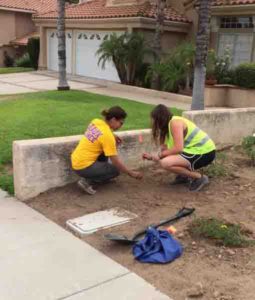
LSU’s Patricia Persaud (left) and a Cal Tech undergraduate student mark a newly-buried geophone node in a Los Angeles yard. Credit: Patricia Persaud
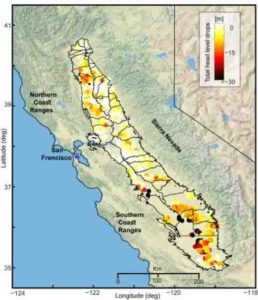
Using an array of coffee-can sized geophones deployed for about a month in backyards, golf courses and public parks, researchers collected enough data to allow them to map the depth and shape of the San Gabriel and San Bernardino sedimentary basins of Los Angeles, California.
Seismologists think these sedimentary basins may act a “waveguide” to focus and trap energy from an earthquake on the southern San Andreas Fault, so understanding their structure is important to help predict how well they might channel the energy from such an earthquake into downtown Los Angeles.
The research team, led by Patricia Persaud of Louisiana State University and Robert Clayton from the California Institute of Technology, was able to map the two basins in greater detail than previous studies, showing that the San Gabriel basin is deeper than the San Bernardino basin and that the San Bernardino basin has an irregular shape. Persaud and colleagues also uncovered signs of deep offsets in layers of the earth’s crust that could be related to two faults — the Red Hill and Raymond faults — that have been previously mapped in nearby areas at the surface.
“It is currently too early to say how our results will change how we might think of these basins’ ability to channel seismic energy,” Persaud said. “However, we are collecting more data in the area that will be used to further refine the basin structure.”
Geophones are instruments that convert the velocity of ground motion into voltage which can be used to determine the geometry of structures beneath the earth’s surface. Visualizing the details of sedimentary basin structure requires a large number of seismic stations that are closely spaced in order to capture important changes in structure laterally across the basin. Geophone arrays offer an inexpensive and feasible way to collect this data in a densely-populated urban area, compared to the complications and expense of deploying broadband seismometers, Persaud noted.
Each of the 202 nodes deployed in the study, in three lines spanning the northern basins, are about the size of a coffee can. “They weigh about six pounds and have a data logger, battery and recorder all in one container,” Persaud explained. “To place them in the ground we dig a small hole that will allow the nodes to be covered with about two inches of soil once they are firmly planted. Most Los Angeles area residents tell us to put them wherever we want, some even help us dig the holes; so we choose a site in their yards and in about five minutes we have the node in place and recording.”
In most cases, property owners were “extremely friendly and accommodating” during the current study, said Persaud. “What’s interesting is when we got a positive response it was almost immediate. Los Angeles residents are very much aware of the elevated seismic hazard in this region, and are often curious about our study and the nodes, and they want to find out more. Some offer to spread the word about our study through social media and encourage their friends and neighbors to participate as well.”
The nodes collected data continuously for 35 days. In this time, they detected ground motion from magnitude 6 and greater earthquakes that occurred thousands of kilometers away from Los Angeles. Seismic waveform data from these teleseismic earthquakes can be used with a method called the receiver function technique to map the thickness of the crust and shallow crustal structures below a seismic station. The receiver functions calculated from the nodal arrays are similar to those calculated from broadband data, the researchers concluded, but the nodal array offers a higher-resolution look at crustal structures such as the boundary between the earth’s crust and mantle and the interface between sediments and basement rock across the basins.
This summer, the research team is back in California placing nodes “along new lines that are intended to fill in any areas where there might be a change in basin shape,” said Persaud. “We have just deployed three new profiles and will then compile the results from all of our profiles to produce an updated structural model for the basins.”
Reference:
Guibao Liu, Patricia Persaud, Robert W. Clayton. Structure of the Northern Los Angeles Basins Revealed in Teleseismic Receiver Functions from Short‐Term Nodal Seismic Arrays. Seismological Research Letters, 2018; DOI: 10.1785/0220180071
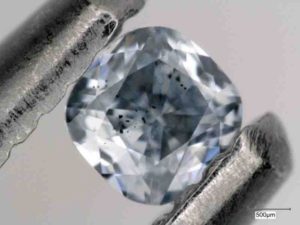
A blue, boron-bearing diamond with dark inclusions of a mineral called ferropericlase, which were examined as part of this study. This gem weighs 0.03 carats. Credit: Photo by Evan Smith/GIA.
Blue diamonds — like the world-famous Hope Diamond at the National Museum of Natural History — formed up to four times deeper in the Earth’s mantle than most other diamonds, according to new work published on the cover of Nature.
“These so-called type IIb diamonds are tremendously valuable, making them hard to get access to for scientific research purposes,” explained lead author Evan Smith of the Gemological Institute of America, adding, “and it is very rare to find one that contains inclusions, which are tiny mineral crystals trapped inside the diamond.”
Inclusions are remnants of the minerals from the rock in which the diamond crystallized and can tell scientists about the conditions under which it formed.
Type IIb diamonds owe their blue color to the element boron, an element that is mostly found on the Earth’s surface. But analysis of the trapped mineral grains in 46 blue diamonds examined over two years indicate that they crystallized in rocks that only exist under the extreme pressure and temperature conditions of the Earth’s lower mantle.
The research group — which included Carnegie’s Steven Shirey, Emma Bullock, and Jianhua Wang — determined that blue diamonds form at least as deep as the transition zone between the upper and lower mantle — or between 410 and 660 kilometers below the surface. Several of the samples even showed clear evidence that they came from deeper than 660 kilometers, meaning they originated in the lower mantle. By contrast, most other gem diamonds come up from between 150 and 200 kilometers.
So how did the boron get down there if it is an element known for residing predominately in the shallow crust?
According to the hypothesis put forth by the research group, it came from seafloor that was conveyed down into the Earth’s mantle when one tectonic plate slid beneath another — a process known as subduction.
The new study proposes that boron from the Earth’s surface was incorporated into water-rich minerals like serpentine, which crystallized during geochemical reactions between seawater and the rocks of the oceanic plate. This reaction between rock and water is a process called serpentinization and can extend deep into the seafloor, even into the oceanic plate’s mantle portion.
The group’s discovery reveals that the water-bearing minerals travel far deeper into the mantle than previously thought, which indicates the possibility of a super-deep hydrological cycle.
“Most previous studies of super-deep diamonds had been carried out on diamonds of low quality,” Shirey said. “But between our 2016 finding that the world’s biggest and most-valuable colorless diamonds formed from metallic liquid deep inside Earth’s mantle and this new discovery that blue diamonds also have super-deep origins, we now know that the finest gem-quality diamonds come from the farthest down in our planet.”
Reference:
Evan M. Smith, Steven B. Shirey, Stephen H. Richardson, Fabrizio Nestola, Emma S. Bullock, Jianhua Wang, Wuyi Wang. Blue boron-bearing diamonds from Earth’s lower mantle. Nature, 2018; 560 (7716): 84 DOI: 10.1038/s41586-018-0334-5
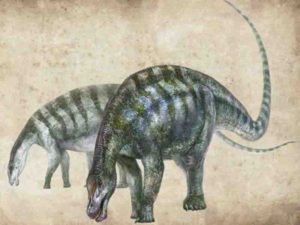
Artist’s impression of dinosaur Lingwulong shenqi. Credit: Zhang Zongda
A new dinosaur called Lingwulong shenqi or ‘amazing dragon from Lingwu’ has been discovered by an Anglo-Chinese team involving UCL.
The announcement, published in Nature Communications, reports the surprising discovery of the new dinosaur which roamed the Ningxia Autonomous Region, northwest China, approximately 174 million years ago. This is in a place they were never thought to roam and 15 million years earlier than this type of dinosaur was thought to exist.
Lingwulong is the earliest known example of a type of advanced sauropod dinosaur called a ‘neosauropod’ — one of the long-necked, gigantic herbivores that are the largest land animals known, including famous forms such as Brontosaurus and Diplodocus.
Sauropods originated around 200 million years ago, but they only started to truly dominate terrestrial ecosystems by developing gigantic body size (up to 70 metric tonnes) and numerous new adaptations for obtaining and processing plant food.
These giant neosauropod descendants were thought to originate around 160 million years ago, rapidly diversifying and spreading across the world during a time window perhaps as short as just 5 million years.
“We were surprised to find a close relative of Diplodocus in East Asia 174 million years ago. It’s commonly thought that sauropods did not disperse there until 200 million years ago and many of their giant descendants, reached this region much later, if at all,” explained study co-author Professor Paul Upchurch (UCL Earth Sciences).
“Our discovery of Lingwulong demonstrates that several different types of advanced sauropod must have existed at least 15 million years earlier and spread across the world while the supercontinent Pangaea was still a coherent landmass. This forces a complete re-evaluation of the origins and evolution of these animals.”
The new evidence also reinforces the growing realisation that the Early Jurassic (200-175 million years ago), was a key time in dinosaur evolution, witnessing the origins and diversification of many groups that went on to dominate the later Jurassic and Cretaceous.
“Diplodocus-like neosauropods were thought to have never made it to East Asia because this region was cut-off from the rest of the world by Jurassic seaways, so that China evolved its own distinctive and separate dinosaur fauna. However, Lingwulong shows that these Diplodocus-like sauropods were present after all, and implies that the isolation of East Asia was less profound and short-lived than we realised,” said lead author, Dr Xing Xu (Institute of Vertebrate Paleontology & Paleoanthropology, Chinese Academy of Sciences, Beijing, China).
For the study, palaeontologists analysed the fossilised skeletons of 7-10 individual dinosaurs that were found together in rocks in 2005 and have been dated at approximately 174 million years old. Funding secured in 2016 by National Geographic Research enabled the formation of this Anglo-Chinese project to study the specimens in detail.
The team conclude that finding such a dinosaur ‘in the wrong place, at the wrong time’, emphasises the gaps in our knowledge of the fossil record and suggests that there are many surprises still to come.
Reference:
Xing Xu, Paul Upchurch, Philip D. Mannion, Paul M. Barrett, Omar R. Regalado-Fernandez, Jinyou Mo, Jinfu Ma, Hongan Liu. A new Middle Jurassic diplodocoid suggests an earlier dispersal and diversification of sauropod dinosaurs. Nature Communications, 2018; 9 (1) DOI: 10.1038/s41467-018-05128-1
A fossil heterostracan, Errivaspis waynensis, from the early Devonian (approximately 419 million years ago) of Herefordshire, UK. Credit: Image from Keating et al. 2018
Scientists at The University of Manchester and the University of Bristol have used powerful X-rays to peer inside the skeletons of some of our oldest vertebrate relatives, solving a 160-year-old mystery about the origin of our skeletons.
Living vertebrates have skeletons built from four different tissue types: bone and cartilage (the main tissues that human skeletons are made from), and dentine and enamel (the tissues from which our teeth are constructed). These tissues are unique because they become mineralised as they develop, giving the skeleton strength and rigidity.
Evidence for the early evolution of our skeletons can be found in a group of fossil fishes called heterostracans, which lived over 400 million years ago. These fishes include some of the oldest vertebrates with a mineralised skeleton that have ever been discovered. Exactly what tissue heterostracan skeletons were made from has long puzzled scientists.
Now a team of researchers from the University of Manchester, the University of Bristol and the Paul Scherrer Institute in Switzerland have taken a detailed look inside heterostracan skeletons using Synchrotron Tomography: a special type of CT scanning using very high energy X-rays produced by a particle accelerator. Using this technique, the team have identified this mystery tissue.
Lead researcher Dr Joseph Keating, from Manchester’s School of Earth of Environmental Scientists, explained: “Heterostracan skeletons are made of a really strange tissue called ‘aspidin’. It is crisscrossed by tiny tubes and does not closely resemble any of the tissues found in vertebrates today. For a 160 years, scientists have wondered if aspidin is a transitional stage in the evolution of mineralised tissues.”
The results of this study, published in Nature Ecology and Evolution, show that the tiny tubes are voids that originally housed fibre-bundles of collagen, a type of protein found in your skin and bones.
These findings enabled Dr Keating to rule out all but one hypothesis for the tissue’s identity: aspidin is the earliest evidence of bone in the fossil record.
Co-author, Professor Phil Donoghue from the University of Bristol concludes: “These findings change our view on the evolution of the skeleton. Aspidin was once thought to be the precursor of vertebrate mineralised tissues. We show that it is, in fact, a type of bone, and that all these tissues must have evolved millions of years earlier.”
Reference:
Joseph N. Keating, Chloe L. Marquart, Federica Marone, Philip C. J. Donoghue. The nature of aspidin and the evolutionary origin of bone. Nature Ecology & Evolution, 2018; DOI: 10.1038/s41559-018-0624-1
This is PhD student Mohamad Bazzi with a fossil lamniform shark tooth. Credit: Jordi Estefa
A study that examined the shape of hundreds of fossilized shark teeth suggests that modern shark biodiversity was triggered by the end-Cretaceous mass extinction event, about 66 million years ago.
This finding is reported this week in Current Biology.
As part of a larger scientific endeavour aiming to understand the diversity of fossil sharks, a group of researchers from Uppsala University, Sweden, and the University of New England, Australia, have explored how certain groups of sharks responded to the mass extinction that killed-off non-bird dinosaurs and marked the end of the Cretaceous period and the Mesozoic era.
Much like several other vertebrate groups during the Cretaceous (142-66 million years ago), shark diversity looked very different from today. Ground sharks (Carcharhiniformes) are the most diverse shark group living today, with over 200 different species. However, while dinosaurs dominated terrestrial environments during the Cretaceous, Mackerel sharks (Lamniformes) were the dominant shark forms of the sea.
“Our study found that the shift from lamniform- to carcharhiniform-dominated assemblages may well have been the result of the end-Cretaceous mass extinction,” said project leader and Uppsala doctoral student Mohamad Bazzi.
Sharks are one of the major groups that survived the Cretaceous-Palaeogene mass extinction and, today, carcharhiniforms are typified by forms such as the Tiger, Hammerhead, and Blacktip Reef sharks and lamniforms by the Great White and Mako sharks.
“Unlike other vertebrates, the cartilaginous skeletons of sharks do not easily fossilize and so our knowledge of these fishes is largely limited to the thousands of isolated teeth they shed throughout their lives,” says Mr. Bazzi. “Fortunately, shark teeth can tell us a lot about their biology, including information about diet, which can shed light on the mechanisms behind their extinction and survival.”
The team used “cutting-edge” analytical techniques to explore the variation of tooth shape in carcharhiniforms and lamniforms and measured diversity by calculating the range of morphological variation, also called disparity.
“Going into this study, we knew that sharks underwent important losses in species richness across the extinction.” said Dr. Nicolás Campione at the University of New England, who co-devised the project. “But to our surprise, we found virtually no change in disparity across this major transition. This suggests to us that species richness and disparity may have been decoupled across this interval.”
Despite this seemingly stable pattern, the study found that extinction and survival patterns were substantially more complex. Morphologically, there were differential responses to extinction between lamniform and carcharhiniform sharks, with evidence for a selective extinction of lamniforms and a subsequent proliferation of carcharhiniforms (the largest order of living sharks today) in the immediate aftermath of the extinction.
“Carcharhiniforms are the most common shark group today and it would seem that the initial steps towards this dominance started approximately 66 million years ago,” said Mr. Bazzi, who remarks that further research is still needed to understand the diversity patterns of other shark groups, along with the relationship between diet and tooth morphology.
Although the mechanisms that triggered such a shift in sharks can be difficult to interpret. The team hypothesises that changes in food availability may have played an important role. The end-Cretaceous extinction saw to major losses in marine reptiles and cephalopods (e.g. squids) and the post-extinction world saw the rise of bony fishes. In addition, it is likely that the loss of apex predators (such as lamniforms and marine reptiles) benefited mid-trophic sharks, a role fulfilled by many carcharhiniforms.
“By studying their teeth, we are able to get a glimpse at the lives of extinct sharks,” said Dr. Campione, “and by understanding the mechanisms that have shaped their evolution in the past, perhaps we can provide some insights into how to mitigate further losses in current ecosystems.”
Approximately 50% of the shark species in the IUCN are considered to be either endangered, threatened, or near-threatened.
Reference:
Mohamad Bazzi, Benjamin P. Kear, Henning Blom, Per E. Ahlberg, Nicolás E. Campione. Static Dental Disparity and Morphological Turnover in Sharks across the End-Cretaceous Mass Extinction. Current Biology, 2018; DOI: 10.1016/j.cub.2018.05.093
Note: The above post is reprinted from materials provided by Uppsala University.
New research shows that a big earthquake can not only cause other quakes, but large ones, and on the opposite side of the Earth.
The findings, published today in Scientific Reports, are an important step toward improved short-term earthquake forecasting and risk assessment.
Scientists at Oregon State University looked at 44 years of seismic data and found clear evidence that tremblors of magnitude 6.5 or larger trigger other quakes of magnitude 5.0 or larger.
It had been thought that aftershocks — smaller magnitude quakes that occur in the same region as the initial quake as the surrounding crust adjusts after the fault perturbation — were the only seismic activity an earthquake could lead to.
But the OSU analysis of seismic data from 1973 through 2016 — an analysis that excluded data from aftershock zones — provided the first discernible evidence that in the three days following one large quake, other earthquakes were more likely to occur.
Each test case in the study represented a single three-day window “injected” with a large-magnitude (6.5 or greater) earthquake suspected of inducing other quakes, and accompanying each case was a control group of 5,355 three-day periods that didn’t have the quake injection.
“The test cases showed a clearly detectable increase over background rates,” said the study’s corresponding author, Robert O’Malley, a researcher in the OSU College of Agricultural Sciences. “Earthquakes are part of a cycle of tectonic stress buildup and release. As fault zones near the end of this seismic cycle, tipping points may be reached and triggering can occur.”
The higher the magnitude, the more likely a quake is to trigger another quake. Higher-magnitude quakes, which have been happening with more frequency in recent years, also seem to be triggered more often than lower-magnitude ones.
A tremblor is most likely to induce another quake within 30 degrees of the original quake’s antipode — the point directly opposite it on the other side of the globe.
“The understanding of the mechanics of how one earthquake could initiate another while being widely separated in distance and time is still largely speculative,” O’Malley said. “But irrespective of the specific mechanics involved, evidence shows that triggering does take place, followed by a period of quiescence and recharge.”
Earthquake magnitude is measured on a logarithmic 1-10 scale — each whole number represents a 10-fold increase in measured amplitude, and a 31-fold increase in released energy.
The largest recorded earthquake was a 1960 temblor in Chile that measured 9.5. The 2011 quake that ravaged the Fukushima nuclear power plant in Japan measured 6.6.
In 1700, an approximate magnitude 9.0 earthquake hit the Cascadia Subduction Zone — a fault that stretches along the West Coast of North American from British Columbia to California.
Collaborating with O’Malley were Michael Behrenfeld of the College of Agricultural Sciences, Debashis Mondal of the College of Science and Chris Goldfinger of the College of Earth, Ocean and Atmospheric Sciences.
Reference:
Robert T. O’Malley, Debashis Mondal, Chris Goldfinger, Michael J. Behrenfeld. Evidence of Systematic Triggering at Teleseismic Distances Following Large Earthquakes. Scientific Reports, 2018; 8 (1) DOI: 10.1038/s41598-018-30019-2
Photograph from the excavations in 1998, with the brachiosaur foot bones below a tail of a Camarasaurus. University of Kansas expedition crew member as a scale. Credit: Photo courtesy of the KUVP archives
The Black Hills region of the United States is famous today for tourist attractions like Deadwood and Mount Rushmore, but around 150 million years ago it was home to one of the largest dinosaurs known. This dinosaur was a member of the sauropod family with long necks and tails. These giant plant-eating dinosaurs like Brontosaurus and Diplodocus were the largest land animals that ever lived on this planet.
The foot described in a new scientific paper recently published in the open-access journal PeerJ — the Journal of Life and Environmental Sciences was excavated in 1998 by an expedition from the University of Kansas, with Anthony Maltese, lead author of the study, as member of the crew. As he writes, it was immediately apparent that the foot, nearly a meter wide, was from an extremely large animal — so the specimen was nicknamed “Bigfoot.”
Now, after detailed preparation and study, Maltese and his international team of researchers from the USA, Switzerland, and Germany identified it as belonging to an animal very closely related to Brachiosaurus, famous for its appearance in the 1993 film Jurassic Park.
Anthony Maltese, Emanuel Tschopp, Femke Holwerda, and David Burnham used 3D scanning and detailed measurements to compare Bigfoot to sauropod feet from numerous species. Their research confirmed that this foot was unusually large. According to Holwerda, a Dutch PhD student at the Ludwig Maximilians University of Munich, Germany, comparisons with other sauropod feet showed that Bigfoot was clearly the largest dinosaur foot discovered to date.
It also confirmed that brachiosaurs inhabited a huge area from eastern Utah to northwestern Wyoming, 150 million years ago. “This is surprising,” says Tschopp, a Swiss paleontologist working at the American Museum of Natural History in New York, “many other sauropod dinosaurs seem to have inhabited smaller areas during that time.”
According to Maltese, who was part of the original University of Kansas team in 1998 but is now at the Rocky Mountain Dinosaur Resource Center in Woodland Park, Colorado, the rock outcrops that produced this fossil hold many more “fantastic dinosaur skeletons,” and the research team hopes to continue their studies on fossils from there.
Reference:
Anthony Maltese, Emanuel Tschopp, Femke Holwerda, David Burnham. The real Bigfoot: a pes from Wyoming, USA is the largest sauropod pes ever reported and the northern-most occurrence of brachiosaurids in the Upper Jurassic Morrison Formation. PeerJ, 2018; 6: e5250 DOI: 10.7717/peerj.5250
Note: The above post is reprinted from materials provided by PeerJ.
Overview of skeletal remains from the Xiaophis myanmarensis snake hatchling trapped in Burmese amber. Photo credit: Ming Bai, Chinese Academy of Sciences
The first-ever discovery of an ancient snake embryo, preserved in 105-million-year-old amber, provides important new information on the evolution of modern snakes, according to a new study led by University of Alberta paleontologists.
“This snake is linked to ancient snakes from Argentina, Africa, India and Australia,” explained paleontologist Michael Caldwell, lead author and professor in the Department of Biological Sciences. “It is an important—and until now, missing—component of understanding snake evolution from southern continents, that is Gondwana, in the mid-Mesozoic.”
Caldwell and his international team, including collaborators from Australia, China and the United States, have tracked the migration of these ancient Gondwanan snakes beginning 180 million years ago when they were carried by tectonic movements of continents and parts of continents, from Australia and India, to Madagascar and Africa, and finally to Asia, in modern-day India and Myanmar.
The amber fragment in which the specimen was found also provided important clues about its environment.
“It is clear that this little snake was living in a forested environment with numerous insects and plants, as these are preserved in the clast,” explained Caldwell. “Not only do we have the first baby snake, we also have the first definitive evidence of a fossil snake living in a forest.”
Using CT scans, the scientific team studied the ancient snake and compared it with the young of modern snakes. Their results yielded unexpected insight into the development and embryology of the ancient specimen, including the formation of the vertebrae and notochord.
“All of these data refine our understanding of early snake evolution, as 100-million year-old snakes are known from only 20 or so relatively complete fossil snake species,” said Caldwell. “There is a great deal of new information preserved in this new fossilized baby snake.”
The paper, “A Mid-Cretaceous Embryonic-to-Neonate Snake in Amber From Myanmar,” was published in Science Advances.
Reference:
Lida Xing et al. A mid-Cretaceous embryonic-to-neonate snake in amber from Myanmar, Science Advances (2018). DOI: 10.1126/sciadv.aat5042
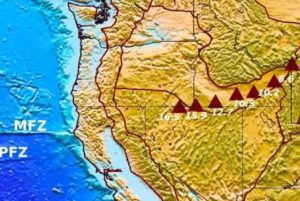
This is the location of the Yellowstone’s hotspot track. The triangles indicate general locations of the Yellowstone and Snake River Plain age-progressive volcanoes with ages shown in millions of years, plotted on a topography map of the Western United States. Credit: Virginia Tech
The long-dormant Yellowstone super-volcano in the American West has a different history than previously thought, according to a new study by a Virginia Tech geoscientist.
Scientists have long thought that Yellowstone Caldera, part of the Rocky Mountains and located mostly in Wyoming, is powered by heat from the Earth’s core, similar to most volcanoes such as the recently active Kilauea volcano in Hawaii. However, new research published in Nature Geoscience by Ying Zhou, an associate professor with the Virginia Tech College of Science’s Department of Geosciences, shows a different past.
“In this research, there was no evidence of heat coming directly up from the Earth’s core to power the surface volcano at Yellowstone,” Zhou said. “Instead, the underground images we captured suggest that Yellowstone volcanoes were produced by a gigantic ancient oceanic plate that dove under the Western United States about 30 million years ago. This ancient oceanic plate broke into pieces, resulting in perturbations of unusual rocks in the mantle which led to volcanic eruptions in the past 16 million years.”
The eruptions were very explosive, Zhou added. A theoretical seismologist, Zhou created X-ray-like images of the Earth’s deep interior from USArray — part of the Earthscope project funded by the National Science Foundation — and discovered an anomalous underground structure at a depth of about 250 to 400 miles right beneath the line of volcanoes.
“This evidence was in direct contradiction to the plume model,” Zhou said.
In her study, Zhou found the new images of the Earth’s deep interior showed that the oceanic Farallon plate, which used to be where the Pacific Ocean is now, wedged itself beneath the present-day Western United States. The ancient oceanic plate was broken into pieces just like the seafloor in the Pacific today. A section of the subducted oceanic plate started tearing off and sinking down to the deep earth.
The sinking section of oceanic plate slowly pushed hot materials upward to form the volcanoes that now make up Yellowstone. Further, the series of volcanoes that make up Yellowstone have been slowly moving, achingly so, ever since. “The process started at the Oregon-Idaho border about 16 million years ago and propagated northwestward, forming a line of volcanoes that are progressively younger as they stretched northwest to present-day Wyoming,” Zhou added.
The previously-held plume model was used to explain the unique Yellowstone hotspot track — the line of volcanoes in Oregon, Idaho, and Wyoming that dots part of the Midwest. “If the North American plate was moving slowly over a position-fixed plume at Yellowstone, it will displace older volcanoes towards the Oregon-Idaho border and form a line of volcanoes, but such a deep plume has not been found.” Zhou said. So, what caused the track? Zhou intends to find out.
“It has always been a problem there, and scientists have tried to come up with different ways to explain the cause of Yellowstone volcanoes, but it has been unsuccessful,” she said, adding that hotspot tracks are more popular in oceans, such as the Hawaii islands. The frequent Geyser eruptions at Yellowstone are of course not volcanic eruptions with magna, but due to super-heated water. The last Yellowstone super eruption was about 630,000 years ago, according to experts. Zhou has no predictions on when or if Yellowstone could erupt again.
The use of the X-ray-like images for this study is unique in itself. Just as humans can see objects in a room when a light is on, Zhou said seismometers can see structures deep within the earth when an earthquake occurs. The vibrations spread out and create waves when they hit rocks. The waves are detected by seismometers and used in what is known as diffraction tomography.
“This is the first time the new imaging theory has been applied to this type of seismic data, which allowed us to see anomalous structures in the Earth’s mantle that would otherwise not be resolvable using traditional methods,” Zhou said.
Zhou will continue her study of Yellowstone. “The next step will be to increase the resolution of the X-ray-like images of the underground rock,” she added.
“More detailed images of the unusual rocks in the deep earth will allow us to use computer simulation to recreate the fragmentation of the gigantic oceanic plate and test different scenarios of how rock melting and magma feeding system work for the Yellowstone volcanoes.”
Reference:
Ying Zhou. Anomalous mantle transition zone beneath the Yellowstone hotspot track. Nature Geoscience, 2018; 11 (6): 449 DOI: 10.1038/s41561-018-0126-4
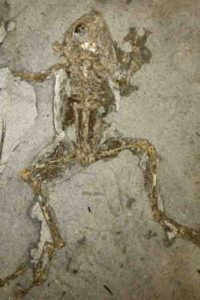
10 million-year-old frog from Libros, Spain, showing dark internal melanosomes in the chest cavity and legs. Credit: Museo Nacional de Ciencias Naturales, Madrid, Spain
A team of palaeontologists, led by University College Cork (UCC) and including the University of Bristol, have discovered new sources of the pigment melanin, calling for a rethink of how scientists reconstruct the colour of fossil birds, reptiles and dinosaurs.
Many recent studies of fossil colour have assumed that fossilized granules of melanin – melanosomes – come from the skin. But new evidence shows that other tissues – such as the liver, lungs, and spleen – can also contain melanosomes, suggesting that fossil melanosomes may not provide information on fossil colour.
The study, published today in the journal Nature Communications, is led by UCC’s Dr. Maria McNamara in collaboration with her Ph.D. student Valentina Rossi, Dr. Paddy Orr from University College Dublin and an international team of palaeontologists from the UK and Japan.
The team studied internal tissues in modern frogs with powerful microscopes and chemical techniques to show that internal melanosomes are highly abundant.
Dr. McNamara said: “This means that these internal melanosomes could make up the majority of the melanosomes preserved in some fossils.”
The team also used decay experiments and analysed fossils to show that the internal melanosomes can leak into other body parts during the fossilization process—like snowflakes inside a snow globe, according to Dr. Orr.
There is a way, however, to tell the difference between melanosomes from internal organs and the skin.
Dr. McNamara added: “The size and shape of skin melanosomes is usually distinct from those in internal organs.
“This will allow us to produce more accurate reconstructions of the original colours of ancient vertebrates.”
Reference:
Maria E. McNamara et al. Non-integumentary melanosomes can bias reconstructions of the colours of fossil vertebrates, Nature Communications (2018). DOI: 10.1038/s41467-018-05148-x
Groundwater well levels dropped several meters at most of the 1600 observation wells across the Central Valley, from 2007-2010. These observations are strongly associated with groundwater extraction during the drought. Credit: ASU
The availability of water from underground aquifers is vital to the basic needs of more than 1.5 billion people worldwide, including those of us who live in the western United States. In recent decades, however, the over-pumping of groundwater, combined with drought, has caused some aquifers to permanently lose essential storage capacity.
With the hope of providing water resource managers with better tools to help keep aquifers healthy, a team of scientists from ASU and the Jet Propulsion Laboratory (JPL) are using the latest space technology to look underneath Earth’s surface to measure this precious natural resource.
They’ve focused their efforts on one of the world’s largest aquifer systems, located in California’s Central Valley, measuring both its groundwater volume and its storage capacity. The results of their most recent findings in this ground breaking study have been recently published in Water Resources Research.
Measuring underground from space
California’s Central Valley is a major agricultural hub covering an area of about 20,000 square miles. It produces more than 25 percent of U.S. agriculture, at an estimated value of $17 billion per year.
Beyond agricultural crops, the Central Valley aquifer system provides necessary water for people and wetlands, supplying about 20 percent of the overall U.S. groundwater demand. With a combination of population increases and drought, this aquifer is ranked one of the most stressed aquifer systems in the world.
While past studies on water resources and drought have focused mainly on low-resolution or local scale measurements of groundwater dynamics, the research team for this study, which includes ASU School of Earth and Space Exploration scientists Chandrakanta Ojha, Manoochehr Shirzaei, and Susanna Werth, with Donald Argus and Thomas Farr from JPL, went an even more high-tech route.
They used the data collection features of several satellite-based Earth remote sensing techniques to get a more consistent and higher resolution view of California’s Central Valley aquifer system than has ever been done before.
“Ironically,” says co-author Werth, who also has a joint appointment at the ASU School of Geographical Sciences and Urban Planning, “we had to go several hundreds of miles up into space to see what was going on under the surface of our planet.”
Using these high-tech remote sensing techniques, the team analyzed data from the 2007 to 2010 drought period and began to map the entire California Central Valley.
“It’s great when we can use our high-tech Earth-orbiting satellites to help solve real-world problems in California,” adds co-author Farr of the Jet Propulsion Laboratory.
They measured land subsidence (when land above and around an aquifer shifts downward) using space-borne Interferometric Synthetic Aperture Radar (InSAR) and added that to data on groundwater levels sampled at thousands of wells across the Central Valley.
“It’s this combination of literally terabytes of data that helps us get the best picture of what is happening below the surface,” says lead author Ojha.
A bell weather for aquifers around the world
From this analysis, the team found that between 2007 and 2010, there was a significant drop in ground levels in the southern area of the Central Valley. In fact, in a three-year period, there was a drop of nearly 32 inches, a decline that should normally take decades.
“Groundwater overdraft in some parts of the Central Valley has permanently altered clay layers, causing rapid ground sinking that can be measured by radar satellites from space,” says co-author Shirzaei.
The most startling result of this study, however, is the permanent loss of water storage capacity in the aquifer system. During the 2007 to 2010 drought, up to two percent of storage capacity was lost entirely when the water level declined and the clay layers in the system were permanently compacted.
“That storage capacity cannot be recovered through natural recharge,” says Ojha. “This means that during the wet season, when the Central Valley gets rain, there is less space to store it, making groundwater supplies scarcer during future droughts.”
New satellites to measure the effects of drought
The next steps for this team will be to focus on the period of drought in California from 2012 to 2016, which was even more detrimental to the Central Valley aquifer than the 2007 to 2010 drought period.
“Periods of drought have long-term effects on groundwater supplies and create major challenges for groundwater management,” says Maggie Benoit, a program director in the National Science Foundation’s Division of Earth Sciences, which provided funding for the research. “Now researchers are developing new methods for monitoring groundwater levels using satellite-based measurements of Earth’s surface, providing a more comprehensive picture of the health of our nation’s groundwater.”
The researchers plan to integrate radar measurements with additional data from the newly launched NASA/GFZ GRACE Follow-On (GRACE-FO) satellites. The GRACE FO mission, which launched on May 22, consists of two nearly identical satellites that follow one another along the same orbit. The satellites continually measure the distance between them, which changes depending on the gravity field over which they are orbiting. Since oscillations of groundwater change the gravity field, scientists can use the data to map underground water location and volume change.
And the work will not end there. The research team hopes to extend the research they are doing in California to Arizona and other areas of the arid southwest.
“The whole region is affected by a long-term drought,” states Werth, “with differences in severity, climate conditions, groundwater geology and water management approaches. Our hope is that these studies will enable authorities and decision makers to accurately manage water resources and plan for future water allocations. Water managers need to know about the irreversible processes taking place and how to act to prevent a future crisis.”
Reference:
Chandrakanta Ojha, Manoochehr Shirzaei, Susanna Werth, Donald F. Argus, Tom G. Farr. Sustained Groundwater Loss in California’s Central Valley Exacerbated by Intense Drought Periods. Water Resources Research, 2018; DOI: 10.1029/2017WR022250