Home Blog Page 67

Thai dinosaur is a cousin of T. rex

Phuwiangvenator and Vayuraptor were fast and dangerous predators. Although only half as long as its relative, the T. rex, Phuwiangvenator almost reached the size of an Asian elephant.
Phuwiangvenator and Vayuraptor were fast and dangerous predators. Although only half as long as its relative, the T. rex, Phuwiangvenator almost reached the size of an Asian elephant. Credit: Adun Samathi/Uni of Bonn

Scientists from the University of Bonn and the Sirindhorn Museum in Thailand have identified two new dinosaur species. They analyzed fossil finds that were already discovered 30 years ago in Thailand. Both species are distant relatives of T. rex, but with a somewhat more primitive structure. They were efficient predators. The results have now been published in the journal Acta Palaeontologica Polonica.

Three decades ago a Thai museum employee discovered some fossilized bones during excavations. He handed them over to the Sirindhorn Museum, where they were never examined in detail. “Five years ago I came across these finds during my research,” explains Adun Samathi. The Thai paleontologist is currently doing his doctorate at the Steinmann Institute of Geology, Mineralogy and Paleontology at the University of Bonn. He brought some casts of the fossils here to analyze them together with his doctoral supervisor Prof. Dr. Martin Sander using state-of-the-art methods.

The results take a new look at the history of the megaraptors (“giant thieves”). The relatives of this group of carnivorous predatory dinosaurs include the Tyrannosaurus rex. Like the T. rex, they ran on their hind legs. Unlike the tyrant lizard, however, their arms were strong and armed with long claws. They also had more delicate heads that ended in a long snout. “We were able to assign the bones to a novel megaraptor, which we baptized Phuwiangvenator yaemniyomi,” explains Samathi. The name is reminiscent on the one hand of the location, the Phuwiang district, and on the other hand of the discoverer of the first Thai dinosaur fossil, Sudham Yaemniyom.

Phuwiangvenator was probably a fast runner. With a length of about six meters, it was considerably smaller than the T. rex, who measured about twelve meters. Megaraptors have so far been discovered mainly in South America and Australia. “We have compared the Thai fossils with the finds there,” says Samathi. “Various characteristics of Phuwiangvenator indicate that it is an early representative of this group. We take this as an indication that the megaraptors originated in Southeast Asia and then spread to other regions.”

During his research in Thailand, the doctoral student discovered further unidentified fossils. They also belong to a predatory dinosaur, which was a bit smaller with a length of about 4.5 meters. The material was not sufficient to clarify the exact ancestry. However, scientists assume that smaller dinosaur, named Vayuraptor nongbualamphuenisis, is also related to Phuwiangvenator and T. rex. “Perhaps the situation can be compared with that of African big cats,” explains Samathi. “If Phuwiangvenator were a lion, Vayuraptor would be a cheetah.”

The two new predatory dinosaurs will be presented to the public today on the tenth anniversary of the Sirindhorn Museum. With blue-blooded support: The event will be opened by the Thai Princess Maha Chakri Sirindhorn.

Reference:
Adun Samathi et al. Two new basal coelurosaurian theropod dinosaurs from the Early Cretaceous Sao Khua Formation of Thailand, Acta Palaeontologica Polonica (2019). DOI: 10.4202/app.00540.2018

Note: The above post is reprinted from materials provided by University of Bonn.

Green Obsidian : What is green obsidian?

Green Obsidian
Green Obsidian

What is Green Obsidian?

Green Obsidian is one of Obsidian Rocks that contain impurities as Pure obsidian usually appears to be dark, although the color may vary depending on the presence of impurities. Iron and other elements of transition can give a dark brown to black color to the obsidian. Most black obsidians contain magnetite, an iron oxide, nanoinclusions, the composition of obsidian is extremely felsic. Obsidian mainly consists of SiO2 (silicon dioxide), usually 70% or more. Crystalline rocks comprise granite and rhyolite with the composition of obsidian.

Obsidian

Obsidian is a natural volcanic glass that is formed as an igneous rock that is extrusive.

Obsidian is produced by rapidly cooling felsic lava extruded from a volcano with minimal growth in crystals. It is commonly found within the margins of rhyolitic lava flows known as obsidian flows, where the chemical composition (high silica content) gives rise to a high viscosity that forms a natural lava glass after rapid cooling.

Obsidian is mineral-like, but not a real mineral because it is not crystalline as a glass ; moreover, its composition is too variable to be classified as a mineral. It’s classified as a mineraloid sometimes.

Obsidian Properties

  • Varieties: Apache Tears, Fire Obsidian, Mahogany Obsidian, Rainbow Obsidian, Sheen Obsidian, Snowflake Obsidian
  • Colors: Black; gray, banded with brown streaks. Iridescence noted: gold, silver, blue, violet, green, and combinations of these colors, due to inclusions of minute bubbles that reflect light.
  • Luster: Vitreous.
  • Polish Luster: Vitreous.
  • Hardness: 5; 6 for basalt glass.
  • Wearability: Poor
  • Optics: Isotropic.

Where can obsidian be found in the United States?

  1. Oregon: varieties of fire, mahogany, and rainbow are known.
  2. Wyoming: at Yellowstone National Park in particular.
  3. New Mexico: Apache tears.
  4. Arizona
  5. Colorado
  6. California
  7. Nevada
  8. Utah: major source of snowflake variety.
  9. Hawaii: Pele’s hair and other varieties

Oldest meteorite collection on Earth found in one of the driest places

The L6 ordinary chondrite El Médano 128, a 556 g meteorite recovered in the Atacama Desert. Photo courtesy CCJ-CNRS, P. Groscaux.
The L6 ordinary chondrite El Médano 128, a 556 g meteorite recovered in the Atacama Desert. Photo courtesy CCJ-CNRS, P. Groscaux. Credit: Photo courtesy CCJ-CNRS, P. Groscaux.

Earth is bombarded every year by rocky debris, but the rate of incoming meteorites can change over time. Finding enough meteorites scattered on the planet’s surface can be challenging, especially if you are interested in reconstructing how frequently they land. Now, researchers have uncovered a wealth of well-preserved meteorites that allowed them to reconstruct the rate of falling meteorites over the past two million years.

“Our purpose in this work was to see how the meteorite flux to Earth changed over large timescales — millions of years, consistent with astronomical phenomena,” says Alexis Drouard, Aix-Marseille Université, lead author of the new paper in Geology.

To recover a meteorite record for millions of years, the researchers headed to the Atacama Desert. Drouard says they needed a study site that would preserve a wide range of terrestrial ages where the meteorites could persist over long time scales.

While Antarctica and hot deserts both host a large percentage of meteorites on Earth (about 64% and 30%, respectively), Drouard says, “Meteorites found in hot deserts or Antarctica are rarely older than half a million years.” He adds that meteorites naturally disappear because of weathering processes (e.g., erosion by wind), but because these locations themselves are young, the meteorites found on the surface are also young.

“The Atacama Desert in Chile, is very old ([over] 10 million years),” says Drouard. “It also hosts the densest collection of meteorites in the world.”

The team collected 388 meteorites and focused on 54 stony samples from the El Médano area in the Atacama Desert. Using cosmogenic age dating, they found that the mean age was 710,000 years old. In addition, 30% of the samples were older than one million years, and two samples were older than two million. All 54 meteorites were ordinary chondrites, or stony meteorites that contain grainy minerals, but spanned three different types.

“We were expecting more ‘young’ meteorites than ‘old’ ones (as the old ones are lost to weathering),” says Drouard. “But it turned out that the age distribution is perfectly explained by a constant accumulation of meteorites for millions years.” The authors note that this is the oldest meteorite collection on Earth’s surface.

Drouard says this terrestrial crop of meteorites in the Atacama can foster more research on studying meteorite fluxes over large time scales. “We found that the meteorite flux seems to have remained constant over this [two-million-year] period in numbers (222 meteorites larger than 10 g per squared kilometer per million year), but not in composition,” he says. Drouard adds that the team plans to expand their work, measuring more samples and narrowing in on how much time the meteorites spent in space. “This will tell us about the journey of these meteorites from their parent body to Earth’s surface.”

Reference:
A. Drouard, J. Gattacceca, A. Hutzler, P. Rochette, R. Braucher, D. Bourlès, ASTER Team, M. Gounelle, A. Morbidelli, V. Debaille, M. Van Ginneken, M. Valenzuela, Y. Quesnel, R. Martinez. The meteorite flux of the past 2 m.y. recorded in the Atacama Desert. Geology, May 22, 2019; DOI: 10.1130/G45831.1

Note: The above post is reprinted from materials provided by Geological Society of America.

Study identifies lherzolite as a source rock for diamond deposits

A tiny inclusion of lherzolitic garnet inside a diamond collected from the De Beers Group Victor Mine in Ontario. New research revealed lherzolite is a source rock for diamond formation—a discovery that could eventually help geologists find valuable deposits around the world.
A tiny inclusion of lherzolitic garnet inside a diamond collected from the De Beers Group Victor Mine in Ontario. New research revealed lherzolite is a source rock for diamond formation—a discovery that could eventually help geologists find valuable deposits around the world. Credit: Anetta Banas

A startling discovery has the potential to change diamond exploration in Canada and around the world.

Research by geologists from the University of Alberta and De Beers Group, the world’s largest diamond company, showed that “economic” diamond deposits can come from lherzolitic diamond substrates, a common rock type in Earth’s mantle, which until now had only been peripherally associated with diamond formation.

“The outcome of the project fundamentally changes our understanding of where diamonds come from,” said U of A geologist Thomas Stachel, the Canada Research Chair in Diamonds. “(It) has the potential to cause diamond companies to retool their approach to exploration.”

Diamonds in ancient continental regions, such as the Canadian Shield, were thought to have grown mainly in different types of mantle rocks. The assumption, which has guided exploration for decades, is now being turned on its head.

The research team used samples from the De Beers Group Victor Mine in the James Bay region of northern Ontario. The area, part of the Canadian Shield, is characterized by a large-scale heating event that occurred about one billion years ago, an unusual setting for a diamond mine.

The research group dated and analyzed the makeup of diamonds, their minuscule inclusions and the mantle itself, said Stachel, who is also director of the Canadian Centre for Isotopic Microanalysis.

“The level of detail collected in this study couldn’t be done anywhere else in the world,” he said, referring to U of A analytical facilities in which almost $30 million has been invested to enable scientists to probe the age and origins of diamonds at the micro-analytical level.

Stachel said the research results for the Victor Mine could apply to other regions around the world that experienced geologically “young” overprint, in particular in Western Canada.

“In the long run, this could make a big difference in diamond exploration,” he said.

The world’s diamond industry is worth an estimated $13 billion annually. Canada is home to the world’s third largest diamond industry, at $2 billion.

The study, “The Victor Mine (Superior Craton, Canada): Neoproterozoic Lherzolitic Diamonds From a Thermally-Modified Cratonic Root,” was published in Mineralogy and Petrology.

Reference:
Thomas Stachel et al. The Victor Mine (Superior Craton, Canada): Neoproterozoic lherzolitic diamonds from a thermally-modified cratonic root, Mineralogy and Petrology (2018). DOI: 10.1007/s00710-018-0574-y

Note: The above post is reprinted from materials provided by University of Alberta.

Rare volcanic rocks lift lid on dangers of little-studied eruptions

Researchers doing fieldwork at Aluto in East Africa.
Researchers doing fieldwork at Aluto in East Africa. Credit: Ben Clarke

Unusual rocks discovered on a remote mountainside have alerted scientists to the dangers posed by a little-studied type of volcano.

Researchers say that the rocks, found in East Africa, provide vital clues into the hazards associated with active volcanoes elsewhere.

The volcanic remnants from Aluto in Ethiopia were formed by intense eruptions that could be far more dangerous than previously thought, researchers say.

Their findings provide fresh insight into the hazards posed by a type of volcanic activity—known as a pumice cone eruption—which, until now, was poorly understood.

Previous studies had suggested the eruptions—which last took place on Aluto more than 2,000 years ago—were quite small and presented a low risk to all but those living very near them.

Researchers from the University of Edinburgh used a range of precise techniques to analyse the rocks and better understand the eruptions that formed them. Their findings could build a clearer picture of the risks posed by these rare volcanoes, which are among the most common types found in East Africa. Others are found in Iceland and on Mayor Island, New Zealand.

The rocks are composed of a thin layer of volcanic glass surrounding a porous, foam-like interior. This structure reveals that the rocks were still hot and sticky when they hit the ground, researchers say.

These small, ultra-light rocks were found a long way from the volcano, suggesting they were carried in a hot jet of volcanic material—known as an eruption column—and fell from the sky.

Eruption columns are formed only during powerful eruptions, and collapse to form fast-moving avalanches of super-heated rock, ash and gas, researchers say.

The study, published in Nature Communications, was funded by the Natural Environment Research Council. The work involved researchers from Addis Ababa and Wollega Universities in Ethiopia. It forms part of the collaborative RiftVolc project between UK and Ethiopian universities.

Ph.D. student Ben Clarke, of the University of Edinburgh’s School of GeoSciences, who led the study, said: “Many people live on and around these volcanoes, which also host valuable geothermal power infrastructure. Our work suggests that future eruptions at these volcanoes have the potential to cause significant harm, further from the volcano than we previously thought. Continued interdisciplinary research to understand and manage this risk is required to safeguard people and infrastructure in Ethiopia.”

Reference:
Ben Clarke et al. Fluidal pyroclasts reveal the intensity of peralkaline rhyolite pumice cone eruptions, Nature Communications (2019). DOI: 10.1038/s41467-019-09947-8

Note: The above post is reprinted from materials provided by University of Edinburgh.

Solving geothermal energy’s earthquake problem

Conventional geothermal resources have been generating commercial power for decades in places where heat and water from burble up through naturally permeable rock.
Conventional geothermal resources have been generating commercial power for decades in places where heat and water from burble up through naturally permeable rock. Credit: Shutterstock

On a November afternoon in 2017, a magnitude 5.5 earthquake shook Pohang, South Korea, injuring dozens and forcing more than 1,700 of the city’s residents into emergency housing. Research now shows that development of a geothermal energy project shoulders the blame.

“There is no doubt,” said Stanford geophysicist William Ellsworth. “Usually we don’t say that in science, but in this case, the evidence is overwhelming.” Ellsworth is among a group of scientists, including Kang-Kun Lee of Seoul National University, who published a perspective piece May 24 in Science outlining lessons from Pohang’s failure.

The Pohang earthquake stands out as by far the largest ever linked directly to development of what’s known as an enhanced geothermal system, which typically involves forcing open new underground pathways for Earth’s heat to reach the surface and generate power. And it comes at a time when the technology could provide a stable, ever-present complement to more finicky wind and solar power as a growing number of nations and U.S. states push to develop low-carbon energy sources. By some estimates, it could amount to as much as 10 percent of current U.S. electric capacity. Understanding what went wrong in Pohang could allow other regions to more safely develop this promising energy source.

Conventional geothermal resources have been generating power for decades in places where heat and water from deep underground can burble up through naturally permeable rock. In Pohang, as in other enhanced geothermal projects, injections cracked open impermeable rocks to create conduits for heat from the Earth that would otherwise remain inaccessible for making electricity.

“We have understood for half a century that this process of pumping up the Earth with high pressure can cause earthquakes,” said Ellsworth, who co-directs the Stanford Center for Induced and Triggered Seismicity and is a professor in the School of Earth, Energy & Environmental Sciences (Stanford Earth).

Here, Ellsworth explains what failed in Pohang and how their analysis could help lower risks for not only the next generation of geothermal plants, but also fracking projects that rely on similar technology. He also discusses why, despite these risks, he still believes enhanced geothermal can play a role in providing renewable energy.

How does enhanced geothermal technology work?

The goal of an enhanced geothermal system is to create a network of fractures in hot rock that is otherwise too impermeable for water to flow through. If you can create that network of fractures, then you can use two wells to create a heat exchanger. You pump cold water down one, the Earth warms it up, and you extract hot water at the other end.

Operators drilling a geothermal well line it with a steel tube using the same process and technology used to construct an oil well. A section of bare rock is left open at the bottom of the well. They pump water into the well at high pressure, forcing open existing fractures or creating new ones.

Sometimes these tiny fractures make tiny little earthquakes. The problem is when the earthquakes get too big.

What led to the big earthquake in Pohang, South Korea?

When they began injecting fluids at high pressure, one well produced a network of fractures as planned. But water injected in the other well began to activate a previously unknown fault that crossed right through the well.

Pressure migrating into the fault zone reduced the forces that would normally make it difficult for the fault to move. Small earthquakes lingered for weeks after the operators turned the pumps off or backed off the pressure. And the earthquakes kept getting bigger as time went by.

That should have been recognized as a sign that it wouldn’t take a very big kick to trigger a strong earthquake. This was a particularly dangerous place. Pressure from the fluid injections ended up providing the kick.

What are the current methods for monitoring and minimizing the threat of earthquakes related to fluid injection for geothermal or other types of energy projects?

Civil authorities worldwide generally don’t want drilling and injection to cause earthquakes big enough to disturb people. In practice, authorities and drillers tend to focus more on preventing small earthquakes that can be felt rather than on avoiding the much less likely event of an earthquake strong enough to do serious harm.

With this in mind, many projects are managed by using a so-called traffic light system. As long as the earthquakes are small, then you have a green light and you go ahead. If earthquakes begin to get larger, then you adjust operations. And if they get too big then you stop, at least temporarily. That’s the red light.

Many geothermal, oil and gas projects have also been guided by a hypothesis that as long as you don’t put more than a certain volume of fluid into a well, you won’t get earthquakes beyond a certain size. There may be some truth to that in some places, but the experience in Pohang tells us it’s not the whole story.

What would a better approach look like?

The potential for a runaway or triggered earthquake always has to be considered. And it’s important to consider it through the lens of evolving risk rather than hazard. Hazard is a potential source of harm or danger. Risk is the possibility of loss caused by harm or danger. Think of it this way: An earthquake as large as Pohang poses the same hazard whether it strikes in a densely populated city or an uninhabited desert. But the risk is very much higher in the city.

The probability of a serious event may be small, but it needs to be acknowledged and factored into decisions. Maybe you would decide that this is not such a good idea at all.

For example, if there’s a possibility of a magnitude 5.0 earthquake before the project starts, then you can estimate the damages and injuries that might be expected. If we can assign a probability to earthquakes of different magnitudes, then civil authorities can decide whether or not they want to accept the risk and under what terms.

As the project proceeds, those conversations need to continue. If a fault ends up being activated and the chance of a damaging earthquake increases, civil authorities and project managers might say, “we’re done.”

From everything you’ve learned about what happened at Pohang, do you think enhanced geothermal development should slow down?

Natural geothermal systems are an important source of clean energy. But they are rare and pretty much tapped out. If we can figure out how to safely develop power plants based on enhanced geothermal systems technology, it’s going to have huge benefits for all of us as a low-carbon option for electricity and space heating.

Reference:
Kang-Kun Lee et al. Managing injection-induced seismic risks, Science (2019). DOI: 10.1126/science.aax1878

Note: The above post is reprinted from materials provided by Stanford University.

Aftershocks of 1959 earthquake rocked Yellowstone in 2017-18

State Highway 287 slumped into Hebgen Lake; damage from the August 1959 Hebgen Lake (Montana-Yellowstone) earthquake.

On Aug. 17, 1959, back when Dwight D. Eisenhower was president, the U.S. had yet to send a human to space and the nation’s flag sported 49 stars, Yellowstone National Park shook violently for about 30 seconds. The shock was strong enough to drop the ground a full 20 feet in some places. It toppled the dining room fireplace in the Old Faithful Inn. Groundwater swelled up and down in wells as far away as Hawaii. Twenty-eight people died. It went down in Yellowstone history as the Hebgen Lake earthquake, with a magnitude of 7.2.

And in 2017, nearly 60 years and 11 presidents later, the Hebgen Lake quake shook Yellowstone again. A swarm of more than 3,000 small earthquakes in the Maple Creek area (in Yellowstone National Park but outside of the Yellowstone volcano caldera) between June 2017 and March 2018 are, at least in part, aftershocks of the 1959 quake. That’s according to a study published in Geophysical Research Letters by University of Utah geoscientists led by Guanning Pang and Keith Koper.

“These kinds of earthquakes in Yellowstone are very common,” says Koper, director of the University of Utah Seismograph Stations. “These swarms happen very frequently. This one was a little bit longer and had more events than normal.”

“We don’t think it will increase the risk of an eruption,” Pang adds.

A long seismic tail

Taken together, the more than 3,000 small quakes of the Maple Creek swarm can be divided into two clusters. The northern cluster consists of Hebgen Lake aftershocks. The quakes fell along the same fault line, and were oriented the same way, as the Hebgen Lake event. Also, the team didn’t see signs that the northern cluster was caused by movement of magma and other fluids beneath the ground.

Koper and Pang says it’s not unheard of for aftershocks of a large earthquake to continue decades after the initial event. Pang, for example, has also studied aftershocks as recent as 2017 from the 1983 Borah Peak earthquake in central Idaho.

“There are formulas to predict how many aftershocks you should see,” Koper says. “For Hebgen Lake, there looked like a deficit in the number of aftershocks. Now that we’ve had these, it has evened things out back up to the original expectations.”

A second culprit

The southern cluster of the Maple Creek swarm seems to have a different origin. Although the northern cluster was lined up with the Hebgen Lake fault, the southern cluster’s lineup was rotated about 30 degrees and the quakes were about 0.6 miles (1 kilometer) shallower than the northern cluster.

So, the researchers concluded, although the shaking in the northern cluster influenced the southern cluster, the primarily cause of the southern shaking was likely subsurface movement of magma.

“We do consider it to be one swarm all together,” Koper says. “Because they were so close, there was some feedback and influence between the two sections.”

Koper says that the results highlight how earthquakes are different than other natural hazards. Floods, hurricanes or wildfires are over when they’re over. “Earthquakes don’t happen as a single discrete event in time,” he says. The specter of aftershocks can continue for months, years or even, as Maple Creek shows, decades.

Reference:
Guanning Pang et al, The 2017–2018 Maple Creek Earthquake Sequence in Yellowstone National Park, USA, Geophysical Research Letters (2019). DOI: 10.1029/2019GL082376

Note: The above post is reprinted from materials provided by University of Utah.

On Mars, sands shift to a different drum

The retreat of Mars' polar cap of frozen carbon dioxide during the spring and summer generates winds that drive the largest movements of sand dunes observed on the red planet.
The retreat of Mars’ polar cap of frozen carbon dioxide during the spring and summer generates winds that drive the largest movements of sand dunes observed on the red planet. Credit: NASA/JPL/University of Arizona/USGS

Wind has shaped the face of Mars for millennia, but its exact role in piling up sand dunes, carving out rocky escarpments or filling impact craters has eluded scientists until now.

In the most detailed analysis of how sands move around on Mars, a team of planetary scientists led by Matthew Chojnacki at the University of Arizona Lunar and Planetary Lab set out to uncover the conditions that govern sand movement on Mars and how they differ from those on Earth.

The results, published in the current issue of the journal Geology, reveal that processes not involved in controlling sand movement on Earth play major roles on Mars, especially large-scale features on the landscape and differences in landform surface temperature.

“Because there are large sand dunes found in distinct regions of Mars, those are good places to look for changes,” said Chojnacki, associate staff scientist at the UA and lead author of the paper, “Boundary conditions controls on the high-sand-flux regions of Mars.” “If you don’t have sand moving around, that means the surface is just sitting there, getting bombarded by ultraviolet and gamma radiation that would destroy complex molecules and any ancient Martian biosignatures.”

Compared to Earth’s atmosphere, the Martian atmosphere is so thin its average pressure on the surface is a mere 0.6 percent of our planet’s air pressure at sea level. Consequently, sediments on the Martian surface move more slowly than their Earthly counterparts.

The Martian dunes observed in this study ranged from 6 to 400 feet tall and were found to creep along at a fairly uniform average speed of two feet per Earth year. For comparison, some of the faster terrestrial sand dunes on Earth, such as those in North Africa, migrate at 100 feet per year.

“On Mars, there simply is not enough wind energy to move a substantial amount of material around on the surface,” Chojnacki said. “It might take two years on Mars to see the same movement you’d typically see in a season on Earth.”

Planetary geologists had been debating whether the sand dunes on the red planet were relics from a distant past, when the atmosphere was much thicker, or whether drifting sands still reshape the planet’s face today, and if so, to what degree.

“We wanted to know: Is the movement of sand uniform across the planet, or is it enhanced in some regions over others?” Chojnacki said. “We measured the rate and volume at which dunes are moving on Mars.”

The team used images taken by the HiRISE camera aboard NASA’s Mars Reconnaissance Orbiter, which has been surveying Earth’s next-door neighbor since 2006. HiRISE, which stands for High Resolution Imaging Science Experiment, is led by the UA’s Lunar and Planetary Laboratory and has captured about three percent of the Martian surface in stunning detail.

The researchers mapped sand volumes, dune migration rates and heights for 54 dune fields, encompassing 495 individual dunes.

“This work could not have been done without HiRISE,” said Chojnacki, who is a member of the HiRISE team. “The data did not come just from the images, but was derived through our photogrammetry lab that I co-manage with Sarah Sutton. We have a small army of undergraduate students who work part time and build these digital terrain models that provide fine-scale topography.”

Across Mars, the survey found active, wind-shaped beds of sand and dust in structural fossae — craters, canyons, rifts and cracks — as well as volcanic remnants, polar basins and plains surrounding craters.

In the study’s most surprising finding, the researchers discovered that the largest movements of sand in terms of volume and speed are restricted to three distinct regions: Syrtis Major, a dark spot larger than Arizona that sits directly west of the vast Isidis basin; Hellespontus Montes, a mountain range about two-thirds the length of the Cascades; and North Polar Erg, a sea of sand lapping around the north polar ice cap. All three areas are set apart from other parts of Mars by conditions not known to affect terrestrial dunes: stark transitions in topography and surface temperatures.

“Those are not factors you would find in terrestrial geology,” Chojnacki said. “On Earth, the factors at work are different from Mars. For example, ground water near the surface or plants growing in the area retard dune sand movement.”

On a smaller scale, basins filled with bright dust were found to have higher rates of sand movement, as well.

“A bright basin reflects the sunlight and heats up the air above much more quickly than the surrounding areas, where the ground is dark,” Chojnacki said, “so the air will move up the basin toward the basin rim, driving the wind, and with it, the sand.”

Understanding how sand and sediment move on Mars may help scientists plan future missions to regions that cannot easily be monitored and has implications for studying ancient, potentially habitable environments.

The paper is co-authored by Maria Banks at NASA’s Goddard Space Flight Center in Greenbelt, Maryland, Lori Fenton at the Carl Sagan Center at the SETI institute in Mountain View, California, and Anna Urso at LPL.

Reference:
Matthew Chojnacki, Maria E. Banks, Lori K. Fenton, Anna C. Urso. Boundary condition controls on the high-sand-flux regions of Mars. Geology, 2019; 47 (5): 427 DOI: 10.1130/G45793.1

Note: The above post is reprinted from materials provided by University of Arizona. Original written by Daniel Stolte.

Contact Metamorphism : What is Contact Metamorphism? How it formed?

Contact Metamorphism

Contact Metamorphism

Contact metamorphism is a type of metamorphism that occurs adjacent to intrusive igneous rocks due to temperature increases resulting from hot magma intrusion into the rock. The metamorphosed zone is known as the metamorphic aureole around an igneous rock.

Metamorphic contact rocks, also known as horns, are often fine-grained and do not show signs of strong deformation. The size of the aureole depends on the temperature difference between the rocks of the wall and the intrusion heat.

In general, dikes have small aureoles with minimal metamorphism while thick and well-developed contact metamorphism has large ultramafic intrusions.

How Contact Metamorphism formed?

There is contact metamorphism where a magma body enters the upper part of the crust. Any type of magma body, from a thin dyke to a large stock, can lead to metamorphism in contact. The type and intensity of the metamorphism and the width of the metamorphic aureole will depend on a number of factors, including country rock type, intrusion body temperature, and body size.

A large intrusion will contain more thermal energy and cool much slower than a small one, thus providing metamorphism with a longer time and more heat. This will enable the heat to spread further into the country rock, creating a larger aureole.

Typically, metamorphic contact aureoles are quite small, ranging from a few centimeters around small dykes and sills to as much as 100 meters around a large stock. Contact metamorphism can occur over a wide range of temperatures— from about 300 ° C to over 800 ° C — and, of course, the type of metamorphism and the formation of new minerals will vary. Also important is the nature of country rock. It will convert mudrock or volcanic rock into horns. Limestone will be transformed into marble and quartzite into sandstone.

Regional Metamorphism : What is regional metamorphism? How it formed?

Regional Metamorphism

Regional Metamorphism

When rocks are buried deep in the crust, regional metamorphism occurs. This is commonly associated with the boundaries of convergent plate and mountain range formation. Because burial is required from 10 km to 20 km, the affected areas tend to be large.

It happens in a much larger area. This metamorphism creates rocks like gneiss and schist. Large geological processes such as mountain-building cause regional metamorphism. When exposed to the surface, these rocks show the incredible pressure that causes the mountain building process to bend and break the rocks. Regional metamorphism usually produces gneiss and schist-like foliated rocks.

How it formed?

Regional or Barrovian metamorphism covers large areas of continental crust typically associated with mountain ranges, particularly those associated with convergent tectonic plates or the roots of previously eroded mountains. Conditions producing widespread regionally metamorphosed rocks occur during an orogenic event.

The collision of two continental plates or island arcs with continental plates produces the extreme compressive forces needed for regional metamorphic changes. Later, these orogenic mountains are eroded, exposing the intensely deformed rocks characteristic of their core.

The conditions within the subducting slab as it plunges toward the mantle in a subduction zone also produce regional metamorphic effects, characterized by paired metamorphic belts. Structural geology techniques are used to unravel the history of the collision and to determine the forces involved. Regional metamorphism can be described and classified throughout the orogenic terrane into metamorphic facies or metamorphic temperature / pressure zones.

Formation of the moon brought water to Earth

The rising Earth from the perspective of the moon.
The rising Earth from the perspective of the moon. Credit: NASA Goddard

The Earth is unique in our solar system: It is the only terrestrial planet with a large amount of water and a relatively large moon, which stabilizes the Earth’s axis. Both were essential for Earth to develop life.

Planetologists at the University of Münster (Germany) have now been able to show, for the first time, that water came to Earth with the formation of the Moon some 4.4 billion years ago. The Moon was formed when Earth was hit by a body about the size of Mars, also called Theia. Until now, scientists had assumed that Theia originated in the inner solar system near the Earth. However, researchers from Münster can now show that Theia comes from the outer solar system, and it delivered large quantities of water to Earth. The results are published in the current issue of Nature Astronomy.

From the outer into the inner solar system

The Earth formed in the ‘dry’ inner solar system, and so it is somewhat surprising that there is water on Earth. To understand why this the case, we have to go back in time when the solar system was formed about 4.5 billion years ago. From earlier studies, we know that the solar system became structured such that the ‘dry’ materials were separated from the ‘wet’ materials: the so-called ‘carbonaceous’ meteorites, which are relatively rich in water, come from the outer solar system, whereas the drier ‘non-carbonaceous’ meteorites come from the inner solar system. While previous studies have shown that carbonaceous materials were likely responsible for delivering the water to Earth, it was unknown when and how this carbonaceous material — and thus the water — came to Earth.

“We have used molybdenum isotopes to answer this question. The molybdenum isotopes allow us to clearly distinguish carbonaceous and non-carbonaceous material, and as such represent a ‘genetic fingerprint’ of material from the outer and inner solar system,” explains Dr. Gerrit Budde of the Institute of Planetology in Münster and lead author of the study.

The measurements made by the researchers from Münster show that the molybdenum isotopic composition of the Earth lies between those of the carbonaceous and non-carbonaceous meteorites, demonstrating that some of Earth’s molybdenum originated in the outer solar system. In this context, the chemical properties of molybdenum play a key role because, as it is an iron-loving element, most of the Earth’s molybdenum is located in the core.

“The molybdenum which is accessible today in the Earth’s mantle, therefore, originates from the late stages of Earth’s formation, while the molybdenum from earlier phases is entirely in the core,” explains Dr. Christoph Burkhardt, second author of the study. The scientists’ results therefore show, for the first time, that carbonaceous material from the outer solar system arrived on Earth late.

But the scientists are going one step further. They show that most of the molybdenum in Earth’s mantle was supplied by the protoplanet Theia, whose collision with Earth 4.4 billion years ago led to the formation of the Moon. However, since a large part of the molybdenum in Earth’s mantle originates from the outer solar system, this means that Theia itself also originated from the outer solar system. According to the scientists, the collision provided sufficient carbonaceous material to account for the entire amount of water on Earth.

“Our approach is unique because, for the first time, it allows us to associate the origin of water on Earth with the formation of the Moon. To put it simply, without the Moon there probably would be no life on Earth,” says Thorsten Kleine, Professor of Planetology at the University of Münster.

Reference:
Gerrit Budde, Christoph Burkhardt, Thorsten Kleine. Molybdenum isotopic evidence for the late accretion of outer Solar System material to Earth. Nature Astronomy, 2019; DOI: 10.1038/s41550-019-0779-y

Note: The above post is reprinted from materials provided by University of Münster.

Ammonium fertilized early life on Earth

Researchers have found that a class of molecules called sulfidic anions may have been abundant in Earth’s lakes and rivers.

A team of international scientists — including researchers at the University of St. Andrews, Syracuse University and Royal Holloway, University of London — has demonstrated a new source of food for early life on the planet.

Life on Earth relies on the availability of critical elements such as nitrogen and phosphorus. These nutrient elements are ubiquitous to all life, as they are required for the formation of DNA, the blueprints of life, and proteins, the machinery. They are originally sourced from rocks and the atmosphere, so their availability to life has fluctuated alongside significant changes in the chemistry of Earth’s surface environments over geologic time.

The research, published in Nature Geoscience, reveals how the supply of these elements directly impacted the growth of Earth’s oxygen-rich atmosphere and were key to the evolution of early life on Earth.

The most dramatic change in Earth history followed the evolution of oxygenic photosynthesis, which fundamentally transformed the planet by providing a source of carbon to the biosphere and a source of oxygen to the atmosphere, the latter culminating in the Great Oxidation Event (GOE) some 2.3 billion years ago.

Despite the critical importance of nutrients to life, the availability of nitrogen and phosphorus in pre-GOE oceans is not well understood, particularly how the supply of these elements drove and/or responded to planetary oxygenation.

Using samples of exceptionally well-preserved rocks that have been associated with early evidence for oxygenic photosynthesis 2.7 billion year ago, the team of researchers examined Earth’s early nitrogen cycle to decipher feedbacks associated with the initial stages of planetary oxygenation.

“There is precious little rock available from this time interval that is suitable for the type of analyses we performed. Most rocks that are this old have been deformed and heated during 2.7 billion years of plate tectonic activity, rendering the original signals of life lost,” says Christopher Junium, associate professor of Earth sciences in the College of Arts and Sciences.

The rock samples showed the first direct evidence of the build-up of a large pool of ammonium in the pre-GOE oceans. This ammonium would have provided an ample source of nitrogen to fuel the early biosphere and associated oxygen production.

Research team leader Aubrey Zerkle, reader in the School of Earth and Environmental Sciences at the University of St Andrews, says: “Today we think of ammonium as the unpleasant odor in our cleaning supplies, but it would’ve served as an all-you-can-eat buffet for the first oxygen-generating organisms, a significant improvement on the dumpster scraps they relied on earlier in Earth’s history.”

As well as helping scientists better understand the role of the nitrogen cycle in global oxygenation, the new findings also provide context for other nutrient feedbacks during early planetary evolution.

“It is becoming ever more clear that the game of nutrient limitation has tipped back and forth through Earth’s history as life has evolved and as conditions have changed,” Junium says.

Surprisingly, evidence for significant atmospheric oxygenation does not appear until 400 million years later, meaning that some other nutrient, such as phosphorus, must have been important in setting the evolutionary pace.

Reference:
J. Yang, C. K. Junium, N. V. Grassineau, E. G. Nisbet, G. Izon, C. Mettam, A. Martin, A. L. Zerkle. Ammonium availability in the Late Archaean nitrogen cycle. Nature Geoscience, 2019; DOI: 10.1038/s41561-019-0371-1

Note: The above post is reprinted from materials provided by Syracuse University.

Researchers identify reddish coloring in an ancient fossil

The key fossil examined in this study is a 3-million-year-old extinct species of field mouse from Germany.
The key fossil examined in this study is a 3-million-year-old extinct species of field mouse from Germany. The mouse is approximately 7 cm long. Credit: University of Gӧttingen

Researchers have for the first time detected chemical traces of red pigment in an ancient fossil — an exceptionally well-preserved mouse, not unlike today’s field mice, that roamed the fields of what is now the German village of Willershausen around 3 million years ago.

The study revealed that the extinct creature, affectionately nicknamed “mighty mouse” by the authors, was dressed in brown to reddish fur on its back and sides and had a tiny white tummy. The results were published today in Nature Communications.

The international collaboration, led by researchers at the University of Manchester in the U.K., used X-ray spectroscopy and multiple imaging techniques to detect the delicate chemical signature of pigments in this long-extinct mouse.

“Life on Earth has littered the fossil record with a wealth of information that has only recently been accessible to science,” says Phil Manning, a professor at Manchester who co-led the study. “A suite of new imaging techniques can now be deployed, which permit us to peer deep into the chemical history of a fossil organism and the processes that preserved its tissues. Where once we saw simply minerals, now we gently unpick the ‘biochemical ghosts’ of long extinct species.”

The research team, which includes scientists from the U.S. Department of Energy’s SLAC National Accelerator Laboratory, used X-ray beams from SLAC’s Stanford Synchrotron Radiation Lightsource (SSRL) and the Diamond Light Source (DLS) in the U.K.

Painting a picture of the past

Color plays a vital role in the selective processes that have steered evolution for hundreds of millions of years. But until recently, techniques used to study fossils weren’t capable of exploring the pigmentation of ancient animals, which is pivotal when reconstructing what they looked like.

This most recent paper marks a breakthrough in the ability to resolve fossilized color pigments in long-gone species by mapping key elements associated with the pigment melanin, the dominant pigment in animals. In the form of eumelanin, the pigment gives a black or dark brown color, but in the form of pheomelanin, it produces a reddish or yellow color.

Building the foundation

Until recently, the researchers had focused on the traces of elements known to be associated with eumelanin, which in previous experiments revealed dark and light patterns in the feathers of the first birds, including Archaeopteryx, the famous fossil that first offered a clear link between dinosaurs and birds.

In 2016, co-author Nick Edwards, scientist at SLAC, led a study that demonstrated the potential to differentiate between eumelanin and pheomelanin in modern bird feathers. That work provided a chemical benchmark for this most recent paper, which for the first time showed it’s possible to detect the elusive red pigment, which is far less stable over geological time, in ancient fossils.

“We had to build up a strong foundation using modern animal tissue before we could apply the technique to these ancient animals,” Edwards said. “It was really a tipping point in using chemical signatures to crack the coloring of ancient animals with soft tissue fossils.”

To reveal the fossil patterns in the mighty mouse, the Manchester team used SSRL and DLS to bathe the fossils in intense X-rays. The interaction of those X-rays with trace metals found in pigments allowed the team to reconstruct the reddish coloring in the mouse’s fur.

“The fossils used in this study preserve amazing structural detail, but our work emphasizes that such exceptional preservation may also lead to extraordinary chemical detail that changes our understanding of what is possible to resolve in fossils,” said Manchester professor of geochemistry Roy Wogelius, who co-led the study. “Along the way we learned so much more about the chemistry of pigmentation throughout the animal kingdom”

Adding a new dimension

The key to their work was determining that trace metals were incorporated into the fossilized mouse fur in exactly the same way that they bond to pigments in animals with high concentrations of red pigment in their tissue.

“As you do research in a particular area, the scope of your techniques might evolve,” says Uwe Bergmann, co-author and a distinguished staff scientist at SLAC who led the development of the X-ray fluorescence imaging used in this research. “The hope is that you can develop a tool that will become part of the standard arsenal when something new is studied, and I believe the application to fossils is a good example.”

The effort, which involved physics, paleontology, organic chemistry and geochemistry, informs the scientists what to look for in the future.

“Our hope is that these results will mean that we can become more confident in reconstructing extinct animals and thereby add another dimension to the study of evolution,” Wogelius says.

The team also included researchers from the Fujita Health University in Japan; the Stanford PULSE Institute; the College of Charleston in South Carolina; the Children’s Museum of Indianapolis; the University of Southampton in the U.K.; and the Joint Paleontology Foundation in Spain. The fossils were made available to the study by the University of Göttingen in Germany.

SSRL is a DOE Office of Science user facility. Funding was provided by the U.K. Natural Environment Research Council.

Reference:
Phillip L. Manning, Nicholas P. Edwards, Uwe Bergmann, Jennifer Anné, William I. Sellers, Arjen van Veelen, Dimosthenis Sokaras, Victoria M. Egerton, Roberto Alonso-Mori, Konstantin Ignatyev, Bart E. van Dongen, Kazumasa Wakamatsu, Shosuke Ito, Fabien Knoll, Roy A. Wogelius. Pheomelanin pigment remnants mapped in fossils of an extinct mammal. Nature Communications, 2019; 10 (1) DOI: 10.1038/s41467-019-10087-2

Note: The above post is reprinted from materials provided by DOE/SLAC National Accelerator Laboratory. Original written by Ali Sundermier.

Plankton as a climate driver instead of the sun?

Microscopic view on marine plankton.
Microscopic view on marine plankton. Credit: A. Stuhr, GEOMAR.

Fluctuations in the orbital parameters of the Earth are considered to be the trigger for long-term climatic fluctuations such as ice ages. This includes the variation of the inclination angle of the Earth’s axis with a cycle of about 40,000 years. Kiel-based marine scientists lead by GEOMAR Helmholtz Centre for Ocean Research Kiel have shown by using a new model that biogeochemical interactions between ocean and atmosphere could also be responsible for climate fluctuations on this time scale. The study was recently published in the journal Nature Geoscience.

Earth’s climate history is marked by periodic changes that are usually ascribed to the solar radiation reaching the surface of the Earth. This insolation is not constant over geological time but modulated by cyclic changes in the Earth’s orbital parameters. One of the key parameters affecting insolation is the tilt of the Earth’s rotation axis (obliquity) that changes periodically over time with a cycle length of about 40,000 years. Chemical and isotopic signatures of sediments that were deposited during the Cretaceous and other periods of earth’s history document regular changes in temperature and carbon cycling on this time scale. The 40 kyr cycles observed in the geological climate archives are believed to be the result of obliquity-triggered insolation changes affecting the surface temperature, the circulation of ocean and atmosphere, the hydrological cycle, the biosphere, and ultimately the carbon cycle. One of the problems with this standard theory is that changes in global insolation are very small and have to be amplified by poorly understood positive feedback mechanisms to affect global climate.

A group of scientists from Kiel, Germany propose a very different perspective that emerges from a new numerical model of the marine biosphere. It simulates the turnover of plankton biomass in the ocean and resolves the associated microbial oxidation and reduction reactions controlling the standing stocks of dissolved oxygen, sulfide, nutrients and plankton in the ocean. In their model experiments the scientists found surprisingly a self-sustained 40 kyr climate cycle using the biogeochemical model integrated in a circulation model of the Cretaceous Ocean without applying obliquity forcing.

“In our model, the carbon cycle is largely controlled by plankton living in the surface ocean,” explains Prof. Dr. Klaus Wallmann from GEOMAR, lead author of the study which was recently published in Nature Geoscience. Plankton consumes atmospheric CO2 via photosynthesis and by microorganisms that degraded plankton biomass and release CO2 back into the atmosphere. Since CO2 is a potent greenhouse gas, the biological CO2 turnover affects surface temperatures and global climate. The growth of plankton is controlled by nutrients that take part in a range of microbial oxidation and reduction reactions.

“We have integrated this new biogeochemical model in a circulation model of the Cretaceous Ocean, and it creates a self-sustained 40 kyr climate cycle without applying obliquity forcing,” says Dr. Sascha Flögel, co-author from GEOMAR. “From our perspective, the cycle is induced by a web of positive and negative feedbacks that are rooted in the oxygen-dependent turnover of nitrogen, phosphorus, iron and sulfur in the ocean. Chemical and isotopic data recorded in sediments deposited in the Cretaceous Ocean show periodic changes that are consistent with the model results,” Flögel continues

In this new view on climate change, the relationship between causes and effects is radically different from the standard orbital theory. The marine biosphere rather than insolation is setting the pace and amplitude by controlling the partial pressure of CO2 in the atmosphere. “Our new theory is supported by observations and consistent with our understanding of biogeochemical cycles in the ocean,” according to Prof. Wallmann.

“However obliquity and other orbital parameters may also affect global climate change when their delicate effects on insolation are amplified by positive feedback mechanisms. Therefore, the periodic climate change documented in the geological record may reflect both the breath of the biosphere and the response of the Earth system to external orbital and insolation forcing,” summarizes Prof. Dr. Wolfgang Kuhnt from Kiel University who participated in this study.

Reference:
Klaus Wallmann, Sascha Flögel, Florian Scholz, Andrew W. Dale, Tronje P. Kemena, Sebastian Steinig, Wolfgang Kuhnt. Periodic changes in the Cretaceous ocean and climate caused by marine redox see-saw. Nature Geoscience, 2019; DOI: 10.1038/s41561-019-0359-x

Note: The above post is reprinted from materials provided by Helmholtz Centre for Ocean Research Kiel (GEOMAR).

Colorful Obsidian : What is Obsidian? What are Obsidian Colors?

Spectacular rainbow obsidian blade
Spectacular rainbow obsidian blade (from Davis Creek, California material) Photo: Quinn Street

Obsidian

Obsidian is a volcanic glass that occurs naturally, formed as an extrusive igneous rock.

Obsidian is produced by rapidly cooling felsic lava extruded from a volcano with minimal growth in crystals. It is commonly found within the margins of rhyolitic lava flows known as obsidian flows, where the chemical composition (high silica content) gives rise to a high viscosity that forms a natural lava glass after rapid cooling. The inhibition by this highly viscous lava of atomic diffusion explains the lack of growth in crystals. Obsidian is hard, brittle, and amorphous, with very sharp edges fracturing. It was used in the past to produce cutting and piercing tools and was used as experimental scalpel blades for surgical purposes.

Colorful Obsidian : What Color is Obsidian?

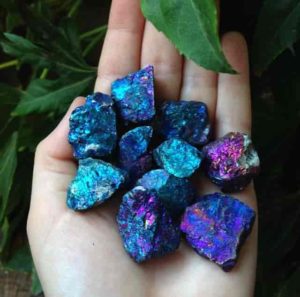
Black is obsidian’s most common color. It can be brown, tan, or green, though. Obsidian may rarely be blue, red, orange, or yellow. Obsidian with multicolored iridescence caused by inclusions of magnetite nanoparticles “caused mainly by trace elements or inclusions”.

Pure obsidian usually appears to be dark, although the color may vary depending on the presence of impurities. Iron and other elements of transition can give a dark brown to black color to the obsidian. Most black obsidians contain magnetite, an iron oxide, nanoinclusions.

Very few obsidian samples are almost colorless. In some stones, a blotchy or snowflake pattern (snowflake obsidian) is produced by the inclusion of small, white, radially clustered mineral cristobalite spherulites in the black glass. Obsidian may contain patterns of the remaining gas bubbles from the lava flow, aligned with layers created as the molten rock flowed before cooling. These bubbles can have interesting effects like a golden shine (sheen obsidian). The inclusion of magnetite nanoparticles creating thin-film interference causes an iridescent, rainbow-like sheen (fire obsidian). Mexico’s colorful, striped obsidian (rainbow obsidian) contains oriented hedenbergite nanorods that cause thin-film interference to the rainbow stripping effects.

Where can obsidian be found?

Obsidian can be found in places where rhyolitic eruptions have occurred. It can be found in Argentina, Australia, Armenia, Azerbaijan, Canada, Chile, Georgia, Greece, El Salvador, Guatemala, Iceland, Italy, Japan, Kenya, Mexico, New Zealand, Papua New Guinea, Peru, Scotland, Turkey and the United States.

In the calderas of the Newberry Volcano and Medicine Lake Volcano in the Cascade Range of West North America and in Inyo Craters east of the Sierra Nevada in California, obsidian flows that can be hiked on are found. Yellowstone National Park has an obsidian mountainside between Mammoth Hot Springs and Norris Geyser Basin, and deposits can be found in many other western U.S. states including Arizona, Colorado, New Mexico, Texas, Utah, Washington, Oregon, and Idaho.

Obsidian can also be found in the eastern U.S. states of Virginia, as well as Pennsylvania and North Carolina.

In the central Mediterranean, there are only four major deposit areas: Lipari, Pantelleria, Palmarola and Monte Arci. Milos and Gyali were ancient sources in the Aegean.

How Earth’s mantle is like a Jackson Pollock painting

A mineral map of a cumulate mineral sample.
A mineral map of a cumulate mineral sample. Credit: Sarah Lambart/University of Utah

In countless grade-school science textbooks, the Earth’s mantle is a yellow-to-orange gradient, a nebulously defined layer between the crust and the core.

To geologists, the mantle is so much more than that. It’s a region that lives somewhere between the cold of the crust and the bright heat of the core. It’s where the ocean floor is born and where tectonic plates die.

A new paper published today in Nature Geoscience paints an even more intricate picture of the mantle as a geochemically diverse mosaic, far different than the relatively uniform lavas that eventually reach the surface. Even more importantly, a copy of this mosaic is hidden deep in the crust. The study is led by Sarah Lambart, assistant professor of geology at the University of Utah, and is funded by European Union’s Horizon 2020 research and innovation program and the National Science Foundation.

“If you look at a painting from Jackson Pollock, you have a lot of different colors,” Lambart says. “Those colors represent different mantle components and the lines are magmas produced by these components and transported to the surface. You look at the yellow line, it’s not going to mix much with the red or black.”

Primitive minerals

Our best access to the mantle comes in the form of lava that erupts at mid-ocean ridges. These ridges are at the middle of the ocean floor and generate new ocean crust. Samples of this lava show that it’s chemically mostly the same anywhere on the planet.

But that’s at odds with what happens at the other end of the crust’s life cycle. Old ocean crust spreads away from mid-ocean ridges until it’s shoved beneath a continent and sinks back into the mantle. What happens after that is somewhat unclear, but if both the mantle and the old crust melt, there should be some variation in the chemical composition of the magmas.

So Lambart and her colleagues from Wales and the Netherlands, sought to discover what the mantle looks like before it rises as lava at a mid-ocean ridge. They examined cores, drilled through the ocean crust, to look at cumulate minerals: the first minerals to crystallize when the magmas enter the crust.

“We looked at the most primitive part of these minerals,” Lambart says, adding that once they located the primitive minerals they analyzed only the chemical composition from those very earliest minerals to form. “If you are not actually looking at the most primitive part you might lose the signal of this first melt that has been delivered to the crust. That is the originality of our work.”

They analyzed the samples centimeter by centimeter to look at variations in isotopes of neodymium and strontium, which can indicate different chemistries of mantle material that come from different types of rock. “If you have isotopic variability in your cumulates, that means that you have to have isotopic variability in the mantle too,” Lambart says.

When the blender turns on

That’s exactly what the team found. The amount of isotope variability in the cumulates was seven times greater than that in the mid-ocean ridge lavas. That means that the mantle is far from well-mixed and that this variability is preserved in the cumulates.

The likely reason, Lambart says, is that different rocks melt at different temperatures. The first rock to melt, for example the old crust, can create channels that can transport magma up to the crust. Melting of another type of rock can do the same. The end result is several networks of channels that converge towards the mid-ocean ridge but don’t mix — hearkening back to the streaks of paint on a Jackson Pollock painting.

To get at what this finding means for geology, picture a smoothie. No — go farther back than that and picture the blender carafe full of fruit, ice, milk and other ingredients. That’s like the mantle — discrete ingredients, as different from each other as a strawberry is from a blueberry. The fully blended smoothie is like the mid-ocean ridge lava. It’s fully mixed. At some point between the deep mantle and the mid-ocean ridge, Earth turns on the blender. Lambart says that her results show that at the very top of the mantle, the mixing hasn’t happened yet. The blender, it turns out, doesn’t turn on until somewhere in the crust.

Lambart’s work helps her and other geologists redefine their idea of how material moves up through the mantle to the surface.

“The problem is we need to find a way to model the geodynamic earth, including plate tectonics, to actually reproduce what is recorded in the rock today,” she says. “So far this link is missing.”

Now Lambart is setting up a new experimental petrology lab to study the conditions for the magmas to preserve their chemical compositions during their journey through the mantle and the crust.

Reference:
Sarah Lambart, Janne M. Koornneef, Marc-Alban Millet, Gareth R. Davies, Matthew Cook, C. Johan Lissenberg. Highly heterogeneous depleted mantle recorded in the lower oceanic crust. Nature Geoscience, 2019; DOI: 10.1038/s41561-019-0368-9

Note: The above post is reprinted from materials provided by University of Utah.

A high-heeled dinosaur?

An artist’s impression of Rhoetosaurus brownei, (c) Queensland Museum 2014. Credit: Konstantinov, Atuchin & Hocknull.
An artist’s impression of Rhoetosaurus brownei, (c) Queensland Museum 2014. Credit: Konstantinov, Atuchin & Hocknull. Credit: University of Queensland

A 24-tonne dinosaur may have walked in a ‘high-heeled’ fashion, according to University of Queensland research.

UQ Ph.D. candidate Andréas Jannel and colleagues from UQ’s Dinosaur Lab analysed fossils of Australia’s only named Jurassic sauropod, Rhoetosaurus brownei, to better understand how such an enormous creature could support its own body weight.

“Looking at the bones of the foot, it was clear that Rhoetosaurus walked with an elevated heel, raising the question: how was its foot able to support the immense mass of this animal, up to 40 tonnes?” Mr Jannel said.

“Our research suggests that even though Rhoetosaurus stood on its tiptoes, the heel was cushioned by fleshy pad.”

“We see a similar thing in elephant feet, but this dinosaur was at least five times as heavy as an elephant, so the forces involved are much greater.”

Mr Jannel and his colleagues arrived at this conclusion by creating a replica of the fossil, and then physically manipulating it in an attempt to understand the movement between bones.

“We also used 3-D modeling techniques to assess the different foot postures that would have allowed Rhoetosaurus to support its weight,” he said.

“Finally, we looked at a range of sauropod footprints from around the world, many of which indicated the presence of a fleshy heel pad behind the toes, supporting what the bones were telling us.

“The addition of a cushioning pad that supports the raised heel appears to be a key innovation during the evolution of sauropods, and probably appeared in early members of the group some time during the Early to Middle Jurassic Periods.

“The advantages of a soft tissue pad may have helped facilitate the trend towards the enormous body sizes we see in these dinosaurs.”

The fossils of the specimen R. brownei were found near Roma in southwest Queensland and are dated to 160–170 million years ago, when Australia was part of the supercontinent of Gondwana.

Mr Jannel is now using computer techniques to simulate how different foot postures and the presence of a soft tissue pad affect stress distributions within the bones.

“In a nutshell, I’m using engineering tools to apply theoretical forces on the bones, assessing how stress is distributed within the feet of these giant dinosaurs, with the aim to provide mechanical evidence for the presence of such a soft tissue pad.

“It can be a tedious and time-consuming process, but I’ve always been fascinated by palaeontology, particularly the link between form and function in extinct animals,” he said.

“There’s so much more to know, but it’s amazing to discover that becoming ‘high-heeled’ might have been an important step in the evolution of sauropod dinosaurs.”

Reference:
Andréas Jannel et al. “Keep your feet on the ground”: Simulated range of motion and hind foot posture of the Middle Jurassic sauropod Rhoetosaurus brownei and its implications for sauropod biology, Journal of Morphology (2019). DOI: 10.1002/jmor.20989

Note: The above post is reprinted from materials provided by University of Queensland.

Museum volunteers discover new species of extinct heron at North Florida fossil site

The new heron species was described from two interlocking shoulder bones from the same individual: the scapula, top, and coracoid, a bone that is often useful for identifying bird species.
The new heron species was described from two interlocking shoulder bones from the same individual: the scapula, top, and coracoid, a bone that is often useful for identifying bird species. Credit: Florida Museum photo by Kristen Grace

When the bones of an ancient heron were unearthed at a North Florida fossil site, the find wasn’t made by researchers but by two Florida Museum of Natural History volunteers.

A previously unknown genus and species, the heron has been named Taphophoyx hodgei (TAFF’-oh-foy-ks HAHJ’-ee-eye) in honor of landowner Eddie Hodge, who has allowed Florida Museum researchers and volunteers to excavate the site on his property near Williston since his granddaughter first discovered fossils there in 2015.

Nearly 700 volunteers have worked at the Montbrook fossil site, collectively digging more than 12,000 hours.

“You couldn’t have a better group of people,” Hodge said. “There’s a lot of negativity when we get home and turn on the television, but it does you good to be out here seeing volunteers get excited and be positive about something.”

The bones used to identify the new heron were found by volunteers Toni-Ann Benjamin and Sharon Shears.

Taphophoyx hodgei — whose genus name means “buried heron” in Greek and Latin — is the first new species to be described from Montbrook. Many other new species from the fossil-rich site await publication.

“It’s invigorated the local fossil community,” said David Steadman, Florida Museum curator of ornithology and lead author of the description of T. hodgei. “One of the greatest values of Montbrook is that it’s been such a collaborative learning tool.”

Because Montbrook is such an intensively worked fossil site, processing the finds takes the teamwork of scientists and amateurs. Hodge oversees much of the land management that Montbrook requires, including moving dirt and managing drainage. In addition to working outdoors at the site, volunteers prepare and catalog specimens in the Florida Museum’s vertebrate paleontology lab.

A good day of digging requires between 10 and 20 days to process in the lab, said Jonathan Bloch, Florida Museum curator of vertebrate paleontology and a coordinator of the fossil dig.

“We simply couldn’t do all this work without help from the public,” Bloch said. “Volunteers are not only the backbone of the dig, they’re actively contributing to scientific discoveries.”

Steadman and then-master’s student Oona Takano used the characteristics of the bird’s scapula and coracoid, two bones that intersect to support the bird’s shoulder, to determine the relationship between this ancient heron and modern lineages.

They believe T. hodgei is most closely related to today’s tiger-herons, which live in Mexico and Central and South America. They have given the new species the common name “Hodge’s tiger-heron.”

“This heron adds to this big suite of aquatic birds we’re finding at Montbrook,” Steadman said. “We’re seeing the same families of birds you’d see around wetlands today, but they’re all extinct species. The fun challenge is finding out how closely related any given species at Montbrook is to the birds that we see flying and swimming around Florida today. Even after three and a half years, we’re nowhere near diminishing returns.”

Takano, now a University of New Mexico Ph.D. student, said that bird fossils are prized finds, particularly at a site like Montbrook where the majority of fossils belong to young gomphotheres, extinct elephant-like mammals.

“In general, bird bones don’t fossilize well because they’re hollow,” she said. “It’s relatively rare to find well-preserved bird bones at all and even rarer to find articulated bones,” referring to bones that would have locked together in the bird’s body.

Most Florida fossil sites are limestone sinkholes or pitfall traps created by ancient predators to capture their prey. At Montbrook, researchers have been able to glimpse a different type of ancient environment: the riverine ecosystem. Five million years ago, T. hodgei would have lived alongside saber-toothed cats, rhinoceroses and horses that frequented a river that likely weaved through a grassland, Steadman said.

Researchers believe the ancient river’s current scattered decomposing animal remains, making this find of two intersecting bones even more significant. Steadman said naming the species after Hodge was a natural choice.

“Through the kindness of his heart and being interested — just wanting to know what’s in the ground on his land — Eddie let us in and one thing led to another.” Steadman said. “Naming this heron after Eddie is a minor part of treating him right because he’s been treating us right.”

“He’s genuinely interested in the fossils we’re finding,” Takano added.

The Florida Museum recruits volunteers for the Montbrook dig in fall and spring and regularly encourages volunteers and students to become involved, often resulting in meaningful fossil discoveries. Finds are shared on the Florida Museum Montbrook Fossil Dig Blog.

“Volunteers are fascinated by this stuff — it’s really their passion,” Hodge said. “There’s a satisfaction in being able to provide something like this for people interested in higher learning, and you don’t get the chance to do that very often. You never know what you can find. Just the next little spoonful of dirt, brush it back and there it is.”

Reference:
David W. Steadman, Oona M. Takano. A new genus and species of heron (Aves: Ardeidae) from the late Miocene of Florida. Bulletin of the Florida Museum of Natural History, 2019; 55 (9): 174-186 [link]

Note: The above post is reprinted from materials provided by Florida Museum of Natural History. Original written by Halle Marchese.

Granite Rocks : What Is Granite Rock And How Is It Formed?

Granite Rocks
Pink granite sample approximately 1″ (3cm) in size – Large crystals in this felsic plutonic rock

What is Granite?

Granite is a common type of granular and phaneritic felsic intrusive igneous rock. Granites, depending on their mineralogy, can be predominantly white, pink or gray in colour. In reference to the coarse-grained structure of such a holocrystalline rock, the word “granite” comes from the Latin granum, a grain. Strictly speaking, granite is an igneous rock with a volume of between 20% and 60% and at least 35% of the total feldspar consisting of alkali feldspar, although the term “granite” is commonly used to refer to a wider range of coarse-grained igneous rocks with quartz and feldspar.

The term “granite” is used for granite and a group of intrusive igneous rocks with similar textures and slight variations in composition and origin. These rocks consist mainly of feldspar, quartz, mica, and amphibole minerals, forming an interlocking, somewhat equigranular feldspar and quartz matrix with dispersed darker biotite mica and amphibole (often hornblende) peppering the lighter minerals.

Granite is almost always massive, hard and tough (i.e. without any internal structures). Throughout human history, these properties have made granite a widespread building stone. The average granite density ranges from 2.65 to 2.75 g / cm3 (165 to 172 lb / cu ft), its compressive strength is usually above 200 MPa, and its viscosity near STP is 3–6·1019 Pa·s.

How is granite formed?

Granite is more common in continental crust than in oceanic crust and has a felsic composition. They are crystallized by felsic melts that are less dense than mafia rocks and therefore tend to ascend to the surface. Mafic rocks, on the other hand, either basalts or gabbros, once metamorphosed at eclogite facies, tend to sink under the Moho into the mantle.

Uses of Granite

Granite has many uses as well as interior / exterior design in the construction. It is popular throughout the world and widely used for architectural design. The following are some of the most commonly used granite products:

  1. Granite flooring tiles
  2. Granite wall tiles
  3. Granite slabs for vanity and counter tops, feature walls and kitchen islands
  4. Granite monuments
  5. Granite tombstones
  6. Granite cobbles
  7. Granite paving stones
  8. Granite veneers

Related: Types of Rocks

From Earth’s deep mantle, scientists find a new way volcanoes form

Bermuda has a unique volcanic past. About 30 million years ago, a disturbance in the mantle’s transition zone supplied the magma to form the now-dormant volcanic foundation on which the island sits.
Bermuda has a unique volcanic past. About 30 million years ago, a disturbance in the mantle’s transition zone supplied the magma to form the now-dormant volcanic foundation on which the island sits. Credit: Wendy Kenigsberg/Clive Howard – Cornell University, modified from Mazza et al. (2019)

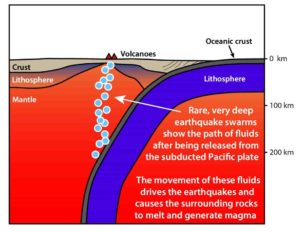
Far below Bermuda’s pink sand beaches and turquoise tides, geoscientists have discovered the first direct evidence that material from deep within Earth’s mantle transition zone — a layer rich in water, crystals and melted rock — can percolate to the surface to form volcanoes.

Scientists have long known that volcanoes form when tectonic plates (traveling on top of the Earth’s mantle) converge, or as the result of mantle plumes that rise from the core-mantle boundary to make hotspots at Earth’s crust. But obtaining evidence that material emanating from the mantle’s transition zone — between 250 to 400 miles (440-660 km) beneath our planet’s crust — can cause volcanoes to form is new to geologists.

“We found a new way to make volcanoes. This is the first time we found a clear indication from the transition zone deep in the Earth’s mantle that volcanoes can form this way,” said senior author Esteban Gazel, associate professor in the Department of Earth and Atmospheric Sciences at Cornell University. The research published in Nature.

“We were expecting our data to show the volcano was a mantle plume formation — an upwelling from the deeper mantle — just like it is in Hawaii,” Gazel said. But 30 million years ago, a disturbance in the transition zone caused an upwelling of magma material to rise to the surface, forming a now-dormant volcano under the Atlantic Ocean and then forming Bermuda.

Using a 2,600-foot (over 700-meter) core sample — drilled in 1972, housed at Dalhousie University, Nova Scotia — co-author Sarah Mazza of the University of Münster, in Germany, assessed the cross-section for isotopes, trace elements, evidence of water content and other volatile material. The assessment provided a geologic, volcanic history of Bermuda.

“I first suspected that Bermuda’s volcanic past was special as I sampled the core and noticed the diverse textures and mineralogy preserved in the different lava flows,” Mazza said. “We quickly confirmed extreme enrichments in trace element compositions. It was exciting going over our first results … the mysteries of Bermuda started to unfold.”

From the core samples, the group detected geochemical signatures from the transition zone, which included larger amounts of water encased in the crystals than were found in subduction zones. Water in subduction zones recycles back to Earth’s surface. There is enough water in the transition zone to form at least three oceans, according to Gazel, but it is the water that helps rock to melt in the transition zone.

The geoscientists developed numerical models with Robert Moucha, associate professor of Earth sciences at Syracuse University, to discover a disturbance in the transition zone that likely forced material from this deep mantle layer to melt and percolate to the surface, Gazel said.

Despite more than 50 years of isotopic measurements in oceanic lavas, the peculiar and extreme isotopes measured in the Bermuda lava core had not been observed before. Yet, these extreme isotopic compositions allowed the scientists to identify the unique source of the lava.

“If we start to look more carefully, I believe we’re going to find these geochemical signatures in more places,” said co-author Michael Bizimis, associate professor at the University of South Carolina.

Gazel explained that this research provides a new connection between the transition zone layer and volcanoes on the surface of Earth. “With this work we can demonstrate that the Earth’s transition zone is an extreme chemical reservoir,” said Gazel. “We are now just now beginning to recognize its importance in terms of global geodynamics and even volcanism.”

Said Gazel: “Our next step is to examine more locations to determine the difference between geological processes that can result in intraplate volcanoes and determine the role of the mantle’s transition zone in the evolution of our planet.”

In addition to Gazel, Mazza, Bizimis and Moucha, co-authors of “Sampling the Volatile-Rich Transition Zone Beneath Bermuda,” are Paul Béguelin, University of South Carolina; Elizabeth A. Johnson, James Madison University; Ryan J. McAleer, United States Geological Survey; and Alexander V. Sobolev, the Russian Academy of Sciences.

The National Science Foundation provided funding for this research.

Reference:
Sarah E. Mazza, Esteban Gazel, Michael Bizimis, Robert Moucha, Paul Béguelin, Elizabeth A. Johnson, Ryan J. McAleer, Alexander V. Sobolev. Sampling the volatile-rich transition zone beneath Bermuda. Nature, 2019; 569 (7756): 398 DOI: 10.1038/s41586-019-1183-6

Note: The above post is reprinted from materials provided by Cornell University. Original written by Blaine Friedlander.

Related Articles