Home Blog Page 3

Metabolic analyses of animal fossils help scientists reconstruct million-year-old environments

Antelope bone fragment in rock from the 3-million-year-old early human site, Makapansgaat (South Africa). Its bone marrow cavity is filled with a white carbonate-rich precipitate. Paleometabolomics can describe the well-being of that animal and provide ultrafine-scale reconstructions of its paleoecology. Credit: Timothy Bromage and Bin Hu, NYU College of Dentistry

For the first time, scientists have analyzed metabolism-related molecules from the fossilized bones of animals that lived 1.3 to 3 million years ago, revealing insights about both the animals and their environments.

The metabolic clues about the animals’ health and diets enabled researchers to paint a picture of their living conditions, including the temperature, soil, rainfall, and vegetation.

Their findings, published in Nature, reveal warmer and wetter conditions across these environments compared to today.

Studying metabolites—the molecules produced and used in digestion and other chemical processes in the body—can provide information about health and disease, as well as external factors like diet and environmental exposures.

While metabolomic research is increasingly used in studying human diseases and drugs, few scientists have explored its use in understanding the prehistoric world. Instead, they largely focus on DNA in fossils, which is primarily used for establishing genetic relationships.

“I’ve always had an interest in metabolism, including the metabolic rate of bone, and wanted to know if it would be possible to apply metabolomics to fossils to study early life. It turns out that bone, including fossilized bone, is filled with metabolites,” said Timothy Bromage, professor of molecular pathobiology at NYU College of Dentistry and affiliated professor in NYU’s Department of Anthropology, who led this study with an international team of researchers.

Measuring metabolites

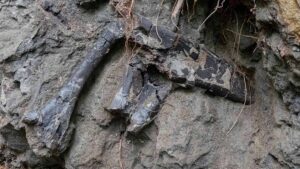
In recent years, paleontologists learned that collagen—the protein that provides structure to bones, skin, and connective tissues—can be preserved in ancient bones, including those of dinosaurs.

“I thought, if collagen is preserved in a fossil bone, then maybe other biomolecules are protected in the bone microenvironment as well,” said Bromage, who directs the Hard Tissue Research Unit at NYU College of Dentistry.

The surfaces of bones are spongy and surrounded by capillary networks, exchanging oxygen and nutrients between the bloodstream and bones. Bromage suspected that, during the process of bone formation, metabolites carried in the bloodstream enter and become trapped in tiny niches in bone.

To test this idea, the researchers employed mass spectrometry, an analytical technique that converts molecules into ions, to see if they could extract metabolites from bone. Using present-day mouse bones, they identified nearly 2,200 metabolites for analysis. The technology also analyzed proteins to detect collagen in some bone samples.

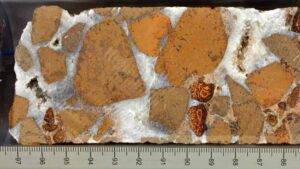
The researchers then turned to animal fossils from 1.3 million to 3 million years ago, collected for prior paleontological research at sites in Tanzania, Malawi, and South Africa where early humans lived.

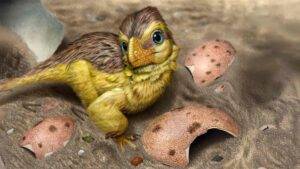
Focusing on species with living counterparts near these sites today, they used the same analytical methods on fossilized bone fragments from rodents (mouse, ground squirrel, gerbil), as well as an antelope, pig, and elephant.

The analyses yielded thousands of metabolites, many of which were shared with modern-day animals.

The stories fossils tell

Many of the metabolites the researchers found in the fossilized bones represent normal biological functions, including the metabolism of amino acids, carbohydrates, and vitamins and minerals. Several pointed to genes associated with estrogen, suggesting that some of the animals were female.

Other metabolites revealed the animals’ response to disease. Notably, in the bone of a 1.8-million-year-old ground squirrel from the Olduvai Gorge in Tanzania, the researchers found evidence that the squirrel was infected with a parasitic disease known as sleeping sickness in humans, caused by the Trypanosoma brucei parasite and transmitted by the tsetse fly.

“What we discovered in the bone of the squirrel is a metabolite that is unique to the biology of that parasite, which releases the metabolite into the bloodstream of its host. We also saw the squirrel’s metabolomic anti-inflammatory response, presumably due to the parasite,” said Bromage.

The researchers could also deduce what plants the animals ate. While data on plant metabolites are much more limited than those documented in human and animal health, they identified the metabolites of several regionally specific plants, including forms of aloe and asparagus.

“What that means is that, in the case of the squirrel, it nibbled on aloe and took those metabolites into its own bloodstream,” explained Bromage.

“Because the environmental conditions of aloe are very specific, we now know more about the temperature, rainfall, soil conditions, and tree canopy, essentially reconstructing the squirrel’s environment. We can build a story around each of the animals.”

The reconstructed environments corroborate what other research has found about these settings millions of years ago—for instance, that the Olduvai Gorge Bed in Tanzania was freshwater woodland and grassland, while the Olduvai Gorge Upper Bed was dry woodland and marsh. Across all of the sites studied, the conditions in which the animals lived were wetter and warmer than the regions are today.

“Using metabolic analyses to study fossils may enable us to reconstruct the environment of the prehistoric world with a new level of detail, as though we were field ecologists in a natural environment today,” said Bromage.

Reference:
Timothy Bromage, Palaeometabolomes yield biologic and ecologic profiles at early human sites, Nature (2025). DOI: 10.1038/s41586-025-09843-w.

Note: The above post is reprinted from materials provided by New York University.

A photographer finds thousands of dinosaur footprints near Italian Winter Olympic venue

In this photograph taken in September 2025 and released Tuesday, Dec. 16, 2025, by Stelvio National Park, Carabinieri officer Giacomo Regazzoni, left, and park employee Elia Vitalini inspect Late Triassic prosauropod footprints discovered in the Fraele Valley in northern Italy. Credit: Elio Della Ferrara/Stelvio National Park via AP

A wildlife photographer stumbled upon one of the oldest and largest known collections of dinosaur footprints, dating back about 210 million years to the Triassic Period, high in an Italian national park near the 2026 Milan Cortina Winter Olympic venue of Bormio, officials announced Tuesday.

The discovery in the Stelvio National Park was striking for the sheer number of footprints, estimated at as many as 20,000 over some five kilometers (three miles), and the location near the Swiss border, once a prehistoric coastal area, that has never previously yielded dinosaur tracks, experts said.

“This time reality really surpasses fantasy,” said Cristiano Dal Sasso, a paleontologist at Milan’s Natural History Museum, who received the first call from wildlife photographer Elio Della Ferrera after making the discovery.

The dinosaur prints are believed to have been made by long-necked bipedal herbivores that were up to 10 meters (33 feet) long, weighing up to four tons, similar to a Plateosaurus, Dal Sasso said. Some of the tracks were 40 centimeters wide, with visible claws.

The footprints indicated that the dinosaurs traveled in packs and they sometimes stopped in circular formations, possibly as a protective measure.

“There are very obvious traces of individuals that have walked at a slow, calm, quiet rhythmic pace, without running,” Dal Sasso told a press conference.

The tracks were discovered by Della Ferrera, who set out to photograph deer and vultures in September when his camera was trained on a vertical wall about 600 meters (nearly 2,000 feet) above the nearest road.

The location, some 2,400 to 2,800 meters (7,900-9,200 feet) above sea level on a north-facing wall that is mostly in the shade, made the footprints, though in plain sight, particularly hard to spot without a very strong lens, Dal Sasso said.

Della Ferra said something strange caught his eye, and he scaled a vertical rock wall with some difficulty to get a closer look.

“The huge surprise was not so much in discovering the footprints, but in discovering such a huge quantity,” Della Ferrara said. “There are really tens of thousands of prints up there, more or less well-preserved.”

The entrance of the park, where the prints were discovered, is located just two kilometers (a mile) from the mountain town of Bormio, where Men’s Alpine skiing will be held during the Feb. 6-22 Games.

Lombardy regional governor, Attilio Fontana, hailed the discovery as a “gift for the Olympics,” even if the site is too remote to access in the winter, and plans for eventual public access have not been made.

Note: The above post is reprinted from materials provided by The Associated Press. All rights reserved.

Giant sea monsters lived in rivers at the end of the dinosaur age

The Hell Creek Mosasaur. Credit: Christopher DiPiazza

Mosasaurs were enormous marine reptiles that lived more than 66 million years ago, but new evidence shows they did not spend all their time in the ocean. Researchers analyzing a mosasaur tooth discovered in North Dakota have found strong signs that some of these animals lived in rivers. The tooth likely came from an individual that grew up to 11 meters long. Led by scientists at Uppsala University, the international research team concluded that mosasaurs adapted to freshwater river systems during the final million years before their extinction.

The tooth was uncovered in 2022 from a river deposit in North Dakota. It was found alongside a tooth from a Tyrannosaurus rex and a jawbone from a crocodylian, in a region already known for fossils of the duck-billed dinosaur Edmontosaurus. The unusual mix of land dinosaurs, river-dwelling crocodiles, and a giant marine reptile immediately stood out. If mosasaurs were ocean animals, how did one of their teeth end up preserved in a river?

Isotopes Provide the Answer

To solve this puzzle, researchers from the United States, Sweden, and the Netherlands examined the chemical makeup of the mosasaur tooth enamel using isotope analysis.

Because the mosasaur tooth, the T. rex tooth, and the crocodylian jawbone all date to roughly the same time, about 66 million years ago, the scientists could directly compare their chemistry. The work was carried out at the Vrije Universiteit (VU) in Amsterdam and focused on isotopes of oxygen, strontium, and carbon. The mosasaur tooth contained unusually high levels of the lighter oxygen isotope (16O), which is typical of freshwater environments rather than marine ones. Strontium isotope ratios also pointed to a freshwater habitat.

“Carbon isotopes in teeth generally reflect what the animal ate. Many mosasaurs have low 13C values because they dive deep. The mosasaur tooth found with the T. rex tooth, on the other hand, has a higher 13C value than all known mosasaurs, dinosaurs and crocodiles, suggesting that it did not dive deep and may sometimes have fed on drowned dinosaurs,” says Melanie During, one of the study’s corresponding authors.

“The isotope signatures indicated that this mosasaur had inhabited this freshwater riverine environment. When we looked at two additional mosasaur teeth found at nearby, slightly older, sites in North Dakota, we saw similar freshwater signatures. These analyses shows that mosasaurs lived in riverine environments in the final million years before going extinct,” says During.

When Seas Slowly Turned Into Rivers

The findings also help explain how this lifestyle shift became possible. Over time, increasing amounts of freshwater flowed into the Western Interior Seaway, a vast inland sea that once ran north to south across what is now central North America and split the continent in two. As freshwater input grew, the seaway gradually changed from salty to brackish and eventually to mostly freshwater, similar to conditions seen today in the Gulf of Bothnia. The researchers suggest this process created a ‘halocline’, with lighter freshwater forming a surface layer above denser saltwater. Isotope data supports this idea.

“For comparison with the mosasaur teeth, we also measured fossils from other marine animals and found a clear difference. All gill-breathing animals had isotope signatures linking them to brackish or salty water, while all lung-breathing animals lacked such signatures. This shows that mosasaurs, which needed to come to the surface to breathe, inhabited the upper freshwater layer and not the lower layer where the water was more saline,” says Per Ahlberg, coauthor of the study and promotor of Dr. During.

Adapting to a Changing World

The researchers argue that the teeth studied clearly belonged to mosasaurs that had adjusted to these new conditions. Large predators shifting between habitats is not unheard of in evolutionary history.

“Unlike the complex adaptation required to move from freshwater to marine habitats, the reverse adaptation is generally simpler,” says During.

Modern animals show similar flexibility. River dolphins live entirely in freshwater even though their ancestors were marine. The estuarine crocodile, known in Australia as the saltwater crocodile, regularly moves between rivers and the open ocean, hunting wherever prey is available.

A Bus-Sized Predator in Unexpected Places

Mosasaur fossils are common in marine deposits across North America, Europe, and Africa dating from 98-66 million years ago. In contrast, they are rarely found in North Dakota, making this discovery especially striking. The size of the tooth suggests an animal up to 11 meters long, roughly the length of a bus. Earlier discoveries of mosasaur bones at a nearby site support this estimate. The tooth likely belonged to a prognathodontine mosasaur, although its exact genus cannot be identified. Close relatives in the genus Prognathodon had massive heads, powerful jaws, and robust teeth, and are thought to have been opportunistic predators capable of attacking large prey.

“The size means that the animal would rival the largest killer whales, making it an extraordinary predator to encounter in riverine environments not previously associated with such giant marine reptiles,” says Ahlberg.

The research was carried out by scientists from Uppsala University in collaboration with Eastern West Virginia Community and Technical College, Moorefield, West Virginia, Vrije Universiteit Amsterdam, and the North Dakota Geological Survey. The article draws on a chapter from Melanie During’s doctoral thesis, which she defended at Uppsala University in November 2024.

Reference:
Melanie A. D. During, Nathan E. Van Vranken, Clint A. Boyd, Per E. Ahlberg, Suzan J. A. Warmerdam-Verdegaal, Jeroen H. J. L. Van der Lubbe. “King of the Riverside”, a multi-proxy approach offers a new perspective on mosasaurs before their extinction. BMC Zoology, 2025; 10 (1) DOI: 10.1186/s40850-025-00246-y

Note: The above post is reprinted from materials provided by Uppsala University.

Fossil brain scans show pterosaurs evolved flight in a flash

Reconstruction of a Late Triassic landscape (approximately 215 million years ago). A lagerpetid, a close relative of pterosaurs, is perched on a rock, observing pterosaurs flying overhead. Credit: Matheus Fernandes, edited

A research group led by an evolutionary biologist at Johns Hopkins Medicine reports that giant reptiles living as far back as 220 million years ago may have developed the ability to fly at the very start of their evolutionary history. This contrasts with the ancestors of modern birds, which are thought to have reached powered flight more slowly and with larger, more complex brains.

Details of the investigation, which relied on advanced imaging methods to examine the internal brain cavities of pterosaur fossils and received partial support from the National Science Foundation, appeared Nov. 26 in Current Biology.

According to Matteo Fabbri, Ph.D., assistant professor of functional anatomy and evolution at the Johns Hopkins University School of Medicine, the results strengthen the idea that the enlarged brains seen in birds and likely in their ancestors were not responsible for allowing pterosaurs to take to the air.

“Our study shows that pterosaurs evolved flight early on in their existence and that they did so with a smaller brain similar to true non-flying dinosaurs,” Fabbri says.

Giant Fliers With Surprising Brain Structure

Fabbri describes pterosaurs as powerful airborne predators of the dinosaur era, capable of reaching 500 pounds in some species and stretching up to 30 feet across the wings. Pterosaurs are recognized as the earliest of the three major vertebrate lineages (in addition to birds and bats) that eventually achieved powered flight on their own.

To investigate how pterosaurs gained this ability and whether their path differed from that of birds and bats, the team examined the reptile’s evolutionary history. They looked closely at shifts in the shape and size of the brain over time and focused on the optic lobe, the region involved in vision that has been linked to flight capabilities.

CT Scans Reveal Clues From Early Relatives

Using CT imaging and specialized software that allowed them to digitally model fossilized nervous system structures, the researchers concentrated on the closest known relative of the pterosaur. This animal, the flightless and tree-climbing lagerpetid, was first identified by scientists in 2016 and lived during the Triassic period between 242 and 212 million years ago. In 2020, another team confirmed the lagerpetid’s close evolutionary connection to pterosaurs.

“The lagerpetid’s brain already showed features linked to improved vision, including an enlarged optic lobe, an adaptation that may have later helped their pterosaur relatives take to the skies,” says corresponding author Mario Bronzati, a researcher at University of Tübingen, Germany.

Fabbri notes that pterosaurs also had enlarged optic lobes. Outside of this trait, however, he explains that their brain shape and size differed considerably from those of the lagerpetid.

“The few similarities suggest that flying pterosaurs, which appeared very soon after the lagerpetid, likely acquired flight in a burst at their origin,” Fabbri says. “Essentially, pterosaur brains quickly transformed acquiring all they needed to take flight from the beginning.”

Comparing Pterosaur and Bird Flight

In contrast, modern birds are thought to have evolved flight through a more gradual process. They appear to have inherited several key traits, including expansion of the cerebrum, cerebellum and optic lobes, from earlier relatives before further adapting these regions for flight, Fabbri says. Support for this gradual model comes from 2024 research from the laboratory of Amy Balanoff, Ph.D., assistant professor of functional anatomy and evolution at Johns Hopkins Medicine, which highlights the importance of cerebellum expansion in the origins of bird flight. The cerebellum is located at the back of the brain and helps regulate muscle coordination and other functions.

“Any information that can fill in the gaps of what we don’t know about dinosaur and bird brains is important in understanding flight and neurosensory evolution within pterosaur and bird lineages,” Balanoff says.

Insights From Fossilized Brains Across Species

The team also examined brain cavities from crococdylians (crocodile ancestors) and early, extinct birds, comparing these structures with those of pterosaurs.

Their analysis showed that pterosaurs had moderately enlarged brain hemispheres, a feature comparable to other dinosaur groups. These include two-legged, bird-like troodontids that lived between the Late Jurassic and Late Cretaceous periods from 163 to 66 million years ago, as well as Archaeopteryx lithographica, the oldest-known bird that lived between 150.8 and 125.45 million years ago. These prehistoric species differ strongly from modern birds, which have significantly larger brain cavities.

Looking Ahead to Future Research

Fabbri says that future progress will depend on understanding how the brain’s internal structure, not just its size and shape, enabled pterosaurs to achieve flight. He explains that this will be essential for uncovering the broader biological principles that govern the evolution of flight.

Funding support for this research was provided by the Alexander von Humboldt Foundation, Brazilian Federal Government, The Paleontological Society, Agencia Nacional de Promoción Científica y Técnica, Conselho Nacional de Desenvolvimento Científico e Tecnológico, the European Union NextGeneration EU/PRTR, the National Science Foundation ( NSF DEB 1754596, NSF IOB-0517257, IOS-1050154, IOS-1456503), and the Swedish Research Council

In addition to Fabbri and Bronzati, other scientists who contributed to this research are Akinobu Watanabe from New York Institute of Technology, Roger Benson from the American Museum of Natural History, Rodrigo Müller from Federal University of Santa Maria, Brazil, Lawrence Witmer from the University of Ohio, Martín Ezcurra and M. Belén von Baczko from Bernardino Rivadavia Museum of Natural Science, Felipe Montefeltro from São Paulo State University; Bhart-Anjan Bhullar from Yale University; Julia Desojo from Universidad Nacional de La Plata, Argentina; Fabien Knoll from Museo Nacional de Ciencias Naturales, Spain; Max Langer from Universidade de São Paulo, Brazil; Stephan Lautenschlager from University of Birmingham; Michelle Stocker and Sterling Nesbitt from from Virginia Tech; Alan Turner from Stony Brook University; and Ingmar Werneburg from Eberhard Karls University of Tübingen.

Reference:
Mario Bronzati, Akinobu Watanabe, Roger B.J. Benson, Rodrigo T. Müller, Lawrence M. Witmer, Martín D. Ezcurra, Felipe C. Montefeltro, M. Belén von Baczko, Bhart-Anjan S. Bhullar, Julia B. Desojo, Fabien Knoll, Max C. Langer, Stephan Lautenschlager, Michelle R. Stocker, Alan H. Turner, Ingmar Werneburg, Sterling J. Nesbitt, Matteo Fabbri. Neuroanatomical convergence between pterosaurs and non-avian paravians in the evolution of flight. Current Biology, 2025; DOI: 10.1016/j.cub.2025.10.086

Note: The above post is reprinted from materials provided by Johns Hopkins Medicine.

This rare bone finally settles the Nanotyrannus mystery

A Late Cretaceous face-off between an adult Nanotyrannus (left) and two juvenile T. rex, with a sub-adult T. rex watching from a distance. The scene evokes a preface to the NHMLAC’s famous T. rex trio on display in the Jane G. Pisano Dinosaur Hall. Credit: Jorge Gonzalez

For many years, paleontologists have debated whether the single skull used to define the species Nanotyrannus represented a true species or simply a young Tyrannosaurus rex. A new study in Science has now resolved this question. The research shows that Nanotyrannus was nearly fully grown and not a juvenile T. rex, while also offering new clues about how large tyrannosaur species achieved rapid growth.

A collaborative team that included Dinosaur Institute Postdoctoral Fellow Dr. Zach Morris studied the disputed Nanotyrannus holotype — the specimen originally used to identify the species — with a close focus on its throat bone. By investigating the microscopic details of this bone and comparing them with those of modern birds, crocodilians, and other dinosaurs — including specimens from the Dino Hall’s T. rex growth series — the group confirmed that Nanotyrannus was a mature and separate predator. Although smaller than an adult T. rex, it was still a full-grown animal that lived in a far more diverse Late Cretaceous ecosystem than previously thought. Measuring under half the size of an adult T. rex, Nanotyrannus likely competed with young T. rex individuals for the same prey.

“The identity of the holotype specimen was the key piece in this debate. Discovering that this small skull was actually fully grown shows definitively that it is different from Tyrannosaurus rex,” said Dr. Christopher Griffin, lead author and Assistant Professor of Geosciences at Princeton University.

How Bone Structure Reveals Age and Growth

Just as tree rings can indicate a tree’s age, thin slices taken from dinosaur bones can reveal how old an animal was and how quickly it grew. Scientists study microscopic tissue patterns within these bone samples to determine maturity. Long bones such as ribs or femora are typically used, but they are not always preserved. In the case of Nanotyrannus, most of the holotype consists of skull material filled with sinuses and other irregular features that make it unsuitable for this type of study. The hyoid, however — the throat bone that supports the tongue — offered a rare opportunity to assess maturity in a skull-dominated specimen.

“When we started this project, it was unclear whether the hyoid preserved a record of a dinosaur’s growth. To be honest, we mostly accepted the hypothesis that Nanotyrannus was a juvenile T. rex, so we expected the microscopic bone structure or histology of the holotype would show this animal was still growing quickly,” said co-author Dr. Morris. “What we did not expect was to see it was nearing maturity with clear evidence of the cessation of growth!”

Testing the Throat Bone as a New Tool for Dinosaur Aging

Because no one had previously proven that hyoid bones could reliably preserve growth information, the researchers needed to verify the method before applying it to Nanotyrannus. To do so, Dr. Griffin assembled a team to create a broad comparative dataset of hyoid samples from living lizards, crocodiles, birds, and extinct dinosaurs. “To show that hyoid microstructure would work to test maturity status in Nanotyrannus, we first had to compile strong support for this method across many groups of living reptiles and extinct dinosaurs,” said Dr. Griffin.

Dr. Morris led the work on the juvenile and sub-adult specimens known as “Thomas” from NHM’s rare T. rex growth series. “The growth series in our Dino Hall was critical to demonstrating that the hyoid in Tyrannosaurus showed the same kind of growth record as long bones,” Morris explained. “Having a growth series that had already been histologically analyzed meant that we could compare the growth record in the hyoid and the growth record in the long bones and see that they show consistent signals even in these uniquely giant predators.” This comparison allowed the researchers to set clear benchmarks for distinguishing growth differences between T. rex and Nanotyrannus.

“Our teenage Tyrannosaurus looks immature in both its limbs and its hyoid, while Thomas looks like a more mature, but still not quite adult animal. Amusingly enough, Thomas is not nearly as mature as the Nanotyrannus holotype, despite being much larger,” added Morris.

Balancing Conservation, Discovery, and Scientific Accuracy

The findings emphasize how important it is for paleontologists to understand the maturity of holotype specimens. Without this knowledge, scientists risk mistaking growth-related changes for evolutionary ones. “So many techniques in modern paleontology require some degree of destructive analysis, and as a Curator, I’m always trying to strike a balance between conservation and discovery. We preserved the anatomical data by 3D scanning and molding and casting the hyoid, and there is still more of it for future analyses,” said senior author Dr. Caitlin Colleary of the Cleveland Museum of Natural History (and incidentally, a former undergraduate volunteer in the NHM Dinosaur Institute). “In this instance, it was totally worth it because we gained so much more than we lost.”

The new evidence also reshapes the view of Late Cretaceous North America. Instead of T. rex ruling alone before the end-Cretaceous mass extinction, the region appears to have hosted multiple tyrannosaur species at the same time. “It is remarkable that our study matches findings from other independent lines of evidence, including an analysis published last month, demonstrating that multiple species of tyrannosaurs lived alongside one another. It shows that we need to re-evaluate what we think these ecosystems looked like,” said Dr. Morris.

Expanding Knowledge Through Museum Collections and Collaborative Research

Dr. Morris serves as the first Dinosaur Institute Postdoctoral Fellow, focusing on how developmental processes shape evolutionary changes and how skull anatomy shifts over time in the fossil record. “I am fascinated by the ways in which changes during development give rise to the skeletal features which distinguish dinosaurs, birds, crocodylians, and other vertebrates,” said Morris. “This project was an exciting collaboration to study developmental patterns in the fossil record directly.”

“Zach’s expertise in dinosaur growth and development, coupled with his histological skills, was a huge asset to this project. It’s another example of our NHMLAC Post-Docs conducting novel, ground-breaking research,” said Dr. Nate Smith, Gretchen Augustyn Director & Curator of the Dinosaur Institute. “This study also highlights the incredible potential of unique museum collections like our T. rex growth series, which not only inform the public but also provide rich ground for new scientific discoveries.”

Reference:
Christopher T. Griffin, Jeb Bugos, Ashley W. Poust, Zachary S. Morris, Riley S. Sombathy, Michael D. D’Emic, Patrick M. O’Connor, Holger Petermann, Matteo Fabbri, Caitlin Colleary. A diminutive tyrannosaur lived alongside Tyrannosaurus rex. Science, 2025; DOI: 10.1126/science.adx8706

Note: The above post is reprinted from materials provided by Natural History Museum of Los Angeles County.

Dinosaur bones found almost on top of each other in Transylvania

The bones were lying almost on top of each other in the layer. Credit: ELTE Eötvös Loránd University

The Hațeg Basin in Transylvania has long been known around the world for its dinosaur fossils, uncovered at dozens of sites over the last hundred years. Even so, complete dinosaur discoveries are usually uncommon across the region. That pattern changed with the identification of a newly studied site where scientists documented more than 100 vertebrate fossils per square meter, including large dinosaur bones lying almost directly on top of one another.

Years of Fieldwork Lead to an Exceptional Fossil Find

For more than five years, the Valiora Dinosaur Research Group, made up of Hungarian and Romanian paleontologists, has been carrying out fieldwork in the western Hațeg Basin. The rocks examined there date back to the Upper Cretaceous and capture the final few million years before dinosaurs disappeared. Excavations have revealed fossil-rich deposits containing thousands of remains from amphibians, turtles, crocodiles, dinosaurs, pterosaurs, and mammals.

Among all the sites explored, one location known as K2 stands out. From an area measuring less than five square meters, researchers recovered more than 800 vertebrate fossils, making it the richest site documented so far. The full scientific analysis of this discovery was recently published in the journal PLOS ONE.

A Defining Moment in the Field

“In 2019, during our first field survey in the Hațeg Basin, we almost immediately came across the K2 site. It was a defining moment for us — we instantly noticed dozens of large, exceptionally well-preserved black dinosaur bones gleaming in the grey clay layers exposed in the streambed. We immediately began our work, and through several years of excavation we collected an extraordinarily rich vertebrate assemblage from the site,” explained Gábor Botfalvai, assistant professor at the Department of Paleontology, Eötvös Loránd University, and leader of the research group.

How Ancient Floods Created a Bone-Rich Landscape

About 72 million years ago, the region that is now the Hațeg Basin experienced a warm, subtropical climate shaped by temporary river systems. These rivers flowed from higher terrain toward the basin and frequently spilled over their banks during heavy rainfall. As floodwaters surged downstream, they gathered animal carcasses from the surface, along with living creatures and skeletal remains caught in their path.

“Detailed study of the rocks at the K2 site indicates that a small lake once existed here, which was periodically fed by flash floods carrying animal carcasses. As the flow of the rivers slowed rapidly upon entering the lake, the transported bodies accumulated in the deltaic environment along the shore, producing this exceptionally high bone concentration,” said Soma Budai, researcher at the University of Pavia and co-author of the publication.

Rare Dinosaur Skeletons Reveal New Scientific Insights

The K2 site produced far more than scattered bones. Researchers also identified several partial dinosaur skeletons that remained associated with one another. These fossils represent two separate plant-eating dinosaur species. One group belongs to a roughly two-meter-long dinosaur from the Rhabdodontidae family, a species commonly found in the Hațeg Basin that likely moved mainly on two legs.

The second group of skeletons marks a major breakthrough. These remains belong to a titanosaurian sauropod, a long-necked dinosaur for which no comparably well-preserved skeletons had ever been discovered in Transylvania. Ongoing analysis of these fossils is expected to improve scientists’ understanding of how this dinosaur fits into the broader evolutionary family tree.

The Oldest Known Vertebrate Accumulation in the Basin

“Besides the remarkably high bone concentration, another key significance of this newly described site is that it represents the oldest known vertebrate accumulation in the Hațeg Basin. Studying this fossil assemblage allows us to look into the earliest composition of the Hațeg dinosaur fauna and trace the evolutionary directions and processes leading toward the dinosaurs known from younger Transylvanian sites — revealing how these Late Cretaceous ecosystems were similar or different from one another,” added Zoltán Csiki-Sava, associate professor at the University of Bucharest and Romanian leader of the research team.

Reconstructing Dinosaur Life in Ancient Europe

The fossils described in this study, together with discoveries still emerging from ongoing excavations in the Hațeg Basin, are helping scientists refine their understanding of how dinosaur communities evolved across (Eastern) Europe during the Late Cretaceous. These finds provide valuable clues about how ancient ecosystems formed, changed, and responded to environmental forces near the end of the age of dinosaurs.

The research was supported by the National Research, Development and Innovation Office of Hungary (NKFIH), the Supervisory Authority for Regulatory Affairs of Hungary, the Romanian Ministry of Research, Innovation and Digitalization, and the University of Bucharest.

Reference:
Gábor Botfalvai, Zoltán Csiki-Sava, János Magyar, Barna Páll-Gergely, Levente Koczó, Daniel Ţabără, Gergő Konecsni, Soma Budai. Paleontological and paleoecological significance of the oldest highly productive Upper Cretaceous (lowermost Maastrichtian) bonebed of Haţeg Basin (western Romania; Densuş-Ciula Formation). PLOS One, 2025; 20 (11): e0335893 DOI: 10.1371/journal.pone.0335893

Note: The above post is reprinted from materials provided by Eötvös Loránd University.

Scientists found a hidden clock inside dinosaur eggshells

Artistic reconstruction of a newly hatched troodontid-like dinosaur resting among fragments of its eggshell (loosely based on Mongolian microtroodontid-type). These eggshells, when buried within ancient soil, interacted with meteoric waters, leading to early uranium incorporation into the eggshell calcite crystals. Credit: Eva Utsukiyouhei (宇津城遥平)

A global team of geologists and paleontologists has developed a new technique that makes it possible to accurately determine the age of fossil-bearing rocks by directly analyzing fossilized dinosaur eggshells. This approach offers a reliable alternative to methods that depend on surrounding materials that may not always be present.

The research was led by Dr. Ryan Tucker of Stellenbosch University’s Department of Earth Sciences and published in the journal Communications Earth & Environment.

Why Fossil Dating Has Been So Difficult

Many fossil sites around the world lack precise age estimates. When scientists do not know exactly when fossils formed, it becomes much harder to understand how ancient species and ecosystems evolved and interacted over time. Traditional dating methods usually rely on minerals like zircon or apatite found near fossils, but these minerals are not consistently available at every site. Efforts to directly date fossil remains such as bones or teeth have often resulted in unreliable or inconsistent ages.

Instead of focusing on surrounding minerals or skeletal remains, Dr. Tucker and his colleagues turned their attention to fossilized dinosaur eggshells. Using advanced uranium-lead (U-Pb) dating combined with detailed elemental mapping, the team measured extremely small amounts of uranium and lead locked inside the calcite structure of the eggshells. These radioactive elements decay at known rates, effectively acting as a built-in clock that reveals when the eggs were buried.

Testing the Method in Utah and Mongolia

The researchers tested their approach on dinosaur eggshells from Utah (USA) and the Gobi Desert (Mongolia). The results showed that the eggshells could be dated with an accuracy of about five percent when compared with ages determined from volcanic ash layers. In Mongolia, the team achieved a major milestone by establishing the first direct age for a famous site containing dinosaur eggs and nests, placing it at roughly 75 million years old.

“Eggshell calcite is remarkably versatile,” says Dr. Tucker. “It gives us a new way to date fossil sites where volcanic layers are missing, a challenge that has limited paleontology for decades.”

The project brought together scientists from the North Carolina Museum of Natural Sciences, North Carolina State University, Colorado School of Mines, the Mongolian Academy of Sciences’ Institute of Paleontology, and Universidade Federal de Ouro Preto (Brazil). Fieldwork in Mongolia was conducted through the Mongolian Alliance for Dinosaur Exploration (MADEx), with support from the National Geographic Society and the National Science Foundation.

A Powerful Tool for Understanding Dinosaur Evolution

By demonstrating that dinosaur eggshells can reliably record geologic time, the study creates a new connection between biology and Earth science and provides researchers with a valuable tool for dating fossil sites worldwide.

“Direct dating of fossils is a paleontologist’s dream,” says study co-author Lindsay Zanno, associate research professor at North Carolina State University and head of paleontology at the North Carolina Museum of Natural Sciences. “Armed with this new technique, we can unravel mysteries about dinosaur evolution that used to be insurmountable.”

The article “U-Pb calcite age dating of fossil eggshell as an accurate deep time geochronometer” was published in Communications Earth & Environment.

Reference:
Ryan T. Tucker, Kira E. Venter, Cristiano Lana, Eric M. Roberts, Tsogtbaatar Chinzorig, Khishigjav Tsogtbaatar, Lindsay E. Zanno. U-Pb calcite age dating of fossil eggshell as an accurate deep time geochronometer. Communications Earth, 2025; 6 (1) DOI: 10.1038/s43247-025-02895-w

Note: The above post is reprinted from materials provided by Stellenbosch University.

Ancient oceans were ruled by super predators unlike anything today

Image by Artwork by Guillermo Torres, Hace Tiempo, Instituto von Humboldt. Illustration of some of the apex predators in the Paja Formation biota with a human for scale.

Around 130 million years ago, the ocean’s most dominant hunters held far more power than any marine predator alive today. Recent research from McGill University reveals that during the Cretaceous period, some sea creatures sat at the very top of an extraordinarily complex food chain, surpassing modern standards of ecological dominance.

The findings come from a study published in the Zoological Journal of the Linnean Society, which reconstructs the ancient marine ecosystem preserved in Colombia’s Paja Formation. According to the research, this prehistoric sea was filled with enormous marine reptiles, some growing longer than 10 meters, that occupied a previously unseen seventh level of the food chain.

What Trophic Levels Reveal About Food Chains

Trophic levels describe an organism’s position in a food chain based on how it gets energy and nutrients. Put simply, they explain who eats whom within an ecosystem. In today’s oceans, food chains typically reach only six levels, with animals such as killer whales and great white sharks sitting at the top.

The discovery of predators operating at a seventh trophic level highlights just how rich and complex the Paja ecosystem once was. It also offers rare insight into a deep evolutionary struggle, where predators and prey continuously adapted in response to one another.

Reconstructing a Lost Marine Ecosystem

To uncover this ancient food web, McGill researchers analyzed all known animal fossils from a single geological formation in central Colombia. They built a detailed ecological network using fossil body sizes, feeding traits, and comparisons with modern animals that fill similar roles today.

To ensure accuracy, the team compared their reconstructed network with one of the most comprehensive modern marine ecosystem models available, based on living Caribbean environments. This allowed them to test whether their ancient model behaved realistically when measured against present-day ocean systems.

A Time of Explosive Marine Diversity

The Paja Formation dates back to the Mesozoic era, a time that included the Cretaceous period and was shaped by rising sea levels and warmer global temperatures. These conditions fueled a surge in marine biodiversity. The region supported plesiosaurs, ichthyosaurs, and large numbers of invertebrates, creating one of the most intricate marine food webs ever identified.

“Our study is the first to examine these possible ecological interactions,” said Dirley Cortés, lead author and doctoral student in the Department of Biology. “Understanding this complexity helps us trace how ecosystems evolve over time, shedding light on the structures that support today’s biodiversity.”

“These findings illuminate how marine ecosystems developed through intense trophic competition and shaped the diversity we see today,” added Hans Larsson, co-author of the study and Professor in the Department of Biology.

Why This Discovery Matters

The researchers note that this work marks only an early step in understanding ancient marine ecosystems. Very few fossil sites have been studied in enough detail to rebuild entire food webs. As more discoveries emerge, scientists will be able to compare ecosystems across different regions and time periods, deepening knowledge of how ancient oceans influenced the modern seas we depend on today.

“Top of the food chains: an ecological network of the marine Paja Formation biota from the Early Cretaceous of Colombia reveals the highest trophic levels ever estimated” by Dirley Cortés and Hans Larsson, was published in the Zoological Journal of the Linnean Society.

The research was supported by funding from the McGill-STRI Neotropical Environment Option (NEO) and the Natural Sciences and Engineering Research Council of Canada (NSERC).

Reference:
Dirley Cortés, Hans C E Larsson. Top of the food chains: an ecological network of the marine Paja Formation biota from the Early Cretaceous of Colombia reveals the highest trophic levels ever estimated. Zoological Journal of the Linnean Society, 2024; 202 (1) DOI: 10.1093/zoolinnean/zlad092

Note: The above post is reprinted from materials provided by McGill University.

1.5-million-year-old fossil face is forcing a rethink of human origins

Map showing potential migration routes of the human ancestor, Homo erectus, in Africa, Europe, and Asia during the early Pleistocene. Key fossils of Homo erectus and the earlier Homo habilis species are shown, including the new face reconstruction of the DAN5 fossil from Gona, Ethiopia dated to 1.5 million years ago. Credit: Dr. Karen L. Baab. Scans provided by National Museum of Ethiopia, National Museums of Kenya and Georgian National Museum

An international research team led by Dr. Karen Baab, a paleoanthropologist at the College of Graduate Studies, Glendale Campus of Midwestern University in Arizona, created a digital reconstruction of the face of early Homo erectus. The fossil, known as DAN5, is dated to about 1.5 to 1.6 million years old and was discovered at Gona in Ethiopia’s Afar region. The rebuilt face looks more archaic than many scientists expected, offering fresh clues about one of the first human species to expand across Africa and Eurasia. The results were published in Nature Communications.

Dr. Baab says the reconstruction adds a surprising new twist: “We already knew that the DAN5 fossil had a small brain, but this new reconstruction shows that the face is also more primitive than classic African Homo erectus of the same antiquity. One explanation is that the Gona population retained the anatomy of the population that originally migrated out of Africa approximately 300,000 years earlier.”

Gona’s Deep Record of Fossils and Stone Tools

The Gona Paleoanthropological Research Project in Ethiopia’s Afar region is co-directed by Dr. Sileshi Semaw (Centro Nacional de Investigación sobre la Evolución Humana, Spain) and Dr. Michael Rogers (Southern Connecticut State University). The Gona area has produced hominin fossils older than 6.3 million years ago, along with stone tools covering the past 2.6 million years of human evolution.

For this reconstruction, scientists combined a fossil brain case (previously described in 2020) with smaller facial fragments from the same individual, DAN5, dated to between 1.6 and 1.5 million years ago. Using virtual methods, the team reassembled the face fragments (and teeth) to build what they describe as the most complete fossil human skull from the Horn of Africa for this time period. Researchers classify DAN5 as Homo erectus, a long-lasting species found across Africa, Asia, and Europe after about 1.8 million years ago.

How Micro-CT Scans Rebuilt the DAN5 Skull

To piece the fossil together, the team used high-resolution micro-CT scans of four major facial fragments recovered during fieldwork at Gona in 2000. They built 3D digital models from those scans, then carefully aligned and reassembled the fragments on a computer. Where possible, they positioned the teeth into the upper jaw. The final stage involved “attaching” the reconstructed face to the braincase to create a mostly complete cranium. The process took about a year and required multiple rounds of refinement before the team settled on the final reconstruction.

Dr. Baab, who led the reconstruction work, compared it to “a very complicated 3D puzzle, and one where you do not know the exact outcome in advance. Fortunately, we do know how faces fit together in general, so we were not starting from scratch.”

A Mix of Homo erectus Traits and Older Features

The study suggests that the Gona population living around 1.5 million years ago combined traits typically associated with Homo erectus in the braincase with more ancestral features in the face and teeth that are usually linked to earlier species. The researchers point to examples such as a relatively flat bridge of the nose and large molars.

To reach these conclusions, the team compared the size and shape of the DAN5 face and teeth with fossils from the same geological age, as well as specimens that are older and younger. A similar trait combination has been reported before in Eurasia, but DAN5 is described as the first fossil showing this pattern within Africa. That finding challenges the idea that Homo erectus evolved outside Africa. “I’ll never forget the shock I felt when Dr. Baab first showed me the reconstructed face and jaw,” says Dr. Yousuke Kaifu of the University of Tokyo, a co-author of the study.

Dr. Baab argues the broader fossil record still points toward an African origin for the species: “The oldest fossils belonging to Homo erectus are from Africa, and the new fossil reconstruction shows that transitional fossils also existed there, so it makes sense that this species emerged on the African continent. But the DAN5 fossil postdates the initial exit from Africa, so other interpretations are possible.”

Dr. Rogers agrees that the new skull highlights how varied early humans could be. “This newly reconstructed cranium further emphasizes the anatomical diversity seen in early members of our genus, which is only likely to increase with future discoveries.”

Dr. Semaw adds that the fossil is also notable for its archaeological context: “It is remarkable that the DAN5 Homo erectus was making both simple Oldowan stone tools and early Acheulian handaxes, among the earliest evidence for the two stone tool traditions to be found directly associated with a hominin fossil.”

What Comes Next for DAN5 and Early European Fossils

Next, the researchers want to compare DAN5 with some of the earliest known human fossils from Europe. These include remains assigned to Homo erectus as well as Homo antecessor, a distinct species, with both dated to around one million years ago. “Comparing DAN5 to these fossils will not only deepen our understanding of facial variability within Homo erectus but also shed light on how the species adapted and evolved,” says study co-author Dr. Sarah Freidline of the University of Central Florida.

The team also hopes future discoveries will help test other possibilities, including scenarios involving genetic admixture between species, similar to what has been documented much later among Neanderthals, modern humans and “Denisovans.” One idea is that DAN5 could reflect admixture between classic African Homo erectus and the earlier Homo habilis species. As Dr. Rogers puts it, “We’re going to need several more fossils dated between one to two million years ago to sort this out.”

Reference:
Karen L. Baab, Yousuke Kaifu, Sarah E. Freidline, Michael J. Rogers, Sileshi Semaw. New reconstruction of DAN5 cranium (Gona, Ethiopia) supports complex emergence of Homo erectus. Nature Communications, 2025; 16 (1) DOI: 10.1038/s41467-025-66381-9

Note: The above post is reprinted from materials provided by Midwestern University.

New fossils in Qatar reveal a tiny sea cow hidden for 21 million years

 An illustration of ancient sea cows Alex Boersma
An illustration of ancient sea cows Alex Boersma

Today the Arabian Gulf supports large numbers of dugongs, marine mammals related to manatees that feed on seagrass and leave trails in the sediment as they graze. Newly examined fossils from Qatar show that sea cows living more than 20 million years ago shaped their environments in much the same way.

The findings, published December 10 in the journal PeerJ, come from a partnership between scientists at the Smithsonian’s National Museum of Natural History and Qatar Museums. The team also identified a previously unknown species of ancient sea cow that was much smaller than modern dugongs.

“We discovered a distant relative of dugongs in rocks less than 10 miles away from a bay with seagrass meadows that make up their prime habitat today,” said Nicholas Pyenson, curator of fossil marine mammals at the National Museum of Natural History and a lead author of the study. “This part of the world has been prime sea cow habitat for the past 21 million years — it’s just that the sea cow role has been occupied by different species over time.”

Modern Dugong Biology and Behavior

Dugongs (Dugong dugon) have a stout body and a downward-facing snout lined with bristles that help them sense food, giving them a broad resemblance to manatees. Their tails distinguish them from their relatives. Manatees have a rounded, paddle-shaped tail while dugongs have a dolphin-like tail with flukes (however, dugongs and manatees are more closely related to elephants than they are to dolphins, whales and porpoises).

These herbivores occupy shallow coastal habitats across a wide range that includes western Africa, the Indo-Pacific, and northern Australia. The largest single herd of dugongs occurs in the Arabian Gulf, where their constant grazing stirs up sediment and releases nutrients that benefit surrounding marine ecosystems.

A Long Fossil History and Growing Modern Threats

Fossil evidence shows that sea cow ancestors have fed on aquatic plants for roughly 50 million years. Despite this long history, dugongs in the Gulf now face significant challenges. They are sometimes caught accidentally by local fishers, and development along the coast affects the waters where they feed. Rising temperatures and increasing salinity place further pressures on the seagrass meadows that dugongs depend on.

Ferhan Sakal, head of excavation and site management at Qatar Museums and a coauthor of the study, noted that crucial information about past seagrass environments is preserved in the region’s rock record.

“If we can learn from past records how the seagrass communities survived climate stress or other major disturbances like sea-level changes and salinity shifts, we might set goals for a better future of the Arabian Gulf,” he said.

Researchers rely heavily on fossilized bones to understand these environments, since the soft blades of seagrass rarely leave impressions in the geologic record.

Exploring the Al Maszhabiya Fossil Site

One of the most significant sources of these fossils is Al Maszhabiya [AL mahz-HA-bee-yah], a site in southwestern Qatar. Geologists first encountered the site in the 1970s while conducting mining and petroleum surveys and believed they had found reptile bones. When paleontologists revisited the area in the early 2000s, they recognized the bones as belonging to ancient sea cows.

“The area was called ‘dugong cemetery’ among the members of our authority,” Sakal said. “But at the time, we had no idea just how rich and vast the bonebed actually was.”

After obtaining the required permits in 2023, Pyenson, Sakal, and their team surveyed the site. Surrounding rock layers suggest that the fossils date to the Early Miocene, approximately 21 million years ago. The area was once a shallow sea inhabited by sharks, barracuda-like fish, prehistoric dolphins, and sea turtles.

The World’s Densest Sea Cow Bonebed

The team documented sea cow remains at more than 170 separate locations across the site. Pyenson described Al Maszhabiya as the richest fossil sea cow assemblage known. He compared it to Cerro Ballena in Chile’s Atacama Desert, where he and other researchers had uncovered a large collection of whale fossils.

Although the bones share similarities with those of modern dugongs, they also show differences. The ancient animals still had hind limb bones, which living dugongs and manatees lost during their evolution. The prehistoric species also had a straighter snout and smaller tusks.

Naming a New Species: Salwasiren qatarensis

The team formally designated the Al Maszhabiya sea cows as a new species, Salwasiren qatarensis. The genus name refers to the Bay of Salwa, a nearby section of the Gulf where dugongs live today. Although the Bay of Salwa touches the waters of several countries, the species name “qatarensis” honors Qatar, where the fossils were discovered.

“It seemed only fitting to use the country’s name for the species as it clearly points to where the fossils were discovered,” Sakal said.

Based on their estimates, the researchers believe Salwasiren weighed around 250 pounds, similar to the weight of an adult panda or a heavyweight boxer. Even at that size, it was relatively small compared with some dugongs living today, which can weigh nearly eight times more.

Ancient Seagrass Meadows and the Role of Sea Cows

The fossils provide evidence that abundant seagrass beds existed in the region more than 20 million years ago, during a period when the Gulf supported high marine biodiversity. Sea cows would have helped maintain these underwater meadows by feeding and disturbing the sediment.

“The density of the Al Maszhabiya bonebed gives us a big clue that Salwasiren played the role of a seagrass ecosystem engineer in the Early Miocene the way that dugongs do today,” Pyenson said. “There’s been a full replacement of the evolutionary actors but not their ecological roles.”

Pyenson also noted that sea cow fossils often appear in mixed species groups, making it likely that further research at the site could uncover additional dugong relatives.

Preserving Qatar’s Fossil Heritage

Sakal hopes continued collaboration between Qatar Museums and the Smithsonian will lead to further discoveries at Al Maszhabiya and other nearby locations. Protecting the site is a top priority, and the team plans to nominate it for recognition as a UNESCO World Heritage site.

“The most important part of our collaboration is ensuring that we provide the best possible protection and management for these sites, so we can preserve them for future generations,” Sakal said.

“Dugongs are an integral part of our heritage, not only as a living presence in our waters today, but also in the archaeological record that connects us to generations past,” said Faisal Al Naimi, coauthor and director of the Archaeology Department at Qatar Museums. “The findings at Al Maszhabiya remind us that this heritage is not confined to memory or tradition alone, but extends deep into geologic time, reinforcing the timeless relationship between our people and the natural world. In preserving and studying these remarkable creatures, we are also safeguarding a narrative that speaks to our nation’s identity, resilience and enduring connection to the sea.”

Digital Access and Continued Research

To make their data widely available, Pyenson and Sakal worked with the Smithsonian’s Digitization Program Office to create digital scans of several fossil sites and of the fossil skull, vertebrae, tooth, and other skeletal parts of the newly described species. These 3D models can be explored through the open-source Smithsonian Voyager platform, which includes interactive educational materials and a virtual tour of the excavation.

The study’s authors also include researchers from the Smithsonian’s Digitization Program Office, the Stone Ridge School of the Sacred Heart, Texas A&M University at Galveston, Texas A&M University College Station, and the Natural History Museum of Los Angeles County.

This work was supported by a collaborative agreement between the Smithsonian Institution and Qatar Museums and received additional funding from the National Museum of Natural History and the Qatar National Research Fund.

Reference:
Nicholas D. Pyenson, Ferhan Sakal, Jacques LeBlanc, Jon Blundell, Katherine D. Klim, Christopher D. Marshall, Jorge Velez-Juarbe, Katherine Wolfe, Faisal Al-Naimi. High abundance of Early Miocene sea cows from Qatar shows repeated evolution of seagrass ecosystem engineers in Eastern Tethys. PeerJ, 2025; 13: e20030 DOI: 10.7717/peerj.20030

Note: The above post is reprinted from materials provided by Smithsonian. 

Scientists find a massive hidden CO2 sponge beneath the ocean floor

Cores of lava breccia, cemented with white calcium carbonate minerals, recovered from IODP Site U1557. Credit: IODP JRSO

Rock samples that formed about 60 million years ago and were collected from far beneath the ocean surface have helped scientists understand how large amounts of carbon dioxide can remain locked away for extremely long periods. These samples show that CO2 becomes trapped within layers of lava rubble that build up across the seafloor.

Researchers examined lava material drilled from deep below the South Atlantic Ocean to measure how much CO2 becomes incorporated into these rocks through interactions between seawater and the cooling volcanic material.

Work led by the University of Southampton demonstrates that these accumulations of broken lava, created as underwater mountains erode, act as natural reservoirs for CO2. This study marks the first time their role as extensive carbon-holding structures has been clearly recognized, offering fresh insight into how Earth manages carbon over millions of years.

Lava Rubble as a Long-Term Geological “Sponge”

Lead author Dr. Rosalind Coggon, Royal Society Research Fellow at the University of Southampton, explained: “We’ve known for a long time that erosion on the slopes of underwater mountains produces large volumes of volcanic rubble, known as breccia — much like scree slopes on continental mountains.

“However, our drilling efforts recovered the first cores of this material after it has spent tens of millions of years being rafted across the seafloor as Earth’s tectonic plates spread apart.

“Excitingly, the cores revealed that these porous, permeable deposits have the capacity to store large volumes of seawater CO2 as they are gradually cemented by calcium carbonate minerals that form from seawater as it flows through them.”

How Carbon Moves Through Earth Over Geological Time

The amount of carbon dioxide in the atmosphere is influenced by the slow exchange of carbon among Earth’s interior, the oceans, and the air over many millions of years. Understanding this long-term carbon cycle requires studying where and how carbon is added or removed from different parts of the planet.

Dr. Coggon noted: “The oceans are paved with volcanic rocks that form at mid-ocean ridges, as the tectonic plates move apart creating new ocean crust. This volcanic activity releases CO2 from deep inside the Earth into the ocean and atmosphere.

“However, ocean basins are not just a container for seawater. Seawater flows through the cracks in the cooling lavas for millions of years and reacts with the rocks, transferring elements between the ocean and rock. This process removes CO2 from the water and stores it in minerals like calcium carbonate in the rock.”

As part of the project, the team quantified how much CO2 becomes incorporated into ocean crust through these chemical reactions.

Discovering Far Greater CO₂ Storage in Breccia

“While drilling deep into the seafloor of the South Atlantic, we discovered lava rubble that contained between two and 40 times more CO2 than previously sampled lavas,” said Dr. Coggon.

“This study revealed the importance of such breccia, which forms due to the erosion of seafloor mountains along mid-ocean ridges, as a sponge for carbon in the long-term carbon cycle.”

The findings come from Expedition 390/393 of the International Ocean Discovery Program.

Reference:

Rosalind M. Coggon, Elliot J. Carter, Lewis J. C. Grant, Aled D. Evans, Christopher M. Lowery, Damon A. H. Teagle, Pamela D. Kempton, Matthew J. Cooper, Claire M. Routledge, Elmar Albers, Justin Estep, Gail L. Christeson, Michelle Harris, Thomas M. Belgrano, Jason B. Sylvan, Julia S. Reece, Emily R. Estes, Trevor Williams. A geological carbon cycle sink hosted by ocean crust talus breccias. Nature Geoscience, 2025; 18 (12): 1279 DOI: 10.1038/s41561-025-01839-5

Note: The above post is reprinted from materials provided by University of Southampton.

Scientists discover a hidden deep sea hotspot bursting with life

hydrothermal vent
Eggs of deep-sea skates have been discovered near the hottest type of hydrothermal vents, where super-heated water emerges out of the sea floor. These vents, called black smokers, emit dark, sulphurous plumes. Credit: Ocean Exploration Trust

Off the coast of Papua New Guinea, scientists have identified a previously unknown type of hydrothermal field where two different processes occur at the same time: hot hydrothermal fluids rise from below the seafloor while unusually large quantities of methane and other hydrocarbons escape from the sediments. This combination has not been documented anywhere else. The site is located about 1,300 meters deep on the slope of Conical Seamount in the western Pacific, near the island of Lihir in Papua New Guinea.

The findings were recently described in Scientific Reports.

ROV delivers the surprise

“We essentially have a hot vent bubbling right next to a cool gas seep — a combination that has never been described before,” says Dr. Philipp Brandl, marine geologist at the GEOMAR Helmholtz Centre for Ocean Research Kiel. He was chief scientist on the SONNE expedition SO299 DYNAMET, which surveyed the Tabar-Lihir-Tanga-Feni island chain in 2023 to investigate the region’s underwater volcanoes (seamounts).

Brandl adds: “No one really expected to find a hydrothermal field here, let alone one that is so exceptional.” Earlier missions had shown hints of limited hydrothermal activity, yet this field went unnoticed during several previous research cruises. Only when the team deployed the ROV Kiel 6000 did the unusual features of the site become clear. “It was a real surprise,” Brandl says, “especially for those of us who had worked in this area multiple times.”

A hybrid system of hot and cool vents

Hydrothermal vents and methane seeps typically appear in separate locations on the seafloor. In this instance, however, their close spacing results from the specific makeup of Conical Seamount. Thick layers of sediment rich in organic material lie beneath the volcanic edifice. Rising magma heats these buried layers, producing methane and other hydrocarbons. At the same time, the heat from the magma drives chemically rich fluids upward until they exit the seafloor as hot hydrothermal vents.

Both the heated fluids from below and the cooler, methane-filled gases from the sediments move upward through the same pathways. As a result, hot water and cold gas emerge from the seafloor only a few centimeters apart.

A habitat unlike any other

This unusual arrangement creates an entirely new kind of deep-sea environment that supports an exceptionally varied community of organisms. The rocks are densely covered by Bathymodiolus mussels, tube worms, shrimp, amphipods, and vivid purple sea cucumbers. “In places, you couldn’t see a single patch of rock because everything is so densely populated,” Brandl says. “We are confident that some of the species there have not yet been described. However, a dedicated expedition would be needed to fully study this unique habitat.”

Because mussels dominate the area, the research team and local observer Stanis Konabe from the University of Papua New Guinea named the site ‘Karambusel’. In Tok Pisin, the word means ‘mussel’.

Traces of precious metals in the rock

The unusual mixture of gases at Karambusel affects both the ecosystem and the geological characteristics of the vent field. Methane levels exceed 80 percent, and hot fluids rising from below create distinctive chemical conditions in the subsurface. Gold and silver, along with arsenic, antimony, and mercury, accumulate in the surrounding rocks. These minerals indicate that the area once experienced high-temperature hydrothermal activity that deposited precious metals, even though current activity is cooler.

Threats from human activity

Although the site is remarkable for both its geology and its biology, it faces significant risks. Mining operations already occur nearby, such as at the Ladolam gold mine on Lihir, where waste material is discharged into the ocean. Additional exploration licences for seafloor minerals and hydrocarbons are in place. These activities pose threats to the delicate ecosystem and the organisms that depend on it.

The researchers urge further investigation of this region, along with careful marine spatial planning and protective measures to safeguard the site. Philipp Brandl states: “We have discovered an unexpected treasure trove of biodiversity in the Karambusel field that needs to be protected before economic interests destroy it.”

Reference:
Philipp A. Brandl, Sylvia G. Sander, Christoph Beier, Mark Schmidt, Jan J. Falkenberg, Terue Kihara, Klaas Meyn, Felix Genske, Rebecca Zitoun, Brent I. A. McInnes, Mark D. Hannington, Sven Petersen, Eemu J. Ranta, Fred Jourdan, Louis-Maxime Gautreau, Thor H. Hansteen, Ingo Heyde, Stanis Konabe, Joseph O. Espi, Octavio Acuña Avendaño, Alan T. Baxter, Christophe Y. Galerne, Max Kaufmann, Johanna Klein, Sabine Lange, Doris Maicher, Esther Panachi, Konstantin Reeck, Egor Riemer, William Ruth, Johanna Schenk, Sarima Vahrenkamp, Leon Waßmund, Julia Wenske, Hannah Zimmer. Coupled hydrothermal venting and hydrocarbon seepage discovered at Conical Seamount, Papua New Guinea. Scientific Reports, 2025; 15 (1) DOI: 10.1038/s41598-025-17192-x

Note: The above post is reprinted from materials provided by Helmholtz Centre for Ocean Research Kiel (GEOMAR).

A 400-million-year-old plant creates water so weird it looks alien

Other plants found in the Rhynie Chert have a range of different vascular systems. Asteroxylon, for example, already has xylem and phloem. © The Trustees of the Natural History Museum, London

A research group at The University of New Mexico has identified how an unusual prehistoric plant may provide new ways to interpret Earth’s ancient climate conditions.

Led by UNM Earth and Planetary Sciences Professor Zachary Sharp, the team published its findings in the Proceedings of the National Academy of Sciences (PNAS). The study, titled “Extreme triple oxygen isotope fractionation in Equisetum,” examines horsetails, which are hollow-stemmed plants that have existed on the planet for more than 400 million years. The researchers discovered that as water moves through these plants, it experiences such intense natural filtration that its oxygen isotope signatures become similar to those seen in meteorites or other extraterrestrial materials.

“It’s a meter-high cylinder with a million holes in it, equally spaced. It’s an engineering marvel,” Sharp said. “You couldn’t create anything like this in a laboratory.”

Unusual Isotope Behavior Reveals a New Climate Tool

The team’s results help clarify long-standing puzzles involving oxygen isotope measurements in desert plants and introduce a valuable method for reconstructing climate in dry regions.

Oxygen isotopes function as tracers, allowing scientists to learn about water sources, plant transpiration, and atmospheric moisture. Heavier isotopes are rare, which makes it challenging to predict how their ratios shift under real environmental conditions.

To investigate this process, Sharp’s group collected smooth horsetails (Equisetum laevigatum) along the Rio Grande in New Mexico. They tracked how oxygen isotope values changed from the lower sections of the plants to the upper portions. The highest samples produced extreme readings that previously appeared to fall outside any known Earth-based range.

Meteorite-Like Signatures Draw Global Attention

Sharp presented the work at the Goldschmidt Geochemistry Conference in Prague this past July.

“If I found this sample, I would say this is from a meteorite,” Sharp said during the conference. “But in fact, these values do go down to these crazy low levels.”

The newly collected data allowed the researchers to update their models, helping explain unusual isotope results found in other desert species. Sharp believes these refined models could also help scientists better understand ancient climate behavior.

Fossil Records Preserve Humidity From the Age of Dinosaurs

Fossil horsetails, which once grew up to 30 meters tall, contain tiny silica particles called phytoliths. These structures may retain isotope signatures for millions of years. According to Sharp, the phytoliths work as a “paleo-hygrometer,” or a way to measure ancient humidity.

“We can now begin to reconstruct the humidity and climate conditions of environments going back to when dinosaurs roamed the Earth,” he said.

This research expands UNM’s contributions to the geosciences and highlights horsetails, some of the planet’s oldest surviving plants, as unexpected yet powerful record keepers of Earth’s climate history.

Reference:

Zachary Sharp, Jordan Wostbrock, Anthony Gargano, Vincent Hare, Jessica Johnson, Thure Cerling, Payal Banerjee, Catherine Peshek, Cloe Knutson, Lauren Hartzell, Erick Cano, Elena Stiles, Kelley R. Bassett, Kira Holland, Michael H. Dowd, Jarunetr (Nadia) Sae-Lim, Teresa Dominguez, Dalton Bryant, Eduardo Di Marcantonio, Jensen Wainwright, Maxwell Horsford, Paul Botté, Catherine Gagnon, Paula J. Rudall, James Ehleringer. Extreme triple oxygen isotope fractionation in Equisetum. Proceedings of the National Academy of Sciences, 2025; 122 (44) DOI: 10.1073/pnas.2507455122

Note: The above post is reprinted from materials provided by University of New Mexico.

What Is the Cause of an Earthquake?

Seismogram
Representative Image: Seismogram

What Is the Cause of an Earthquake? Understanding Earthquake Origins in Geology

The cause of an earthquake lies in the sudden release of stored elastic energy within the Earth’s crust or upper mantle. This energy is generated by tectonic forces that slowly deform rocks over time until they exceed their mechanical strength. When failure occurs, rocks rupture along faults, releasing energy in the form of seismic waves that propagate through the Earth—what we experience as an earthquake.

From a geological perspective, earthquakes are not random events. They are the direct result of plate tectonics, stress accumulation, rock mechanics, and fault behavior, operating over timescales ranging from seconds to millions of years.

The Fundamental Geological Cause of Earthquakes

At the most basic level, earthquakes are caused by brittle failure of rocks under stress.

Stress Accumulation in the Earth’s Crust

Stress builds up in rocks due to:

  • Plate motion
  • Gravitational loading
  • Thermal expansion
  • Isostatic adjustment

Three principal stresses act on rocks:

  • σ₁ – maximum principal stress
  • σ₂ – intermediate principal stress
  • σ₃ – minimum principal stress

As tectonic plates move, stress accumulates along zones of weakness—primarily faults.

Elastic Deformation and Rock Failure

Rocks behave elastically under low stress, meaning they deform but return to their original shape. When stress exceeds the rock’s elastic limit, brittle failure occurs, producing:

  • Fractures
  • Fault slip
  • Sudden energy release

This process is governed by the Mohr–Coulomb failure criterion, a fundamental principle in rock mechanics.

Faults as the Primary Source of Earthquakes

Most earthquakes occur along geological faults, which are fractures with measurable displacement.

Fault Locking and Stick–Slip Behavior

Faults are not continuously moving. Instead, they often remain locked due to friction. As tectonic motion continues, stress accumulates until:

  • Frictional resistance is overcome
  • Sudden slip occurs
  • Stored elastic strain is released

This behavior is known as the elastic rebound theory, first proposed by H. F. Reid after the 1906 San Francisco earthquake.

Types of Faults That Generate Earthquakes

Different fault types produce earthquakes under different stress regimes:

  • Normal faults → extensional stress
  • Reverse and thrust faults → compressional stress
  • Strike-slip faults → shear stress

The type of fault controls:

  • Earthquake depth
  • Rupture geometry
  • Surface deformation
  • Seismic hazard

Plate Tectonics and Earthquake Generation

Plate tectonics provides the global framework for understanding earthquake causes.

Convergent Plate Boundaries

At convergent boundaries, plates collide, producing:

  • Subduction-zone earthquakes
  • Deep-focus earthquakes (up to 700 km)
  • Some of the largest earthquakes on Earth

These earthquakes occur due to megathrust faulting, where one plate is forced beneath another.

Divergent Plate Boundaries

At divergent boundaries:

  • Plates move apart
  • Normal faulting dominates
  • Earthquakes are generally shallow and moderate in magnitude

These are common at mid-ocean ridges and continental rifts.

Transform Plate Boundaries

Transform boundaries accommodate horizontal motion:

  • Strike-slip faulting
  • Shallow but potentially destructive earthquakes

These boundaries produce frequent seismic activity due to high strain rates.

Earthquake Focus, Epicenter, and Seismic Energy Release

Focus (Hypocenter)

The focus is the point inside the Earth where rupture begins. It represents the true origin of the earthquake.

Epicenter

The epicenter is the point on Earth’s surface directly above the focus. Damage is often greatest near the epicenter, but this depends on depth and local geology.

Seismic Waves

Earthquake energy travels as:

  • P-waves (compressional)
  • S-waves (shear)
  • Surface waves (Love and Rayleigh)

Surface waves cause the most damage, as they have large amplitudes near the surface.

Secondary Geological Causes of Earthquakes

While tectonics dominate, other geological processes can also cause earthquakes.

Volcanic Earthquakes

Volcanic activity generates earthquakes due to:

  • Magma movement
  • Gas pressure changes
  • Rock fracturing

These earthquakes are typically shallow and localized.

Isostatic Adjustment Earthquakes

Post-glacial rebound causes earthquakes as the crust responds to unloading after ice-sheet melting. These are common in formerly glaciated regions.

Landslide-Induced Earthquakes

Large landslides or rock avalanches can generate seismic signals, although they are not tectonic in origin.

Human-Induced (Anthropogenic) Earthquakes

Some earthquakes are caused or triggered by human activities.

Reservoir-Induced Seismicity

Large dams alter stress and pore pressure in the crust, sometimes triggering earthquakes.

Fluid Injection and Extraction

Activities such as:

  • Wastewater injection
  • Hydraulic fracturing
  • Geothermal energy extraction

can increase pore pressure, reducing fault friction and triggering seismic events.

Mining-Induced Seismicity

Underground mining redistributes stress, sometimes causing rockbursts and seismic events.

Why Earthquakes Occur Suddenly

Strain Energy Storage

Tectonic motion is slow—typically millimeters per year—but strain accumulates over decades to centuries.

Sudden Stress Release

Once frictional resistance is exceeded, rupture occurs in seconds, releasing:

  • Seismic energy
  • Heat
  • Permanent displacement

This contrast between slow buildup and rapid release explains the sudden nature of earthquakes.

Earthquake Magnitude, Energy, and Rupture Area

The size of an earthquake depends on:

  • Fault area that ruptures
  • Amount of slip
  • Rock rigidity

Large earthquakes involve long fault segments and high slip values, while small earthquakes rupture limited areas.

Geological Conditions That Amplify Earthquake Effects

Earthquake damage is not controlled solely by magnitude.

Local Geology

Soft sediments amplify seismic waves, increasing damage.

Fault Proximity

Shallow earthquakes near populated areas are more destructive.

Basin Effects

Sedimentary basins can trap and amplify seismic waves.

Why Earthquakes Cannot Yet Be Predicted

Although the cause of earthquakes is well understood, exact prediction remains impossible because:

  • Stress is heterogeneous
  • Fault friction varies
  • Subsurface conditions are complex

Modern seismology focuses on probabilistic hazard assessment, not deterministic prediction.

References

  • Reid, H. F. (1910). The Mechanics of the Earthquake. Carnegie Institution of Washington.
  • Scholz, C. H. (2019). The Mechanics of Earthquakes and Faulting. Cambridge University Press.
  • Anderson, E. M. (1951). The Dynamics of Faulting and Dyke Formation. Oliver & Boyd.
  • Kanamori, H., & Brodsky, E. E. (2004). “The physics of earthquakes.” Reports on Progress in Physics, 67, 1429–1496.
  • Turcotte, D. L., & Schubert, G. (2014). Geodynamics. Cambridge University Press.
  • Shearer, P. M. (2009). Introduction to Seismology. Cambridge University Press.

What Are the Different Types of Faults in Geology?

Different Types of Faults

Types of Faults in Geology — How Earth’s Crust Breaks, Moves, and Evolves

In geology, faults are fractures or zones of fractures in the Earth’s crust along which measurable displacement has occurred. The study of faults is central to structural geology, tectonics, seismology, and engineering geology, because faults control mountain building, basin formation, earthquakes, and the mechanical behavior of the lithosphere.

Understanding the types of faults allows geologists to interpret:

  • Regional and global stress regimes
  • Plate tectonic environments
  • Earthquake mechanisms and hazards
  • Crustal deformation through geological time

Faults are classified primarily based on the direction of movement, orientation of the fault plane, and the stress field responsible for deformation.

Faults, Stress, and Rock Mechanics — The Physical Basis

Before classifying faults, it is essential to understand the three principal stresses acting on rocks:

  • σ₁ (maximum principal stress)
  • σ₂ (intermediate stress)
  • σ₃ (minimum principal stress)

Faulting occurs when applied stress exceeds the shear strength of rocks, as described by the Mohr–Coulomb failure criterion. The orientation of σ₁ and σ₃ determines how rocks break and slide, directly controlling the type of fault that forms.

Main Types of Faults in Geology

Geological faults are grouped into four fundamental categories, each linked to a specific tectonic stress regime.

1. Normal Faults

A normal fault forms when the crust is subjected to extensional stress, causing it to stretch and thin. In a normal fault, the hanging wall moves downward relative to the footwall.

Key Characteristics

  • Associated with tensional (extensional) stress
  • Hanging wall moves down
  • Fault plane typically dips 45–70°
  • Produces fault scarps and horst–graben systems

Geological Settings

  • Continental rift zones
  • Mid-ocean ridges
  • Back-arc basins

Geological Significance

Normal faults accommodate crustal extension and are fundamental to the formation of rift valleys and sedimentary basins.

Examples

  • East African Rift System
  • Basin and Range Province (USA)

Normal faulting dominates regions where σ₃ is vertical and σ₁ is horizontal.

2. Reverse Faults

A reverse fault develops under compressional stress, where the hanging wall moves upward relative to the footwall.

Key Characteristics

  • Compression shortens and thickens the crust
  • Hanging wall moves up
  • Fault plane dips steeply (>45°)
  • Commonly associated with folding

Geological Settings

  • Convergent plate boundaries
  • Continental collision zones
  • Active orogenic belts

Reverse faults are crucial indicators of crustal shortening and are often associated with large-scale mountain building.

3. Thrust Faults (Low-Angle Reverse Faults)

A thrust fault is a special type of reverse fault with a low dip angle, typically less than 30°. Thrust faults can transport rock masses tens to hundreds of kilometers.

Key Characteristics

  • Low-angle fault plane
  • Older rocks may overlie younger rocks
  • Formation of nappes and duplex structures

Geological Importance

Thrust faults are dominant in fold-and-thrust belts and represent some of the most dramatic crustal displacements on Earth.

Examples

  • Himalaya thrust systems
  • Alps and Zagros Mountains

Thrusting reflects a stress regime where σ₁ is horizontal and σ₃ is vertical.

4. Strike-Slip Faults

A strike-slip fault is characterized by horizontal movement parallel to the fault’s strike, driven by shear stress.

Subtypes of Strike-Slip Faults

Right-Lateral (Dextral) Faults
The opposite block moves to the right.

Left-Lateral (Sinistral) Faults
The opposite block moves to the left.

Key Characteristics

  • Vertical or near-vertical fault plane
  • Horizontal displacement dominates
  • Linear valleys, offset streams, sag ponds

Tectonic Settings

  • Transform plate boundaries
  • Continental shear zones

Examples

  • San Andreas Fault (USA)
  • Alpine Fault (New Zealand)

Strike-slip faulting reflects a stress regime where σ₁ and σ₃ are horizontal.

Oblique-Slip Faults

An oblique-slip fault combines vertical and horizontal movement, meaning both dip-slip and strike-slip components are present.

Why Oblique Faults Are Common
Natural stress fields are rarely perfectly aligned, so many faults record mixed displacement.

Geological Significance
Oblique-slip faults are common along:

  • Oblique plate boundaries
  • Continental margins
  • Reactivated ancient faults

Fault Zones vs Single Fault Planes

In reality, most faults are not single surfaces but fault zones, consisting of:

  • Multiple fault strands
  • Fracture networks
  • Fault breccia
  • Fault gouge

These zones may be meters to kilometers wide and strongly influence fluid flow, mineralization, and seismic behavior.

Special Fault Types in Structural Geology

Listric Faults
Curved normal faults that flatten with depth, common in sedimentary basins.

Growth Faults
Active during sediment deposition, producing thickened strata on the downthrown side.

Detachment Faults
Large, low-angle normal faults associated with crustal extension.

Blind Faults
Do not reach the surface but can still generate large earthquakes.

Faults and Earthquakes

Earthquakes occur when accumulated elastic strain is suddenly released along faults.

  • Normal faults → shallow extensional earthquakes
  • Reverse/thrust faults → large, destructive earthquakes
  • Strike-slip faults → lateral rupture and surface offsets

Fault geometry and slip rate control earthquake magnitude and frequency.

How Geologists Identify and Study Faults

Faults are analyzed using multiple complementary approaches:

  • Field mapping (slickensides, offsets, breccias)
  • Seismic reflection and refraction
  • Remote sensing and LiDAR
  • Paleoseismology
  • Microstructural analysis

Each method helps constrain fault kinematics and evolution.

Engineering and Environmental Importance of Fault Types

Fault classification directly affects:

  • Tunnel alignment and support design
  • Dam and foundation safety
  • Groundwater flow and contamination pathways
  • Landslide susceptibility
  • Seismic hazard assessment

Faults often act as barriers or conduits for fluids, depending on their internal structure.

References

  1. Anderson, E. M. (1951). The Dynamics of Faulting and Dyke Formation. Oliver & Boyd.
  2. Twiss, R. J., & Moores, E. M. (2007). Structural Geology. W.H. Freeman.
  3. Scholz, C. H. (2019). The Mechanics of Earthquakes and Faulting. Cambridge University Press.
  4. Fossen, H. (2016). Structural Geology. Cambridge University Press.
  5. Sibson, R. H. (1977). “Fault rocks and fault mechanisms.” Journal of the Geological Society, 133, 191–213.
  6. Davis, G. H., Reynolds, S. J., & Kluth, C. F. (2012). Structural Geology of Rocks and Regions. Wiley.

What Is RQD of Rock?

What Is RQD of Rock?

What Is RQD of Rock? Understanding Rock Quality Designation in Engineering Geology

RQD of rock, short for Rock Quality Designation, is a quantitative index used in engineering geology and rock mechanics to assess the degree of jointing and fracturing in a rock mass based on drill core recovery. Introduced by D. U. Deere (1963), RQD rapidly became a standard descriptor for evaluating rock mass quality in tunnels, foundations, slopes, dams, and underground excavations.

At its core, RQD answers a simple, practical question: How intact is the rock mass at the scale relevant to engineering works? By converting observations from drill cores into a percentage, RQD provides a repeatable, field-based metric that links geology to design decisions.

Definition of RQD (Rock Quality Designation)

Rock Quality Designation (RQD) is defined as the percentage of intact drill core pieces longer than 100 mm (10 cm) recovered from a core run, relative to the total length of that run.

RQD (%)= (∑length of core pieces ≥100 mm​/total core run length)×100

This definition deliberately filters out short, broken fragments, which are interpreted as evidence of fractures, joints, shears, or weathering within the rock mass.

Why RQD Matters in Engineering and Geology

RQD is not merely a descriptive number. It has direct engineering consequences because rock mass behavior—strength, deformability, permeability, and stability—is controlled far more by discontinuities than by intact rock strength alone.

RQD is widely used to:

  • Estimate rock mass quality at depth
  • Support tunnel and cavern design
  • Evaluate foundation conditions for dams and buildings
  • Assess slope stability and excavation safety
  • Feed into rock mass classification systems (RMR, Q-system)

In practice, RQD often represents the first quantitative bridge between geological logging and engineering design.

Historical Development of the RQD Concept

The RQD concept was proposed by Don U. Deere during the development of rock mechanics for large civil projects in the mid-20th century. Prior to RQD, core recovery alone was used, but recovery could be misleading—high recovery might still represent heavily fractured rock.

Deere recognized that fragment length distribution is a better proxy for rock mass integrity than total recovery. His 1963 work formalized RQD as a simple, field-applicable index that could be standardized across projects.

How RQD Is Measured — Step-by-Step Scientific Procedure

1. Core Drilling

RQD is measured using diamond drill cores, typically NX, HQ, or NQ sizes. Consistency in core diameter improves comparability.

2. Core Handling and Layout

Recovered core is carefully placed in core boxes in drilling order, preserving depth orientation.

3. Measuring Intact Core Pieces

Only core pieces ≥ 100 mm in length are counted. Measurements are made along the core axis, not end-to-end across fractures.

4. Calculating RQD

The summed length of qualifying pieces is divided by the core run length (often 1.0–3.0 m).

5. Reporting

RQD is reported as a percentage per run and sometimes averaged over intervals.

RQD Classification and Interpretation

RQD values are commonly interpreted using Deere’s original classification:

RQD (%) Rock Mass Quality
0–25 Very Poor
25–50 Poor
50–75 Fair
75–90 Good
90–100

Excellent

These categories are engineering descriptors, not absolute measures of strength. A rock mass with excellent RQD may still be weak if discontinuities are unfavorably oriented or infilled.

Geological Meaning of RQD Values

RQD is fundamentally a measure of fracture spacing and structural integrity:

  • High RQD (≥ 90%)
    Indicates widely spaced joints, massive or blocky rock, low deformation potential.
  • Moderate RQD (50–75%)
    Suggests moderately jointed rock with potential block instability.
  • Low RQD (< 50%)
    Reflects closely spaced fractures, shears, or weathered zones; typically problematic for excavation.

From a geological perspective, RQD indirectly reflects:

  • Tectonic history
  • Stress regimes
  • Degree of weathering
  • Lithological controls on fracture development

RQD vs Core Recovery — A Critical Distinction

A frequent misconception is equating core recovery with RQD.

  • Core Recovery measures how much core was recovered.
  • RQD measures how intact that recovered core is.

A core run may show 100% recovery but an RQD of 30%, indicating crushed or highly fractured rock. Conversely, moderate recovery with long intact pieces may yield high RQD.

This distinction is crucial in fault zones, shear zones, and weathered profiles.

RQD in Rock Mass Classification Systems

RQD is rarely used alone in modern engineering. Instead, it feeds into multi-parameter systems.

Rock Mass Rating (RMR)

In Bieniawski’s RMR system, RQD contributes up to 20 points, combined with:

  • UCS
  • Joint spacing
  • Joint condition
  • Groundwater
  • Orientation

Q-System (Barton et al.)

RQD appears directly in the numerator:

Q = RQD/Jn × Jr/Ja × Jw/SRF

Here, RQD represents the block size component of rock mass quality.

Engineering Applications of RQD

Tunnels and Underground Excavations

RQD guides:

  • Support type selection (rock bolts, shotcrete, lining)
  • Excavation method (TBM vs drill-and-blast)

Foundations

Low RQD zones may require:

  • Excavation replacement
  • Grouting
  • Design modification

Slopes and Open Excavations

RQD helps identify zones prone to:

  • Block failure
  • Toppling
  • Wedge instability

Limitations and Criticisms of RQD

Despite its usefulness, RQD has well-documented limitations:

  1. Orientation Bias
    RQD depends on drill direction relative to joint orientation. A borehole parallel to joints may overestimate quality.
  2. Ignores Joint Properties
    RQD does not account for:
    – Joint roughness
    – Aperture
    – Infilling
    – Persistence
  3. Insensitive to Lithology
    Strong and weak rocks may yield similar RQD values.
  4. Scale Dependency
    RQD reflects conditions at the borehole scale, not necessarily the excavation scale.

For these reasons, RQD should always be used in conjunction with detailed structural logging and geotechnical testing.

Advances Beyond Classical RQD

Modern practice supplements RQD with:

  • Fracture frequency (P10) from scanlines
  • Digital core scanning
  • Image-based discontinuity analysis
  • Rock mass block volume estimation

Nevertheless, RQD remains a globally accepted baseline index, especially in early-stage site investigations.

References

  1. Deere, D. U. (1963). Technical description of rock cores for engineering purposes. Rock Mechanics and Engineering Geology, 1, 16–22.
  2. Deere, D. U., & Deere, D. W. (1988). The Rock Quality Designation (RQD) Index in Practice. Rock Classification Systems for Engineering Purposes, ASTM STP 984.
  3. Bieniawski, Z. T. (1989). Engineering Rock Mass Classifications. Wiley.
  4. Barton, N., Lien, R., & Lunde, J. (1974). Engineering classification of rock masses for the design of tunnel support. Rock Mechanics, 6, 189–236.
  5. Palmström, A. (2005). Measurements of and correlations between block size and rock quality designation (RQD). Tunnelling and Underground Space Technology, 20, 362–377.
  6. Hoek, E., & Brown, E. T. (1997). Practical estimates of rock mass strength. International Journal of Rock Mechanics and Mining Sciences, 34(8), 1165–1186.

Intrusive Igneous Bodies: Types, Characteristics & Geological Processes

Types of Intrusive Igneous Bodies

Understanding Intrusive Igneous Bodies — How Magma Shapes the Earth’s Crust

Intrusive igneous bodies are masses of crystallized igneous rock that form when magma solidifies beneath Earth’s surface. These bodies, known collectively as plutonic bodies or plutons, cool slowly underground, resulting in coarse-grained, crystalline textures typical of rocks such as granite, diorite, gabbro, and tonalite. Because they form in the subsurface, intrusive bodies preserve critical records of magmatic processes, tectonic settings, crustal evolution, and thermal history (Best & Christiansen, 2001).

Intrusive igneous bodies vary enormously in size, geometry, depth of emplacement, and relationship with surrounding rock. Understanding their types is fundamental to:

  • Interpreting magmatic systems
  • Mapping tectonic environments
  • Reconstructing crustal evolution
  • Identifying mineral deposits
  • Understanding geothermal and volcanic systems

This article provides a comprehensive scientific overview of the main types of intrusive igneous bodies, integrating geological principles, petrology, structural geology, field relationships, and real scientific research.

What Defines an Intrusive Igneous Body?

An intrusive igneous body forms when magma intrudes into pre-existing rocks and cools in the crust, becoming plutonic rock. The key characteristics include:

  • Slow cooling, producing large, visible crystals
  • Cross-cutting or concordant relationships with host rock
  • Contact metamorphism aureoles caused by heat
  • Distinctive textures (phaneritic, porphyritic, pegmatitic)
  • Mappable geometry, allowing classification into types

The morphology of intrusive bodies depends on:

  • Magma viscosity
  • Tectonic stress regime
  • Depth of emplacement
  • Composition & temperature
  • Mechanical properties of the host rock

Major Types of Intrusive Igneous Bodies

Below is a systematic, scientifically grounded explanation of all major intrusive body types, integrating structural relationships and magmatic processes.

1. Batholiths — The Largest Intrusive Bodies

Batholiths are massive, composite intrusive complexes larger than 100 km², formed by the amalgamation of multiple plutons over millions of years.

Key Characteristics

  • Irregular shape
  • Composed mainly of granitic to dioritic rocks
  • Represent continental arc magmatism (subduction zones)
  • Display zonation: mafic at margins → felsic at center
  • Form deep in the crust (5–30 km depth)

Geological Significance

Batholiths reflect long-lived magmatic arcs associated with orogenies.

Examples

  • Sierra Nevada Batholith (USA)
  • Andean Coastal Batholith (Peru & Chile)

Research indicates batholiths form through successive pulses of magma rather than single emplacement events (Paterson et al., 1994).

2. Plutons — Discrete Intrusive Bodies

A pluton is any large, blob-like intrusive body that crystallizes underground. Plutons may be:

  • Granite plutons (felsic)
  • Gabbro plutons (mafic)
  • Diorite plutons (intermediate)

Most plutons are sub-batholithic, meaning they may later join others to form a batholith.

Field Indicators

  • Coarse-grained texture
  • Sharp or diffuse intrusive contacts
  • Contact metamorphic aureoles

3. Stocks — Smaller Plutons

A stock is a small pluton less than 100 km² in surface exposure. Stocks often represent the upper tips of larger batholiths.

They show similar textures and mineralogy to plutons but are more restricted spatially.

4. Dikes — Vertical or Steeply Inclined Intrusions

Dikes (or dykes) are discordant tabular intrusions cutting across pre-existing structures.

Key Features

  • Steep or vertical orientation
  • Fine to medium grain size (faster cooling)
  • Often form swarm systems (parallel or radiating groups)
  • Transport magma upward during volcanic activity

Dikes record extensional tectonics, such as:

  • Rift zones
  • Mid-ocean ridges
  • Large Igneous Provinces (LIPs)

Example

  • The Mackenzie Dyke Swarm (Canada) — the world’s largest dyke swarm.

5. Sills — Horizontal or Gently Inclined Intrusions

A sill is a tabular, concordant intrusive body that injects parallel to sedimentary bedding or metamorphic foliation.

Characteristics

  • Typically forms under low differential stress
  • May feature columnar jointing
  • Can cause significant contact metamorphism in overlying strata

Sills commonly occur in continental flood basalt provinces, such as:

  • Karoo Sill Complex (South Africa)
  • Palatine Sill (Scotland)

6. Laccoliths — Dome-Shaped Intrusions

A laccolith forms when magma injects between rock layers and pushes the overlying strata upward, forming a dome.

Features

  • Flat base, convex upper surface
  • Viscous, silica-rich magma (e.g., rhyolite)
  • Found in shallow crustal levels

This intrusion geometry requires higher magma pressure than sills.

Classic Example

  • Henry Mountains Laccoliths (USA) — studied by Grove Karl Gilbert (1877), foundational to intrusion mechanics.

7. Lopoliths — Saucer-Shaped Intrusions

Lopoliths are large, bowl-shaped intrusive bodies that depress underlying strata.

Characteristics

  • Concave-up geometry
  • Often associated with mafic magmatism
  • Form under extensional tectonics

Notable Example

  • Bushveld Complex (South Africa) — the world’s largest layered mafic intrusion.

8. Pipes and Diatremes — Volcanic Conduits

These cylindrical intrusions represent vertical channels through which magma ascends.

Types:

  • Volcanic pipes — ultramafic to kimberlite; may host diamonds
  • Diatremes — explosive breccia-filled conduits

Pipes provide direct windows into deep mantle-derived magmas.

9. Pegmatites — Extremely Coarse-Grained Intrusions

Pegmatites form from volatile-rich late-stage magmas, yielding giant crystals of:

  • Feldspar
  • Quartz
  • Micas
  • Rare earth minerals (Li, Ta, Nb)

Pegmatites are essential for critical mineral resources used in batteries and electronics.

10. Xenolith-Bearing Intrusions

Some intrusive bodies transport xenoliths, fragments of country rock or mantle material.

These xenoliths serve as samples of inaccessible crustal and mantle layers, aiding in geochemical modeling (Hawkesworth & Kemp, 2006).

How Intrusive Bodies Interact with Surrounding Rocks

When magma intrudes, it alters nearby rocks via contact metamorphism, producing:

  • Chilled margins (rapid cooling)
  • Metamorphic aureoles
  • Skarns (fluid–rock reactions)

The thermal gradient and time duration determine metamorphic grade.

Textural and Mineralogical Indicators of Intrusive Emplacement

Intrusive igneous bodies exhibit diagnostic textures, including:

Phaneritic Texture

Large, interlocking crystals formed during slow cooling.

Porphyritic Texture

Large phenocrysts set in a finer groundmass.

Graphic Texture

Intergrowth of quartz and feldspar in pegmatites.

Zoned Minerals

Reflect changing magmatic conditions during crystallization.

How Geologists Identify and Study Intrusive Igneous Bodies

Field Mapping

Noting cross-cutting relationships and intrusive contacts.

Petrography

Microscopic analysis of crystal textures and mineral assemblages.

Geochemical Signatures

Trace elements and isotopes reveal source magmas and crustal contamination.

Geochronology

Radiometric dating (U-Pb zircon) determines magma emplacement ages.

Geophysics

Gravity and magnetic surveys detect subsurface plutons and sills.

Frequently Asked Questions

What are intrusive igneous bodies?

They are rock masses formed when magma cools and solidifies beneath Earth’s surface.

What is the difference between a dike and a sill?

A dike is discordant and cuts across layers; a sill is concordant and forms parallel to them.

Which intrusive body is the largest?

Batholiths are the largest, exceeding 100 km² in surface exposure.

What is a laccolith vs. a lopolith?

A laccolith domes the overlying strata upward, while a lopolith depresses underlying strata downward.

How do intrusive bodies relate to tectonics?

They record magmatic processes linked to plate boundaries, rifts, and crustal thickening.

Key Takeaways

  1. Intrusive igneous bodies form when magma solidifies underground, producing coarse-grained rocks.
  2. Their morphology reflects pressure, viscosity, tectonic stress, and host-rock properties.
  3. Types include plutons, batholiths, stocks, dikes, sills, laccoliths, lopoliths, pipes, pegmatites, and more.
  4. These bodies reveal critical information about magmatism, crustal growth, mineralization, and tectonic evolution.
  5. Field observations, petrography, isotopes, and geophysics are essential tools for their study.

References

  1. Best, M. G., & Christiansen, E. H. (2001). Igneous Petrology. Blackwell Science.
  2. Paterson, S. R., et al. (1994). “Magmatic processes in batholith construction.” Journal of Structural Geology, 16(11), 1675–1693.
  3. Gilbert, G. K. (1877). Report on the Geology of the Henry Mountains. U.S. Geological Survey.
  4. Hawkesworth, C. J., & Kemp, A. I. S. (2006). “Evolution of the continental crust.” Nature, 443, 811–817.
  5. Winter, J. D. (2010). Principles of Igneous and Metamorphic Petrology. Pearson.
  6. Wilson, M. (1989). Igneous Petrogenesis. Springer.

Geological Formation: Definition, Origins, Processes, and Importance | Complete Geological Guide

The ripplocation phenomenon can help explain the behavior of materials when they bend and break — everything from a nanoscale material to massive geological formations.

What Is a Geological Formation? A Scientific, Stratigraphic, and Geochemical Explanation

A geological formation is a fundamental unit of stratigraphy used to describe a body of rock with consistent lithological characteristics that distinguish it from adjacent rock layers. In essence, a geological formation is a mappable, identifiable package of rock that formed under specific geological conditions and environments (North American Commission on Stratigraphic Nomenclature, 2005).

Formations may consist of sedimentary, igneous, or metamorphic rocks, and they represent a natural chapter in Earth’s geological history — a period when certain environmental, tectonic, depositional, or magmatic conditions prevailed.

Formal Definition of a Geological Formation

In stratigraphy, a formation is defined as:

“A lithologically distinctive stratigraphic unit that is large enough to be mapped at the Earth’s surface or traced in the subsurface.”
(International Stratigraphic Guide, Salvador 1994)

Key Characteristics:

  • Distinct lithology (rock type, color, grain size, mineralogy)
  • Clear boundaries that can be mapped
  • Internal consistency within the rock body
  • Represents a specific geological environment or process

A formation is the basic building block of the geological column, and multiple formations may group together into members (smaller units) or groups (larger units).

Why Geological Formations Matter

Formations are essential because they allow geologists to:

1. Reconstruct Earth’s History

Formations preserve evidence of:

  • Ancient seas
  • Volcanic eruptions
  • Mountain-building events
  • Climate shifts
  • Biological evolution

2. Interpret Past Environments (Paleoenvironmental Reconstruction)

Sedimentary structures and fossils inside formations reveal:

  • River systems
  • Deserts
  • Glacial environments
  • Coral reefs
  • Deep-sea basins

3. Identify Natural Resources

Many resources occur within specific formations, including:

  • Groundwater aquifers (e.g., sandstone formations)
  • Petroleum reservoirs (carbonate & sandstone formations)
  • Ore deposits (volcanogenic or metamorphosed formations)

4. Support Engineering and Construction

Engineers use formations to evaluate:

  • Bedrock stability
  • Slope stability
  • Foundation design
  • Earthquake risk

How Geological Formations Develop — The Science Behind Their Origins

The development of geological formations depends on the type of rock involved. Below is a detailed breakdown from a geological processes perspective.

Sedimentary Formations

Sedimentary formations arise from the accumulation, compaction, and cementation of sediments over time. They cover about 75% of the Earth’s continents’ surface (Blatt, Middleton & Murray, 1980).

Controls on Sedimentary Formation Creation

1- Depositional Environment

  • Marine (continental shelf, deep sea)
  • Fluvial (river channels, floodplains)
  • Aeolian (dunes)
  • Lacustrine (lakes)

2- Sediment Supply & Transport

  • Weathering
  • Erosion
  • River transport
  • Oceanic currents

3- Sea-Level Changes
Transgression/regression cycles create distinct mappable formations.

4- Diagenesis
Cementation and chemical changes solidify the rock.

Example of a Sedimentary Formation:

The Navajo Sandstone (USA) — famous for its cross-bedded dunes and pale orange colors, representing an ancient Jurassic desert environment.

Igneous Formations

Igneous geological formations develop from magma crystallization (intrusive) or lava solidification (extrusive).

Key Igneous Processes Influencing Formations

  • Cooling rate influences crystal size
  • Magma composition (mafic, intermediate, felsic)
  • Tectonic setting (subduction zones, mid-ocean ridges, hotspots)

Examples:

  • Deccan Traps (India) — basaltic flood lavas
  • Skaergaard Intrusion (Greenland) — layered mafic intrusion crucial for igneous petrology research (Wager & Brown, 1968)

Metamorphic Formations

Metamorphic formations arise when existing rocks transform under:

  • Heat
  • Pressure
  • Chemically active fluids

These processes occur during:

  • Mountain-building (orogeny)
  • Subduction
  • Crustal thickening

Types of Metamorphism Shaping Formations

  • Regional metamorphism — large-scale, tectonic
  • Contact metamorphism — due to magma intrusions
  • Hydrothermal alteration — mineralization and ore formation

Example:

The Scottish Highlands Metamorphic Complex, shaped by the Caledonian Orogeny.

Stratigraphy and Naming of Geological Formations

To be officially recognized, a formation must be:

  • Described in a scientific publication
  • Mapped at a mappable scale (1:25,000 or 1:50,000)
  • Defined at a type locality (“type section”)

Naming conventions usually follow:

Geographic location + dominant lithology
Example: Burgess Shale Formation

Examples of Famous Geological Formations Worldwide

Sedimentary

  • Grand Canyon Formations (USA) — showcase 2 billion years of stratigraphy
  • White Cliffs of Dover (UK) — Upper Cretaceous chalk

Igneous

  • Giant’s Causeway (Northern Ireland) — columnar basalt
  • Siberian Traps (Russia) — massive volcanic province linked to mass extinction

Metamorphic

  • Himalayan Metamorphic Core — high-grade gneisses and migmatites

How Geologists Study Geological Formations

1. Field Mapping

Measuring layers, rock types, structures.

2. Petrographic Analysis

Microscopic examination of minerals.

3. Geochemical Techniques

Isotope analysis (Sr, Nd, Pb isotopes), elemental composition.

4. Geochronology

Radiometric dating (U-Pb, Ar-Ar) determines formation ages.

5. Remote Sensing & GIS

Mapping formations using satellite imagery.

Geological Formation vs. Other Stratigraphic Units

Unit Description Relative Scale
Group Several formations Larger
Formation Primary mappable unit Standard
Member Sub-unit within a formation Smaller
Bed Smallest unit (single layer) Very small


References

  1. Salvador, A. (1994). International Stratigraphic Guide. Geological Society of America.
  2. North American Commission on Stratigraphic Nomenclature (2005). North American Stratigraphic Code. AAPG Bulletin.
  3. Blatt, H., Middleton, G., & Murray, R. (1980). Origin of Sedimentary Rocks. Prentice Hall.
  4. Wager, L. R., & Brown, G. M. (1968). Layered Igneous Rocks. W.H. Freeman.
  5. Tucker, M. E. (2001). Sedimentary Petrology: An Introduction to the Origin of Sedimentary Rocks. Blackwell Science.
  6. Winter, J. D. (2010). Principles of Igneous and Metamorphic Petrology. Pearson.

Scientists uncover the secret triggers of ‘impossible’ earthquakes

Stick-slip events in the earth cause damage like this, but limited data from these relatively rare earthquakes makes them difficult to model with machine learning. Transfer learning may provide a path to understanding when such deep faults slip. Credit: Dreamstime

Earthquakes in places like Utah (USA), Soultz-sous-Forêts (France), and Groningen (the Netherlands) seem puzzling to scientists because, according to geological theory, they shouldn’t be possible. In these regions, the shallow layers of the Earth’s crust are thought to behave in a way that strengthens faults when they begin to move. Textbooks suggest that this strengthening effect should prevent earthquakes from happening at all. Yet, tremors still occur in these supposedly stable zones. Researchers from Utrecht University set out to understand why. Their findings, recently published in Nature Communications, reveal that faults which have remained inactive for millions of years can accumulate extra stress over time. Eventually, that built-up pressure may be released in a single event. This insight is crucial for identifying safer areas for technologies such as geothermal energy extraction and underground energy storage.

“Faults can be found almost everywhere. Faults in the shallow subsurface are usually stable, so we do not expect shock movements to occur along them,” explains Dr. Ylona van Dinther, who led the study. Yet, surprisingly, seismic activity does take place within the first few kilometers beneath the surface — precisely where the ground is considered most stable. These shallow earthquakes are often linked to human activities such as drilling, extraction, or fluid injection. The question, then, is why faults that normally grow stronger when they move can suddenly weaken and slip, releasing energy as an earthquake.

Inactive faults and slow healing

Many human-induced earthquakes occur along ancient, inactive faults that have not shifted for millions of years. Although these faults remain still, the surfaces where the rocks meet slowly “heal” over time, becoming stronger. This gradual strengthening creates additional resistance. When that resistance is finally overcome, it can cause an abrupt acceleration along the fault. That acceleration produces an earthquake, even in regions that geological models label as stable.

Because areas like these have no long-term record of seismic activity, local communities are often unprepared. Buildings and infrastructure are not designed to handle the shaking. “Furthermore, these earthquakes take place at a depth where human activities occur, in other words, no more than several kilometres deep. That is considerably less deep than the majority of natural earthquakes.” This shallowness means that such quakes can cause more noticeable and potentially damaging ground movement.

One-time events that stabilize over time

Interestingly, the Utrecht team found that these earthquakes are one-off events. Once the accumulated stress is released, the fault settles into a new, more stable state. “As a result, there is no more earthquake activity at that spot,” says Van Dinther. “This means that, although the subsurface in such areas will not settle immediately after human operations stop, the strength of the earthquakes — including the maximum expected magnitude — will gradually decrease.” When a fault strengthens as it moves, its broken sections can slide more easily past one another afterward, acting as natural barriers that prevent larger earthquakes from forming. This means the overall risk can be revised downward, since the potential for stronger quakes diminishes once the fault has slipped.

Implications for sustainable subsurface use

The research has significant consequences for how we use and manage the Earth’s subsurface. It shows that even in regions considered geologically stable, earthquakes can occur under certain conditions — but only once per fault. After the initial event, the area tends to become more secure. Understanding how faults behave, how they “heal,” and what causes them to accelerate or slow down is essential for minimizing seismic risks associated with geothermal energy, carbon storage, and similar technologies. With new computational models, Utrecht University researchers are already working to refine these predictions and improve how one-time earthquake risks are communicated.

Reference:
Meng Li, Andre R. Niemeijer, Ylona van Dinther. Frictional healing and induced earthquakes on conventionally stable faults. Nature Communications, 2025; 16 (1) DOI: 10.1038/s41467-025-63482-3

Note: The above post is reprinted from materials provided by Utrecht University.

Earth is slowly peeling its continents from below, fueling ocean volcanoes

After five decades of dormancy, the Cumbre Vieja volcano on La Palma in the Canary Islands began erupting on Sept. 19, 2021. This image is from October 2021. Credit: Credit: Esteban Gazel/Provided

Earth scientists have uncovered a slow and surprising process beneath our planet’s surface that helps fuel volcanic activity in the oceans.

Researchers from the University of Southampton found that fragments of continents are gradually stripped away from below and drawn into the oceanic mantle — the hot, mostly solid layer beneath the sea floor that slowly circulates. Once there, this continental material can power volcanic eruptions for tens of millions of years.

This discovery resolves a long-standing geological puzzle: why certain ocean islands located far from tectonic plate boundaries contain chemical signatures that look distinctly continental, even though they lie in the middle of vast oceans.

The study, published in Nature Geoscience, was conducted by an international team from the University of Southampton, GFZ Helmholtz Centre for Geosciences in Potsdam, the University of Potsdam, Queen’s University (Canada), and Swansea University.

Ancient chemical clues deep within the mantle

Ocean islands such as Christmas Island in the northeast Indian Ocean often contain unusually high concentrations of certain “enriched” elements that typically come from continents. Scientists have compared this mixing process to the motion of a cake mixer folding in older, recycled ingredients from deep within the Earth.

For years, geologists assumed these enriched elements came from ocean sediments pulled into the mantle when tectonic plates sink, or from columns of rising hot rock known as mantle plumes.

However, those explanations have limits. Some volcanic regions lack evidence of recycled crust, while others seem too shallow and cool to be driven by deep mantle plumes.

“We’ve known for decades that parts of the mantle beneath the oceans look strangely contaminated, as if pieces of ancient continents somehow ended up in there,” said Thomas Gernon, Professor of Earth Science at the University of Southampton and the study’s lead author. “But we haven’t been able to adequately explain how all that continental material got there.”

Continents are peeling from below

The researchers propose a new mechanism: continents not only split apart at the surface but also peel away from below, and across far greater distances than scientists once believed possible.

To test this, the team built computer simulations that recreated how the mantle and continental crust behave when stretched by tectonic forces.

Their results show that when continents begin to break apart, powerful stresses deep within the Earth trigger a slow-moving “mantle wave.” This rolling motion travels along the base of the continents at depths of 150 to 200 kilometers, disturbing and gradually stripping material from their deep roots.

The process happens at an incredibly slow rate — roughly a millionth the speed of a snail. Over time, these detached fragments are carried sideways for more than 1,000 kilometers into the oceanic mantle, where they feed volcanic activity for tens of millions of years.

Study co-author Professor Sascha Brune of GFZ in Potsdam explained, “We found that the mantle is still feeling the effects of continental breakup long after the continents themselves have separated. The system doesn’t switch off when a new ocean basin forms — the mantle keeps moving, reorganizing, and transporting enriched material far from where it originated.”

Clues from the Indian Ocean

To support their model, the team analyzed chemical and geological data from regions such as the Indian Ocean Seamount Province — a chain of volcanic formations that appeared after the breakup of the supercontinent Gondwana over 100 million years ago.

Their findings show that soon after Gondwana split apart, a pulse of magma unusually rich in continental material erupted to the surface. Over time, this chemical signature gradually faded as the flow of material from beneath the continents diminished. Notably, this happened without the presence of a deep mantle plume, challenging long-held assumptions about the source of such volcanism.

Professor Gernon added: “We’re not ruling out mantle plumes, but this discovery points to a completely new mechanism that also shapes the composition of the Earth’s mantle. Mantle waves can carry blobs of continental material far into the oceanic mantle, leaving behind a chemical signature that endures long after the continents have broken apart.”

The research also builds on the team’s earlier work showing that these slow, rolling mantle waves can have dramatic effects deep inside continents. Their previous studies suggest that such waves may help trigger diamond eruptions and even reshape landscapes thousands of kilometers away from tectonic boundaries.

Reference:
T. M. Gernon, S. Brune, T. K. Hincks, M. R. Palmer, C. J. Spencer, E. J. Watts, A. Glerum. Enriched mantle generated through persistent convective erosion of continental roots. Nature Geoscience, 2025; DOI: 10.1038/s41561-025-01843-9

Note: The above post is reprinted from materials provided by University of Southampton.

Related Articles