Home Blog Page 2

New model finds complex earthquake patterns of the Phlegraean Fields near Naples

View of Naples from the Hermitage of Camaldoli with Mt. Vesuvius, Gulf of Naples, Sorrento Peninsula and the Eastern edge of Campi Flegrei. Taken while setting up measuring stations. Credit: Simone Ceska, GFZ

The Phlegraean Fields volcanic complex, located beneath the metropolitan area of Naples—a city of 900,000 inhabitants in Italy—has been rising increasingly since 2005, accompanied by a growing number of small earthquakes. This development has been attracting increasing attention in the densely populated region for years. Although such phases of uplift and subsidence have occurred there for over a thousand years, the relationship between ground uplift and seismic activity is complex and not yet fully understood.

A recent study in the journal Communications Earth and Environment now shows that the long-term trend in earthquake activity can be well explained by combining changes in stress within Earth’s crust with the friction behavior of geological faults. The additionally observed swarms of earthquakes can be explained, at least in part, by interactions between individual earthquakes and successfully modeled as superimposed sequences of aftershocks.

The research team led by PD Dr. Sebastian Hainzl from the GFZ Helmholtz Centre for Geosciences has successfully replicated the observed earthquake patterns of recent decades by combining long- and short-term modeling approaches. To this end, they analyzed earthquake catalogues and elevation measurements dating back to around 1905. A test showed that the model is also suitable for short-term, probabilistic predictions, particularly regarding the expected earthquake rate and maximum magnitude over periods ranging from weeks to months. The study thus provides an important new tool for better assessing seismic hazard in the Campi Flegrei area.

Uplift cycles in Campi Flegrei

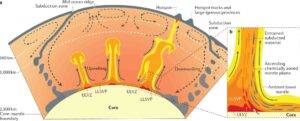
Beneath the conurbation of the 900,000-strong metropolis of Naples lies a complex magmatic system comprising various reservoirs in Earth’s crust and upper mantle. For centuries, magmatic and hydrothermal processes in Campi Flegrei have led to recurring phases of ground uplift and subsidence, which are frequently accompanied by increased seismic activity. Occasionally, these cycles culminate in volcanic eruptions that form new maars or cones. The last eruption occurred in 1538 at Monte Nuovo following uplift phases between 1400 and 1536 that resemble the current situation.

Since 2005, the ground has been rising again, by more than a meter so far, accompanied by an accelerating rate of shallow earthquakes, which is causing concern given the dense population. Similar phases of uplift also occurred in the 20th century—particularly in the years 1950–52, 1969–72 and 1982–84. In some cases, these even led to evacuation measures due to the increased seismic activity.

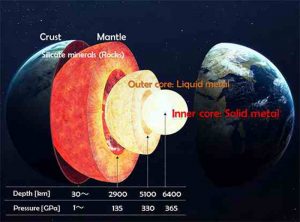
The long-term phenomenon of land uplift and seismicity is attributed to the increase in pressure within a gas-rich reservoir at a depth of 3–4 kilometers, rather than to magma intrusion.

New study examines the seismicity patterns of the region

In their latest study, PD Dr. Hainzl, a researcher in GFZ Section 2.1 “Physics of Earthquakes and Volcanoes,” Prof. Dr. Torsten Dahm, head of the same section, and Dr. Anna Tramelli from the Italian Istituto Nazionale di Geofisica e Vulcanologia (INGV), investigated the cause of the distinctive seismicity patterns in the region. Their analysis is based on modeling the data from earthquake catalogues and surface deformation.

The latter originates from long-term leveling measurements dating back to 1905, as well as from short-term data from the RITE GPS station located at the same site. The seismicity data are drawn from various earthquake catalogues: since 2005 from the local catalogue of duration magnitudes provided by the Observatorio Vesuviano; over a longer timescale from the HORUS catalogue of homogenized moment magnitudes for earthquakes in Italy since 1960.

To investigate the mechanisms behind the observed phenomena, the research team compared and combined various modeling approaches.

Long-term developments: Ground uplift and earthquakes

The study shows that seismic activity in the Campi Flegrei is closely linked to ground uplift. However, the earthquake rate is not simply proportional to the uplift rate; since 2005, it has shown a distinctly nonlinear, accelerated response. The researchers demonstrate that while the Kaiser effect, known from rock mechanics, explains the fundamental relationship between uplift and seismicity over the last 100 years, it is not sufficient for a detailed description. The continuously accelerating seismic activity, i.e. the nonlinear relationship between uplift and seismicity, can instead be explained by the friction and fracture behavior known from laboratory experiments. This is where the so-called RS model (Rate-and-State model) comes into play.

Short-term developments: Earthquake swarms

While the long-term seismicity trend correlates with uplift and can be explained by stress build-up in the rock, this does not apply to the swarm earthquakes observed on a short timescale. These swarms do not correlate with land uplift and are likely linked to episodic fluid intrusions and earthquake interactions.

“We were able to show for the first time that these earthquake swarms can be explained, at least in part, by interactions between individual events and that they possess typical characteristics of tectonic aftershock sequences,” explains Hainzl.

The standard model for the statistical description of earthquake interactions is the so-called Epidemic-Type Aftershock Sequence Model (ETAS).

Innovative modeling approach: Combination of two models

To capture both the physics of long-term stress-induced changes and the statistical characteristics of short-term earthquake clustering, the researchers combined the RS model for describing the time-dependent background rate with the ETAS earthquake interaction model for the earthquake swarms.

“With this combination, we were able to successfully model the long-term occurrence of the observed larger earthquakes with magnitudes M>3 since 1960, as well as the more detailed observations of activity with smaller magnitudes M>0.5 since 2005,” summarizes Hainzl.

Forecasting tests based on historical data show that the developed combined model enables probabilistic short-term forecasts of earthquake rates and maximum magnitudes. “This hybrid modeling approach therefore represents a promising tool for improving seismic hazard assessment in Campi Flegrei and possibly also in other volcanic systems,” says Hainzl.

Reference:
Sebastian Hainzl et al, A deformation-driven earthquake interaction model for seismicity at Campi Flegrei, Communications Earth & Environment (2026). DOI: 10.1038/s43247-026-03296-3

Note: The above post is reprinted from materials provided by GFZ Helmholtz Centre for Geosciences

Geodynamo Theory: How Earth’s Core Creates the Magnetic Field

Illustration of the dynamo mechanism that generates the Earth's magnetic field: convection currents of fluid metal in the Earth's outer core, driven by heat flow from the inner core, organized into rolls by the Coriolis force, generate circulating electric currents, which supports the magnetic field.Credit: Andrew Z. Colvin/wikipedia
Illustration of the dynamo mechanism that generates the Earth’s magnetic field: convection currents of fluid metal in the Earth’s outer core, driven by heat flow from the inner core, organized into rolls by the Coriolis force, generate circulating electric currents, which supports the magnetic field.
Credit: Andrew Z. Colvin/wikipedia

The Geodynamo Theory: How Liquid Iron Circulation Generates the Magnetic Field

The Geodynamo theory explains how Earth generates and sustains its magnetic field through the motion of electrically conductive liquid iron within the outer core. Unlike a permanent bar magnet, Earth’s magnetic field is a dynamic, self-sustaining electromagnetic phenomenon driven by fluid motion, rotation, heat transfer, and magnetohydrodynamics (MHD).

Understanding the geodynamo requires integrating core composition, thermodynamics, fluid mechanics, and electromagnetic theory. For students and geologists, the geodynamo is a cornerstone concept linking deep Earth physics to plate tectonics, mantle convection, and planetary habitability.

Structure of Earth’s Core — The Physical Setting of the Geodynamo

Inner Core vs Outer Core

Earth’s core consists of:

  • Solid inner core (~1,220 km radius)
  • Liquid outer core (~2,260 km thick)

The outer core is composed primarily of molten iron (Fe) alloyed with light elements such as sulfur, oxygen, silicon, or hydrogen. Its liquid state is essential to the geodynamo process.

The magnetic field is generated specifically in the liquid outer core, where fluid motion enables electrical current circulation.

Fundamental Requirements of the Geodynamo Theory

For a planetary magnetic field to form via dynamo action, three conditions must be met:

1. Electrically Conductive Fluid

Liquid iron is an excellent electrical conductor. Under core conditions (~3,000–4,000 K and >130 GPa), electrical conductivity is sufficiently high to sustain induced currents.

2. Energy Source Driving Convection

Convection in the outer core is driven by:

  • Thermal convection: heat escaping from the core into the mantle
  • Compositional convection: light elements expelled during inner core solidification

These buoyancy forces cause fluid iron to rise and sink.

3. Planetary Rotation

Earth’s rotation introduces the Coriolis force, organizing convective flow into columnar structures aligned with the rotation axis. This rotational control stabilizes large-scale magnetic field generation.

How Liquid Iron Motion Generates a Magnetic Field

Electromagnetic Induction

According to Faraday’s law of induction, moving conductive fluid within an existing magnetic field generates electrical currents. These currents, in turn, produce new magnetic fields.

If the flow configuration is favorable, this feedback process sustains and amplifies the magnetic field — a process known as self-exciting dynamo action.

Magnetohydrodynamics (MHD)

The geodynamo operates under the principles of magnetohydrodynamics, which describe the interaction between magnetic fields and conductive fluids.

The governing equation combines:

  • Maxwell’s equations (electromagnetism)
  • Navier–Stokes equations (fluid dynamics)

In simplified form, the magnetic induction equation is:

∂B/∂t=∇×(v×B)+η∇2B

Where:

B = magnetic field
v = fluid velocity
η = magnetic diffusivity

If convective advection exceeds magnetic diffusion, the dynamo sustains itself.

The Role of Inner Core Solidification

Latent Heat Release

As Earth cools, the inner core grows by solidifying from the liquid outer core. This process releases:

  • Latent heat
  • Gravitational energy

Both contribute to maintaining convection.

Compositional Buoyancy

When iron crystallizes, lighter elements are excluded and released into the outer core. This chemical differentiation enhances buoyancy-driven convection — a key driver of the geodynamo.

Magnetic Field Structure and Dipole Behavior

Dipole Dominance

Earth’s magnetic field resembles a dipole aligned approximately with the rotation axis. However, this dipole fluctuates in intensity and orientation.

Secular Variation

The magnetic field changes continuously over decades to centuries due to dynamic outer core flow.

Geomagnetic Reversals

The geodynamo occasionally undergoes polarity reversals, where magnetic north and south switch positions. These reversals reflect changes in flow patterns within the outer core.

Heat Flow and Core–Mantle Boundary Interaction

Heat escaping from the core into the mantle regulates convection strength.

Regions of higher heat flux at the core–mantle boundary (CMB) can influence:

  • Flow symmetry
  • Magnetic field morphology
  • Long-term stability of the dipole

Thus, mantle convection indirectly affects the geodynamo.

Energy Budget of the Geodynamo

Sustaining the geodynamo requires balancing:

  • Thermal energy output
  • Electrical dissipation
  • Viscous dissipation

Recent studies indicate that both thermal and compositional convection are necessary to maintain the present magnetic field over billions of years.

Why the Geodynamo Is Essential for Life

Earth’s magnetic field:

  • Shields the atmosphere from solar wind stripping
  • Reduces radiation exposure
  • Protects surface water

Without a sustained geodynamo, atmospheric erosion could resemble conditions on Mars.

Modern Methods for Studying the Geodynamo

Geoscientists investigate the geodynamo using:

  • Numerical MHD simulations
  • Paleomagnetic records
  • High-pressure experiments on iron alloys
  • Seismic imaging of core structure

These approaches constrain:

  • Outer core flow speed
  • Magnetic diffusion rates
  • Inner core growth history

Open Questions in Geodynamo Research

Despite strong theoretical support, major questions remain:

  • What was the exact onset time of inner core solidification?
  • How do LLSVPs influence core heat flux?
  • What controls reversal frequency?
  • How stable is the dipole over geological timescales?

These questions sit at the intersection of inner core physics, mantle dynamics, and planetary evolution.

References

  1. Roberts, P. H., & King, E. M. (2013). On the genesis of the geodynamo. Reports on Progress in Physics, 76, 096801.
  2. Glatzmaier, G. A., & Roberts, P. H. (1995). A three-dimensional self-consistent computer simulation of a geomagnetic field reversal. Nature, 377, 203–209.
  3. Olson, P., Christensen, U. R., & Glatzmaier, G. A. (1999). Numerical modeling of the geodynamo. Journal of Geophysical Research, 104, 10383–10404.
  4. Pozzo, M., Davies, C., Gubbins, D., & Alfè, D. (2012). Thermal and electrical conductivity of iron at Earth’s core conditions. Nature, 485, 355–358.
  5. Buffett, B. A. (2000). Earth’s core and the geodynamo. Science, 288, 2007–2012.
  6. Labrosse, S. (2015). Thermal and compositional stratification of the inner core. Comptes Rendus Geoscience, 347, 13–21.

Seismic Tomography: Visualizing Density Anomalies in the Lower Mantle

Earth
Scientists are finding that Earth’s mantle may have generated the planet’s early magnetic field. Credit: Naeblys

Seismic Tomography: Visualizing Density Anomalies in the Lower Mantle

Seismic tomography is the primary geophysical method used to image the internal structure of the Earth by analyzing variations in seismic wave speeds. In the lower mantle—extending from ~660 km depth to the core–mantle boundary at 2,890 km—seismic tomography has revolutionized our understanding of density anomalies, subducted slabs, mantle plumes, and large low-shear-velocity provinces (LLSVPs).

By converting global seismic travel-time data into three-dimensional velocity models, geophysicists can infer temperature variations, compositional heterogeneities, and dynamic mantle flow patterns. Although seismic tomography does not measure density directly, velocity anomalies provide powerful proxies for interpreting deep Earth structure.

Understanding how seismic tomography works—and what it reveals about lower mantle dynamics—is essential for students and geologists investigating mantle convection, plate tectonics, and planetary evolution.

What Is Seismic Tomography? A Definition

Basic Principle

Seismic tomography is analogous to medical CT scanning. Just as X-rays travel at different speeds through tissues of varying density, seismic waves travel at different velocities through rocks depending on their temperature, composition, and phase state.

By analyzing:

  • Travel times of P-waves and S-waves
  • Waveform distortions
  • Amplitude variations

scientists reconstruct 3D velocity structures inside the Earth.

Seismic Wave Types Used in Tomography

P-Waves (Primary Waves)

  • Compressional waves
  • Travel through solids and liquids
  • Sensitive to both elastic modulus and density

S-Waves (Shear Waves)

  • Travel only through solids
  • Particularly sensitive to shear modulus
  • Most useful for imaging lower mantle structure

In lower mantle studies, shear-wave velocity (Vs) anomalies are especially important because they respond strongly to temperature and compositional variations.

From Velocity Anomalies to Density Anomalies

Velocity–Density Relationship

Seismic tomography measures velocity, not density directly. However, mineral physics provides relationships linking:

  • Seismic velocity
  • Temperature
  • Composition
  • Elastic moduli
  • Density

Higher temperatures generally reduce seismic velocities and density, while colder, subducted slabs increase both.

Thermal vs Compositional Effects

Velocity anomalies may result from:

  1. Thermal variations
    – Hot mantle → low velocity → lower density
    – Cold slabs → high velocity → higher density
  2. Compositional heterogeneity
    – Recycled oceanic crust
    – Iron-rich regions
    – Primordial reservoirs

Distinguishing between these causes is a central challenge in interpreting lower mantle tomography.

Structure of the Lower Mantle Revealed by Seismic Tomography

Subducted Slabs Penetrating the Lower Mantle

High-velocity anomalies beneath subduction zones correspond to cold, dense slabs descending into the lower mantle. Tomographic models reveal slabs penetrating to depths of 1,000–2,000 km and sometimes reaching the core–mantle boundary.

This confirms that:

  • Subduction is a whole-mantle process.
  • Cold lithosphere can survive transit through phase transitions at 660 km.

Large Low-Shear-Velocity Provinces (LLSVPs)

Two enormous low-velocity regions dominate the base of the mantle beneath Africa and the Pacific.

These LLSVPs are:

  • 1–3% slower in shear velocity
  • Thousands of kilometers across
  • Likely thermochemical structures

Their margins appear to be preferred sites for mantle plume initiation.

Mantle Plumes

Narrow, low-velocity columns rising from deep mantle regions are interpreted as mantle plumes feeding hotspots such as Hawaii and Iceland.

Although resolution decreases with depth, modern tomography supports plume-like upwellings extending from near the core–mantle boundary to the lithosphere.

Methods of Seismic Tomography

Global Travel-Time Tomography

Uses millions of travel-time measurements from global earthquakes. Provides large-scale images of mantle structure.

Finite-Frequency Tomography

Accounts for wavefront sensitivity, improving resolution compared to ray-theory approaches.

Full-Waveform Inversion

Uses entire seismic waveforms rather than only travel times, producing higher-resolution models of deep mantle structure.

These advances have dramatically improved imaging of lower mantle density anomalies.

Resolution and Limitations of Seismic Tomography

Resolution Constraints

Resolution depends on:

  • Earthquake distribution
  • Seismic station coverage
  • Wave frequency
  • Inversion method

Lower mantle imaging remains less resolved than upper mantle imaging.

Trade-Off Between Temperature and Composition

Because both temperature and composition affect velocity, interpretations require integration with:

  • Geodynamic modeling
  • Mineral physics experiments
  • Geochemical constraints

Tomography alone cannot uniquely determine density variations.

Implications for Mantle Convection and Geodynamics

Whole-Mantle Convection

Tomography supports models of whole-mantle convection, with:

  • Cold slabs descending
  • Hot plumes rising
  • Long-wavelength circulation patterns

Core–Mantle Boundary Dynamics

Low-velocity regions near the core–mantle boundary influence:

  • Heat flux from the core
  • Geodynamo behavior
  • Long-term mantle evolution

Understanding density anomalies in the lower mantle is therefore essential for modeling Earth’s thermal history.

Seismic Tomography and Plate Tectonics

Tomographic images show that present-day subduction zones correlate with deep mantle structures, linking surface tectonics to deep interior processes.

This reinforces the concept that:

  • Plate tectonics is dynamically coupled to mantle convection.
  • Surface geology reflects deep mantle heterogeneity.

Future Directions in Lower Mantle Imaging

Advances expected in the coming decades include:

  • Higher-density global seismic networks
  • Ocean-bottom seismology expansion
  • Machine-learning-assisted inversions
  • Integrated mineral physics–geodynamics models

These developments will refine our understanding of lower mantle density anomalies and their role in Earth evolution.

References

  1. Dziewonski, A. M. (1984). Mapping the lower mantle: Determination of lateral heterogeneity. Journal of Geophysical Research, 89, 5929–5952.
  2. Romanowicz, B. (2003). Global mantle tomography. Science, 301, 1884–1888.
  3. Ritsema, J., Deuss, A., van Heijst, H. J., & Woodhouse, J. H. (2011). S40RTS global seismic model. Geophysical Journal International, 184, 1223–1236.
  4. Garnero, E. J., McNamara, A. K., & Shim, S.-H. (2016). Continent-sized anomalous zones in the lower mantle. Nature Geoscience, 9, 481–489.
  5. Li, C., van der Hilst, R. D., & Engdahl, E. R. (2008). A new global model of P-wave speed variation in Earth’s mantle. Geochemistry, Geophysics, Geosystems, 9, Q05018.
  6. French, S. W., & Romanowicz, B. (2014). Whole-mantle radially anisotropic tomography. Nature, 525, 95–99.

Trace Fossil Ichnology: Reconstructing Ancient Behavior

Trace Fossil
Trace Fossil

Ethological Interpretations of Ichnotaxa: Reconstructing Behavior from Trace Fossils

Trace Fossil Ichnology is the branch of paleontology that studies the physical evidence of biological activity preserved in the rock record. Unlike body fossils, which preserve the remains of organisms, trace fossils (ichnofossils) record behavior—burrowing, crawling, feeding, dwelling, grazing, or resting. The scientific classification of these traces into ichnotaxa allows geologists and paleontologists to reconstruct not the organism itself, but its behavior, environmental setting, and ecological strategy.

Understanding ichnotaxa is fundamental to paleoenvironmental reconstruction, basin analysis, and sequence stratigraphy. In many sedimentary successions where body fossils are rare or absent, trace fossils provide the only direct evidence of life and environmental conditions.

What Is Trace Fossil Ichnology?

Definition of Trace Fossils

Trace fossils are sedimentary structures produced by the life activities of organisms, preserved within or on sedimentary strata. They include:

  • Burrows
  • Tracks and trackways
  • Trails
  • Borings
  • Feeding marks
  • Resting impressions

Importantly, ichnology classifies these traces independently of the organism that produced them. This approach recognizes that similar behaviors may be produced by unrelated organisms, and that behavior—not anatomy—is the preserved feature.

Ichnotaxa — A Behavior-Based Classification System

Why Ichnotaxa Are Independent of Biological Taxonomy

Ichnotaxa are classified based on:

  • Morphology
  • Architectural pattern
  • Wall lining
  • Fill characteristics
  • Relationship to bedding

This means a burrow is named according to its form and structure, not the identity of the tracemaker. For example, Skolithos refers to vertical cylindrical burrows, regardless of whether the organism was a worm, arthropod, or other invertebrate.

This separation between biological taxonomy and ichnotaxonomy prevents misinterpretation when the tracemaker is unknown.

Ethological Categories of Trace Fossils

Ethology—the study of behavior—forms the conceptual foundation of trace fossil interpretation.

Domichnia (Dwelling Structures)

These are permanent or semi-permanent burrows used as living structures. Examples include vertical shafts such as Skolithos, common in high-energy shallow marine environments.

Ethological implication:

  • Organisms adapted to shifting substrates
  • Suspension feeding strategies
  • High-energy coastal settings

Fodinichnia (Feeding Burrows)

Fodinichnia are complex, branching burrow systems formed during deposit feeding. They record systematic exploitation of sediment for organic matter.

Example:

  • Chondrites, associated with low-oxygen environments.

Ethological implication:

  • Sediment mining behavior
  • Low oxygen tolerance
  • Deep-tier infaunal activity

Pascichnia (Grazing Trails)

These traces represent systematic grazing on microbial mats or organic films.

Example:

  • Cruziana, often attributed to trilobite locomotion and feeding.

Ethological implication:

  • Surface deposit feeding
  • Shallow marine environments
  • Controlled locomotion patterns

Repichnia (Locomotion Traces)

Repichnia record simple movement across a substrate without feeding.

Example:

  • Arthropod trackways on tidal flats.

These traces reveal:

  • Directional behavior
  • Substrate consistency
  • Episodic exposure

Cubichnia (Resting Traces)

Resting traces form when organisms temporarily settle on the substrate.

Example:

  • Starfish impressions preserved in fine sediment.

Ethological implication:

  • Low-energy conditions
  • Soft substrate stability

Ichnofacies and Paleoenvironmental Reconstruction

While individual ichnotaxa reflect behavior, ichnofacies represent recurring assemblages of trace fossils linked to specific depositional environments.

The Skolithos Ichnofacies

  • Dominated by vertical burrows
  • High-energy shoreface environments
  • Shifting sandy substrates

The Cruziana Ichnofacies

  • Horizontal feeding traces
  • Moderate-energy marine shelf
  • Stable sediment conditions

The Zoophycos and Nereites Ichnofacies

  • Deep-marine settings
  • Complex feeding strategies
  • Low sedimentation rates

Ichnofacies analysis is a powerful tool for reconstructing paleobathymetry, oxygenation, energy conditions, and sedimentation rates.

Bioturbation and Sedimentary Fabric

Bioturbation Intensity

Bioturbation refers to sediment reworking by organisms. Its intensity affects:

  • Sedimentary structures
  • Porosity and permeability
  • Reservoir quality in hydrocarbon systems

The Bioturbation Index (BI) quantifies the degree of sediment disruption, linking ichnology directly to applied sedimentology.

Trace Fossils as Proxies for Oxygenation

Certain ichnotaxa correlate strongly with oxygen availability.

  • Chondrites → dysoxic to anoxic conditions
  • Thalassinoides → well-oxygenated substrates

Thus, trace fossils serve as proxies for:

  • Redox conditions
  • Nutrient flux
  • Bottom-water circulation

Ichnology in Sequence Stratigraphy

Trace fossil assemblages vary systematically across sequence boundaries:

  • Transgressive surfaces often show increased bioturbation.
  • Maximum flooding surfaces may display specific deep-tier traces.
  • Lowstand deposits may show stressed, low-diversity assemblages.

Thus, trace fossil ichnology supports stratigraphic correlation where body fossils are absent.

Challenges in Ethological Interpretation

Interpreting ichnotaxa requires caution because:

  • Similar morphologies can arise from different organisms.
  • Substrate conditions influence trace morphology.
  • Post-depositional compaction may distort traces.

Modern ichnologists combine:

  • Neoichnology (modern analogs)
  • Sedimentology
  • Geochemistry
  • Experimental studies

to refine behavioral interpretations.

Why Trace Fossil Ichnology Matters Today

Trace fossils are invaluable in:

  • Hydrocarbon reservoir characterization
  • Paleoenvironmental modeling
  • Sequence stratigraphy
  • Marine ecology studies
  • Understanding evolutionary behavior

In many deep-marine or Precambrian successions where body fossils are rare, trace fossils provide the only biological evidence.

References

  1. Seilacher, A. (1967). Bathymetry of trace fossils. Marine Geology, 5, 413–428.
  2. Bromley, R. G. (1996). Trace Fossils: Biology, Taphonomy and Applications. Chapman & Hall.
  3. Buatois, L. A., & Mángano, M. G. (2011). Ichnology: Organism–Substrate Interactions in Space and Time. Cambridge University Press.
  4. Pemberton, S. G., MacEachern, J. A., & Frey, R. W. (1992). Trace fossil facies models. SEPM Short Course Notes.
  5. Ekdale, A. A., Bromley, R. G., & Pemberton, S. G. (1984). Ichnology: The Use of Trace Fossils in Sedimentology and Stratigraphy. SEPM.

Earth’s crust was already on the move 3.5 billion years ago rewriting the origin story of our living planet.

Continental plates around Greenland.
This is a visualization of the continental plates around Greenland. Credit: NASA’s Goddard Space Flight Center

Earth’s history is recorded in its tectonic plates. Over billions of years, their movement has shaped continents, opened oceans, and created the climates and environments that allowed life to emerge and evolve.

Yet one fundamental question has remained unresolved. When did these plates actually begin to move? Did Earth’s outer shell start shifting soon after the planet formed 4.5 billion years ago, or did this process begin much later?

A new study from Harvard geoscientists offers the clearest answer yet. Published March 19 in Science, the research provides the oldest direct evidence of plate movement, dating back 3.5 billion years. The findings show that early plate motion, even if different from today’s system, played a role in shaping the young planet.

“There has been a huge range of ages suggested for timing,” said lead author Alec Brenner, PhD ’24, who conducted the research in the Department of Earth and Planetary Sciences (EPS) in the Harvard University Kenneth C. Griffin Graduate School of Arts and Sciences. “With this study, we’re able to say three and a half billion years ago, we can see plates moving around on the Earth surface.”

Ancient Rocks Reveal Early Earth in Motion

The breakthrough comes from some of the oldest well-preserved rocks on Earth, found in the Pilbara Craton of western Australia. These rocks formed during the Archean Eon, a time when early microbial life existed and the planet experienced frequent impacts from space.

The region also preserves some of the earliest evidence of life, including stromatolites and microbialite formations created by single-celled organisms such as cyanobacteria.

The research team, led by Roger Fu, Professor of Earth and Planetary Sciences at Harvard University, has been studying East Pilbara since 2017. Fu specializes in paleomagnetism, which uses records of Earth’s magnetic field preserved in rocks to reconstruct the planet’s past. In earlier work, the group also identified signs of an ancient meteor impact at the same site.

Using Ancient Magnetism as a Geological GPS

Paleomagnetism allows scientists not only to study Earth’s magnetic field but also to track how pieces of the crust have moved over time. Tiny magnetic signals locked inside mineral grains act like a record of where the rocks formed on the planet.

By analyzing these signals, researchers can determine both the orientation and latitude of rocks when they formed, effectively turning them into a kind of ancient GPS.

“Almost everything unique about the Earth has something to do with plate tectonics at some level,” said Fu. “At some point, the Earth went from something not that special, just another planet in the solar system with similar materials, to something very special. A very strong suspicion is that plate tectonics started Earth down this divergent track.”

Massive Rock Analysis Reveals Plate Drift

To investigate, the team studied more than 900 rock samples from over 100 locations in an area known as the North Pole Dome.

They drilled cylindrical “cores” from the rocks using specialized equipment, carefully recording each sample’s position with tools including a compass and goniometer (a device for measuring angles).

Back in the lab, the cores were sliced into thin sections and analyzed with a highly sensitive magnetometer capable of detecting signals far weaker than a compass needle. The samples were gradually heated to temperatures up to 590 degrees Celsius to separate magnetic signals from different periods in their history. The full analysis took about two years.

“We took a really big gamble,” said Brenner, now a postdoc at Yale. “Demagnetizing thousands of cores takes years. And boy, did it pay off! These results were beyond our beyond our wildest dreams.”

Evidence of Movement 3.5 Billion Years Ago

In magnetic minerals, the alignment of electrons acts like a tiny compass pointing toward Earth’s magnetic pole. This alignment also reveals where the rock was located on the planet when it formed, including its latitude.

By examining rocks spanning about 30 million years shortly after 3.5 billion years ago, the researchers found that part of the East Pilbara region shifted in latitude from 53 degrees to 77 degrees — a drift of tens of centimeters annually over several million years — and rotated clockwise by more than 90 degrees. (Because the magnetic pole occasional reverses, it remains uncertain whether this motion occurred in the northern or southern hemisphere.) After roughly 10 million years, the movement slowed and eventually stabilized.

For comparison, the team looked at rocks from the Barberton Greenstone Belt in South Africa. Earlier studies showed that this region stayed near the equator and remained mostly stationary during the same period. This suggests different parts of Earth’s crust were moving in distinct ways.

Today, tectonic plates still move, though slowly. For example, the North American and Eurasian plates are separating at about 2.5 centimeters, or 1 inch, per year.

Rethinking How Plate Tectonics Began

Scientists are still trying to determine exactly when and how Earth developed its modern system of plate tectonics, known as an “active lid.” Some theories propose that early Earth had a “stagnant lid” (a single unbroken global plate), a “sluggish lid” (slowly moving plates), or “episodic lid” (plates moving sporadically).

This study rules out the stagnant lid idea, showing that Earth’s surface was already divided into moving pieces. However, it does not yet distinguish which type of early plate behavior was dominant. Further research is underway to resolve this question.

“We’re seeing motion of tectonic plates, which requires that there were boundaries between those plates and that the lithosphere wasn’t some big, unbroken shell across the globe, as a lot of people have argued before,” said Brenner. “Instead, it was segmented into different pieces that could move with respect to each other.”

Oldest Magnetic Flip Ever Detected

The researchers also identified the oldest known geomagnetic reversal, a process in which Earth’s magnetic field flips so that a compass would point south instead of north.

This flipping is thought to be driven by the “dynamo action” of molten iron circulating in Earth’s core, which generates electrical currents and magnetic fields. The most recent reversal occurred about 780,000 years ago.

According to Fu, the new findings suggest that such reversals happened less often 3.5 billion years ago than they do today. “It’s not by itself conclusive, but it suggests that maybe the dynamo was in a slightly different regime than today,” he said.

Reference:
Alec R. Brenner, Roger R. Fu, Bradford J. Foley, Diogo L. Lourenço, Jasmine Palma-Gomez, Zheng Gong, Sarah C. Steele, Joanna Li, David T. Flannery, Adrian J. Brown, Eben B. Hodgin. Paleomagnetic detection of relative plate motions and an infrequently reversing core dynamo at 3.5 Ga. Science, 2026; 391 (6791): 1278 DOI: 10.1126/science.adw9250

Note: The above post is reprinted from materials provided by Harvard University. Original written by Kermit Pattison.

New method for early warning of volcanic eruptions

Eruption of the Piton de la Fournaise on La Réunion on July 31, 2015. (Photo: A. Peltier / OVPF-IPGP)

Predicting volcanic eruptions early enough to warn authorities and nearby communities remains one of the biggest challenges in volcanology. A study published in Nature Communications describes a new detection technique called “Jerk,” developed by researchers and engineers from the Institut de Physique du Globe de Paris (IPGP) and the GFZ Helmholtz Centre for Geosciences. The method relies on a single broadband seismometer to detect extremely subtle ground movements linked to magma intrusions deep underground.

These faint signals can reveal the earliest stages of volcanic activity in real time. The research team tested the method for ten years at a volcanological observatory on the island of La Réunion. During that period, the system successfully forecast 92 % of the 24 eruptions that occurred between 2014 and 2023. Warning times ranged from just a few minutes to as much as eight hours before an eruption began. About 14 % of the alerts did not result in eruptions. However, those alerts still detected magma movements beneath the volcano. Because it requires relatively little equipment, the Jerk system could become an important early warning tool, particularly for volcanoes that are not closely monitored.

Why Predicting Volcano Eruptions Is Difficult

Volcanoes often show warning signs before erupting. These may include increased seismic activity, deformation of the ground, and changes in volcanic gas emissions or composition. While these signals are well known, accurately interpreting them remains difficult. Scientists still struggle to determine exactly when an eruption will occur, how long it will last, and how powerful it might be.

False alarms also pose a serious problem. Incorrect warnings can cause costly evacuations, economic disruption, and public distrust of monitoring systems. As a result, improving the reliability of eruption forecasts is a major goal for scientists studying volcanic hazards.

Detecting Subtle Ground Motion From Rising Magma

Many previous approaches to eruption forecasting rely on probabilistic analysis, meaning they search for statistical relationships in large sets of monitoring data. In contrast, the new approach developed by a team led by Dr. François Beauducel from the Institut de Physique du Globe de Paris and Dr. Philippe Jousset from the GFZ Helmholtz Centre for GeoResearch in Potsdam focuses on directly detecting physical signals associated with magma movement.

The “Jerk” method identifies extremely small ground motions that occur when magma intrudes into the crust. These signals appear as very low frequency transients i.e. impulse like transition or settling signals recorded in horizontal ground motion, including both acceleration and tilt. According to the researchers, these signals likely originate from dynamic rock fracturing processes that take place before an eruption.

Scientists first identified these signals more than a decade ago while analyzing extensive datasets from previous eruptions of the Piton de la Fournaise volcano on La Réunion. The signals are extraordinarily small, measuring only a few nanometers per second cubed (nm/s3). Even so, they can be detected with a single very broadband seismometer.

The system includes specialized data processing that i.e. corrects for factors such as Earth tides. When the characteristic signal exceeds a certain threshold, the automated system immediately issues an alert.

A Decade of Real Time Volcano Monitoring

The system was installed in April 2014 at the Piton de la Fournaise volcanological observatory operated by the Institut de Physique du Globe de Paris (IPGP) of the Université Cité Paris (OVPF-IPGP, Reunion Island). The tool functions as an automated component of the WebObs monitoring system and uses data from a broadband seismological station belonging to the global Geoscope network located 8 km from the volcano summit (Rivière de l’Est).

The first alert occurred on June 20, 2014. The system issued a warning 1 hour and 2 minutes before the eruption began.

Over the following decade, the Jerk detection system operated continuously. It generated automatic alerts for 92% of the 24 eruptions recorded between 2014 and 2023. Depending on the event, warnings were issued anywhere from a few minutes to 8.5 hours before magma reached the surface.

Piton de la Fournaise is one of the most heavily monitored volcanoes in the world, making it an ideal location for testing the new method. Scientists were able to confirm Jerk alerts using other monitoring indicators, including seismicity, ground deformation, and volcanic gas measurements. These independent observations verified that magma intrusions had taken place and that the probability of an eruption was high. The system was also evaluated using historical data from 24 eruptions between 1998 and 2010, where the Jerk signal consistently appeared before eruptive events.

“The great originality of this work lies in the fact that the Jerk method was tested and validated in real time in an automatic and unsupervised manner for more than 10 years, and not in post-processing of data as is the case in the vast majority of studies of eruptive precursors published in the literature,” explains Dr. Philippe Jousset, co-author of the study and scientist in GFZ-Section 2.2 Geophysical Imaging.

Understanding False Positive Alerts

Although the system performed well overall, some alerts did not lead to eruptions. These “false positives” occurred in 14 % of the cases when the system raised an alarm. However, further analysis showed that these events were not random errors. Instead, they corresponded to genuine magma intrusions that did not ultimately produce eruptions. Scientists sometimes refer to these events as “aborted eruptions.”

Additional observations such as seismic activity, ground deformation, and volcanic gas measurements confirmed the presence of magma beneath the volcano during these alerts. “In addition to the effectiveness of the Jerk alert for eruptions, the tool proves to be a perfect and unequivocal detector of magmatic intrusions,” resumes Philippe Jousset.

A recent example occurred during a seismic crisis at Piton de la Fournaise on December 5, 2025. Alongside small deformation changes and gas anomalies, scientists recorded a weak Jerk signal measuring only 0.1 nm/s3. This signal confirmed that magma had intruded beneath the volcano.

Testing the Method on Other Volcanoes

After more than a decade of continuous real time monitoring on La Réunion, researchers believe the Jerk system could serve as a practical early warning tool for other volcanoes, particularly those with limited monitoring infrastructure.

The team plans to expand testing of the method to additional active volcanoes. One of the first targets will be Mount Etna in Italy. The project “POS4dyke” will deploy a new network of broadband seismometers from the GIPP Geophysical Instrumental Pool of Potsdam to detect Jerk signals. Installation is expected to begin in 2026 in collaboration with the INGV (Italy).

The work will also connect with the SAFAtor project, which is exploring how optic fibre cables can be used to improve early warning systems for earthquakes and volcanic eruptions. Together, these efforts could significantly enhance scientists’ ability to detect and forecast volcanic activity around the world.

Reference:
François Beauducel, Geneviève Roult, Valérie Ferrazzini, Aline Peltier, Philippe Jousset, Patrice Boissier, Nicolas Villeneuve. Jerk, a promising tool for early warning of volcanic eruptions. Nature Communications, 2025; 16 (1) DOI: 10.1038/s41467-025-66256-z

Note: The above post is reprinted from materials provided by GFZ Helmholtz-Zentrum für Geoforschung.

Impact-formed glass evidence of cosmic collision in Brazil about 6 million years ago

Some examples of “geraisites,” named after the state of Minas Gerais where they were found, in their different forms (photo: Álvaro Penteado Crósta/IG-UNICAMP)

Scientists have identified Brazil’s first known field of tektites, the glassy material created when an asteroid or other extraterrestrial object strikes Earth with extreme force. These newly recognized specimens, called geraisites after the state of Minas Gerais where they were first found, form a previously unknown strewn field. The discovery helps fill gaps in South America’s incomplete record of ancient impact events.

The findings were detailed in the journal Geology by a research team led by Álvaro Penteado Crósta, a geologist and senior professor at the Institute of Geosciences at the State University of Campinas (IG-UNICAMP). The project involved collaborators from Brazil, Europe, the Middle East, and Australia.

Before this discovery, only five major tektite fields were known worldwide, located in Australasia, Central Europe, the Ivory Coast, North America, and Belize. The Brazilian field now joins this rare group.

A 900 Kilometer Strewn Field of Impact Glass

The geraisites were first documented in three municipalities in northern Minas Gerais — Taiobeiras, Curral de Dentro, and São João do Paraíso — across an area about 90 kilometers long. After the study was submitted, additional finds were reported in Bahia and later in Piauí. As a result, the total known distribution now stretches more than 900 kilometers.

“This growth in the area of occurrence is entirely consistent with what is observed in other tektite fields around the world. The size of the field depends directly on the energy of the impact, among other factors,” Crósta explains.

By July 2025, researchers had collected about 500 pieces. With more recent discoveries, that total now exceeds 600. The fragments vary widely in size, from less than 1 gram to 85.4 grams, and can measure up to 5 centimeters along their longest dimension. Their forms match the aerodynamic shapes typical of tektites, including spheres, ellipsoids, droplets, disks, dumbbells, and twisted shapes.

What the Geraisites Look Like

At first glance, the geraisites appear black and opaque. Under strong light, however, they become translucent with a grayish green hue. This shade differs from the brighter green moldavites of Europe, which have been used in jewelry since the Middle Ages. The surfaces of the Brazilian specimens are pitted with small cavities.

“These small cavities are traces of gas bubbles that escaped during the rapid cooling of the molten material as it traveled through the atmosphere, a process also observed in volcanic lava but especially characteristic of tektites,” says Crósta.

Chemical Clues Confirm Impact Origin

Laboratory analysis shows that the geraisites contain high levels of silica (SiO2), ranging from 70.3% to 73.7%. Sodium (Na2O) and potassium (K2O) oxides together account for 5.86% to 8.01%, slightly higher than what is seen in other tektite regions. Trace elements such as chromium (10-48 parts per million) and nickel (9-63 ppm) vary in small amounts, suggesting the original target rock was not uniform. Researchers also detected rare inclusions of lechatelierite, a high temperature glassy silica that forms during extreme heating, further confirming an impact origin.

“One of the decisive criteria for classifying the material as a tektite was its very low water content, as measured by infrared spectroscopy: between 71 and 107 ppm. For comparison, volcanic glasses, such as obsidian, usually contain from 700 ppm to 2% water, whereas tektites are notoriously much drier,” Crósta points out.

Dating the Ancient Asteroid Impact

Argon isotope dating (⁴⁰Ar/³⁹Ar) indicates the impact occurred around 6.3 million years ago, near the end of the Miocene epoch. Three closely grouped age results were obtained (6.78 ± 0.02 Ma, 6.40 ± 0.02 Ma, and 6.33 ± 0.02 Ma), supporting the conclusion that they came from a single event.

“The age of 6.3 million years should be interpreted as a maximum age since some of the argon may have been inherited from the ancient rocks targeted by the impact,” the researcher comments.

The Search for a Missing Crater

No crater linked to the impact has yet been identified. According to Crósta, this is not unusual. Only three of the six major classical tektite fields have confirmed craters. In the case of the vast Australasia field, the crater is thought to lie beneath the ocean.

Isotopic geochemistry suggests the molten material came from Archean continental crust dating between 3.0 and 3.3 billion years old. That evidence points to the São Francisco craton, one of the oldest and most stable regions of South America’s continental crust.

“The isotopic signature indicates a very ancient continental, granitic source rock. This greatly reduces the universe of candidate areas,” says Crósta.

Future surveys using magnetic and gravimetric techniques could detect circular underground structures that mark a buried or eroded crater.

Estimating the Size of the Impact

Researchers cannot yet determine the exact size of the object that struck Earth, but they believe it was not small. The volume of melted rock and the broad distribution of debris indicate a powerful event, though likely less intense than the impact that created the enormous Australasia field, which spans thousands of kilometers.

The team is developing mathematical models to estimate the impact’s energy, entry speed, trajectory angle, and total volume of melted material. These calculations will become more refined as additional data on the distribution of geraisites are gathered.

The discovery adds an important chapter to South America’s impact history. Only about nine large impact structures are currently known on the continent, most of them much older and located in Brazil. The findings also suggest that tektites may be more widespread than previously recognized, but are sometimes overlooked or mistaken for ordinary glass.

Separating Science From Speculation

To address exaggerated claims about asteroid threats, Crósta works with undergraduate students to manage the Instagram account @defesaplanetaria. The page focuses on science communication and aims to distinguish genuine risks from unfounded speculation about meteorites and asteroids.

Impacts were common in the early solar system, when debris was abundant and planetary orbits were unstable. Large bodies shifted positions, sending smaller objects in many directions. Today, the solar system is far more stable, and major impacts are much less frequent.

“Understanding these processes is essential to separating science from speculation,” the researcher concludes.

Crósta has studied meteorite impact structures since his master’s research project in 1978. Over the years, he has received several grants from FAPESP (08/53588-7, 12/50368-1, and 12/51318-8).

Reference:
Alvaro P. Crósta, Gabriel G. Silva, Ludovic Ferrière, Philippe Nonnotte, Eugen Libowitzky, Fred Jourdan. Geraisite: The first tektite occurrence in Brazil. Geology, 2025; 54 (2): 163 DOI: 10.1130/G53805.1

Note: The above post is reprinted from materials provided by Fundação de Amparo à Pesquisa do Estado de São Paulo.

Sediment core reveals 10,800 years of precipitation history in the Sahara

Lake Yoa in the context of the central Sahara today and during the early Holocene. Credit: Nature (2026). DOI: 10.1038/s41586-026-10336-7

The analysis of a sediment core from an oasis lake in Chad provides new insights into the history of precipitation in the Sahara. The study, led by the University of Cologne, shows that a prolonged wet phase, which lasted from 14,800 to 5,500 years ago, was interrupted by short-term droughts. Such drought events could also occur in a similar manner in the future.

The results are published in the article “Decadal-scale droughts disrupted the African Humid Period in the Sahara” in the journal Nature. In addition to the University of Cologne, research institutions in Germany, France, Belgium, Chad and China contributed to the study through further laboratory analyses and climate modeling.

In the 1970s and 1980s, the Sahara and the adjacent Sahel region experienced a severe drought that led to devastating famines. Precipitation increased significantly in the following decades, attributed to the current global warming, which has caused increased evaporation and a shift in the West African monsoon. The result is a spreading of plants, a phenomenon described by the term “Greening Sahara.”

A green Sahara has occurred frequently in recent Earth history, whenever shifts in Earth’s orbital parameters have led to stronger solar radiation in the Northern Hemisphere and, consequently, higher precipitation in northern Africa. The last of these so-called African Humid Periods occurred between 14,800 and 5,500 years ago. It is known from geological and archaeological data that a savannah existed in the Sahara at that time, with lakes and rivers, a diverse wildlife and flourishing human cultures. However, it was not yet sufficiently understood how stable or unstable the wet period was.

This question has now been answered thanks to a 16-meter-long sediment core that was drilled by geologists from Cologne, in collaboration with partners from Chad, in Lake Yoa, an oasis lake in the center of the Sahara that formed 10,800 years ago. Despite the extreme aridity of the desert, Lake Yoa still exists today because a permanent inflow of groundwater prevents it from drying out. This allowed a continuous sediment sequence to accumulate at the bottom of the lake, the composition of which provides an archive for the climatic and environmental history of the region with unrivaled accuracy.

“The geoscientific analysis of the sediment core has shown for the first time that the last African Humid Period was interrupted at least three times by dry events, around 9,300, 8,200 and 6,300 years ago,” says lead author Dr. Florence Sylvestre from the Institute de Recherche pour le Développement (France). Professor Dr. Martin Melles from the University of Cologne, also lead author, adds, “The reconstructed drought events coincide, at least in part, with times for which archaeological findings indicate deteriorating living conditions for the population at the time.”

A more detailed analysis of the dry event about 8,200 years ago, based on counting the annual layers within the sediment core, revealed that this event at Lake Yoa lasted 77 years, from 8,229 to 8,152 years before present. Climate modeling has shown that it is causally linked to a simultaneous cooling that took place in the North Atlantic. This cooling has been known for some time. It is attributed to a massive inflow of freshwater into the Atlantic due to the draining of a huge ice-dammed lake in North America. This has weakened the oceanic overturning circulation in the Atlantic, including the Gulf Stream.

Oceanographic data indicate that the overturning circulation in the Atlantic is currently weakening as well, although this time the rapidly increasing melting of the ice masses on Greenland as a result of human-made climate change is assumed to be the cause. However, it remains unclear whether history is now repeating itself.

“This is not transferable one-to-one because the boundary conditions today are not comparable with those 8,200 years ago, for example, in terms of greenhouse gas concentrations, the extent of continental glaciation or global sea levels,” says Professor Melles. “But our results show the impact that changes in the Atlantic can have on precipitation in northern Africa, with the speed, magnitude and spatial extent of drought events.”

The researchers therefore conclude that further efforts are needed to predict future precipitation trends in the Sahara with greater precision and reliability.

Reference:
Florence Sylvestre et al, Decadal-scale droughts disrupted the African Humid Period in the Sahara, Nature (2026). DOI: 10.1038/s41586-026-10336-7

Note: The above post is reprinted from materials provided by University of Cologne.

Diamonds are not a geoengineer’s best friend: Carbon impurities provide a reality check

Graphical abstract. Credit: Journal of Aerosol Science (2026). DOI: 10.1016/j.jaerosci.2026.106767

The field of solar geoengineering revolves around the idea of cooling the globe via the injection of aerosols to reflect sunlight or to thin clouds. One such strategy, stratospheric aerosol injection (SAI), aims to mimic the effects of a volcanic eruption. Volcanoes spew sulfur dioxide into the stratosphere, which then reflects light back into space, cooling Earth for potentially a year or longer, as documented in previous eruptions.

But sulfate aerosols are not ideal particles to deploy because of their effects contributing to acid rain, degrading the ozone layer and harming human health. Instead, researchers have used large-scale climate models to run virtual solar geoengineering experiments with different particles that could potentially reflect the sun while causing less harm to the environment. Previous such research pointed to a sparkling alternative: diamond dust.

However, researchers at Washington University in St. Louis, using first-principles calculations that allow them to explore material properties at the atomic and molecular levels, have found it won’t work. Diamond dust from detonation synthesis, the most economical method for large-scale nanodiamond production, could cause an expensive mess, they found.

Such particles inevitably contain residual carbon impurities, typically ranging from 1–5% by mass. Even the most minute carbonaceous impurity in the dust causes further absorption, not reflection, of heat, their research found. It’s now published online in the Journal of Aerosol Science.

WashU researchers provided this analysis using sophisticated simulations for analyzing the composition, size and chemical interactions of synthetic diamond dust aerosols formed using detonation synthesis, thanks to a 2024 grant from the Simons Foundation International.

The research details how the synthesis of diamond dust during the high-temperature detonation process introduces sp2-hybridized impurities that can form a hard carbon shell around the diamond core, enhancing absorption of light rather than reflection. Rajan Chakrabarty, the Harold D. Jolley Professor of Engineering, and Associate Professor Rohan Mishra, along with postdoctoral scholars Joshin Kumar, Gwan-Yeong Jung and Taveen Kapoor, all at the McKelvey School of Engineering, are co-authors on the paper.

Mining diamonds for science would be prohibitively expensive. So scientists generate diamond particles, or nanodiamonds, by detonating an explosive mixture of carbon-containing compounds in a metal chamber, producing diamond “soot.”

And the soot exists on a brown-black continuum of light-absorbing carbonaceous aerosols, said Kumar, the study’s lead author.

“The process of making the diamond dust inevitably introduces carbon impurities that end up absorbing light instead of reflecting it,” Chakrabarty said. This reduces the diamond’s light scattering effect by up to 25%, ultimately making the hypothesis of using a “diamond shield” to cool Earth much less viable.

Previous research identifying diamond dust as a potential SAI candidate found that it would take 5 million tons of those particles into the stratosphere yearly to cool the planet by 1.6 degrees Celsius, and that they would be deployed using high-altitude aircraft to dump the gem particles. What sounds like something out of a James Bond movie may ultimately not be worth the effort, expense and potential risks of it going sideways.

But it’s as important to eliminate candidates for solar geoengineering as it is to find new ones. Thanks to this research, climate scientists can now devote limited time and resources to more promising particles for cooling Earth.

“Investigating impurities in solar geoengineering particles is crucial,” Chakrabarty said. “Unintended chemical contaminants can alter particle reflectivity, catalyze ozone destruction or create unknown atmospheric feedback loops that reduce cooling efficiency and increase environmental risks.”

Reference:
Joshin Kumar et al, Strong light absorption by sp hybridized carbon impurities in diamond dust, Journal of Aerosol Science (2026). DOI: 10.1016/j.jaerosci.2026.106767

Note: The above post is reprinted from materials provided by Washington University in St. Louis.

Lost fossils reveal sea monsters that took over after Earth’s greatest extinction

The ancient marine amphibians Erythrobatrachus (foreground) and Aphaneramma (background) swimming along the coast of what is now far norther Western Australia 250 million years ago. Credit: Pollyanna von Knorring (Swedish Museum of Natural History), edited

About 250 million years ago, a region that is now a harsh desert in remote northwestern Australia lay along the edge of a shallow bay connected to a vast prehistoric ocean. Fossils collected there more than six decades ago and largely overlooked in museum collections are now reshaping scientists’ understanding of how land animals first returned to the sea and spread across the globe.

The end-Permian mass extinction, the most devastating die-off in Earth’s history, struck about 252 million years ago and was followed by extreme global warming. In its aftermath, modern-style marine ecosystems began to take shape at the start of the Age of Dinosaurs (or Mesozoic era). During this critical window, the earliest sea-going tetrapods (limbed vertebrates), including amphibians and reptiles, emerged and quickly became dominant aquatic apex predators. Most fossils of these early marine hunters have been found in the northern hemisphere. Comparable discoveries from the southern hemisphere have been rare and remain poorly documented.

Now, a fresh analysis of 250 million-year-old fossils from the Kimberly region of northern Western Australia reveals a surprisingly diverse group of marine amphibians with unexpected global connections across ancient oceans.

Lost Fossils Rediscovered After 50 Years

Marine amphibian fossils were first uncovered in Australia during expeditions in the 1960s and 1970s. The specimens were divided between museums in Australia and the U.S.A. Research published in 1972 concluded that the material represented a single species, Erythrobatrachus noonkanbahensis. The species was identified from several skull fragments eroding out of rock at Noonkanbah cattle station, east of the remote Kimberly town of Derby.

Over the following decades, the original Erythrobatrachus fossils were misplaced. Their disappearance triggered an international search through museum collections. In 2024, the long-lost specimens were finally located, allowing researchers to reexamine these puzzling marine amphibians with modern techniques.

Early Marine Amphibians After the Permian Extinction

Erythrobatrachus belonged to a group known as trematosaurid temnospondyls. These animals were ‘crocodile-like’ relatives of today’s salamanders and frogs and could reach lengths of up to 2 m. Trematosaurids are especially significant because their fossils appear in coastal rock deposits formed less than 1 million years after the end-Permian mass extinction. As a result, they represent the oldest clearly recognizable group of Mesozoic marine tetrapods.

A closer look at the rediscovered skull fragments revealed an important surprise. The bones once attributed to a single species actually came from at least two different trematosaurids: Erythrobatrachus and a second form belonging to the genus Aphaneramma.

High-resolution 3D scans of the Erythrobatrachus skull indicate it measured about 40 cm long when complete and belonged to a large-bodied predator with a broad head. Aphaneramma was similar in overall size but had a long, narrow snout suited for snapping up small fish. Both species swam through open water in the same environment, yet they likely targeted different prey.

Evidence of Rapid Global Spread

Erythrobatrachus is known only from Australia. In contrast, Aphaneramma fossils have been discovered in rocks of similar age in Svalbard in the Scandinavian Arctic, the Russian Far East, Pakistan, and Madagascar. These findings suggest that some of the earliest Mesozoic marine tetrapods expanded quickly into multiple ecological roles and spread widely across the planet. They may have traveled along the coastlines of interconnected supercontinents during the first two million years of the Age of Dinosaurs.

The study appears in the Journal of Vertebrate Paleontology. The rediscovered Erythrobatrachus fossils are now being returned to Australia. Additional amphibian fossils from the Age of Dinosaurs can be seen at the Swedish Museum of Natural History.

Reference:
Benjamin P. Kear, Nicolás E. Campione, Mikael Siversson, Mohamad Bazzi, Lachlan J. Hart. Revision of the trematosaurid Erythrobatrachus noonkanbahensis confirms a cryptic marine temnospondyl community from the Lower Triassic of Western Australia. Journal of Vertebrate Paleontology, 2026; DOI: 10.1080/02724634.2025.2601224

Note: The above post is reprinted from materials provided by Swedish Museum of Natural History.

This AI app can tell which dinosaur made a footprint

A Jurassic-aged dinosaur footprint from the Isle of Skye, Scotland, displayed in 5 mm contours from a photogrammetric model. Credit: Tone Blakesley

A newly developed app powered by artificial intelligence (AI) is giving scientists and the public a new way to identify dinosaur footprints left behind millions of years ago, according to a recent study. The technology aims to make sense of fossil tracks that have long challenged researchers.

For many years, paleontologists have studied ancient footprints while debating what kinds of animals created them. Some tracks may belong to meat eating predators, others to plant eating dinosaurs, and some have even raised questions about whether early bird species were involved.

Turning Photos Into Instant Analysis

With the new DinoTracker app, researchers and dinosaur fans can upload a photo or drawing of a footprint using a mobile phone and receive an immediate analysis. The app evaluates the shape and structure of the track to estimate which type of dinosaur likely made it.

Fosilized dinosaur footprints offer valuable insight into prehistoric life, helping scientists understand how dinosaurs moved and behaved. However, earlier studies have shown that these tracks are often difficult to interpret because their shapes can be altered over time.

Moving Beyond Traditional Methods

In the past, researchers relied on manually built computer databases that linked specific footprints to specific dinosaurs. Experts note that this approach could introduce bias, especially when the identity of a track was uncertain or disputed.

To address this problem, a research team led by the Helmholtz-Zentrum research centre in Berlin, working with the University of Edinburgh, developed advanced algorithms that allow computers to learn on their own how dinosaur footprints vary in shape.

The AI system was trained on nearly 2,000 real fossil footprints, along with millions of additional simulated examples. These extra variations were designed to reflect realistic changes, such as compression and edge displacement, that occur as footprints are preserved over time.

What the AI Looks For

The model learned to recognize eight key features that distinguish one footprint from another. These included how far the toes spread, where the heel was positioned, how much surface area contacted the ground, and how weight was distributed across different parts of the foot.

After identifying these variations, the system compared new footprints with known fossil examples to predict which dinosaur most likely made the tracks.

When evaluated, the algorithm matched the classifications made by human experts about 90 percent of the time, even for species that are considered controversial or difficult to identify.

Unexpected Links to Birds

One of the most surprising findings came from tracks that are more than 200 million years old. The AI detected striking similarities between some dinosaur footprints and the feet of both extinct and modern birds.

According to the research team, this could mean that birds emerged tens of millions of years earlier than scientists have previously believed. Another possibility is that some early dinosaurs happened to have feet that closely resembled bird feet by coincidence.

New Insights From Scotland

The system also offered new clues about mysterious footprints found on the Isle of Skye in Scotland. These tracks were formed on the muddy edge of a lagoon around 170 million years ago and have puzzled scientists for decades.

The analysis suggests that these footprints may have been left by some of the oldest known relatives of duck-billed dinosaurs, making them among the earliest examples of this group identified anywhere in the world.

Opening Paleontology to Everyone

Researchers say the technology creates new opportunities to study how dinosaurs lived and moved across the Earth. It also gives the public a chance to take part in fossil research by analyzing footprints themselves.

The study was published in PNAS and funded by the innovations pool of the BMBF-Project: Data-X, the Helmholtz project ROCK-IT, the Helmholtz-AI project NorMImag the National Geographic Society and the Leverhulme Trust.

Dr. Gregor Hartmann of Helmholtz-Zentrum research center, said: “Our method provides an unbiased way to recognize variation in footprints and test hypotheses about their makers. It’s an excellent tool for research, education, and even fieldwork.”

Professor Steve Brusatte, Personal Chair of Palaeontology and Evolution, School of GeoSciences, said: “This study is an exciting contribution for paleontology and an objective, data-driven way to classify dinosaur footprints — something that has stumped experts for over a century.

“It opens up exciting new possibilities for understanding how these incredible animals lived and moved, and when major groups like birds first evolved. This computer network might have identified the world’s oldest birds, which I think is a fantastic and fruitful use for AI.”

Reference:
Gregor Hartmann, Tone Blakesley, Paige E. dePolo, Stephen L. Brusatte. Identifying variation in dinosaur footprints and classifying problematic specimens via unbiased unsupervised machine learning. Proceedings of the National Academy of Sciences, 2026; 123 (5) DOI: 10.1073/pnas.2527222122

Note: The above post is reprinted from materials provided by University of Edinburgh.

A hidden force beneath the Atlantic ripped open a 500 kilometer canyon

Grand Canyon, Arizona

On land, dramatic canyons such as the Grand Canyon are carved over time by flowing rivers. The ocean does not have rivers capable of cutting into rock on that scale. Even so, the seafloor hosts enormous features that surpass the size of the largest land canyons.

About 1,000 kilometers off the coast of Portugal lies one of the most striking examples. Known as the King’s Trough Complex, this vast underwater structure stretches roughly 500 kilometers and includes a series of parallel trenches and deep basins. At its eastern edge is Peake Deep, one of the deepest locations in the Atlantic Ocean.

What created such an immense formation? A team of international researchers led by the GEOMAR Helmholtz Centre for Ocean Research Kiel has uncovered new clues. Their findings appear in Geochemistry, Geophysics, Geosystems (G-Cubed), published by the American Geophysical Union (AGU).

“Researchers have long suspected that tectonic processes — that is, movements of the Earth’s crust — played a central role in the formation of the King’s Trough,” says lead author Dr. Antje Dürkefälden, marine geologist at GEOMAR. “Our results now explain for the first time why this remarkable structure developed precisely at this location.”

Seafloor Rifting Between Europe and Africa

The new research indicates that between about 37 and 24 million years ago, a plate boundary separating Europe and Africa temporarily passed through this part of the North Atlantic. As the tectonic plates shifted, the crust in this region was pulled apart and fractured, opening progressively from east to west, much like a zipper being undone.

An important piece of the puzzle lies even deeper. Before the plate boundary moved into the area, the oceanic crust there had already become unusually thick and heated. This condition resulted from hot material rising upward from Earth’s mantle. Known as a mantle plume, this steady column of molten rock originates far below the surface. The team believes this was an early offshoot of what is now the Azores mantle plume.

“This thickened, heated crust may have made the region mechanically weaker, so that the plate boundary preferentially shifted here,” explains co-author PD Dr. Jörg Geldmacher, marine geologist at GEOMAR. “When the plate boundary later moved further south towards the modern Azores, the formation of the King’s Trough also came to a halt.”

How Mantle Activity Shapes the Atlantic

The King’s Trough offers a clear example of how deep mantle processes and shifting tectonic plates interact. Activity far below the surface can prepare the crust for later deformation, influencing where major fractures and rifts eventually develop.

These findings also shed light on the broader geodynamic history of the Atlantic Ocean. Similar processes may still be underway today. Near the Azores, a comparable trench system called the Terceira Rift is forming in another region where the oceanic crust is unusually thick.

Mapping the King’s Trough

The conclusions are based on data collected during research expedition M168 aboard the research vessel METEOR in 2020, led by Antje Dürkefälden. The scientists used high resolution sonar to produce a detailed map of the seafloor. They then retrieved volcanic rock samples from several parts of the trench system using a chain bag dredge.

Back in the lab, the team examined the chemical makeup of the rocks. Selected samples were dated at the University of Madison (Wisconsin, USA). Additional bathymetric data came from the Portuguese research centre Estrutura de Missão para a Extensão da Plataforma Continental (EMEPC). Researchers from Kiel University and Martin Luther University Halle-Wittenberg also contributed to the study.

Reference:
A. Dürkefälden, J. Geldmacher, F. Hauff, M. Stipp, D. Garbe‐Schönberg, D. A. Frick, B. Jicha, L. Pinto Ribeiro, M. Gutjahr, J. Schenk, K. Hoernle. Origin of the King\’s Trough Complex (North Atlantic): Interplay Between a Transient Plate Boundary and the Early Azores Mantle Plume. Geochemistry, Geophysics, Geosystems, 2025; 26 (12) DOI: 10.1029/2025GC012616

Note: The above post is reprinted from materials provided by Helmholtz Centre for Ocean Research Kiel (GEOMAR).

A giant weak spot in Earth’s magnetic field is now half the size of Europe

The South Atlantic Anomaly — a growing weak spot in Earth’s magnetic shield — has expanded by nearly half the size of continental Europe since 2014, with especially intense weakening now occurring near Africa. At the same time, magnetic strength is rising over Siberia and fading over Canada, reflecting powerful changes unfolding deep inside Earth’s core. Credit: ESA (Data source: Finlay, C.C. et al., 2025)

After analyzing 11 years of magnetic field data from the European Space Agency’s Swarm satellite constellation, researchers have found that a large weak zone in Earth’s magnetic field over the South Atlantic has grown dramatically. This region, called the South Atlantic Anomaly, has expanded since 2014 by an area nearly half the size of continental Europe.

Earth’s magnetic field plays a critical role in making the planet livable. It acts as a protective barrier, shielding us from harmful cosmic radiation and charged particles streaming from the Sun.

How Earth Generates Its Magnetic Field

The magnetic field is produced deep inside the planet. Roughly 3000 km below the surface, a vast ocean of molten, churning liquid iron fills the outer core. As this electrically conductive material moves, it generates electric currents. Those currents create the ever changing electromagnetic field that surrounds Earth. Although it can be loosely compared to the motion of a spinning conductor in a bicycle dynamo, the true processes driving the field are far more complicated.

Swarm is an Earth Explorer mission developed under ESA’s Earth Observation FutureEO program. It consists of three identical satellites that measure magnetic signals originating from Earth’s core, mantle, crust, and oceans, along with contributions from the ionosphere and magnetosphere.

These detailed observations help scientists separate the different sources of magnetism and better understand why the magnetic field is weakening in some regions while strengthening in others.

Why the South Atlantic Anomaly Matters

The South Atlantic Anomaly was first identified in the 19th century southeast of South America. Today it is closely monitored because of its implications for space safety. Satellites passing through this region are exposed to elevated levels of radiation, increasing the risk of technical malfunctions, hardware damage, and even temporary outages.

New findings published in Physics of the Earth and Planetary Interiors show that the anomaly expanded steadily between 2014 and 2025. Since 2020, however, an area of the Atlantic southwest of Africa has experienced even more rapid magnetic weakening.

“The South Atlantic Anomaly is not just a single block,” says lead author Chris Finlay, Professor of Geomagnetism at the Technical University of Denmark. “It’s changing differently towards Africa than it is near South America. There’s something special happening in this region that is causing the field to weaken in a more intense way.”

Reverse Flux Patches and Core Dynamics

Scientists link this unusual behavior to patterns in the magnetic field at the boundary between Earth’s liquid outer core and its solid mantle. These features, known as reverse flux patches, represent areas where the magnetic field behaves in an unexpected way.

Prof. Finlay explains, “Normally we’d expect to see magnetic field lines coming out of the core in the southern hemisphere. But beneath the South Atlantic Anomaly we see unexpected areas where the magnetic field, instead of coming out of the core, goes back into the core. Thanks to the Swarm data we can see one of these areas moving westward over Africa, which contributes to the weakening of the South Atlantic Anomaly in this region.”

Swarm Sets a New Magnetic Record

The latest magnetic field model marks an important milestone for Swarm. The mission now holds the longest continuous space based record of Earth’s magnetic field.

Launched on November 22, 2013, as the fourth Earth Explorer mission, the satellites were designed to test advanced Earth observation technologies. They have exceeded their planned lifetime and become essential for maintaining long term magnetic field records, supporting operational services, and guiding future satellite missions.

Swarm measurements form the foundation of global magnetic models used for navigation, tracking space weather hazards, and studying Earth’s system from its deep interior to the upper atmosphere.

Magnetic Field Strength Grows Over Siberia

The new results also highlight how dynamic Earth’s magnetism truly is. In the southern hemisphere, there is one region where the magnetic field is especially strong. In the northern hemisphere, there are two such areas, one near Canada and another over Siberia.

“When you’re trying to understand Earth’s magnetic field, it’s important to remember that it’s not just a simple dipole, like a bar magnet. It’s only by having satellites like Swarm that we can fully map this structure and see it changing,” said Prof. Finlay.

Since Swarm began operating, the magnetic field over Siberia has intensified while the field over Canada has weakened. The strong magnetic region over Canada has shrunk by 0.65% of Earth’s surface area, roughly the size of India. In contrast, the Siberian strong field region has expanded by 0.42% of Earth’s surface area, comparable to the size of Greenland.

These changes are driven by complex activity in Earth’s turbulent core and are connected to the gradual movement of the northern magnetic pole toward Siberia in recent years. This ongoing shift affects navigation systems, which depend on the balance between these strong magnetic regions.

ESA’s Swarm Mission Manager, Anja Stromme, said, “It’s really wonderful to see the big picture of our dynamic Earth thanks to Swarm’s extended timeseries. The satellites are all healthy and providing excellent data, so we can hopefully extend that record beyond 2030, when the solar minimum will allow more unprecedented insights into our planet.”

Reference:
C.C. Finlay, C. Kloss, N. Gillet. Core field changes from eleven years of Swarm satellite observations. Physics of the Earth and Planetary Interiors, 2025; 368: 107447 DOI: 10.1016/j.pepi.2025.107447

Note: The above post is reprinted from materials provided by European Space Agency (ESA).

Scientists discover a hidden deep sea hotspot bursting with life

Measuring the temperature on the seafloor: In the newly discovered hydrothermal field, hot liquid and cold gas bubble up from the sediment just a few centimeters apart. Credit: ROV Kiel 6000 / GEOMAR

Off the coast of Papua New Guinea, scientists have identified a previously unknown type of hydrothermal field where two different processes occur at the same time: hot hydrothermal fluids rise from below the seafloor while unusually large quantities of methane and other hydrocarbons escape from the sediments. This combination has not been documented anywhere else. The site is located about 1,300 meters deep on the slope of Conical Seamount in the western Pacific, near the island of Lihir in Papua New Guinea.

The findings were recently described in Scientific Reports.

ROV delivers the surprise

“We essentially have a hot vent bubbling right next to a cool gas seep — a combination that has never been described before,” says Dr. Philipp Brandl, marine geologist at the GEOMAR Helmholtz Centre for Ocean Research Kiel. He was chief scientist on the SONNE expedition SO299 DYNAMET, which surveyed the Tabar-Lihir-Tanga-Feni island chain in 2023 to investigate the region’s underwater volcanoes (seamounts).

Brandl adds: “No one really expected to find a hydrothermal field here, let alone one that is so exceptional.” Earlier missions had shown hints of limited hydrothermal activity, yet this field went unnoticed during several previous research cruises. Only when the team deployed the ROV Kiel 6000 did the unusual features of the site become clear. “It was a real surprise,” Brandl says, “especially for those of us who had worked in this area multiple times.”

A hybrid system of hot and cool vents

Hydrothermal vents and methane seeps typically appear in separate locations on the seafloor. In this instance, however, their close spacing results from the specific makeup of Conical Seamount. Thick layers of sediment rich in organic material lie beneath the volcanic edifice. Rising magma heats these buried layers, producing methane and other hydrocarbons. At the same time, the heat from the magma drives chemically rich fluids upward until they exit the seafloor as hot hydrothermal vents.

Both the heated fluids from below and the cooler, methane-filled gases from the sediments move upward through the same pathways. As a result, hot water and cold gas emerge from the seafloor only a few centimeters apart.

A habitat unlike any other

This unusual arrangement creates an entirely new kind of deep-sea environment that supports an exceptionally varied community of organisms. The rocks are densely covered by Bathymodiolus mussels, tube worms, shrimp, amphipods, and vivid purple sea cucumbers. “In places, you couldn’t see a single patch of rock because everything is so densely populated,” Brandl says. “We are confident that some of the species there have not yet been described. However, a dedicated expedition would be needed to fully study this unique habitat.”

Because mussels dominate the area, the research team and local observer Stanis Konabe from the University of Papua New Guinea named the site ‘Karambusel’. In Tok Pisin, the word means ‘mussel’.

Traces of precious metals in the rock

The unusual mixture of gases at Karambusel affects both the ecosystem and the geological characteristics of the vent field. Methane levels exceed 80 percent, and hot fluids rising from below create distinctive chemical conditions in the subsurface. Gold and silver, along with arsenic, antimony, and mercury, accumulate in the surrounding rocks. These minerals indicate that the area once experienced high-temperature hydrothermal activity that deposited precious metals, even though current activity is cooler.

Threats from human activity

Although the site is remarkable for both its geology and its biology, it faces significant risks. Mining operations already occur nearby, such as at the Ladolam gold mine on Lihir, where waste material is discharged into the ocean. Additional exploration licences for seafloor minerals and hydrocarbons are in place. These activities pose threats to the delicate ecosystem and the organisms that depend on it.

The researchers urge further investigation of this region, along with careful marine spatial planning and protective measures to safeguard the site. Philipp Brandl states: “We have discovered an unexpected treasure trove of biodiversity in the Karambusel field that needs to be protected before economic interests destroy it.”

Reference:

Philipp A. Brandl, Sylvia G. Sander, Christoph Beier, Mark Schmidt, Jan J. Falkenberg, Terue Kihara, Klaas Meyn, Felix Genske, Rebecca Zitoun, Brent I. A. McInnes, Mark D. Hannington, Sven Petersen, Eemu J. Ranta, Fred Jourdan, Louis-Maxime Gautreau, Thor H. Hansteen, Ingo Heyde, Stanis Konabe, Joseph O. Espi, Octavio Acuña Avendaño, Alan T. Baxter, Christophe Y. Galerne, Max Kaufmann, Johanna Klein, Sabine Lange, Doris Maicher, Esther Panachi, Konstantin Reeck, Egor Riemer, William Ruth, Johanna Schenk, Sarima Vahrenkamp, Leon Waßmund, Julia Wenske, Hannah Zimmer. Coupled hydrothermal venting and hydrocarbon seepage discovered at Conical Seamount, Papua New Guinea. Scientific Reports, 2025; 15 (1) DOI: 10.1038/s41598-025-17192-x

Note: The above post is reprinted from materials provided by Helmholtz Centre for Ocean Research Kiel (GEOMAR).

Physical Properties of Iron Alloys in the Superionic State at Earth’s Core Conditions

The inner core, outer core, mantle and Earth’s crust.

Physical Properties of Iron Alloys in the Superionic State at Earth’s Core Conditions

The concept of a Superionic Earth Core challenges the classical view of Earth’s inner core as a purely solid iron–nickel alloy. Recent high-pressure experiments and first-principles simulations suggest that under extreme temperature and pressure conditions, iron alloys containing light elements (H, C, O, Si, S) may enter a superionic state—a phase where one atomic sublattice remains solid while lighter elements become partially mobile, behaving like a liquid within a crystalline framework.

This emerging model has profound implications for inner core physics, geodynamics, seismic anisotropy, and the long-term stability of Earth’s magnetic field.

To understand whether Earth’s inner core may host superionic behavior, we must examine the physical conditions, experimental constraints, mineral physics, and thermodynamic mechanisms operating at depths of ~5,100–6,371 km.

What Is a Superionic State? A Mineral Physics Perspective

Definition of Superionic Matter

A superionic state is a phase of matter in which:

  • One component (typically heavier atoms) forms a rigid crystalline lattice.
  • Another component (usually lighter ions such as hydrogen or oxygen) becomes highly mobile.
  • The material exhibits both solid-like and liquid-like properties simultaneously.

Superionic phases were first observed in materials such as AgI and later predicted for planetary ices (e.g., water at Uranus–Neptune conditions). Under extreme pressures and temperatures, ionic mobility increases dramatically without complete melting.

In the context of the Superionic Earth Core, the key question is whether iron alloys under core conditions exhibit similar behavior.

Physical Conditions at Earth’s Inner Core

Pressure and Temperature Regime

The inner core exists under:

  • Pressures of ~330–360 GPa
  • Temperatures estimated between 5,000–6,500 K

These extreme conditions are replicated experimentally using:

  • Diamond anvil cells
  • Laser-heated compression experiments
  • Shock compression methods

Such conditions approach the melting boundary of iron alloys and may stabilize unusual high-temperature phases.

Composition of the Inner Core — Beyond Pure Iron

Seismic density measurements indicate that Earth’s core is not pure iron. It must contain 5–10 wt% light elements, inferred from density deficits relative to pure Fe at core pressures.

Candidate Light Elements

Commonly proposed light elements include:

  • Hydrogen (H)
  • Carbon (C)
  • Oxygen (O)
  • Silicon (Si)
  • Sulfur (S)

The incorporation of light elements alters:

  • Melting temperature
  • Electrical conductivity
  • Sound velocity
  • Diffusion rates

These compositional effects are central to evaluating superionic behavior.

Experimental Evidence for Superionic Behavior in Iron Alloys

Hydrogen-Bearing Iron Alloys

First-principles molecular dynamics simulations suggest that Fe–H systems under core conditions may allow hydrogen to diffuse rapidly through an iron lattice. At sufficiently high temperatures, hydrogen mobility resembles liquid diffusion while the iron framework remains crystalline.

This diffusion resembles superionic phases predicted in high-pressure ices and oxides.

Oxygen and Other Light Elements

Experimental studies of Fe–O and Fe–Si alloys indicate possible decoupling between heavy and light atomic mobility at extreme conditions. While not definitively proven in the inner core, these findings support the plausibility of partial ionic mobility.

Implications for Inner Core Physics

Seismic Anisotropy

Earth’s inner core exhibits seismic anisotropy, where P-waves travel faster along polar directions than equatorial ones. A superionic state could influence:

  • Elastic constants
  • Crystal alignment
  • Diffusion-assisted recrystallization

Superionic mobility may contribute to anisotropic behavior via enhanced lattice reorganization.

Thermal Conductivity

The mobility of light elements affects:

  • Heat transport efficiency
  • Core cooling rates
  • Energy available for convection in the outer core

If the inner core hosts superionic properties, it may modify estimates of the heat flux driving the geodynamo.

Connection to the Geodynamo and Magnetic Field

Role of the Inner Core in Magnetic Field Generation

Earth’s magnetic field originates primarily in the liquid outer core, where convection of electrically conductive iron generates a self-sustaining dynamo.

However, the inner core influences this system by:

  • Releasing latent heat during solidification
  • Expelling light elements into the outer core
  • Contributing compositional buoyancy

If the inner core exhibits partial superionic behavior, the exchange of light elements between solid and liquid regions may alter buoyancy flux and magnetic field stability.

Thermodynamics of the Superionic Transition

Melting vs Superionic Transition

A superionic transition differs from full melting:

  • Lattice framework persists
  • Partial ionic disorder occurs
  • Electrical and thermal properties change nonlinearly

Phase diagrams of Fe–light element systems at 300+ GPa suggest complex transitions that are not fully constrained experimentally.

Challenges and Open Questions

Despite compelling theoretical work, several uncertainties remain:

  • Is superionic behavior stable under inner core pressure–temperature conditions?
  • What is the exact composition of the core?
  • How does long-term diffusion affect core evolution?
  • Can seismic observations distinguish superionic phases from conventional solid phases?

Resolving these questions requires advances in:

  • High-pressure mineral physics
  • Synchrotron experiments
  • Ab initio simulations
  • Seismic modeling

Broader Implications for Planetary Science

The concept of a Superionic Earth Core also informs the study of:

  • Superionic water in ice giants
  • Core states of terrestrial exoplanets
  • Evolution of planetary magnetic fields

If superionic phases are common under extreme planetary conditions, they may represent a fundamental state of matter in planetary interiors.

References 

  1. Hirose, K., Labrosse, S., & Hernlund, J. (2013). Composition and state of the core. Annual Review of Earth and Planetary Sciences, 41, 657–691.
  2. Pozzo, M., Davies, C., Gubbins, D., & Alfè, D. (2012). Thermal and electrical conductivity of iron at Earth’s core conditions. Nature, 485, 355–358.
  3. Umemoto, K., & Wentzcovitch, R. M. (2011). Ab initio study of Fe–H systems at high pressure. Earth and Planetary Science Letters, 311, 225–229.
  4. Ohta, K., et al. (2016). Experimental determination of electrical resistivity of iron at core conditions. Nature, 534, 95–98.
  5. McDonough, W. F. (2014). Compositional model for Earth’s core. Treatise on Geochemistry, 3, 559–577.
  6. French, M., Mattsson, T. R., Nettelmann, N., & Redmer, R. (2009). Equation of state and phase diagram of water at extreme conditions. Physical Review B, 79, 054107.

Mantle Plume Initiation and the Role of Large Low-Shear-Velocity Provinces (LLSVPs)

Dynamic nature of Earth’s interior.

Introduction — Why “Mantle Blobs” Matter in Deep Earth Science

Large Low-Shear-Velocity Provinces (LLSVPs), often informally called mantle blobs, represent some of the most enigmatic and fundamental structures within Earth’s interior. Identified through global seismic tomography, LLSVPs are vast regions at the base of the mantle, near the core–mantle boundary (CMB), where seismic shear waves (S-waves) travel anomalously slowly.

Understanding LLSVPs is essential because they are increasingly linked to:

  • Mantle plume initiation
  • The location of hotspots and large igneous provinces (LIPs)
  • Long-term mantle convection patterns
  • The thermal and chemical evolution of Earth

In modern deep-Earth geodynamics, LLSVPs are no longer considered passive anomalies. Instead, they are thought to play an active, organizing role in how heat and material are transferred from the deep mantle to the surface.

What Are LLSVPs? A Seismological Definition

Seismic Characteristics of LLSVPs

LLSVPs are defined as regions of markedly reduced shear-wave velocity in the lowermost mantle, typically extending several hundred kilometers above the core–mantle boundary.

Key defining features include:

  • Shear-wave velocity reductions of 1–3% relative to surrounding mantle
  • Lateral dimensions on the order of thousands of kilometers
  • Vertical thicknesses of 200–1000 km
  • Sharp lateral boundaries detectable in high-resolution tomography

Two dominant LLSVPs have been consistently imaged:

  • One beneath Africa
  • One beneath the central Pacific

These structures have remained stable over hundreds of millions of years, suggesting a fundamental role in mantle dynamics.

Discovery Through Seismic Tomography

How Seismic Tomography Reveals Deep Mantle Structure

Seismic tomography works by analyzing variations in seismic wave travel times from earthquakes recorded worldwide. Slower-than-expected S-wave velocities indicate:

  • Elevated temperatures
  • Chemical heterogeneity
  • Partial melt or compositional anomalies

The recognition of LLSVPs emerged in the late 20th century as global datasets improved, revealing coherent, continent-scale low-velocity provinces at the base of the mantle rather than random thermal anomalies.

Thermal vs Chemical Nature of LLSVPs

A central scientific debate concerns what LLSVPs are made of.

Thermal Anomaly Hypothesis

In a purely thermal interpretation, LLSVPs represent:

  • Hot, buoyant regions
  • Accumulations of heat above the core
  • Long-lived thermal reservoirs

However, temperature alone cannot fully explain:

  • Their sharp boundaries
  • Their long-term stability against convective mixing

Thermochemical Pile Hypothesis

The prevailing model interprets LLSVPs as thermochemical piles, meaning they are:

  • Hotter and compositionally distinct
  • Enriched in dense materials such as recycled oceanic crust
  • Stabilized by chemical density contrasts

This model explains both seismic observations and the persistence of LLSVPs over geological time.

Origin of LLSVPs in Earth History

Accumulation of Subducted Slabs

One leading hypothesis suggests that LLSVPs formed through:

  • Long-term subduction of oceanic lithosphere
  • Sinking slabs reaching the lowermost mantle
  • Chemical segregation and accumulation near the CMB

Over billions of years, this process may have produced compositionally distinct mantle reservoirs.

Primordial Mantle Reservoirs

An alternative view proposes that LLSVPs represent primordial mantle domains, preserved since Earth’s early differentiation. Isotopic signatures from plume-related basalts support the existence of deep, ancient mantle sources.

LLSVPs and Mantle Plume Initiation

Why Plumes Prefer LLSVP Margins

One of the strongest links between LLSVPs and surface geology is the observation that mantle plumes preferentially originate at the edges of LLSVPs rather than their centers.

This occurs because:

  • Strong lateral thermal gradients exist at LLSVP margins
  • Instabilities develop where hot, dense material meets cooler mantle
  • These instabilities evolve into buoyant plume upwellings

This relationship explains why many hotspots and LIPs cluster geographically above inferred LLSVP boundaries.

Connection to Large Igneous Provinces and Hotspots

Large Igneous Provinces (LIPs)

Geochronological reconstructions show that many LIPs erupted above present-day or reconstructed LLSVP margins, including:

  • Deccan Traps
  • Karoo–Ferrar province
  • Ontong Java Plateau

This spatial correlation strongly supports a deep-mantle control on surface magmatism.

Hotspot Stability

Long-lived hotspots such as Hawaii and Réunion are thought to be fed by plumes rooted near LLSVPs, explaining their persistence over tens of millions of years despite plate motion.

LLSVPs and Global Mantle Convection

Influence on Mantle Flow Patterns

LLSVPs act as large-scale boundary conditions for mantle convection by:

  • Deflecting descending slabs
  • Anchoring plume generation zones
  • Organizing long-wavelength mantle circulation

Rather than a chaotic system, Earth’s mantle appears structured around these deep reservoirs.

Interaction with the Core–Mantle Boundary

LLSVPs sit directly above the outer core, influencing:

  • Heat flux from the core
  • Core cooling rates
  • Potential links to the geodynamo

This coupling highlights the importance of LLSVPs in whole-Earth dynamics.

Implications for Plate Tectonics

Deep Control on Surface Plates

Although plate tectonics operates at the surface, LLSVPs may indirectly influence:

  • Plate boundary reorganization
  • Supercontinent cycles
  • Long-term distribution of volcanism

This challenges the traditional view that mantle convection is driven only from the top down.

Competing Models and Open Questions

Despite major advances, key questions remain:

  • Are LLSVPs primarily thermal, chemical, or both?
  • How sharp are their boundaries at mineralogical scales?
  • Do they evolve over time, or are they quasi-permanent?

Future progress depends on integrating seismology, mineral physics, geochemistry, and numerical modeling.

Why LLSVPs Matter Beyond Academia

Understanding LLSVPs has implications for:

  • Interpreting mantle-derived geochemical signatures
  • Predicting long-term volcanic patterns
  • Modeling Earth’s thermal evolution
  • Constraining deep carbon and volatile cycles

In short, LLSVPs are central to explaining how Earth works as a coupled deep-to-surface system.

References

  • Garnero, E. J., McNamara, A. K., & Shim, S.-H. (2016). Continent-sized anomalous zones with low seismic velocity at the base of the mantle. Nature Geoscience, 9, 481–489.
  • Burke, K., Steinberger, B., Torsvik, T. H., & Smethurst, M. A. (2008). Plume generation zones at the margins of large low shear velocity provinces. Earth and Planetary Science Letters, 265, 49–60.
  • McNamara, A. K., & Zhong, S. (2005). Thermochemical structures within a spherical mantle. Journal of Geophysical Research, 110, B07402.
  • Dziewonski, A. M., Lekic, V., & Romanowicz, B. A. (2010). Mantle anchor structure. Earth and Planetary Science Letters, 299, 69–79.
  • Torsvik, T. H., et al. (2014). Deep mantle structure as a reference frame for plate motion. Nature, 514, 400–404.
  • Li, M., McNamara, A. K., & Garnero, E. J. (2014). Chemical complexity of hotspots caused by cycling oceanic crust through mantle plumes. Nature Geoscience, 7, 366–370.

Niobium Carbonatites: Petrology and Mineralization Processes

Calciocarbonatite in the Precambrian of Ontario, Canada.

Introduction — Why Carbonatites Matter in the Critical Minerals Era

Carbonatite complexes occupy a unique and strategically important position in global geology. Although volumetrically rare, carbonatites are the primary global source of niobium (Nb)—a critical metal essential for high-strength low-alloy steels, aerospace components, energy infrastructure, and advanced technologies. As demand for critical minerals intensifies, understanding the petrological evolution of niobium-bearing carbonatites has become central to both academic research and mineral exploration strategies.

From a geological perspective, carbonatites are extraordinary because they represent carbonate-dominated magmas derived from the mantle, challenging long-standing models of silicate-dominated magmatism. Their evolution involves complex interactions between mantle source heterogeneity, partial melting, fractional crystallization, immiscibility, and hydrothermal processes, all of which play a role in concentrating niobium into economically viable deposits.

What Are Carbonatites? A Petrological Definition

Carbonatites are igneous rocks composed of more than 50% carbonate minerals by volume, primarily calcite, dolomite, or ankerite. Unlike sedimentary carbonates, carbonatites are unequivocally magmatic in origin, as demonstrated by their textures, mineral assemblages, isotope compositions, and spatial association with alkaline silicate rocks.

Mineralogical Composition of Carbonatites

Typical carbonatites contain:

  • Carbonate minerals (calcite, dolomite, ferroan carbonates)
  • Accessory phases such as apatite, magnetite, barite, fluorite
  • Nb-bearing minerals, most notably pyrochlore-group minerals
  • Enrichment in incompatible elements (Nb, REE, Sr, Ba, Th, U)

This unusual chemistry reflects their derivation from low-degree partial melts of a metasomatized mantle source.

Global Distribution and Tectonic Setting of Carbonatite Complexes

Carbonatites are spatially associated with intraplate tectonic environments, commonly occurring within:

  • Continental rift zones
  • Cratonic margins
  • Stable continental interiors affected by mantle upwelling

They are frequently linked to alkaline igneous complexes, forming ring structures, cone sheets, and multi-phase intrusive centers.

Mantle Plumes and Lithospheric Control

Geophysical and geochemical evidence indicates that many carbonatite complexes originate from mantle plume-related thermal anomalies, combined with lithospheric thinning or reactivation of deep-seated structures. This tectonic configuration facilitates:

  • Low-degree partial melting
  • Ascent of volatile-rich melts
  • Long-lived magmatic systems capable of extreme elemental fractionation

Carbonatite Petrogenesis — From Mantle to Crust

Understanding carbonatite petrogenesis is fundamental to explaining niobium enrichment.

Mantle Source Characteristics

Isotopic data (Sr–Nd–Pb–C–O) consistently indicate derivation from a heterogeneous, metasomatized subcontinental lithospheric mantle. This mantle source has been enriched by:

  • Carbonate-rich melts
  • Alkali- and volatile-bearing fluids
  • Recycled subducted materials

These processes introduce niobium and other incompatible elements into mantle domains capable of generating carbonatitic melts.

Partial Melting and Melt Generation

Carbonatite magmas are produced by:

  • Extremely low degrees of partial melting (<1%)
  • Melting of carbonated peridotite or eclogite
  • Stabilization of carbonate melts at lower temperatures than silicate melts

Such low-degree melts are inherently enriched in Nb, REE, and volatiles, setting the stage for mineralization.

Evolution of Carbonatite Magmas in the Crust

Once generated, carbonatite magmas undergo complex evolutionary pathways.

Magma Ascent and Emplacement

Carbonatite magmas ascend rapidly due to:

  • Low viscosity
  • High volatile content
  • Buoyancy relative to surrounding rocks

They commonly intrude as:

  • Dykes
  • Cone sheets
  • Plug-like bodies
  • Zoned intrusive complexes

Fractional Crystallization

As carbonatite magmas cool, early crystallization of carbonate and oxide minerals leads to progressive enrichment of incompatible elements, including niobium, in the residual melt. This process is critical in achieving ore-grade concentrations.

Immiscibility and the Silicate–Carbonatite Link

One of the most important processes in carbonatite evolution is liquid immiscibility.

Silicate–Carbonate Melt Separation

Experimental and natural studies demonstrate that alkaline silicate magmas can unmix into:

  • A silicate-rich melt
  • A carbonate-rich (carbonatitic) melt

This immiscibility process:

  • Concentrates Nb into the carbonatitic melt
  • Explains the intimate spatial association of carbonatites with nepheline syenites, ijolites, and phonolites

Niobium Min`2eralization in Carbonatite Complexes

Why Niobium Concentrates in Carbonatites

Niobium is a high-field-strength element (HFSE) with limited compatibility in major silicate minerals. In carbonatite systems:

  • Nb remains in the melt during early crystallization
  • Volatile-rich conditions suppress Nb incorporation into early phases
  • Late-stage melts become extremely Nb-rich

Pyrochlore-Group Minerals

The dominant niobium ore mineral in carbonatites is pyrochlore, typically occurring as:

  • Magmatic crystals
  • Hydrothermally altered phases
  • Zoned grains recording magmatic evolution

Pyrochlore chemistry reflects:

  • Redox conditions
  • Magma composition
  • Degree of hydrothermal overprinting

Hydrothermal Processes and Ore Upgrading

Role of Late-Stage Fluids

Post-magmatic hydrothermal fluids play a crucial role by:

  • Redistributing niobium
  • Altering primary pyrochlore
  • Enhancing ore grade through dissolution–reprecipitation processes

Fluids rich in F, CO₂, and alkalis are particularly effective in mobilizing HFSEs.

Structural Controls on Mineralization

Faults, fractures, and breccia zones provide:

  • Pathways for fluid flow
  • Sites for mineral precipitation
  • Controls on ore geometry and continuity

Carbonatites and Critical Mineral Exploration

Exploration Indicators for Niobium Carbonatites

Successful exploration relies on recognizing:

  • Association with alkaline complexes
  • Geophysical anomalies (magnetic, gravity)
  • Geochemical halos enriched in Nb, REE, P, Sr, Ba
  • Presence of pyrochlore and apatite-rich zones

Economic Significance

Major niobium deposits hosted by carbonatites supply the majority of global Nb demand, making these systems strategic assets in critical mineral supply chains.

Geological and Economic Implications

Carbonatite-hosted niobium deposits demonstrate how:

  • Mantle processes directly influence resource distribution
  • Rare magmatic systems can dominate global supply
  • Understanding petrology is essential for sustainable exploration

As the global transition toward low-carbon and high-performance technologies accelerates, niobium carbonatites will remain at the forefront of critical mineral geology.

References

  • Woolley, A. R., & Kjarsgaard, B. A. (2008). Carbonatite occurrences of the world. Geological Survey of Canada.
  • Mitchell, R. H. (2005). Carbonatites and Carbonatites and Carbonatite Petrogenesis. Mineralogical Association of Canada.
  • Bell, K., & Tilton, G. R. (2001). Nd, Pb and Sr isotopic compositions of carbonatites. Journal of Petrology, 42, 959–988.
  • Chakhmouradian, A. R., & Zaitsev, A. N. (2012). Rare earth mineralization in carbonatites. Elements, 8, 333–338.
  • Kjarsgaard, B. A., & Hamilton, D. L. (1989). Carbonatite–nephelinite liquid immiscibility. Journal of Petrology, 30, 939–974.
  • Mariano, A. N. (1989). Economic geology of rare earth minerals. Reviews in Mineralogy, 21, 309–348.

16,000 fossil footprints in central Bolivia reveal dinosaur behavior

A petrified footprint by a dinosaur is visible in Carreras Pampa in Toro Toro National Park, north of Potosi, Bolivia, Saturday, Dec. 6, 2025. Credit: AP Photo/Juan Karita

Legend once had it that the huge, three-toed footprints scattered across the central highlands of Bolivia came from supernaturally strong monsters—capable of sinking their claws even into solid stone.

Then scientists came here in the 1960s and dispelled children’s fears, determining that the strange footprints in fact belonged to gigantic, two-legged dinosaurs that stomped and splashed over 60 million years ago, in the ancient waterways of what is now Toro Toro, a village and popular national park in the Bolivian Andes.

Now, a team of paleontologists, mostly from California’s Loma Linda University, have discovered and meticulously documented 16,600 such footprints left by theropods, the dinosaur group that includes the Tyrannosaurus rex. Their study, based on six years of regular field visits and published in the peer-reviewed journal PLOS One, reports that this finding represents the highest number of theropod footprints recorded anywhere in the world.

“There’s no place in the world where you have such a big abundance of (theropod) footprints,” said Roberto Biaggi, a co-author of the study led by Spanish paleontologist Raúl Esperante. “We have all these world records at this particular site.”

Prints record dinosaur behavior—including attempts to swim

The dinosaurs that ruled the earth and roamed this region also made awkward attempts to swim here, according to the study, scratching at what was squishy lake-bottom sediment to leave another 1,378 traces.

They pressed their claws into the mud just before water levels rose and sealed their tracks, protecting them from centuries of erosion, scientists said.

“The preservation of many of the tracks is excellent,” said Richard Butler, a paleontologist at the University of Birmingham who was not involved in the research. He said that, to his knowledge, the number of footprints and trackways found in Toro Toro had no precedent.

“This is a remarkable window into the lives and behaviors of dinosaurs at the end of the Cretaceous,” Butler added, referring to the period around 66 million years ago at the end of which an asteroid impact abruptly extinguished all dinosaurs and 75% of living species along with them, according to scientists.

Footprints face preservation threats

Although they’ve survived for millions of years, human life has threatened these traces. For decades, farmers threshed corn and wheat on the footprint-covered plateaus. Nearby quarry workers didn’t think much of the formations as they blasted rock layers for limestone. And just two years ago, researchers said, highway crews tunneling through hillsides nearly wiped out a major site of dinosaur tracks before the national park intervened.

Such disturbances may have something to do with the area’s striking absence of dinosaur bones, teeth and eggs, experts say. For all of the footprints and swim traces found across Bolivia’s Toro Toro, there are virtually no skeletal remains of the sort that litter the peaks and valleys of Argentine Patagonia and Campanha in Brazil.

But the lack of bones could have natural causes, too. The team said the quantity and pattern of tracks—and the fact they were all found in the same sediment layer—suggest that dinosaurs didn’t settle in what is now Bolivia as much as trudge along an ancient coastal superhighway stretching from southern Peru into northwest Argentina.

The range in footprint sizes indicated that giant creatures roughly 10 meters (33 feet) tall moved in a herd with tiny theropods the size of a chicken, 32 centimeters (1 foot) tall at the hip.

In presenting a snapshot of everyday behavior footprints “reveal what skeletons cannot,” said Anthony Romilio, a paleontologist at the University of Queensland in Australia who also did not participate in the study. Just from footprints, researchers can tell when dinosaurs strolled or sped up, stopped or turned around.

It’s not clear why so many dinosaurs roamed the site

But the reason they flocked in droves to this wind-swept plateau remains a mystery.

“It may have been that they were all regular visitors to a large, ancient, freshwater lake, frequenting its expansive muddy shoreline,” offered Romilio.

Biaggi suggested that they were “running away from something or searching for somewhere to settle.”

What’s certain is that research into this treasure trove of a dinosaur tracksite will continue.

“I suspect that this will keep going over the years and many more footprints will be found right there at the edges of what’s already uncovered,” Biaggi said.

Reference:
Morphotypes, preservation, and taphonomy of dinosaur footprints, tail traces, and swim tracks in the largest tracksite in the world: Carreras Pampa (Upper Cretaceous), Torotoro National Park, Bolivia, PLOS One (2025). DOI: 10.1371/journal.pone.0335973

Note: The above post is reprinted from materials provided by The Associated Press.

Decades-long quest leads to first scholarly accurate fossil replica of ‘dinosaur-killer’ croc

The fossil replica of Deinosuchus schwimmeri on display in the Tellus Science Museum. Credit: Tellus Science Museum

Dr. David Schwimmer, an expert on the giant North American crocodilian genus Deinosuchus and a Columbus State University geology professor, has contributed his research to the creation of the first-ever scholarly accurate, mounted skeleton replica of the species Deinosuchus schwimmeri. Known for decades as a “dinosaur-killer,” Deinosuchus was almost certainly the apex predator of its day.

Deinosuchus schwimmeri, which walked the eastern United States 83 million to 76 million years ago, was a dinosaur-eating, school-bus-sized relative of modern alligators. Measuring up to 31 feet (9.45 meters) long, the new Deinosuchus schwimmeri prototype was commissioned by the Tellus Science Museum in Cartersville, Georgia, and recently installed there. It marks the culmination of two years of Schwimmer’s consulting with Triebold Paleontology Inc., a leader in fossil skeleton models for museums, universities and attractions around the world.

“Each year, we have thousands of students visit us from across Georgia and neighboring states,” the Tellus Science Museum’s director of education, Hannah Eisla, explained. “Many of these students come on school field trips specifically to learn more about the region they call home and how it has changed over time. The addition of Deinosuchus schwimmeri allows us to provide a more detailed picture of this area’s ecosystem in the Cretaceous Period.”

“Tellus is currently the only museum to have a cast of Deinosuchus schwimmeri, so this is an experience our visitors can’t get anywhere else,” added Rebecca Melsheimer, the museum’s curatorial coordinator. “The scale of the dinosaurs and other creatures that lived during [the Late Cretaceous epoch] is hard to capture in words or pictures. We can tell you that Deinosuchus is 30 feet long, but seeing it is far more impactful.”

A group of paleontologists classified the new species of “terror croc” and named it Deinosuchus schwimmeri for Schwimmer in 2020, after years of Schwimmer’s meticulous fossil study, journal publications, conference presentations and a 2002 book on the giant North American Cretaceous crocodilian genus. In their article, published by the Journal of Vertebrate Paleontology in July 2020, they explained that naming it after Schwimmer honored “his tireless work on the Late Cretaceous paleontology of the Southeast and Eastern Seaboard, U.S..”

For more than 40 years, Schwimmer has searched for and excavated fossil evidence of Deinosuchus schwimmeri. The fossil artifacts he’s recovered are now permanently cared for and preserved by leading national “repository” museums, including the Smithsonian Institution in Washington, D.C., the American Museum of Natural History in New York and the Tellus Science Museum.

Creating a science-informed, life-sized fossil replica is a meticulous process, Schwimmer explained. In the case of Deinosuchus schwimmeri, the two-year project involved the Triebold Paleontology team capturing high-resolution 3D scans of Deinosuchus fossil records to rearticulate the creature’s detailed dermal armor and skeletal structure. He pointed out that the newly assembled replica better informs the field of paleontology.

“These replicas are more than just creating a ‘scare factor,'” Schwimmer explained. “Understanding dinosaurs’ predatory habits helps us decode some of nature’s greatest survival strategies. By studying these ancient apex predators, we are essentially looking back in time to see exactly how life adapted and dominated a changing world.”

Research decades in the making

Schwimmer grew up in New York City just 10 blocks from the American Museum of Natural History, and it was there that a terrifying skull display sparked his fascination with Deinosuchus. Since finding his first Deinosuchus fossil remains in 1979—a year after joining Columbus State (then Columbus College)—his research has focused on piecing together the life and environment of this creature.

Today, his research on Deinosuchus has made him a worldwide expert on life in the Late Cretaceous epoch (100.5 million years ago to 66 million years ago) in the Southeast U.S. His research, dating back to the 1980s, led to the discovery of evidence for specific “firsts” in Georgia: flying reptiles (pterodactyls), the first dinosaurs and the first Deinosuchus.

Schwimmer—who once worked as a science writer for pioneering ocean explorer Jacques-Yves Cousteau—detailed the first two decades of his research findings in his popular 2002 book, “King of the Crocodylians: The Paleobiology of Deinosuchus.” It was an Amazon top-seller in its category for several weeks and a popular book-of-the-month selection by science-oriented reading clubs, such as one organized by the Discovery Educator Network.

The book, which Schwimmer is currently updating, has helped shape the understanding of Deinosuchus and other Mesozoic animals in Georgia and garnered him international recognition as a top paleontology scholar. Since then, respected museums like Atlanta’s Fernbank Museum of Natural History, the University of Texas’ Vertebrate Paleontology Laboratory, and the Tellus Museum have sought his expertise on their fossil collections and educational displays.

In 2010, Schwimmer drew international attention for two published fossil studies linked to Deinosuchus: his research on dinosaur-bone bite marks, and research on fossilized dung (coprolites) by 2010 undergraduate environmental science and geology major Samantha (Harrell) Stanford, whom he supervised. Those studies appeared in the special symposium volume of the “New Mexico Museum of Natural History and Science Bulletin,” a publication with an international reputation, and at the March 2010 Geological Society of America Northeastern-Southeastern Annual Meeting. Harrell was cited as contributing to both studies.

Schwimmer pointed out that specialties like paleontology and other natural, Earth and space sciences offer students opportunities to conduct “backyard research” with faculty at regional universities like Columbus State. He said that locally based research opportunities are plentiful for students wishing to get their hands dirty, as well as offering other benefits.”

“[Harrell] came out in the field and collected fossils with me. At most universities, undergraduates rarely collaborate on or publish peer-reviewed research. Institutions of our size provide undergraduate students like Samantha with greater one-on-one access to faculty mentors and field-based research opportunities like this that, while local, are still quite impactful on the field,” Schwimmer said.

With several Deinosuchus sites within 40 miles of Columbus, the area has been a rich bed of discovery for Schwimmer and the student researchers who have tagged along on his expeditions. Schwimmer said that proximity is also what makes the Tellus Science Museum a natural place for one of the first Deinosuchus fossil replicas.

“Bones and fossils tell us only part of the story,” Schwimmer concluded. “Fully assembled, life-size replicas become a blueprint for better understanding the dynamic animals that creatures like Deinosuchus really were.”

Note: The above post is reprinted from materials provided by Columbus State University.

Prehistoric elephant footprints documented for first time in Murcia’s fossil dunes

Mustelipeda aff. punctata Kordos. Credit: Quaternary Science Reviews (2025). DOI: 10.1016/j.quascirev.2025.109631

An international team, involving researchers from the University of Seville, the Andalusian Institute of Earth Sciences in Granada and the University of Huelva, has identified the first fossilized vertebrate footprints from the Quaternary period in fossil dune deposits in Murcia, attributed to the elephant Palaeoloxodon antiquus, known as the straight-tusked elephant.

The study “New vertebrate footprint sites in the latest interglacial dune deposits on the coast of Murcia (southeast Spain). Ecological corridors for elephants in Iberia?” published in the journal Quaternary Science Reviews, reconstructs the movement routes of megafauna during the Last Interglacial, some 125,000 years ago. This record of footprints in coastal landscapes provides remarkable information about Iberian paleoecology.

The research was based on prospecting campaigns on the Murcian coast, in the areas of Calblanque and Torre de Cope, coordinated by Carlos Neto de Carvalho, from the Geology Office of the Municipality of Idanha-a-Nova and the University of Lisbon. The researchers Fernando Muñiz Guinea and Miguel Cortés-Sánchez, from the University of Seville, Francisco J. Jiménez Espejo and Jon Camuera, from IACT-CSIC (Granada), and Luis M. Cáceres, from the University of Huelva, participated in these campaigns. The team was completed by experts from Portugal, such as Noel Moreira (University of Évora) and João Belo (University of Coimbra).

Not only elephants, but also wolves and deer

Thanks to this work, the study has confirmed the existence of four areas with fossil footprints that evidence the presence of a very diverse community of mammals in a coastal forest ecosystem during the marine isotopic stage (MIS 5e) of Earth.

The main finding comes from Torre de Cope, where a 2.75-meter-long proboscidean trackway has been preserved, consisting of four rounded footprints 40–50 cm in diameter. The arrangement, typical of the quadrupedal gait of elephants, has made it possible to estimate that the trackway belonged to an adult Palaeoloxodon antiquus about 2.3 meters tall at the hip, over 30 years old and weighing approximately 2.6 tonnes.

Moreover, traces of a medium-sized mustelid have been found in Calblanque. The trail, one and a half meters long and consisting of ten almost circular footprints arranged in pairs, suggests slow movements near water sources. An isolated footprint of a canid, measuring 10 × 8 cm, with claw marks, has also been found in this area, pointing to the presence of predators such as wolves (Canis lupus) in wooded habitats.

In addition, bifid footprints up to 10 cm in size have been identified as compatible with red deer (Cervus elaphus). Their westward orientation indicates movement through dunes and scrubland. Meanwhile, the trail of a young equid (Equus ferus), with footprints measuring approximately 10 × 12 cm, represents the most recent record of this species in the south-east of the peninsula.

Taken together, these data support the hypothesis of coastal ecological corridors for seasonal migrations, connecting Mediterranean forests with beaches in a more humid landscape.

Coastal corridors and Neanderthal life in the Iberian Pleistocene

The possible megafaunal corridors located on the coast of Murcia open up a broader reflection on the role played by the Iberian Peninsula during the Pleistocene. This territory would have acted as a climate refuge for fauna and flora, as well as serving as a route for large mammals, including elephants.

In this study, the authors establish a connection between these coastal ecological corridors and paleoanthropology, showing a geographical coincidence between the routes followed by elephants in south-eastern Iberia and the sites with Neanderthal presence. These coastal areas would therefore have been rich in resources and key areas for hunting and subsistence for Neanderthal populations.

Reference:
Carlos Neto de Carvalho et al, New vertebrate tracksites from the Last Interglacial dune deposits of coastal Murcia (southeastern Spain): ecological corridors for elephants in Iberia?, Quaternary Science Reviews (2025). DOI: 10.1016/j.quascirev.2025.109631

Note: The above post is reprinted from materials provided by University of Seville.

Related Articles