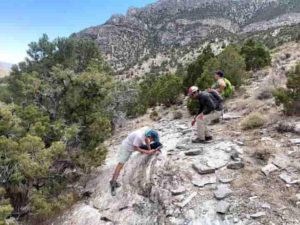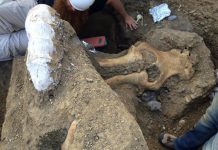
Matthew Siegfried inspects a GPS device, powered by a solar panel at Whillans Ice Plain. Credit: Grace Barcheck/Cornell University
At a glacier near the South Pole, earth scientists have found evidence of a quiet, slow-motion fault slip that triggers strong, fast-slip earthquakes many miles away, according to Cornell University research published in Science Advances.
During an earthquake, a fast slip happens when energy builds up underground and is released quickly along a fault. Blocks of earth rapidly slide against one another.
However, at an Antarctic glacier called Whillans Ice Plain, the earth scientists show that “slow slips” precede dozens of large magnitude 7 earthquakes. “We found that there is almost always a precursory ‘slow slip’ before an earthquake,” said lead author Grace Barcheck, research associate in Earth and Atmospheric Sciences at Cornell University.
Barcheck said that these slow-slip precursors — occurring as far as 20 miles away from the epicenter — are directly involved in starting the earthquake. “These slow slips are remarkably common,” she said, “and they migrate toward where the fast earthquake slip starts.”
Observations before several large tsunami-generating magnitude 8 and 9 earthquakes on subduction zone faults suggest a similar process may have occurred, according to Patrick Fulton, assistant professor and Croll Sesquicentennial Fellow in the Department of Earth and Atmospheric Sciences.
As these faults are mostly offshore and deep underwater, and because it is difficult to know when or where a large earthquake will occur, the start of large earthquakes is generally hard to observe.
To overcome these challenges, the scientists placed GPS sensors above an icy glacial fault at Whillans Ice Plain, where large magnitude 7 earthquakes occur nearly twice a day over a 60-mile-wide area of the glacier.
Within a period of two months in 2014, the group captured 75 earthquakes at the bottom of the Antarctic glacier. Data from GPS stations indicated that 73 — or 96% — of the 75 earthquakes showed a period of precursory slow motion.
The data from the GPS tracking stations and surface seismometers allowed the team to identify how the slow precursory slip triggers the fast earthquake slip.
“Our group was a little surprised to see so many precursors,” Barcheck said.
“In some cases, we can actually see the migration of the earthquake precursor towards where the earthquake begins.”
“Before we pored over the data, I thought that if we saw any precursors before the earthquakes, they would be rare and in the same place as the earthquake epicenter,” she said. “Instead, we found many slow-slip precursors — starting miles from the epicenters and migrating across the fault.”
Reference:
G. Barcheck, E. E. Brodsky, P. M. Fulton, M. A. King, M. R. Siegfried, S. Tulaczyk. Migratory earthquake precursors are dominant on an ice stream fault. Science Advances, 2021; 7 (6): eabd0105 DOI: 10.1126/sciadv.abd0105
Note: The above post is reprinted from materials provided by Cornell University. Original written by Blaine Friedlander.
The Middle America Trench, seen here as a dark blue strip off the Pacific coast of Central America, is a surface feature of a subduction zone extending from Mexico to Costa Rica. Credit: NOAA
When one tectonic plate dives beneath another at a subduction zone, it recycles huge amounts of water and other chemicals into Earth’s mantle. The sinking plate carries seawater trapped in sediments and crust or chemically bound in minerals like serpentine. Later release of this water in the mantle contributes to key geological processes, such as earthquakes and the formation of volcano-feeding magma.
By volume, the largest portion of a subducting plate is its bottom layer, which comprises upper mantle material. Estimates of the amount of water in down-going slabs of upper mantle vary widely: Some suggest that worldwide, subduction zones have swallowed more than two oceans’ worth of water in the past 540 million years. However, new research by Miller et al. suggests that water transport at the Middle America Trench subduction zone is an order of magnitude less than previously estimated.
As a plate approaches a subduction zone, it bends downward, causing faults to form. Models and earlier observations have suggested that this bending and faulting allow seawater to infiltrate into the upper mantle, where it fills cracks in fault zones, reacts with olivine to produce serpentine, and is later carried deeper into the subduction zone.
Previous estimates of how much water reaches the upper mantle along bending faults have relied on measurements of the speed of seismic waves as they pass through a subducting plate. However, those measurements and estimates could not discern whether the upper mantle layer is uniformly hydrated or whether water is confined to bending fault zones.
To address that limitation, the new study accounted for seismic anisotropy characterizing how the speed of seismic waves depends on the direction they travel through a material. The researchers used data collected by seafloor seismometers to measure seismic anisotropy along the Middle America Trench near Nicaragua, which enabled a much more detailed picture of upper mantle hydration.
The data revealed that in the region studied, water storage in the upper mantle is limited to serpentinized fault zones that thin rapidly with depth, suggesting that fault dynamics and serpentinization reaction kinetics prevent seawater from hydrating the mantle between bending faults. New estimates of water transport that incorporate this finding are an order of magnitude lower than previous estimates for the Middle America Trench. Because the same processes occur at other subduction zones, the researchers report that far less water may be transported worldwide than previously estimated.
Reference:
Nathaniel C. Miller et al. Limited Mantle Hydration by Bending Faults at the Middle America Trench, Journal of Geophysical Research: Solid Earth (2020). DOI: 10.1029/2020JB020982
An overview of tsunami prediction with AI Credit: Tohoku University, University of Tokyo, and Fujitsu Laboratories
A new AI model that harnesses the power of the world’s fastest supercomputer, Fugaku, can rapidly predict tsunami flooding in coastal areas before the tsunami reaches land.
The development of the new technology was announced as part of a joint project between the International Research Institute of Disaster Science (IREDeS) at Tohoku University, the Earthquake Research Institute at the University of Tokyo, and Fujitsu Laboratories.
The 2011 Great East Japan Earthquake and subsequent tsunami highlighted the shortcomings in disaster mitigation and the need to utilize information for efficient and safe evacuations.
While tsunami observation networks in Japanese coastal waters have been strengthened since then, using the data produced from those networks to predict a tsunami’s path once it hits land has gained greater urgency. This is especially true since a major earthquake is likely to hit Japan’s densely populated east coast sometime in the near future.
Tsunami prediction technologies will allow authorities to obtain accurate information quickly and aid them in effectively directing evacuation orders.
Fujitsu, Tohoku University, and The University of Tokyo leveraged the power of Fugaku to generate training data for 20,000 possible tsunami scenarios based on high-resolution simulations. These scenarios were used to streamline an AI model that uses offshore waveform data generated by the tsunami to predict flooding before landfall at high spatial resolution.
Conventional prediction technologies require the use of supercomputers and make rapid prediction systems difficult to implement. The current AI model, however, can be run in seconds on ordinary PCs.
When the model was applied to a simulation of tsunami flooding in Tokyo Bay following a large earthquake, it achieved highly accurate predictions with a regular PC within seconds. The results matched tsunami flooding of the tsunami source models released by the Cabinet Office of Japan.
The research team will continue to make use of Fugaku’s high-speed performance in the future by training the system with additional tsunami scenarios. Doing so will help realize AI that can predict tsunami flooding over even wider areas.
It was tens of miles wide and forever changed history when it crashed into Earth about 66 million years ago.
The Chicxulub impactor, as it’s known, left behind a crater off the coast of Mexico that spans 93 miles and goes 12 miles deep. Its devastating impact brought the reign of the dinosaurs to an abrupt and calamitous end by triggering their sudden mass extinction, along with the end of almost three-quarters of the plant and animal species then living on Earth.
The enduring puzzle has always been where the asteroid or comet that set off the destruction originated, and how it came to strike the Earth. And now a pair of Harvard researchers believe they have the answer.
In a study published in Scientific Reports, Avi Loeb, Frank B. Baird Jr. Professor of Science at Harvard, and Amir Siraj ’21, an astrophysics concentrator, put forth a new theory that could explain the origin and journey of this catastrophic object and others like it.
Using statistical analysis and gravitational simulations, Loeb and Siraj show that a significant fraction of a type of comet originating from the Oort cloud, a sphere of debris at the edge of the solar system, was bumped off-course by Jupiter’s gravitational field during its orbit and sent close to the sun, whose tidal force broke apart pieces of the rock. That increases the rate of comets like Chicxulub (pronounced Chicks-uh-lub) because these fragments cross the Earth’s orbit and hit the planet once every 250 to 730 million years or so.
“Basically, Jupiter acts as a kind of pinball machine,” said Siraj, who is also co-president of Harvard Students for the Exploration and Development of Space and is pursuing a master’s degree at the New England Conservatory of Music. “Jupiter kicks these incoming long-period comets into orbits that bring them very close to the sun.”
It’s because of this that long-period comets, which take more than 200 years to orbit the sun, are called sun grazers, he said.
“When you have these sun grazers, it’s not so much the melting that goes on, which is a pretty small fraction relative to the total mass, but the comet is so close to the sun that the part that’s closer to the sun feels a stronger gravitational pull than the part that is farther from the sun, causing a tidal force” he said. “You get what’s called a tidal disruption event and so these large comets that come really close to the sun break up into smaller comets. And basically, on their way out, there’s a statistical chance that these smaller comets hit the Earth.”
The calculations from Loeb and Siraj’s theory increase the chances of long-period comets impacting Earth by a factor of about 10, and show that about 20 percent of long-period comets become sun grazers. That finding falls in line with research from other astronomers.
The pair claim that their new rate of impact is consistent with the age of Chicxulub, providing a satisfactory explanation for its origin and other impactors like it.
“Our paper provides a basis for explaining the occurrence of this event,” Loeb said. “We are suggesting that, in fact, if you break up an object as it comes close to the sun, it could give rise to the appropriate event rate and also the kind of impact that killed the dinosaurs.”
Loeb and Siraj’s hypothesis might also explain the makeup of many of these impactors.
“Our hypothesis predicts that other Chicxulub-size craters on Earth are more likely to correspond to an impactor with a primitive (carbonaceous chondrite) composition than expected from the conventional main-belt asteroids,” the researchers wrote in the paper.
This is important because a popular theory on the origin of Chicxulub claims the impactor is a fragment of a much larger asteroid that came from the main belt, which is an asteroid population between the orbit of Jupiter and Mars. Only about a tenth of all main-belt asteroids have a composition of carbonaceous chondrite, while it’s assumed most long-period comets have it. Evidence found at the Chicxulub crater and other similar craters that suggests they had carbonaceous chondrite.
This includes an object that hit about 2 billion years ago and left the Vredefort crater in South Africa, which is the largest confirmed crater in Earth’s history, and the impactor that left the Zhamanshin crater in Kazakhstan, which is the largest confirmed crater within the last million years.
The researchers say that composition evidence supports their model and that the years the objects hit support both their calculations on impact rates of Chicxulub-sized tidally disrupted comets and for smaller ones like the impactor that made the Zhamanshin crater. If produced the same way, they say those would strike Earth once every 250,000 to 730,000 years.
Loeb and Siraj say their hypothesis can be tested by further studying these craters, others like them, and even ones on the surface of the moon to determine the composition of the impactors. Space missions sampling comets can also help.
Aside from composition of comets, the new Vera Rubin Observatory in Chile may be able to see the tidal disruption of long-period comets after it becomes operational next year.
“We should see smaller fragments coming to Earth more frequently from the Oort cloud,” Loeb said. “I hope that we can test the theory by having more data on long-period comets, get better statistics, and perhaps see evidence for some fragments.”
Loeb said understanding this is not just crucial to solving a mystery of Earth’s history but could prove pivotal if such an event were to threaten the planet again.
“It must have been an amazing sight, but we don’t want to see that side,” he said.
Reference:
Siraj, A., Loeb, A. . Breakup of a long-period comet as the origin of the dinosaur extinction. Sci Rep, 2021 DOI: 10.1038/s41598-021-82320-2
Note: The above post is reprinted from materials provided by Harvard University. Original written by Juan Siliezar.
An artist’s illustration shows a mosasaur feeding on a plesiosaur called elasmosaur, although there is no fossil evidence of mosasaurs feeding on this particular species. Illustration/Takashi Oda
The songs of fin whales can be used for seismic imaging of the oceanic crust, providing scientists a novel alternative to conventional surveying, a new study published this week in Science shows.
Fin whale songs contain signals that are reflected and refracted within the crust, including the sediment and the solid rock layers beneath. These signals, recorded on seismometers on the ocean bottom, can be used to determine the thickness of the layers as well as other information relevant to seismic research, said John Nabelek, a professor in Oregon State University’s College of Earth, Ocean, and Atmospheric Sciences and a co-author of the paper.
“People in the past have used whale calls to track whales and study whale behavior. We thought maybe we can study the Earth using those calls,” Nabelek said. “What we discovered is that whale calls may serve as a complement to traditional passive seismic research methods.”
The paper serves as a proof of concept that could provide new avenues for using data from whale calls in research, Nabelek said.
“This expands the use of data that is already being collected,” he said. “It shows these animal vocalizations are useful not just for understanding the animals, but also understanding their environment.”
The study’s lead author is Vaclav M. Kuna, who worked on the project as a doctoral student at Oregon State and has since completed his Ph.D.
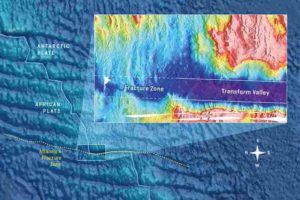
Kuna and Nabelek were studying earthquakes from a network of 54 ocean-bottom seismometers placed along the Blanco transform fault, which at its closest is about 100 miles off Cape Blanco on the Oregon Coast.
They noted strong signals on the seismometers that correlated with whales’ presence in the area.
“After each whale call, if you look closely at the seismometer data, there is a response from the Earth,” Nabelek said.
Whale calls bounce between the ocean surface and the ocean bottom. Part of the energy from the calls transmits through the ground as a seismic wave. The wave travels through the oceanic crust, where it is reflected and refracted by the ocean sediment, the basalt layer underneath it and the gabbroic lower crust below that.
When the waves are recorded at the seismometer, they can provide information that allows researchers to estimate and map the structure of the crust.
Using a series of whale songs that were recorded by three seismometers, the researchers were able to pinpoint the whale’s location and use the vibrations from the songs to create images of the Earth’s crust layers.
Researchers use information from these layers to learn more about the physics of earthquakes in the region, including how sediment behaves and the relationship between its thickness and velocity. Earthquakes shake up the sediment, expelling water and speeding up the settlement of the sediment.
The current traditional method for imaging of the crust can be expensive and permits can be difficult to obtain because the work involves deploying air guns, Nabelek said. The imaging created using the whale songs is less invasive, though overall it is of lower resolution.
Future research could include using machine learning to automate the process of identifying whale songs and developing images of their surroundings, Nabelek said.
“The data from the whale songs is useful but it doesn’t completely replace the standard methods,” he said. “This method is useful for investigating the Earth’s oceanic crust where standard science survey methods are not available.”
Reference:
Václav M. Kuna, John L. Nábělek. Seismic crustal imaging using fin whale songs. Science, 2021; 371 (6530): 731 DOI: 10.1126/science.abf3962
Long held in a private collection, the newly analysed tooth of an approximately 9-year-old Neanderthal child marks the hominin’s southernmost known range. Analysis of the associated archaeological assemblage suggests Neanderthals used Nubian Levallois technology, previously thought to be restricted to Homo sapiens.
With a high concentration of cave sites harbouring evidence of past populations and their behaviour, the Levant is a major centre for human origins research. For over a century, archaeological excavations in the Levant have produced human fossils and stone tool assemblages that reveal landscapes inhabited by both Neanderthals and Homo sapiens, making this region a potential mixing ground between populations. Distinguishing these populations by stone tool assemblages alone is difficult, but one technology, the distinct Nubian Levallois method, is argued to have been produced only by Homo sapiens.
In a new study published in Scientific Reports, researchers from the Max Planck Institute for the Science of Human History teamed up with international partners to re-examine the fossil and archaeological record of Shukbah Cave. Their findings extend the southernmost known range of Neanderthals and suggest that our now-extinct relatives made use of a technology previously argued to be a trademark of modern humans. This study marks the first time the lone human tooth from the site has been studied in detail, in combination with a major comparative study examining the stone tool assemblage.
“Sites where hominin fossils are directly associated with stone tool assemblages remain a rarity — but the study of both fossils and tools is critical for understanding hominin occupations of Shukbah Cave and the larger region,” says lead author Dr Jimbob Blinkhorn, formerly of Royal Holloway, University of London and now with the Pan-African Evolution Research Group (Max Planck Institute for the Science of Human History).
Shukbah Cave was first excavated in the spring of 1928 by Dorothy Garrod, who reported a rich assemblage of animal bones and Mousterian-style stone tools cemented in breccia deposits, often concentrated in well-marked hearths. She also identified a large, unique human molar. However, the specimen was kept in a private collection for most of the 20th century, prohibiting comparative studies using modern methods. The recent re-identification of the tooth at the Natural History Museum in London has led to new detailed work on the Shukbah collections.
“Professor Garrod immediately saw how distinctive this tooth was. We’ve examined the size, shape and both the external and internal 3D structure of the tooth, and compared that to Holocene and Pleistocene Homo sapiens and Neanderthal specimens. This has enabled us to clearly characterise the tooth as belonging to an approximately 9 year old Neanderthal child,” says Dr. Clément Zanolli, from Université de Bordeaux. “Shukbah marks the southernmost extent of the Neanderthal range known to date,” adds Zanolli.
Although Homo sapiens and Neanderthals shared the use of a wide suite of stone tool technologies, Nubian Levallois technology has recently been argued to have been exclusively used by Homo sapiens. The argument has been made particularly in southwest Asia, where Nubian Levallois tools have been used to track human dispersals in the absence of fossils.
“Illustrations of the stone tool collections from Shukbah hinted at the presence of Nubian Levallois technology so we revisited the collections to investigate further. In the end, we identified many more artefacts produced using the Nubian Levallois methods than we had anticipated,” says Blinkhorn. “This is the first time they’ve been found in direct association with Neanderthal fossils, which suggests we can’t make a simple link between this technology and Homo sapiens.”
“Southwest Asia is a dynamic region in terms of hominin demography, behaviour and environmental change, and may be particularly important to examine interactions between Neanderthals and Homo sapiens,” adds Prof Simon Blockley, of Royal Holloway, University of London. “This study highlights the geographic range of Neanderthal populations and their behavioural flexibility, but also issues a timely note of caution that there are no straightforward links between particular hominins and specific stone tool technologies.”
“Up to now we have no direct evidence of a Neanderthal presence in Africa,” said Prof Chris Stringer of the Natural History Museum. “But the southerly location of Shukbah, only about 400 km from Cairo, should remind us that they may have even dispersed into Africa at times.”
Partnerships
Researchers involved in this study include scholars from the Max Planck Institute for the Science of Human History, Royal Holloway, University of London, the Université de Bordeaux, the Max Planck Institute for Chemical Ecology, the University of Malta, and the Natural History Museum, London. This work was supported by the Leverhulme trust (RPH-2017-087).
Reference:
James Blinkhorn, Clément Zanolli, Tim Compton, Huw S. Groucutt, Eleanor M. L. Scerri, Lucile Crété, Chris Stringer, Michael D. Petraglia & Simon Blockley. Nubian Levallois technology associated with southernmost Neanderthals. Scientific Reports, 2021 DOI: 10.1038/s41598-021-82257-6
The colorful banded Tepees are part of the Blue Mesa Member, a geological feature about 220 million to 225 million years old in the Chinle Formation in Petrified Forest National Park in Arizona. Credit: NPS
How did rocks rust on Earth and turn red? A Rutgers-led study has shed new light on the important phenomenon and will help address questions about the Late Triassic climate more than 200 million years ago, when greenhouse gas levels were high enough to be a model for what our planet may be like in the future.
“All of the red color we see in New Jersey rocks and in the American Southwest is due to the natural mineral hematite,” said lead author Christopher J. Lepre, an assistant teaching professor in the Department of Earth and Planetary Sciences in the School of Arts and Sciences at Rutgers University-New Brunswick. “As far as we know, there are only a few places where this red hematite phenomenon is very widespread: one being the geologic ‘red beds’ on Earth and another is the surface of Mars. Our study takes a significant step forward toward understanding how long it takes for redness to form, the chemical reactions involved and the role hematite plays.”
The research by Lepre and a Columbia University scientist is in the journal Proceedings of the National Academy of Sciences. It challenges conventional thinking that hematite has limited use for interpreting the ancient past because it is a product of natural chemical changes that occurred long after the beds were initially deposited.
Lepre demonstrated that hematite concentrations faithfully track 14.5 million years of Late Triassic monsoonal rainfall over the Colorado Plateau of Arizona when it was on the ancient supercontinent of Pangea. With this information, he assessed the interrelationships between environmental disturbances, climate and the evolution of vertebrates on land.
Lepre examined part of a 1,700-foot-long rock core from the Chinle Formation in the Petrified Forest National Park in Arizona (the Painted Desert) that is housed at Rutgers. Rutgers-New Brunswick Professor Emeritus Dennis V. Kent examined the same core for a Rutgers-led study that found that gravitational tugs from Jupiter and Venus slightly elongate Earth’s orbit every 405,000 years and influenced Earth’s climate for at least 215 million years, allowing scientists to better date events like the spread of dinosaurs.
Lepre measured the visible light spectrum to determine the concentration of hematite within red rocks. To the scientists’ knowledge, it is the first time this method has been used to study rocks this old, dating to the Late Triassic epoch more than 200 million years ago. Many scientists thought the redness was caused much more recently by the iron in rocks reacting with air, just like rust on a bicycle. So for decades, scientists have viewed hematite and its redness as largely unimportant.
“The hematite is indeed old and probably resulted from the interactions between the ancient soils and climate change,” Lepre said. “This climate information allows us to sort out some causes and effects—whether they were due to climate change or an asteroid impact at Manicouagan in Canada, for example—for land animals and plants when the theropod dinosaurs (early ancestors of modern birds and Tyrannosaurus rex) were rising to prominence.”
The scientists, in collaboration with Navajo Nation members, have submitted a multi-million dollar grant proposal to retrieve more cores at the Colorado Plateau that will include rocks known to record a very rapid atmospheric change in carbon dioxide similar to its recent doubling as a result of human activity.
Reference:
Christopher J. Lepre el al., “Hematite reconstruction of Late Triassic hydroclimate over the Colorado Plateau,” PNAS (2021). www.pnas.org/cgi/doi/10.1073/pnas.2004343118
Rock samples collected near the Antarctic volcano Mount Erebus, seen here in the distance, harbor fingerprints of Earth’s ancient magnetic field. A new analysis delves into discrepancies between these fingerprints and predictions from a long-standing approximation of the field. Credit: Hanna Asefaw
The movement of molten metals in Earth’s outer core generates a vast magnetic field that protects the planet from potentially harmful space weather. Throughout Earth’s history, the structure of the magnetic field has fluctuated. However, data suggest that averaged over sufficient time, the field may be accurately approximated by a geocentric axial dipole (GAD) field—the magnetic field that would result from a bar magnet centered within Earth and aligned along its axis of rotation.
Now Asefaw et al. present evidence demonstrating that the GAD approximation may not represent the intensity of the paleomagnetic field over the past 5 million years as well as it represents the directions of the field.
Clues to the direction and intensity of the paleomagnetic field at a given moment in Earth’s history can be preserved in magnetic grains in rocks that formed at that time. The new research stemmed from observations that rocks in Antarctica indicate a lower paleomagnetic field intensity than would be predicted by a GAD field for that latitude when compared with global paleomagnetic field intensities.
To determine whether these seemingly low intensities accurately represent the paleomagnetic field, the researchers reevaluated previously published data and collected new samples from lava flows around the Erebus Volcanic Province in Antarctica. They analyzed the magnetic properties of the samples and followed a strict protocol to weed out potentially poor data.
The analysis yielded estimates for directional features of the paleomagnetic field that are in line with the GAD hypothesis. However, estimates of field intensity remained lower than expected. The reason, according to the researchers, may be that the average intensity of the paleomagnetic field over the past 5 million years was weaker than the modern geomagnetic field. Or, the field may have included stronger deviations from a GAD field structure.
The authors say they intend to analyze paleointensity and paleodirections from several other latitudes over the same time period to resolve these outstanding questions. The resulting insights could improve reconstructions of Earth’s paleomagnetic history and inform models of past and future changes to Earth’s magnetic field.
Reference:
H. Asefaw et al. Four‐Dimensional Paleomagnetic Dataset: Plio‐Pleistocene Paleodirection and Paleointensity Results From the Erebus Volcanic Province, Antarctica, Journal of Geophysical Research: Solid Earth (2020). DOI: 10.1029/2020JB020834
Several types of dinoflagellates are shown in this microscope image. Some dinoflagellates are classified as nanoplankton, which new research shows have a more important role in Earth’s biological pump than previously thought. Credit: fickleandfreckled, CC BY 2.0
Every spring, phytoplankton blooms flourish across the ocean. The single-celled, photosynthetic organisms pull carbon dioxide from the atmosphere and produce oxygen—part of a carbon sequestration system known as the biological pump.
Widely used numerical and satellite-based models assume that primary production and net community production (or the net amount of carbon removed from the atmosphere through the biological pump) are greatest in ecosystems dominated by plankton larger than 20 micrometers, known as microplankton, and lowest in those dominated by plankton smaller than 2 micrometers, known as picoplankton. However, the role of plankton in between those sizes, known as nanoplankton, has largely been ignored. Now Juranek et al. show that nanoplankton may play a more significant role than previously thought.
The team studied the relationship between size and productivity in a region of the North Pacific Transition Zone (NPTZ), a subtropical-subpolar, basin-sized feature characterized by strong physical, chemical, and ecological gradients. The team members conducted three transects of the NPTZ in the spring or early summer of 2016, 2017, and 2019, crossing a feature known as the transition zone chlorophyll front, where net community production rates were as much as five times higher than those south of the transition zone.
The authors used a combination of approaches to characterize the size and diversity of plankton ranging from 0.5 to 100 micrometers in diameter. These measurements were compared to productivity rates determined both by an incubation-based method and by tracking the ratio of dissolved oxygen to argon in the seawater, which is related to net organic carbon production.
These coordinated data streams revealed a strong and previously unidentified link between variation in net community production and the biomass of nanoplankton. With additional insights from modeling, the authors suggest that both bottom-up factors, such as nutrient supply, and top-down factors, like size-specific grazing by predators, contribute to the importance of nanoplankton in the transition zone.
Models that fail to account for these middle-sized plankton may underestimate primary production and the efficiency of the biological pump, the researchers say. Understanding the role of nanoplankton will be critical as scientists work to understand how climate change may affect the carbon cycle in the future.
Reference:
Lauren W. Juranek et al. The Importance of the Phytoplankton “Middle Class” to Ocean Net Community Production, Global Biogeochemical Cycles (2020). DOI: 10.1029/2020GB006702
Mylonite is a fine-grained, compact metamorphic rock produced by dynamic recrystallization of the constituent minerals resulting in a reduction of the grain size of the rock. Credit: Wikipedia
A new study suggests that tiny, mineral grains—squeezed and mixed over millions of years—set in motion the chain of events that plunge massive tectonic plates deep into the Earth’s interior.
The theory, proposed by Yale scientists David Bercovici and Elvira Mulyukova, may provide an origin story for subduction, one of the most fundamental forces responsible for the dynamic nature of the planet.
The study appears in the Proceedings of the National Academy of Sciences.
Subduction occurs when one tectonic plate slides underneath another plate and then sinks into the Earth’s mantle. Its role in major geological processes is immense: It is the main engine for tectonic motion. It builds mountains, triggers earthquakes, forms volcanoes, and drives the geologic carbon cycle.
Yet researchers have been uncertain about what initiates subduction.
“Why Earth even has subduction, unlike other terrestrial planets as far as we know, is a mystery,” said Bercovici, Yale’s Frederick William Beinecke Professor and chair of Earth and Planetary Sciences.
“Mantle rock near the surface that has cooled for hundreds of millions of years has two competing effects,” he said. “While it’s gotten colder and heavier and wants to sink, it’s also gotten stiffer and doesn’t want to sink. The stiffening effect should win out, as it does on most planets, but on Earth, for some reason, it doesn’t.”
According to the theoretical model developed by Bercovici and Mulyukova, a research scientist at Yale, subduction may initiate at the margins between Earth’s sea floor and continents.
The model shows that tectonic stresses in an oceanic plate cause its mineral grains to mix with each other, become damaged, and eventually shrink. Over a period of approximately 100 million years, this process weakens the oceanic plate and makes it susceptible to vertical shear and bending—which are associated with the start of subduction.
“The real bottleneck for tectonic plate activity on a terrestrial planet is how fast its massive, rocky layers can deform,” said Mulyukova. “The rocks can deform only as fast as their tiny mineral grains allow. Our model explains how these changes in mineral grains can dramatically weaken the rock and make subduction possible on a planet like Earth.”
Professor Cathryn Newton studies Middle Devonian marine faunas (such as these brachiopods from 380-390 million years ago), whose fossils are lodged in a unit of bedrock in Central New York. Credit: Syracuse University
Members of Syracuse University’s College of Arts and Sciences are shining new light on an enduring mystery — one that is millions of years in the making.
A team of paleontologists led by Professor Cathryn Newton has increased scientists’ understanding of whether Devonian marine faunas, whose fossils are lodged in a unit of bedrock in Central New York known as the Hamilton Group, were stable for millions of years before succumbing to waves of extinctions.
Drawing on 15 years of quantitative analysis with fellow professor Jim Brower (who died in 2018), Newton has continued to probe the structure of these ancient fossil communities, among the most renowned on Earth.
The group’s findings, reported by the Geological Society of America (GSA), provide critical new evidence for the unusual, long-term stability of these Devonian period communities.
Such persistence, Newton says, is a longstanding scientific enigma. She and her colleagues tested the hypothesis that these ancient communities displayed coordinated stasis — a theory that attempts to explain the emergence and disappearance of species across geologic time.
Newton and Brower, along with their student Willis Newman G’93, found that Devonian marine communities vary more in species composition than the theory predicts. Newton points out that they sought not to disprove coordinated stasis but rather to gain a more sophisticated understanding of when it is applicable. “Discovering more about the dynamics of these apparently stable Devonian communities is critical,” she says. “Such knowledge has immediate significance for marine community changes in our rapidly warming seas.”
Since geologist James Hall Jr. first published a series of volumes on the region’s Devonian fossils and strata in the 1840s, the Hamilton Group has become a magnet for research scientists and amateur collectors alike. Today, Central New York is frequently used to test new ideas about large-scale changes in Earth’s organisms and environments.
During Middle Devonian time (approximately 380-390 million years ago), the faunal composition of the region changed little over 4-6 million years. “It’s a significant amount for marine invertebrate communities to remain stable, or ‘locked,'” explains Newton, a professor in the Department of Earth and Environmental Sciences.
She, Brower and student researchers spent years examining eight communities of animals that once dwelled in a warm, shallow sea on the northern rim of the Appalachian Basin (which, eons ago, lay south of the equator). When the organisms died, sediment from the seafloor began covering their shells and exoskeletons. Minerals from the sediment gradually seeped into their remains, causing them to fossilize. The process also preserved many of them in living position, conserving original shell materials at some sites.
These fossils currently populate exposed bedrock throughout Central New York, ranging from soft, dark, deep-water shale to hard, species-rich, shelf siltstone. “Communities near the top of the bedrock exhibit more taxonomic and ecological diversity than those at the bottom,” Newton says. “We can compare the community types and composition through time. They are remarkable sites.”
Coordinated stasis has been a source of contention since 1995, when it was introduced. At the center of the dispute are two model-based explanations: environmental tracking and ecological locking.
Environmental tracking suggests that faunas follow their environment. “Here, periods of relative stasis are flanked by coordinated extinctions or regional disappearances. When the environment changes, so do marine faunas,” says Newton, also Professor of Interdisciplinary Sciences and Dean Emerita of Arts and Sciences.
Ecological locking, in contrast, views marine faunas as tightly structured communities, resistant to large-scale taxonomic change. Traditionally, this model has been used to describe the stability of lower Hamilton faunas.
Newton and her colleagues analyzed more than 80 sample sites, each containing some 300 specimens. Special emphasis was placed on the Cardiff and Pecksport Members, two rock formations in the Finger Lakes region that are part of the ancient Marcellus subgroup, famed for its natural gas reserves.
“We found that lower Hamilton faunas, with two exceptions, do not have clear counterparts among upper ones. Therefore, our quantitative tests do not support the ecological locking model as an explanation for community stability in these faunas,” she continues.
Newton considers this project a final tribute to Newman, a professor of biology at the State University of New York at Cortland, who died in 2014, and Brower, who fell seriously ill while the manuscript was being finalized. “Jim knew that he likely would not live to see its publication,” says Newton, adding that Brower died as the paper was submitted to GSA.
She says this new work extends and, in some ways, completes the team’s earlier research by further analyzing community structures in the Marcellus subgroup. “It has the potential to change how scientists view long-term stability in ecological communities.”
Reference:
Cathryn R. Newton, Willis B. Newman, James C. Brower. Quantitative paleoecology of marine faunas in the lower Hamilton Group (Middle Devonian, central New York): Significance for probing models of long-term community stability. GeoScience World, 2021 DOI: 10.1130/2020.2545(09)
Note: The above post is reprinted from materials provided by Syracuse University. Original written by Rob Enslin.
The newly named trace fossil Glossifungites gingrasi is a collection of burrows that were home to water-dwelling insects, similar to mayflies, more than 90 million years ago. (Photo: Ryan King)
A newly discovered trace fossil of an ancient burrow has been named after University of Alberta paleontologist Murray Gingras. The fossil, discovered by a former graduate student, has an important role to play in gauging how salty ancient bodies of water were, putting together a clearer picture of our planet’s past.
“Naming the fossil after Gingras was a straightforward decision since his research focuses on tying modern observations of how salinity and substrate affect organism burrowing to ancient burrow appearance and species abundance trends.”
Trace fossils are a type of fossil that preserves activity of ancient life in the geological record. They include fossilized footprints, nests, droppings and, in this case, a fossilized burrow dug by an organism that lived in a watery environment.
The fossilized burrow, named Glossifungites gingrasi, is from the late Cretaceous of central Utah and was home to water-dwelling insects, similar to mayflies, more than 90 million years ago.
“Fossils like this are significant because they help us narrow down what type of organism dug the burrow — which in turn will tell us about the salinity of the water in which they lived,” said King.
Many organisms make use of burrows for shelter and protection while they feed. These animal-constructed sedimentary structures give researchers a clearer picture of biological communities and are important in understanding ancient rivers, bays, estuaries and oceans through their oxygenation levels and saltiness, King explained.
Murray Gingras, professor in the Department of Earth and Atmospheric Sciences, was the co-advisor for King’s doctoral studies and for the master’s degree of another researcher on the team, Andrew La Croix, now an assistant professor at the University of Waikato.
“I was surprised and honoured,” said Gingras of the recognition. “I have been recognized with a few different awards over the years, but nothing really came close to the pride and elation I felt when Ryan informed me that he and Andrew formally named a trace fossil for me.”
Reference:
M. Ryan King, Andrew D. La Croix, Terry A. Gates, Paul B. Anderson, Lindsay E. Zanno. Glossifungites gingrasi n. isp., a probable subaqueous insect domicile from the Cretaceous Ferron Sandstone, Utah. Journal of Paleontology, 2021; 1 DOI: 10.1017/jpa.2020.115
Scientists identified flank instability at Pacaya, an active volcano in Guatemala. Credit: Kirsten Stephens/Penn State
Landslides caused by the collapse of unstable volcanoes are one of the major dangers of volcanic eruptions. A method to detect long-term movements of these mountains using satellite images could help identify previously overlooked instability at some volcanoes, according to Penn State scientists.
“Whenever there is a large volcanic eruption, there is a chance that if a flank of the volcano is unstable there could be a collapse,” said Judit Gonzalez-Santana, a doctoral student in the Department of Geosciences. “To better explore this hazard, we applied an increasingly popular and more sensitive time-series method to look at these movements, or surface deformation, over longer time periods.”
Using the time-series technique, the scientists found surface deformation related to flank motion had occurred at Pacaya, an active volcano in Guatemala, from 2011 to 2013 when the volcano was largely quiet, and increased leading up to an eruption in 2014. Previous work had not identified flank motion during this time, the scientists said.
“People have looked at that volcano with satellite remote sensing but did not detect this long-term flank motion or creep,” said Christelle Wauthier, associate professor of geosciences. “Because the surface deformation changes are pretty small per year, it can easily be below the detection limits of conventional methods, but still within the limits of Judit’s work using a time-series approach.”
Scientists track surface deformation using radar satellites sensitive enough to spot changes of just a few inches on the ground. Comparing two of these images using the conventional Interferometric Synthetic Aperture Radar (InSAR) technique creates an interferogram, essentially a map of surface movement. But the quality of the InSAR results decreases with the time separating two images and can be affected by even small changes, like from vegetation growth or a buildup of ash spewed from a volcano, the scientists said.
The team instead conducted an InSAR time-series analysis using hundreds of satellite images taken over years and identifying surface deformation between each.
“You can use many of these short-term surface movement maps to give you information of surface displacement over a long time period,” Gonzalez-Santana said. “Then you can look at the surface deformation maps and see how much each pixel has been moving since the date the first image was acquired, for example.”
The results, published in the Journal of Volcanology and Geothermal Research, provide finer detail of volcanic flank motion, and can reveal upticks in the rate that creep is occurring, like at Pacaya before the eruption in 2014, the scientists said. The team has shared the results with officials in Guatemala who monitor the volcano.
“This kind of creep is not uncommon and not particularly dangerous on its own, but if you have extra forcings like from magma being pressurized and pushing against the wall of the chamber or intrusion, it can trigger a catastrophic collapse,” Wauthier said. “To be able to understand the behavior of the instability and potentially detect changes in rates of motion is very critical for monitoring that potential collapse.”
The method shows promise for identifying deformation particularly at volcanoes that lack expensive real-time monitoring networks and those located in tropical areas with thick vegetation that create problems for traditional InSAR, the scientists said.
Flank instability is often studied at oceanic volcanoes, where a collapse could trigger a deadly tsunami, according to the scientists. But collapses also happen inland, including prominently at Mount St. Helens in 1980.
Pacaya itself experienced a collapse sometime around 1,000 years ago, creating a debris avalanche that traveled more than 15 miles, and leaving a prominent scar on the volcano. Subsequent eruptions have built the volcano back up and it could someday again collapse, the scientists said.
“More than 10,000 people live within about three miles of the volcano,” Gonzalez-Santana said. “If you take into consideration the last avalanche traveled 15 miles away, anyone living in the valleys around the volcano could be at risk.”
A NASA Earth Surface and Interior grant, a Future Investigators in NASA Earth and Space Science and Technology grant, and an Institute for Computational and Data Sciences seed grant funded this research.
Reference:
Judit Gonzalez-Santana, Christelle Wauthier. Unraveling long-term volcano flank instability at Pacaya Volcano, Guatemala, using satellite geodesy. Journal of Volcanology and Geothermal Research, 2020; 107147 DOI: 10.1016/j.jvolgeores.2020.107147
Note: The above post is reprinted from materials provided by Penn State. Original written by Matthew Carroll.
New research from Queen Mary University of London and the University of Maryland, has reignited the debate around the behaviour of the giant dinosaur Spinosaurus.
Since its discovery in 1915, the biology and behaviour of the enormous Spinosaurus has puzzled palaeontologists worldwide. It was recently argued that the dinosaur was largely an aquatic predator, using its large tail to swim and actively pursue fish in the water.
The new study, published today in Palaeontologia Electronica, challenges this recent view of Spinosaurus suggesting that whilst it likely fed from the water, and may have swum, it wasn’t well adapted to the life of an aquatic pursuit predator. Instead it was like a giant (if flightless) heron or stork — snatching at fish from the shoreline while also taking any other small available prey on land or in water.
Reviewing the evidence
The researchers compared the features of Spinosaurus with the skulls and skeletons of other dinosaurs and various living and extinct reptiles that lived on land, in the water or did both. They found that whilst there were several pieces of evidence that contradicted the aquatic pursuit predator concept, none contradicted the wading heron-like model, and various lines of evidence actively supported it.
Dr David Hone, Senior Lecturer at Queen Mary and lead author on the project said: “The biology and ecology of Spinosaurus has been troubling palaeontologists for decades. Some recent studies have suggested that it was actively chasing fish in water but while they could swim, they would not have been fast or efficient enough to do this effectively. Our findings suggest that the wading idea is much better supported, even if it is slightly less exciting.”
Co-author Tom Holtz, Principal Lecturer in Vertebrae Paleontology, University of Maryland, said: “Spinosaurus was a bizarre animal even by dinosaur standards, and unlike anything alive today, so trying to understand its ecology will always be difficult. We sought to use what evidence we have to best approximate its way of life. And what we found did not match the attributes one would expect in an aquatic pursuit predator in the manner of an otter, sea lion, or short-necked plesiosaur.”
One of the key pieces of evidence unearthed by the researchers related to the dinosaur’s ability to swim. Spinosaurus was already shown to be a less efficient swimmer than a crocodile, but also has fewer tail muscles than a crocodile, and due to its size would have a lot more drag in the water.
Dr Hone said: “Crocodiles are excellent in water compared to land animals, but are not that specialised for aquatic life and are not able to actively chase after fish. If Spinosaurus had fewer muscles on the tail, less efficiency and more drag then it’s hard to see how these dinosaurs could be chasing fish in a way that crocodiles cannot.”
Dr Holtz added: “We certainly add that the evidence points to Spinosaurus feeding partly, even mostly, in the water, probably more so than any other large dinosaur. But that is a different claim than it being a rapid swimmer chasing after aquatic prey.” Though as Dr Hone concludes: “Whilst our study provides us with a clearer picture of the ecology and behaviour of Spinosaurus, there are still many outstanding questions and details to examine for future study and we must continue to review our ideas as we accumulate further evidence and data on these unique dinosaurs. This won’t be the last word on the biology of these amazing animals.”
Life in water
Originally found in Egypt, Spinosaurus is thought to be one of the largest carnivorous dinosaurs to exist probably reaching over 15 m in length. The first known Spinosaurus fossils were destroyed by Allied bombing during World War II, which has hampered palaeontologist’s attempts to understand these unusual creatures. More recently the dinosaur found fame in the 2001 film Jurassic Park III, where it battles and defeats a Tyrannosaurus rex.
Reference:
David Hone, Thomas Holtz. Evaluating the ecology of Spinosaurus: shoreline generalist or aquatic pursuit specialist? Palaeontologia Electronica, 2021; DOI: 10.26879/1110
39 Ocean Bottom Seismometers where deployed on the ocean floor across the Mid-Atlantic Ridge as part of the PI-LAB experiment. Credit: University of Southampton
An upsurge of matter from deep beneath the Earth’s crust could be pushing the continents of North and South America further apart from Europe and Africa, new research has found.
The plates attached to the Americas are moving apart from those attached to Europe and Africa by four centimetres per year. In between these continents lies the Mid-Atlantic Ridge, a site where new plates are formed and a dividing line between plates moving to the west and those moving to the east; beneath this ridge, material rises to replace the space left by the plates as they move apart.
Conventional wisdom is that this process is normally driven by distant gravity forces as denser parts of the plates sink back into the Earth. However, the driving force behind the separation of the Atlantic plates has remained a mystery because the Atlantic ocean is not surrounded by dense, sinking plates.
Now a team of seismologists, led by the University of Southampton, have found evidence of an upwelling in the mantle—the material between the Earth’s crust and its core—from depths of more than 600 kilometres beneath the Mid Atlantic ridge, which could be pushing the plates from below, causing the continents to move further apart.
Upwellings beneath ridges are typically thought to originate from much shallower depths of around 60 km.
The findings, published in the journal Nature provide a greater understanding of plate tectonics which causes many natural disasters around the world, including earthquakes, tsunamis and volcanic eruptions.
Over two research cruises on the RV Langseth and RRV Discovery, the team deployed 39 seismometers at the bottom of the Atlantic as part of the PI-LAB (Passive Imaging of the Lithosphere-Asthenosphere Boundary) experiment and EURO-LAB (Experiment to Unearth the Rheological Oceanic Lithosphere-Asthenosphere Boundary). The data provides the first large scale and high-resolution imaging of the mantle beneath the Mid-Atlantic Ridge.
This is one of only a few experiments of this scale ever conducted in the oceans and allowed the team to image variations in the structure of the Earth’s mantle near depths of 410 km and 660 km—depths that are associated with abrupt changes in mineral phases. The observed signal was indicative of a deep, sluggish and unexpected upwelling from the deeper mantle.
Lead author, Matthew Agius, a former post-doctoral fellow at the University of Southampton and currently at Università degli studi Roma Tre said: “This was a memorable mission that took us a total of 10 weeks at sea in the middle of the Atlantic Ocean. The incredible results shed new light in our understanding of how the Earth interior is connected with plate tectonics, with observations not seen before.”
Dr. Kate Rychert and Dr. Nick Harmon from the University of Southampton and Professor Mike Kendall from the University of Oxford led the experiment and were the chief scientists on the cruises. The experiment was funded by NERC (Natural Environment Research Council, UK) and the ERC (European Research Council).
Dr. Harmon said: “There is a growing distance between North America and Europe, and it is not driven by political or philosophical differences—it is caused by mantle convection!”
As well as helping scientists to develop better models and warning systems for natural disasters, plate tectonics also has an impact on sea levels, and therefore affects climate change estimates over geologic times scales.
Dr. Rychert said: “This was completely unexpected. It has broad implications for our understanding of Earth’s evolution and habitability. It also demonstrates how crucial it is to gather new data from the oceans. There is so much more to explore!”
Professor Mike Kendall added: “This work is exciting and that it refutes long held assumptions that mid-ocean ridges might play a passive role in plate tectonics. It suggests that in places such as the Mid-Atlantic, forces at the ridge play an important role in driving newly-formed plates apart.”
Reference:
A thin mantle transition zone beneath the equatorial Mid-Atlantic Ridge, Nature (2021). DOI: 10.1038/s41586-020-03139-x
Better predictions of volcanic eruptions would help protect the lives of those living close to them. Credit: Jorge Nava – Navart/Wikimedia, licensed under CC BY-SA 2.0
There are about 1,500 potentially active volcanoes worldwide and about 50 eruptions occur each year. But it’s still difficult to predict when and how these eruptions will happen or how they’ll unfold. Now, new insight into the physical processes inside volcanoes are giving scientists a better understanding of their behaviour, which could help protect the 1 billion people who live close to volcanoes.
Dome-building volcanoes, which are frequently active, are among the most dangerous types of volcanoes since they are known for their explosive activity. This type of volcano often erupts by first quietly producing a dome-shaped extrusion of thick lava at its summit which is too viscous to flow. When it eventually becomes destabilised, it breaks off and produces fast-moving currents of hot gas, solidified lava pieces and volcanic ash, called pyroclastic clouds, that flow down the sides of the volcano at the speed of a fast train.
“The hazards associated with them can be very spontaneous and hard to predict,” said Professor Thomas Walter, a professor of volcanology and geohazards at the University of Potsdam in Germany. “That’s why it’s so important to understand this phenomenon of lava domes.”
Little is known about the behaviour of lava domes, partly because there isn’t much data available. Prof. Walter and his colleagues want to better understand how they form, whether they can vary significantly in shape and what their internal structure is like. Over the last five years, through a project called VOLCAPSE, they have been using innovative techniques to monitor lava domes by using high resolution radar data captured by satellites as well as close-up views from cameras set up near volcanoes.
“Pixel by pixel, we could determine how the shape, morphology and structure of these lava domes changed,” said Prof. Walter. “We compared (the webcam images) to satellite radar observations.”
Time-lapse
The project focussed on a few dome-building volcanoes such as Colima in Mexico, Mount Merapi in Indonesia, Bezymianny in Russia, and Mount Lascar and Lastarria in Chile. It partly involved visiting them and installing instruments such as time-lapse cameras powered by solar panels that could be controlled remotely. If a lava dome started to f
Due to high altitudes and harsh weather conditions, setting up the cameras was more challenging than expected. “It was a sharp learning curve, but also trial and error, because nobody could tell us what to expect at these volcanoes since it was never done before,” said Prof. Walter.
During their visits, the team also used drones. These would fly over a lava dome and capture high resolution images from different perspectives, which could be used to create detailed 3-D models. Temperature and gas sensors on the drones provided additional information.
Prof. Walter and his colleagues used the data to create computer simulations, such as how the growth of lava domes changes from eruption to eruption. They found that new lava domes don’t always form in the same location: a lava dome may form at the summit of a volcano during one eruption while the next time it builds up on one of its flanks. The team was puzzled, since a conduit inside a volcano brings magma to the surface during an eruption, which would mean that it changes its orientation between one eruption and the next. “That was very surprising for us,” said Prof. Walter.
Stress field
They were able to explain how this happens by examining the distribution of internal forces—or stress field—in a volcano. When magma is expelled during an eruption, it changes how the forces are distributed inside and causes a reorientation of the conduit.
The team also found that there was a systematic pattern to how the stress field changed, meaning that by studying the position of lava domes they could estimate where they had formed in the past and where they would appear in the future. This could help determine which areas near a volcano are likely to be most affected by eruptions yet to come.
“This is a very cool result for predictive research if you want to understand where the lava dome is going to extrude (or collapse) from in the future,” he said.
Knowing where a volcano will erupt from is one thing, but knowing when it will do so is a different matter and the physical factors that govern this are also not well understood. Although there is a relationship between how often eruptions occur and their size, with big eruptions occurring very rarely compared to smaller ones, a lack of reliable data makes it hard to examine the processes that control eruption frequency and magnitude.
“When you go back in the geological record, (the traces of) many eruptions disappear because of erosion,” said Professor Luca Caricchi, a professor of petrology and volcanology at the University of Geneva in Switzerland.
Furthermore, it’s not possible to access these processes directly since they occur deep down beneath a volcano, at depths of 5 to 60 kilometres. Measuring the chemistry and textures of magma expelled during an eruption can provide some clues about the internal processes that led to the event. And magma chambers can sometimes be investigated when they pop up at the surface of the Earth due to tectonic processes. Extracting information from specific time periods is still difficult though since the ‘picture’ you get is like a movie where all the frames are collapsed into a single shot. “It’s complicated to retrieve the evolution in time—what really happened during the movie,” said Prof. Caricchi.
Prof. Caricchi and his colleagues are using a novel approach to forecast the recurrence rate of eruptions. Previous predictions were typically based on statistical analyses of the geological records of a volcano. But through a project called FEVER the team is aiming to combine this method with physical modelling of the processes responsible for the frequency and size of eruptions. A similar approach has been used to estimate when earthquakes and floods will occur again.
Using physical models should especially be useful to make predictions for volcanoes where there is little data available. “To extrapolate our findings from a place where we know a lot, like in Japan, you need a physical model that tells you why the frequency-magnitude relationship changes,” said Prof. Caricchi.
To create their model, the team have incorporated variables that affect pressure in the magma reservoir or the rate of accumulation of magma at depth below the volcano. The viscosity of the crust under the volcano and the size of the magma reservoir, for example, play a role. They have performed over a million simulations using all the possible combinations of values that can occur. The relationship between frequency and magnitude they obtained from their model was similar to what was estimated by using volcanic records so they think they were able to capture the fundamental processes involved.
“It’s sort of a fight between the amount of magma and the properties of the crust,” said Prof. Caricchi. “They are the two big players that fight each other to finally lead to this relationship.”
Tectonic plates
However, the team also found that the relationship between the size and frequency of changes across volcanoes in different regions. Prof. Caricchi thinks this is due to differences in the geometry of tectonic plates in each area. “We can see that the rate at which a plate subducts below another, and also the angle of subduction, seem to play an important role in defining the frequency and magnitude of a resulting eruption,” he said. The team is now starting to incorporate this new information into their model.
Being able to predict the frequency and magnitude of future eruptions using a model could help better assess hazards. In Japan, for example, one of the countries with the most active volcanoes, knowing the probability of future eruptions of various sizes is important when deciding where to build infrastructure such as nuclear power plants.
It’s also invaluable in densely populated areas, such as in Mexico City, which is surrounded by active volcanoes, including Nevado de Toluca. Prof. Caricchi and his colleagues studied this volcano, which hasn’t erupted for about 3,000 years. They found that once magmatic activity restarts, it would take about 10 years before a large eruption could potentially occur. This knowledge would prevent Mexico City from being evacuated if initial signs of activity are spotted.
“Once the activity restarts, you know you have ten years to follow the evolution of the situation,” said Prof. Caricchi. ‘(People) will now know a little bit more about what to expect.”
Note: The above post is reprinted from materials provided by Sandrine Ceurstemont, Horizon Magazine, Horizon: The EU Research & Innovation Magazine.
Image of archaea. Credit: Steve Gschmeissner/Science Photo Library
A group of international scientists, including an Australian astrophysicist, has used findings from gravitational wave astronomy (used to find black holes in space) to study ancient marine fossils as a predictor of climate change.
The research, published in the journal Climate of the Past, is a unique collaboration between palaeontologists, astrophysicists and mathematicians seeking to improve the accuracy of a palaeo-thermometer, which can use fossil evidence of climate change to predict what is likely to happen to the Earth in coming decades.
Professor Ilya Mandel, from the ARC Centre of Excellence in Gravitational Wave Discovery (OzGrav), and colleagues, studied biomarkers left behind by tiny single-cell organisms called archaea in the distant past, including the Cretaceous period and the Eocene.
Marine archaea in our modern oceans produce compounds called Glycerol Dialkyl Glycerol Tetraethers (GDGTs). The ratios of different types of GDGTs they produce depend on the local sea temperature at the site of formation.
When preserved in ancient marine sediments, the measured abundances of GDGTs have the potential to provide a geological record of long-term planetary surface temperatures.
To date, scientists have combined GDGT concentrations into a single parameter called TEX86, which can be used to make rough estimates of the surface temperature. However, this estimate is not very accurate when the values of TEX86 from recent sediments are compared to modern sea surface temperatures.
“After several decades of study, the best available models are only able to measure temperature from GDGT concentrations with an accuracy of around 6 degrees Celsius,” Professor Mandel said. Therefore, this approach cannot be relied on for high-precision measurements of ancient climates.
Professor Mandel and his colleagues at the University of Birmingham in the UK have applied modern machine-learning tools—originally used in the context of gravitational-wave astrophysics to create predictive models of merging black holes and neutron stars—to improve temperature estimation based on GDGT measurements. This enabled them to take all observations into account for the first time rather than relying on one particular combination, TEX86. This produced a far more accurate palaeo-thermometer. Using these tools, the team extracted temperature from GDGT concentrations with an accuracy of just 3.6 degrees—a significant improvement, nearly twice the accuracy of previous models.
According to Professor Mandel, determining how much the Earth will warm in coming decades relies on modelling, “so it is critically important to calibrate those models by utilizing literally hundreds of millions of years of climate history to predict what might happen to the Earth in the future,” he said.
Reference:
Tom Dunkley Jones et al. OPTiMAL: a new machine learning approach for GDGT-based palaeothermometry, Climate of the Past (2020). DOI: 10.5194/cp-16-2599-2020
A diamond lasts forever, but that doesn’t mean all diamonds have a common history.
Some diamonds were formed billions of years ago in space as the carbon-rich atmospheres of dying stars expanded and cooled. In our own planet’s lifetime, high-temperatures and pressures in the mantle produced the diamonds that are familiar to us as gems. 5,000 years ago, a large meteorite that struck a carbon-rich sediment on Earth produced an impact diamond.
Each of these diamonds differs from the others in both composition and genesis, but all are categorized as “diamond” by the authoritative guide to minerals—the International Mineralogical Association’s Commission on New Minerals, Nomenclature and Classification.
For many physical scientists, this inconsistency poses no problem. But the IMA system leaves unanswered questions for planetary scientists, geobiologists, paleontologists and others who strive to understand minerals’ historical context.
So, Carnegie’s Robert Hazen and Shaunna Morrison teamed up with CU Boulder philosophy of science professor Carol Cleland to propose that scientists address this shortcoming with a new “evolutionary system” of mineral classification—one that includes historical data and reflects changes in the diversity and distribution of minerals through more than 4 billion years of Earth’s history.
Their work is published by the Proceedings of the National Academy of Sciences.
“We came together from the very different fields of philosophy and planetary science to see if there was a rigorous way to bring the dimension of time into discussions about the solid materials that compose Earth,” Hazen said.
The IMA classification system for minerals dates to the 19th century when geologist James Dwight Dana outlined a way to categorize minerals on the basis of unique combinations of idealized compositions of major elements and geometrically idealized crystal structure.
“For example, the IMA defines quartz as pure silicon dioxide, but the existence of this idealized version is completely fictional,” said Morrison. “Every specimen of quartz contains imperfections—traces of its formation process that makes it unique.”
This approach to the categorization system means minerals with distinctly different historical origins are lumped together—as with the example of diamonds—while other minerals that share a common causal history are split apart.
“The IMA system is typical,” said lead author Cleland, explaining that most classification systems in the natural sciences, such as the periodic table of the elements, are time independent, categorizing material things “solely on the basis of manifest similarities and differences, regardless of how they were produced or what modifications they have undergone.”
For many researchers, a time-independent system is completely appropriate. But this approach doesn’t work well for planetary and other historically oriented geosciences, where the emphasis is on understanding the formation and development of planetary bodies.
Differences in a diamond or quartz crystal’s formative history are critical, Cleland said, because the conditions under which a sample was formed and the modifications it has undergone “are far more informative than the mere fact that a crystal qualifies as diamond or quartz.”
She, Hazen, and Morrison argue that what planetary scientists need is a new system of categorizing minerals that includes historical “natural kinds.”
Biology faced an analogous issue before Darwin put forward his theory of evolution. For example, lacking an understanding of how organisms are historically related through evolutionary processes, 17th century scholars debated whether bats are birds. With the advent of Darwin’s work in the 19th century, however, biologists classified them separately on evolutionary grounds, because they lack a common ancestor with wings.
Because a universal theory of “mineral evolution” does not exist, creating such a classification system for the geosciences is challenging. Hazen, Morrison, and Cleland’s proposed solution is what they call a “bootstrap” approach based on historically revelatory, information-rich chemical, physical, and biological attributes of solid materials. This strategy allows scientists to build a historical system of mineral kinds while remaining agnostic about its underlying theoretical principles.
“Minerals are the most durable, information-rich objects we can study to understand our planet’s origin and evolution,” Hazen said. “Our new evolutionary approach to classifying minerals complements the existing protocols and offers the opportunity to rigorously document Earth’s history.”
Morrison concurred, adding: “Rethinking the way we classify minerals offers the opportunity to address big, outstanding scientific mysteries about our planet and our Solar System, through a mineralogical lens. In their imperfections and deviations from the ideal, minerals capture the story of what has happened to them through deep time—they provide a time machine to go back and understand what was happening on our planet and other planets in our solar system millions or billions of years ago.”
Reference:
Carol E. Cleland el al., “Historical natural kinds and mineralogy: Systematizing contingency in the context of necessity,” PNAS (2020). www.pnas.org/cgi/doi/10.1073/pnas.2015370118
Map of the Cascadia subduction zone. Credit: Public Domain
Megathrust earthquakes and subsequent tsunamis that originate in subduction zones like Cascadia — Vancouver Island, Canada, to northern California — are some of the most severe natural disasters in the world. Now a team of geoscientists thinks the key to understanding some of these destructive events may lie in the deep, gradual slow-slip behaviors beneath the subduction zones. This information might help in planning for future earthquakes in the area.
“What we found was pretty unexpected,” said Kirsty A. McKenzie, doctoral candidate in geoscience, Penn State.
Unlike the bigger, shallower megathrust earthquakes that move and put out energy in the same direction as the plates move, the slow-slip earthquakes’ energy may move in other directions, primarily down.
Subduction zones occur when two of the Earth’s plates meet and one moves beneath the other. This typically creates a fault line and some distance away, a line of volcanoes. Cascadia is typical in that the tectonic plates meet near the Pacific coast and the Cascade Mountains, a volcanic range containing Mount St. Helens, Mount Hood and Mount Rainier, forms to the east.
According to the researchers, a megathrust earthquake of magnitude 9 occurred in Cascadia in 1700 and there has not been a large earthquake there since then. Rather, slow-slip earthquakes, events that happen deeper and move very short distances at a very slow rate, happen continuously.
“Usually, when an earthquake occurs we find that the motion is in the direction opposite to how the plates have moved, accumulating that slip deficit,” said Kevin P. Furlong, professor of geosciences, Penn State. “For these slow-slip earthquakes, the direction of movement is directly downward in the direction of gravity instead of in the plate motion directions.”
The researchers have found that areas in New Zealand, identified by other geologists, slow slip the same way Cascadia does.
“But there are subduction zones that don’t have these slow-slip events, so we don’t have direct measurements of how the deeper part of the subducting plate is moving,” said Furlong. “In Sumatra, the shallower seismic zone, as expected, moves in the plate-motion direction, but even though there are no slow-slip events, the deeper plate movement still appears to be primarily controlled by gravity.”
Slow-slip earthquakes occur at a deeper depth than the earthquakes that cause major damage and earth-shaking events, and the researchers have analyzed how this deep slip may affect the timing and behavior of the larger, damaging megathrust earthquakes.
“Slow-slip earthquakes rupture over several weeks, so they are not just one event,” said McKenzie. “It’s like a swarm of events.”
According to the researchers, in southern Cascadia, the overall plate motion is about an inch of movement per year and in the north by Vancouver Island, it is about 1.5 inches.
“We don’t know how much of that 30 millimeters (1 inch) per year is accumulating to be released in the next big earthquake or if some movement is taken up by some non-observable process,” said McKenzie. “These slow-slip events put out signals we can see. We can observe the slow-slip events going east to west and not in the plate motion direction.”
Slow-slip events in Cascadia occur every one to two years, but geologists wonder if one of them will be the one that will trigger the next megathrust earthquake.
The researchers measure surface movement using permanent, high-resolution GPS stations on the surface. The result is a stair step pattern of loading and slipping during slow-slip events. The events are visible on the surface even though geologists know they are about 22 miles beneath the surface. They report their results in Geochemistry, Geophysics, Geosystems.
“The reason we don’t know all that much about slow-slip earthquakes is they were only discovered about 20 years ago,” said Furlong. “It took five years to figure out what they were and then we needed precise enough GPS to actually measure the motion on the Earth’s surface. Then we had to use modeling to convert the slip on the surface to the slip beneath the surface on the plate boundary itself, which is bigger.”
The researchers believe that understanding the effects of slow-slip earthquakes in the region at these deeper depths will allow them to understand what might trigger the next megathrust earthquake in the area. Engineers want to know how strong shaking in an earthquake will be, but they also want to know the direction the forces will be in. If the difference in direction of slow-slip events indicates a potential change in behavior in a large event, that information would be helpful in planning.
“More fundamentally, we don’t know what triggers the big earthquake in this situation,” said McKenzie. “Every time we add new data about the physics of the problem, it becomes an important component. In the past, everyone thought that the events were unidirectional, but they can be different by 40 or 50 degrees.”
While the slow-events in Cascadia are shedding light on potential megathrust earthquakes in the area and the tsunamis they can trigger, Furlong thinks that other subduction zones may also have similar patterns.
“I would argue that it (differences in direction of motion) is happening in Alaska, Chile, Sumatra,” said Furlong. “It is only in a few that we see the evidence of it, but it may be a universal process that has been missed. Cascadia exhibits it because of the slow-slip events, but it may be fundamental to subduction zones.”
Also working on this project was Matthew W. Herman, assistant professor of geology, California State University, Bakersfield.
The National Science Foundation supported this work.
Reference:
K. A. McKenzie, K. P. Furlong, M. W. Herman. Bidirectional Loading of the Subduction Interface: Evidence From the Kinematics of Slow Slip Events. Geochemistry, Geophysics, Geosystems, 2020; 21 (9) DOI: 10.1029/2020GC008918
Note: The above post is reprinted from materials provided by Penn State. Original written by A’ndrea Elyse Messer.
A plume rises near active fissures in the crater of Hawaii’s Kilauea volcano on Monday, Dec. 21, 2020. People are lining up to try to get a look at the volcano on the Big Island, which erupted last night and spewed ash and steam into the atmosphere. A spokeswoman for Hawaii Volcanoes National Park says the volcanic activity is a risk to people in the park Monday and that caution is needed. (M. Patrick/U.S. Geological Survey via AP)
Lava was rising more than 3 feet (1 meter) per hour in the deep crater of a Hawaii volcano that began erupting over the weekend after a two-year break, scientists said Tuesday.
Kilauea volcano within Hawaii Volcanoes National Park on the Big Island was gushing molten rock from at least two vents inside its summit crater, the U.S. Geological Survey said. A lava lake has formed, rising about 440 feet (134 meters) from the bottom of the crater.
Since the eruption began Sunday night, Kilauea has spewed some 2 billion gallons of lava (10 million cubic meters), enough to cover 33 acres (13 hectares). The lava has been contained inside the deep crater.
It isn’t threatening to get close to people or cover property, like when Kilauea erupted from vents in the middle of a residential neighborhood in 2018 and destroyed more than 700 homes.
Still, the Hawaiian Volcano Observatory has warned residents to beware of potentially high levels of volcanic gas, rockfalls and explosions.
When erupting, Kilauea tends to spew large volumes of sulfur dioxide, which forms volcanic smog, or vog, when it mixes with oxygen, sunlight and other gases in the air. The state Department of Health warned residents to reduce their outdoor activities if they encounter volcanic smog conditions.
Kilauea is one of the world’s most active volcanoes, having erupted some 50 times in the last century. Between 1983 and 2018, it erupted almost continuously. It had a lava lake in its crater for the last decade of that eruption.