Methane seeps—ever heard of them?
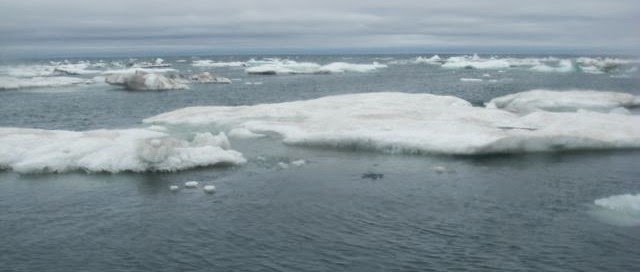
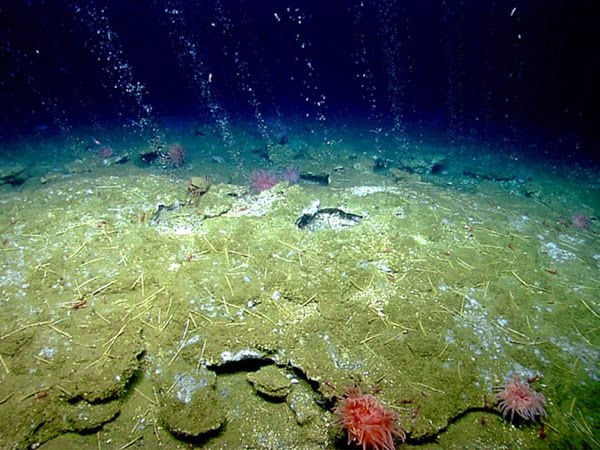
You might have this past summer. That’s when the national news media featured stories about a recent discovery of hundreds of methane seeps—where methane gas bubbles up from the sea floor—in the North Atlantic Ocean. The discussion about this scientific find typically turned to important questions about the methane’s impact on climate change, but there is another interesting question about methane seeps.
What are the creatures and ecosystems that exist there?
Researchers at Indiana State University have been studying methane seep ecosystems for a number of years, making trips underwater to investigate the unique association of organisms that live there. On their most recent trip to study seeps, Indiana State scientists made a big discovery regarding a tiny creature that lives in both seep and non-seep habitats.
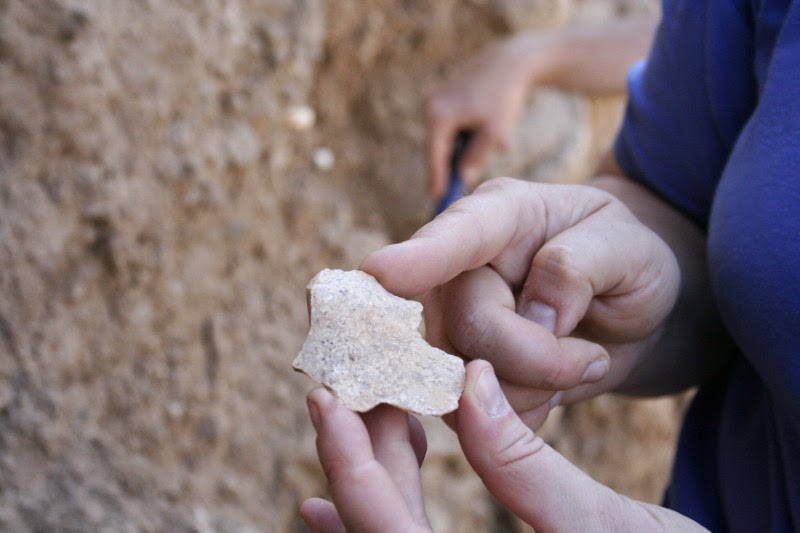
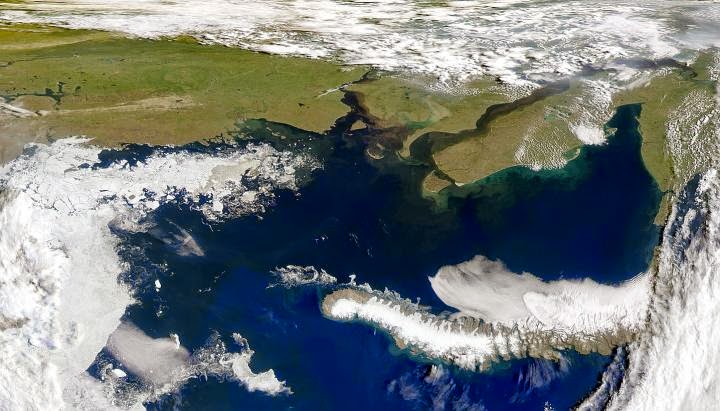
In collaboration with Scripps Institute of Oceanography and California Institute of Technology, an Indiana State professor, graduate and undergraduate students embarked on a series of cruises to the methane seeps near Oregon and Costa Rica in 2010. With little previously known about the biological communities living in and around the rocks common in these deep-sea environments, researchers pursued a variety of investigations to learn more about the organisms and ecosystems at different seep habitats and nearby non-seep environments.
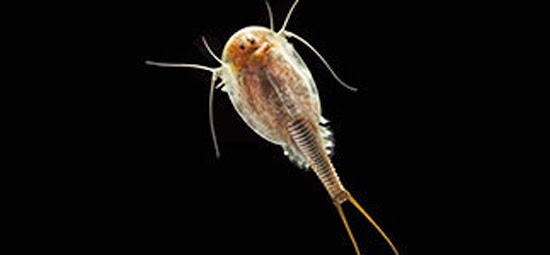
One investigation, led by Indiana State professor Tony Rathburn and doctoral student Ashley Burkett, stumbled upon an overabundance of a microscopic organism—a species of “benthic foraminifera”—that could change how scientists understand past environments.
“We found over 1,000 individuals of this specific species,” Burkett said. “The species is really interesting for us, and it’s used to figure out what the climate was like in the geologic past.”
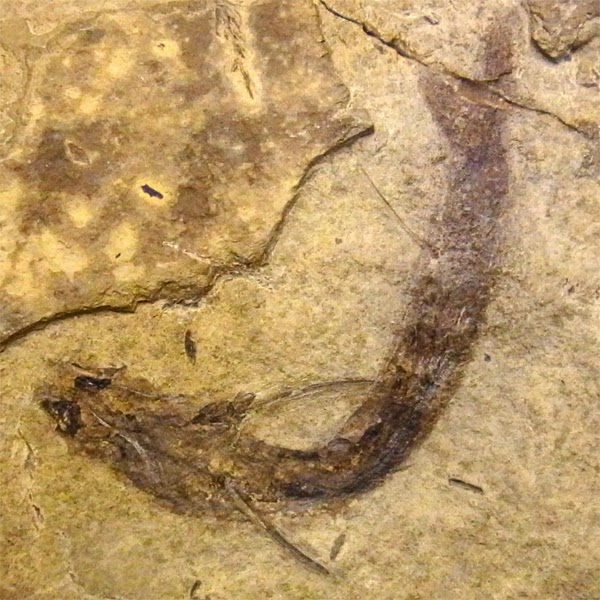
Living on the sea floor, benthic foraminifera are microscopic creatures that produce an equally microscopic shell. The particular species of foraminifera that Rathburn and Burkett found was previously thought only to live in environments with high levels of dissolved oxygen. When scientists have found the shells of this creature in the fossil record, they have thought that the presence of the species indicated a well-oxygenated environment at a specific time in geologic history. With that idea in mind, scientists have developed a concept of what the ocean and climate was like in the past.
So, finding this species in abundance in both seep and non-seep environments where oxygen is limited was unexpected. Based on their research, Rathburn and Burkett speculate that it’s not the abundance of oxygen that determines where these creatures are located. It may simply be that they’re present where there are hard surfaces on the sea floor for them to live on.
“Scientists have used the presence of the species as an indicator of well-oxygenated environments,” Burkett said. “But this may not be the case. It may have been that there was an absence of nice rocks to colonize in the soupy sediments of poorly oxygenated environments.”
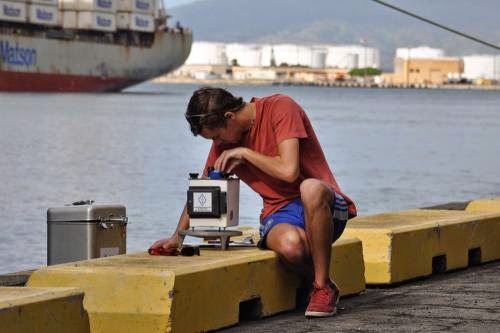
This important find was also just as unintended as it was unexpected. Rathburn and Burkett came upon these foraminifera while conducting a multifaceted seafloor experiment. Their original intent was to determine how long the tissue of foraminifera would remain on the sea floor after death. But to their delight, they got more than they asked for thanks to, of all things, plastic.
For their original experiment, they had placed test subjects inside a steel cage wrapped in plastic mesh, and this contraption was pushed half way into the sea floor sediment. Rathburn and Burkett chose the plastic mesh, because it was durable, easy to use and wouldn’t deteriorate quickly. But it turns out that the mesh was a foraminifera magnet – after a year on the sea floor, the creatures had colonized on the plastic.
“We pulled the cages up (from the sea floor), and I started to disassemble them. We were looking at the tops of the cages and commented that there was all this goo on them …. One of us said, ‘We should look at this.'”
And look she did. Using a microscope, Burkett examined the “goo” and discovered this unexpected creature. Many hours were spent painstakingly picking off all the foraminifera—about a thousand of them—from the cages, and examining the data.
Burkett presented her surprise findings this past October to the scientific community at a meeting of the Geologic Society of America in Vancouver, Canada. The response was positive.
“At this meeting, we shocked people with our results,” Rathburn said. “(Our research) will shake up our ideas about how to use these creatures in the interpretation of the environments of the past.”
Note : The above story is based on materials provided by Indiana State University.