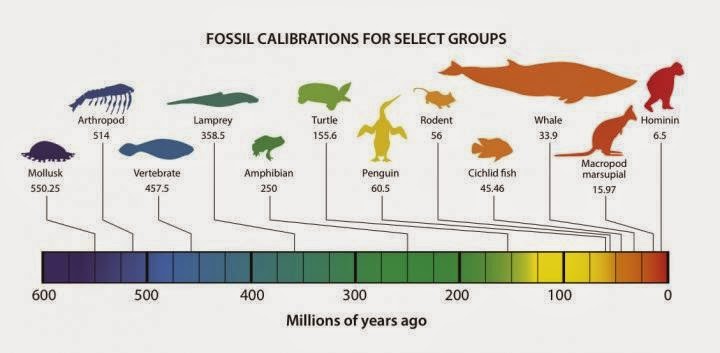
Fossil calibrations for select groups: Here is a look at the way the new fossil calibration database will help to tell evolutionary time. Credit: The Bruce Museum, Greenwich, CT
Have you ever wondered exactly when a certain group of plants or animals first evolved? This week a groundbreaking new resource for scientists will go live, and it is designed to help answer just those kinds of questions. TheFossil Calibration Database, a free, open-access resource that stores carefully vetted fossil data, is the result of years of work from a worldwide team led by Dr. Daniel Ksepka, Curator of Science at the Bruce Museum in Greenwich, and Dr. James Parham, Curator at the John D. Cooper Archaeological and Paleontological Center in Orange County, California, funded through the National Evolutionary Synthesis Center (NESCent).
“Fossils provide the critical age data we need to unlock the timing of major evolutionary events,” says Dr. Ksepka. “This new resource will provide the crucial fossil data needed to calibrate ‘molecular clocks’ which can reveal the ages of plant and animal groups that lack good fossil records. When did groups like songbirds, flowering plants, or sea turtles evolve? What natural events were occurring that may have had an impact? Precisely tuning the molecular clock with fossils is the best way we have to tell evolutionary time.”
More than twenty paleontologists, molecular biologists, and computer programmers from five different countries contributed to the design and implementation of this new database. The Fossil Calibrations Database webpage launches on Tuesday February 24th, and a series of five peer-reviewed papers and an editorial on the topic will appear in the scientific journal Palaeontologia Electronica, describing the endeavor. Dr. Ksepka is the author of one of the papers and co-author of the editorial.
“This exciting field of study, known as ‘divergence dating,’ is important for understanding the origin and evolution of biodiversity, but has been hindered by the improper use of data from the fossil record,” says Dr. Parham. “The Fossil Calibration Database addresses this issue by providing molecular biologists with paleontologist-approved data for organisms across the Tree of Life.”
The Tree of Life? “Think of it as a family tree of all species,” explains Dr. Ksepka.
Note: The above story is based on materials provided by Bruce Museum.
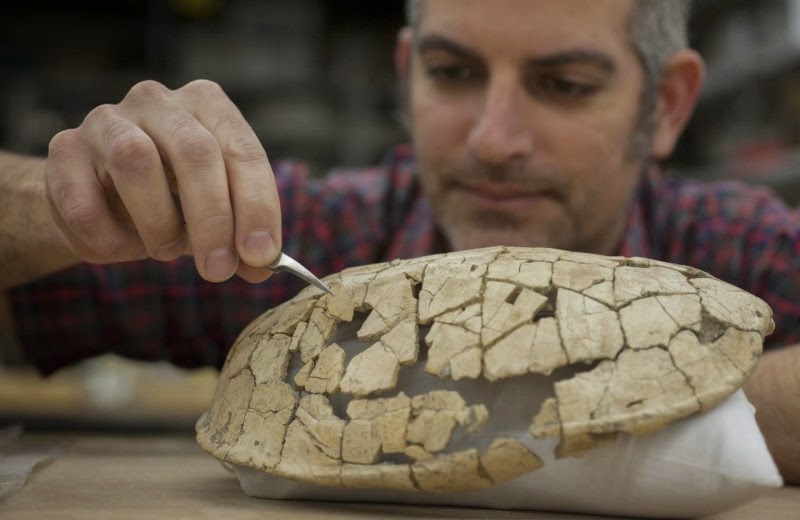
University of Florida paleontologist Jason Bourque reconstructs the 56-million-year-old shell of a newly described genus and species of ancient tropical turtle in his lab on Feb. 9, 2015. The fossil turtle gives clues to how today’s species might react to warming habitats. Credit: Photo by Jeff Gage/Florida Museum of Natural History
Tropical turtle fossils discovered in Wyoming by University of Florida scientists reveal that when Earth got warmer, prehistoric turtles headed north. But if today’s turtles try the same technique to cope with warming habitats, they might run into trouble.
While the fossil turtle and its kin could move northward with higher temperatures, human pressures and habitat loss could prevent a modern-day migration, leading to the extinction of some modern species.
The newly discovered genus and species, Gomphochelys (pronounced gom-fo-keel-eez) nanus — provides a clue to how animals might respond to future climate change, said Jason Bourque, a paleontologist at the Florida Museum of Natural History at UF and the lead author of the study, which appears online this week in the Journal of Vertebrate Paleontology.
The wayfaring turtle was among the species that researchers believe migrated 500-600 miles north 56 million years ago, during a temperature peak known as the Paleocene-Eocene Thermal Maximum. Lasting about 200,000 years, the temperature peak resulted in significant movement and diversification of plants and animals.
“We knew that some plants and lizards migrated north when the climate warmed, but this is the first evidence that turtles did the same,” Bourque said. “If global warming continues on its current track, some turtles could once again migrate northward, while others would need to adapt to warmer temperatures or go extinct.”
The new turtle is an ancestor of the endangered Central American river turtle and other warm-adapted turtles in Belize, Guatemala and southern Mexico. These modern turtles, however, could face significant roadblocks on a journey north, since much of the natural habitat of these species is in jeopardy, said co-author Jonathan Bloch, a Florida Museum curator of vertebrate paleontology.
“If you look at the waterways that turtles would have to use to get from one place to another, it might not be as easy as it once was,” Bloch said. “Even if the natural response of turtles is to disperse northward, they have fewer places to go and fewer routes available.”
To put the new turtle in evolutionary context, the researchers examined hundreds of specimens from museum collections around the country, including turtles collected during the 1800s housed at the Smithsonian Institution. Co-author Patricia Holroyd, a vertebrate paleontologist at the University of California, Berkeley, said the fossil history of the modern relatives of the new species shows they could be much more wide-ranging, if it were not for their restricted habitats.
The Central American river turtle is one of the most endangered turtles in the world, threatened by habitat loss and its exploitation as a human food source, Holroyd said. “This is an example of a turtle that could expand its range and probably would with additional warming, but — and that’s a big but — that’s only going to happen if there are still habitats for it,” she said.
References:
Jason R. Bourque, Blaine W. Schubert. Fossil musk turtles (Kinosternidae,Sternotherus) from the late Miocene–early Pliocene (Hemphillian) of Tennessee and Florida. Journal of Vertebrate Paleontology, 2015; 35 (1): e885441 DOI: 10.1080/02724634.2014.885441
Jason R. Bourque, J. Howard Hutchison, Patricia A. Holroyd, Jonathan I. Bloch. A new dermatemydid (Testudines, Kinosternoidea) from the Paleocene-Eocene Thermal Maximum, Willwood Formation, southeastern Bighorn Basin, Wyoming. Journal of Vertebrate Paleontology, 2015; e905481 DOI: 10.1080/02724634.2014.905481
Note: The above story is based on materials provided by University of Florida. The original article was written by Stephenie Livingston.
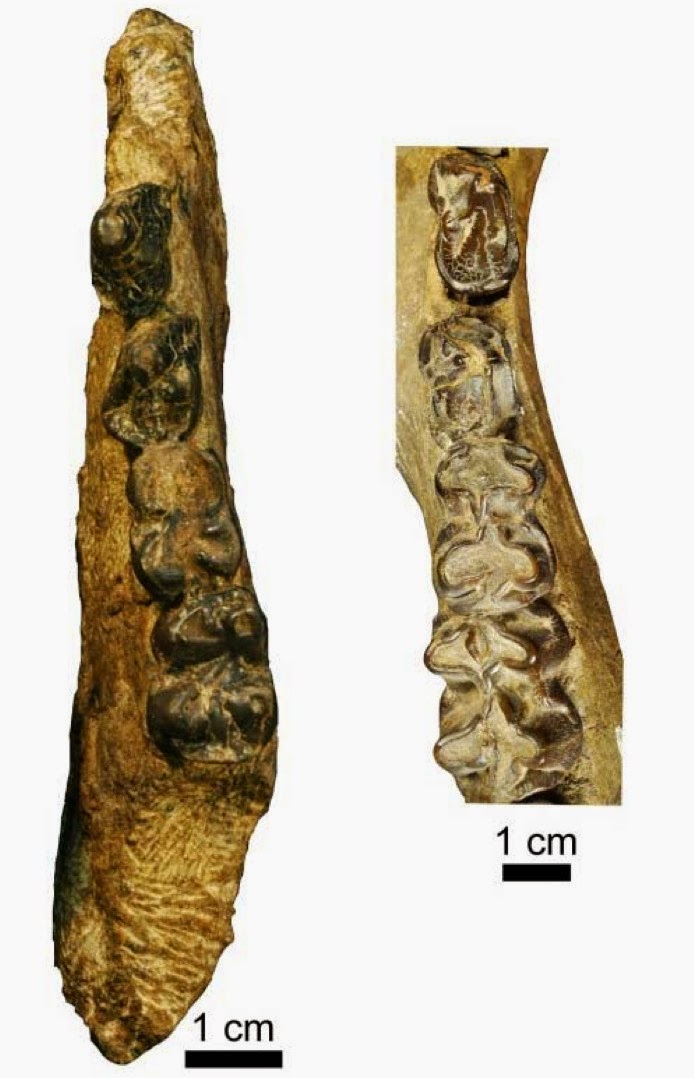
A French-Kenyan research team has just described a new fossil ancestor of today’s hippo family. This discovery bridges a gap in the fossil record separating these animals from their closest modern-day cousins, the cetaceans. It also shows that some 35 million years ago, the ancestors of hippos were among the first large mammals to colonize the African continent, long before those of any of the large carnivores, giraffes or bovines. This work, co-signed by researchers of the Institut des sciences de l’évolution de Montpellier (CNRS/Université de Montpellier/IRD/EPHE) and Institut de paléoprimatologie et paléontologie humaine : évolution et paléo-environnements (CNRS/Université de Poitiers) is published in the journal Nature Communications.
The ancestry of hippopotamuses is somewhat of an enigma. For a long time, paleontologists thought these semi-aquatic animals, with their unusual morphology (canines and incisors with continual growth, primitive skull and trifoliate tooth-wear pattern), to be related to the Suidae family, which includes pigs and peccaries. But in the 1990s and 2000s, DNA comparisons showed that the hippo’s closest living relatives were the cetaceans (whales, dolphins, etc.), which disagreed with most paleontological interpretations. Moreover, the lack of fossils significantly hindered attempts to uncover the truth about hippo evolution.
New paleontological work by a group of French and Kenyan researchers has now revealed that hippos are not related to suoids but instead descend from another, now extinct, group. The new fossils studied have made it possible to build the first evolutionary scenario that is compatible with both genetic and paleontological data. By analyzing a half-jaw and several teeth discovered at Lokone (in the Lake Turkana basin, Kenya), the French-Kenyan team described a new fossil species (belonging to a new genus (2)), dating back to about 28 million years. They named it Epirigenys lokonensis, from the word “Epiri” which means hippo in the Turkana language and the site of discovery, Lokone.
By comparing the characteristics of fossil teeth with those of ruminants, suoids, hippos and fossil anthracotheres (an extinct family of ungulates), the scientists reconstructed the relationships between these groups. The results show that Epirigenys forms a kind of evolutionary transition between the oldest known hippo in the fossil record (about 20 million years ago) and an anthracothere lineage. This position in the tree of life is compatible with the genetic data, confirming that the cetaceans are the hippos’ closest living cousins.
This kind of discovery may one day enable scientists to draw a picture of the common ancestor of cetaceans and hippos. Indeed, analysis of Epirigenys (28 million years old) has linked today’s hippos to a lineage of anthracotheres, the oldest of which date back about 40 million years. However, until now, the earliest known ancestor of the hippos was about 20 million years old, while the first fossils of cetaceans are 53 million years old. The time gap between today’s hippos and the oldest cetaceans is thereby filled by nearly 75% according to the present scenario.
Furthermore, this discovery shows the whole history of the African fauna in a new light. Africa was an isolated continent from about 110 to 18 million years ago. Most of the iconic African fauna (lions, leopards, rhinos, buffaloes, giraffes, zebras, etc.) are relatively recent arrivals on the continent (they have been there less than 20 million years). Until now, the same was believed to be true of hippos, but the discovery of Epirigenys demonstrates that their anthracothere ancestors migrated from Asia to Africa some 35 million years ago.
Reference:
Fabrice Lihoreau, Jean-Renaud Boisserie, Fredrick Kyalo Manthi, Stéphane Ducrocq. Hippos stem from the longest sequence of terrestrial cetartiodactyl evolution in Africa. Nature Communications, 2015; 6: 6264 DOI: 10.1038/ncomms7264
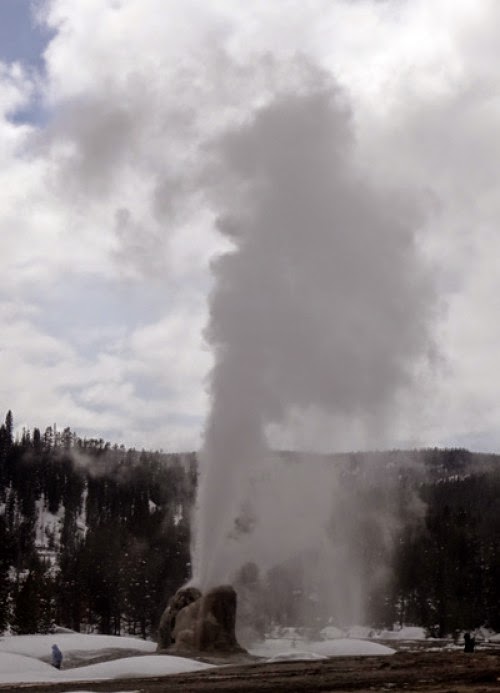
Manga and his colleagues studied eruptions at the Lone Star geyser in the wilds of Yellowstone National Park. Credit: Michael Manga
Geysers like Old Faithful in Yellowstone National Park erupt periodically because of loops or side-chambers in their underground plumbing, according to recent studies by volcanologists at the University of California, Berkeley.
The key to geysers, said Michael Manga, a UC Berkeley professor of earth and planetary science, is an underground bend or loop that traps steam and then bubbles it out slowly to heat the water column above until it is just short of boiling. Eventually, the steam bubbles trigger sudden boiling from the top of the column, releasing pressure on the water below and allowing it to boil as well. The column essentially boils from the top downward, spewing water and steam hundreds of feet into the air.
“Most geysers appear to have a bubble trap accumulating the steam injected from below, and the release of the steam from the trap gets the geyser ready to erupt,” Manga said. “You can see the water column warming up and warming up until enough water reaches the boiling point that, once the top layer begins to boil, the boiling becomes self-perpetuating.”
The new understanding of geyser mechanics comes from Manga’s studies over the past few years of geysers in Chile and Yellowstone, as well as from an experimental geyser he and his students built in their lab. Made of glass with a bend or loop, it erupts periodically, though, surprisingly, not as regularly as a real geyser they studied in the Atacama desert of Chile, dubbed El Jefe. Over six days of observation, El Jefe erupted every 132 seconds, plus or minus two seconds.
“At many geysers it looks like there is some cavity that is stuck off on the side where steam is accumulating,” Manga explained. “So we said, ‘Let’s put in a cavity and watch how the bubble trap generates eruptions.’ It allows us to get both small eruptions and big eruptions in the lab.”
Manga and his colleagues, including first author Carolina Munoz-Saez, a UC Berkeley graduate student from Chile, report their findings on the Chilean geysers in the February 2015 issue of the Journal of Volcanology and Geothermal Research. A description of the laboratory geyser appeared in the September 2014 issue of the same journal.
Balance of pressure and temperature
Fewer than 1,000 geysers exist around the world — half of them in Yellowstone — and all are located in active or formerly active volcanic areas. Water from the surface trickles downward and gets heated by hot magma, eventually, perhaps decades later, rising back to the surface in the form of hot springs, mud pots and geysers.
Why geysers erupt periodically, some with a regularity you can set a clock by, has piqued the interest of many scientists, but German chemist Robert Bunsen was the first to make pressure and temperature measurements inside a geyser — the Great Geysir in Iceland, after which geysers are named — in 1846. Based on these measurements, he proposed that eruptions start when water starts to boil at the surface, reducing pressure within the superheated water column and allowing boiling to propagate downward from the surface. Pressurized water boils at a higher temperature, so reducing the pressure on overheated water allows it to boil.
Since then, Manga said, a few researchers have stuck video cameras into geysers and seen features that suggest there are underwater chambers or loops that trap steam bubbles. Manga’s measurements in Yellowstone and Chile link the temperature and pressure changes down the water column with the underground plumbing to explain the periodic eruptions.
Geysers key to understanding volcanoes
Manga studies geysers to gain insight into volcanic eruptions, which bear many similarities to geysers but are much harder to study. Manga and his students feed temperature and pressure sensors as deep as 30 feet into geysers — something impossible to do with a volcano — and correlate these with above-ground measurements from seismic sensors and tiltmeters to deduce the sequence of underground events leading to an eruption. They have also been able to submerge video cameras as deep as six feet into geysers to view the submerged conduits and chambers below. He hopes to be able to extrapolate his findings to volcanoes, deducing the internal mechanics from exterior seismic and gravity measurements.
But geysers are fascinating in themselves, he said.
“One of our goals is to figure out why geysers exist — why don’t you just get a hot spring — and what is it that controls how a geyser erupts, including weather and earthquakes,” he said.
In this month’s publication, Manga and his students report on El Jefe (“the chief”), a geyser located at an elevation of about 14,000 feet in the El Tatio geyser field in Chile, where water boils at 86 degrees Celsius (187 degrees Fahrenheit) instead of 100 (212 degrees F). In 2012, they recorded internal and external data during 3,600 eruptions over six days. They compared these to above-ground measurements at Lone Star and other geysers in Yellowstone. Invasive measurements are forbidden in the park.
They concluded that Bunsen was essentially correct — boiling starts at the top of the superheated water column and propagates downward — but also that it’s the escaped bubbles from trapped steam in the rock conduits below the geyser that heat the water column to the boiling point. As the entire water column boils out of the ground, more than half the volume of stuff emerging is steam, though most of the mass is liquid water, they found. The plume seen from afar is mostly steam condensing into water droplets in the air, Manga said.
Preplay
In places like Yellowstone, the bubbles that slowly escape from the underground loop cause mini-eruptions called preplay leading up to the major eruption. Eruptions stop when the water column in the geyser cools below the boiling point, and the process repeats. All these underground processes seem to be affected only by the heat source deep below the geyser, because they could find no evidence that the surface temperature affected eruptions.
Manga plans to continue his Yellowstone and Chilean studies — his next trip to Yellowstone is in the fall — to gather more data to help explain the periods of geysers and better understand below-ground processes.
Co-authors with Manga and Munoz-Saez on the February paper are Shaul Hurwitz of the U.S. Geological Survey in Menlo Park, California; Maxwell Rudolph of Portland State University in Oregon; Atsuko Namiki of Hiroshima University in Japan; and professor emeritus Chi-Yuen Wang of UC Berkeley.
The September 2014 paper was co-authored by UC Berkeley undergraduates Esther Adelstein, Aaron Tran, Carolina Muñoz-Saez and researcher Alexander Shteinberg.
The work is supported by the National Science Foundation and the CONICYT program to support Berkeley-Chile collaborations, which is administered by UC Berkeley’s Center for Latin American Studies.
Video:
Volcanologist Michael Manga and student Esther Adelstein use a laboratory geyser they built to explain how geysers like Old Faithful work. (Video by Roxanne Makasdjian and Phil Ebiner, with geyser footage by Eric King and Kristen Fauria)
Reference:
Carolina Munoz-Saez, Michael Manga, Shaul Hurwitz, Maxwell L. Rudolph, Atsuko Namiki, Chi-Yuen Wang. Dynamics within geyser conduits, and sensitivity to environmental perturbations: Insights from a periodic geyser in the El Tatio geyser field, Atacama Desert, Chile. Journal of Volcanology and Geothermal Research, 2015; 292: 41 DOI: 10.1016/j.jvolgeores.2015.01.002
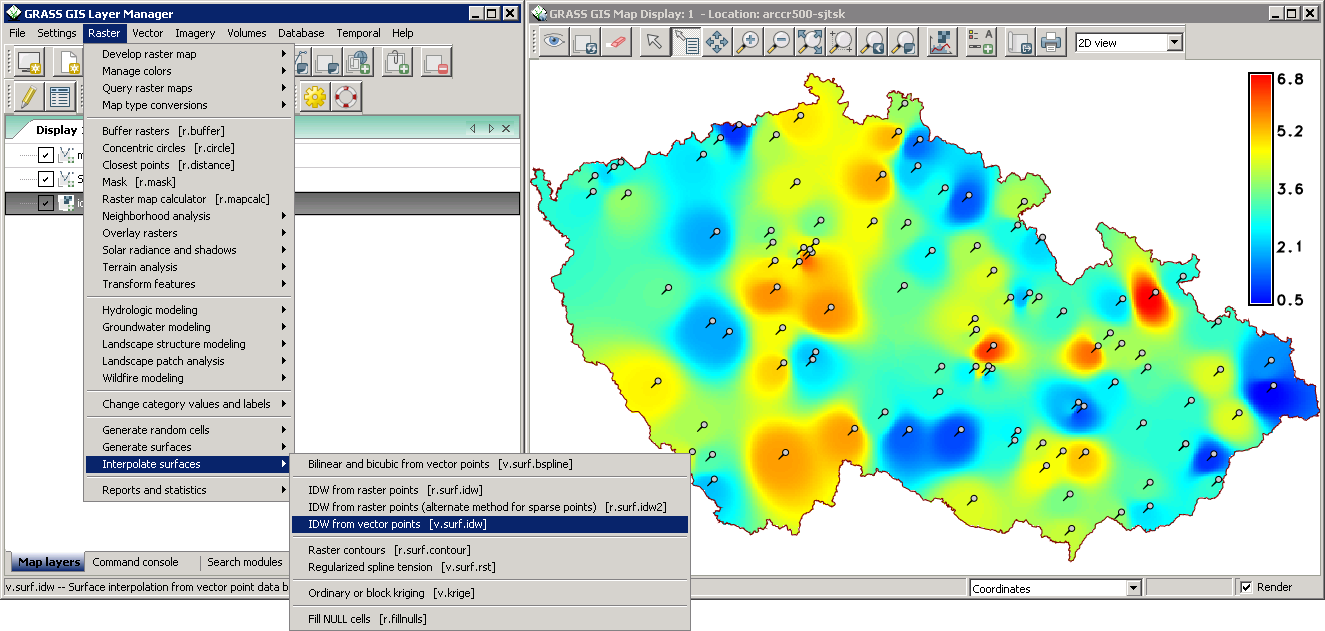
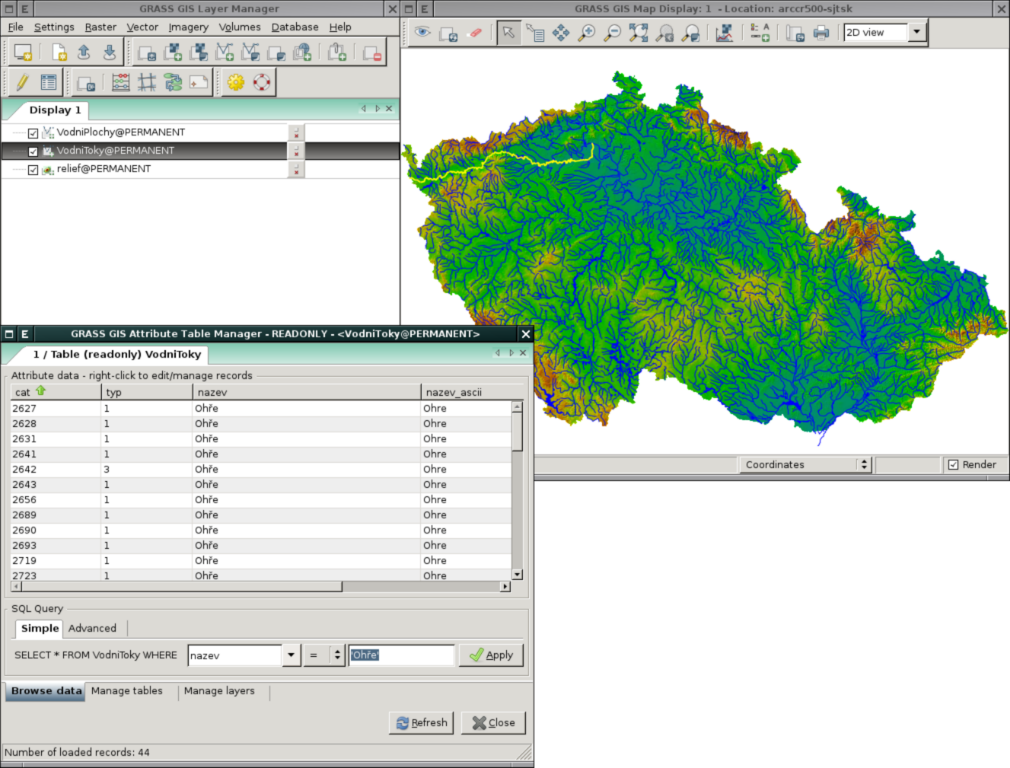
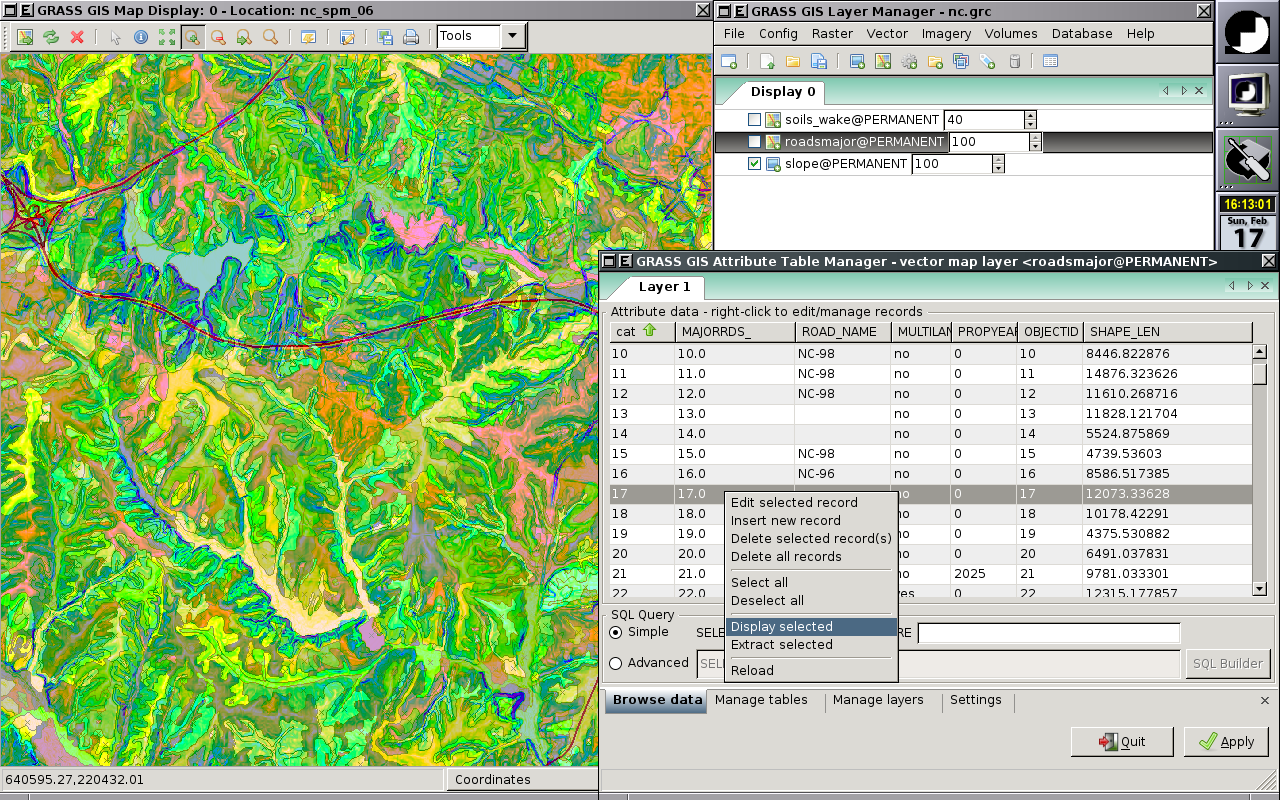
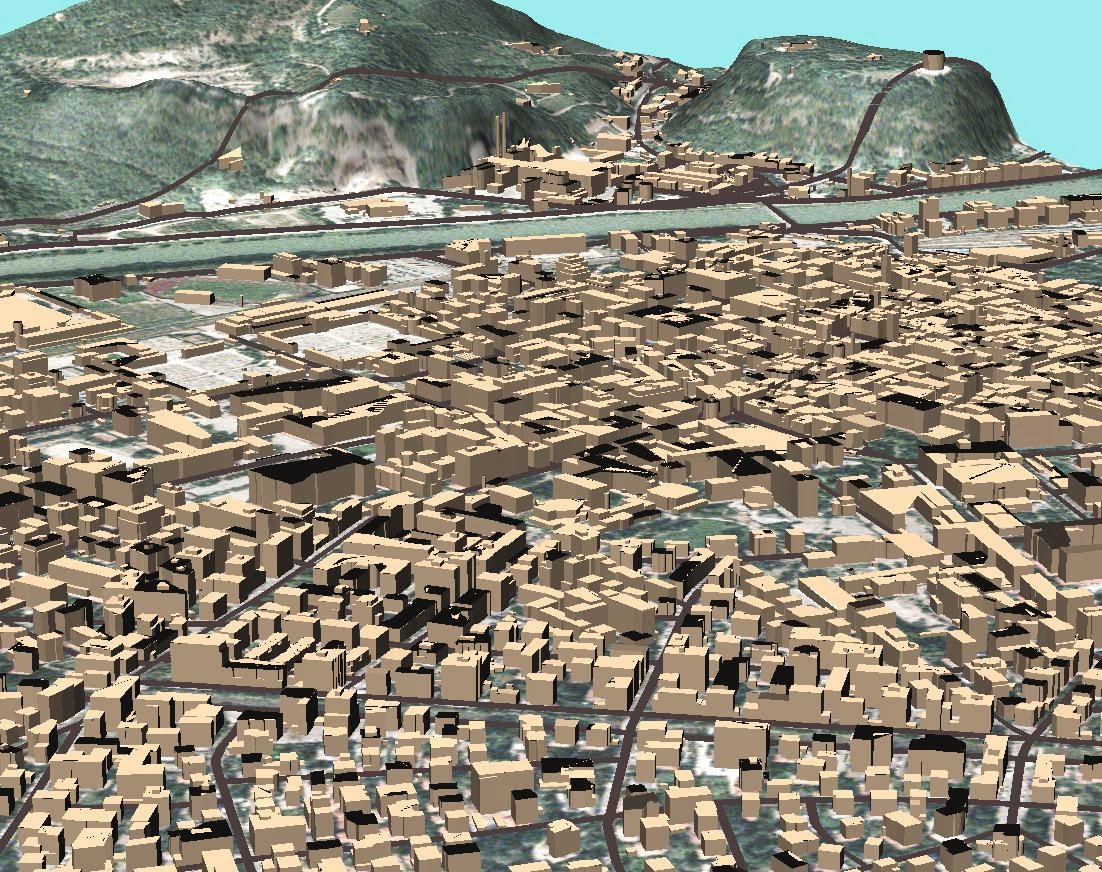
Geographic Resources Analysis Support System, commonly referred to as GRASS GIS, is a Geographic Information System (GIS) used for data management, image processing, graphics production, spatial modelling, and visualization of many types of data. It is Free (Libre) Software/Open Source released under GNU General Public License (GPL) >= V2. GRASS GIS is an official project of the Open Source Geospatial Foundation.
Originally developed by the U.S. Army Construction Engineering Research Laboratories (USA-CERL, 1982-1995, see history of GRASS 1.0-4.2 and 5beta), a branch of the US Army Corp of Engineers, as a tool for land management and environmental planning by the military, GRASS GIS has evolved into a powerful utility with a wide range of applications in many different areas of applications and scientific research. GRASS is currently used in academic and commercial settings around the world, as well as many governmental agencies including NASA, NOAA, USDA, DLR, CSIRO, the National Park Service, the U.S. Census Bureau, USGS, and many environmental consulting companies.
The GRASS Development Team has grown into a multi-national team consisting of developers at numerous locations.
In September 2006, the GRASS Project Steering Commitee was formed which is responsible for the overall management of the project. The PSC is especially responsible for granting SVN write access.
General GRASS GIS Features
GRASS GIS contains over 350 modules to render maps and images on monitor and paper; manipulate raster, and vector data including vector networks; process multispectral image data; and create, manage, and store spatial data. GRASS GIS offers both an intuitive graphical user interface as well as command line syntax for ease of operations. GRASS GIS can interface with printers, plotters, digitizers, and databases to develop new data as well as manage existing data.
GRASS GIS and support for teams
GRASS GIS supports workgroups through its LOCATION/MAPSET concept which can be set up to share data and the GRASS installation itself over NFS (Network File System) or CIFS. Keeping LOCATIONs with their underlying MAPSETs on a central server, a team can simultaneously work in the same project database.
GRASS GIS capabilities
Raster analysis: Automatic rasterline and area to vector conversion, Buffering of line structures, Cell and profile dataquery, Colortable modifications, Conversion to vector and point data format, Correlation / covariance analysis, Expert system analysis , Map algebra (map calculator), Interpolation for missing values, Neighbourhood matrix analysis, Raster overlay with or without weight, Reclassification of cell labels, Resampling (resolution), Rescaling of cell values, Statistical cell analysis, Surface generation from vector lines
3D-Raster (voxel) analysis: 3D data import and export, 3D masks, 3D map algebra, 3D interpolation (IDW, Regularised Splines with Tension), 3D Visualization (isosurfaces), Interface to Paraview and POVray visualization tools
Vector analysis: Contour generation from raster surfaces (IDW, Splines algorithm), Conversion to raster and point data format, Digitizing (scanned raster image) with mouse, Reclassification of vector labels, Superpositioning of vector layers
Point data analysis: Delaunay triangulation, Surface interpolation from spot heights, Thiessen polygons, Topographic analysis (curvature, slope, aspect), LiDAR
Image processing: Support for aerial and UAV images, satellite data (optical, radar, thermal), Canonical component analysis (CCA), Color composite generation, Edge detection, Frequency filtering (Fourier, convolution matrices), Fourier and inverse fourier transformation, Histogram stretching, IHS transformation to RGB, Image rectification (affine and polynomial transformations on raster and vector targets), Ortho photo rectification, Principal component analysis (PCA), Radiometric corrections (Fourier), Resampling, Resolution enhancement (with RGB/IHS), RGB to IHS transformation, Texture oriented classification (sequential maximum a posteriori classification), Shape detection, Supervised classification (training areas, maximum likelihood classification), Unsupervised classification (minimum distance clustering, maximum likelihood classification)
DTM-Analysis: Contour generation, Cost / path analysis, Slope / aspect analysis, Surface generation from spot heigths or contours
Geocoding: Geocoding of raster and vector maps including (LiDAR) point clouds
Visualization: 3D surfaces with 3D query (NVIZ), Color assignments, Histogram presentation, Map overlay, Point data maps, Raster maps, Vector maps, Zoom / unzoom -function
Map creation: Image maps, Postscript maps, HTML maps
The GRASS GIS 6 release introduced a new topological 2D/3D vector engine and support for vector network analysis. Attributes are managed in a SQL-based DBMS (PostgreSQL, mySQL, SQLite, ODBC, …), by default in DBF format. A new display manager has been implemented. The NVIZ visualization tool was enhanced to display 3D vector data and voxel volumes. Messages are partially translated (i18N) with support for FreeType fonts, including multibyte Asian characters. New LOCATIONs can be auto-generated eg. by EPSG code number using a location wizard. GRASS GIS is integrated with GDAL/OGR libraries to support an extensive range of raster and vector formats, including OGC-conformal Simple Features.
About GRASS GIS 7
GRASS GIS 7 is under development with a first releases in preparation (snapshots are already available). It offers large data support, an improved topological 2D/3D vector engine and much improved vector network analysis. Attributes are managed by default in SQLite format. The display manager has been improved for usability. The NVIZ visualization tool was completely rewritten. Image processing has also been improved. See more details at New Features.
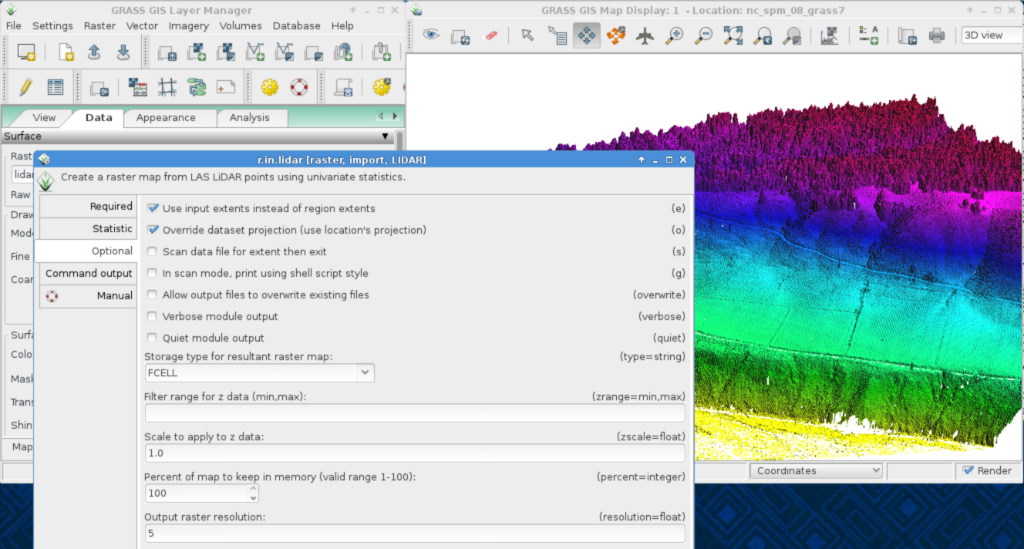
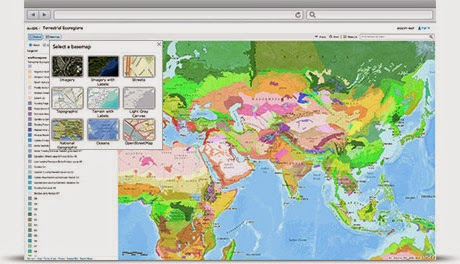
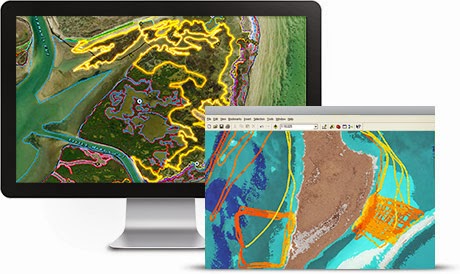
Screenshots
User InterfaceUser InterfaceVector map operationsVector map operations3D Visualization3D VisualizationLiDAR data Processing
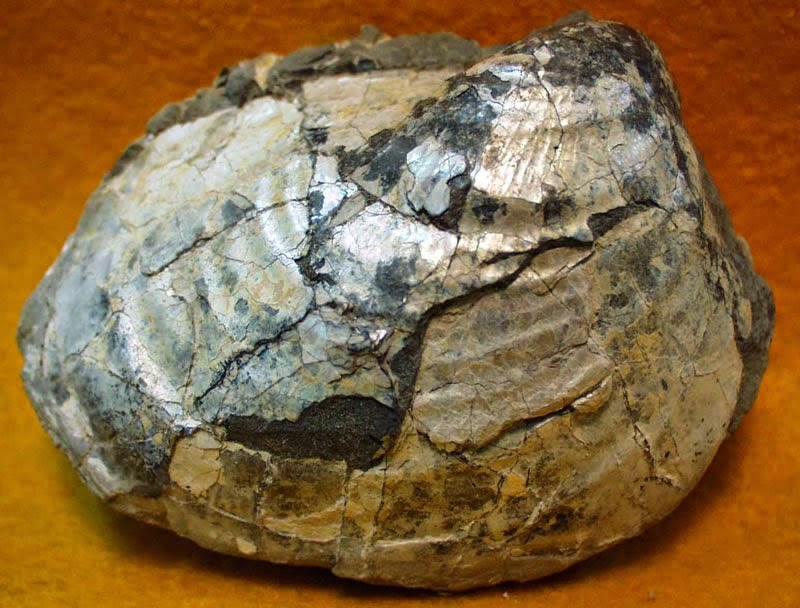
Bivalve, Inoceramus Series: Upper Cretaceous Collector: David Donovan University of Montana
Inoceramus, genus of extinct pelecypods (clams) found as fossils in Jurassic to Cretaceous rocks (laid down between 199.6 million and 65.5 million years ago). Especially important and widespread in Cretaceous rocks, Inoceramus had a distinctive shell; it is large, thick, and wrinkled in a concentric fashion, making identification relatively simple. The many pits at the dorsal region were the anchoring points for the ligaments that closed the shell.
Inoceramids: Some species of clams (bivalves) grew to giant size in the late Cretaceous, attaining diameters of four feet or more. In cross section, these shells are composed of prismatic (calcitic) crystals. The inner, nacreous (Mother of Pearl) layer of the shell (composed of aragonite) was usually dissolved during fossilization and the outer portion is usually covered with colonies of oysters and other invertebrates. Pearls are occasionally found pressed into the Inoceramid shell. According to Sowerby 1823, Inoceramus means “fibrous shell,” describing the prisms that are visible on the edge of shell fragments.
Inoceramus cuvieri was the first species of Inoceramus that was formally described by Sowerby (1814). Several species are found in the Late Cretaceous rocks of Kansas. At times in the Western Interior Sea, they provided shelter for various small fishes and at least one species of eel. They also produced pearls.
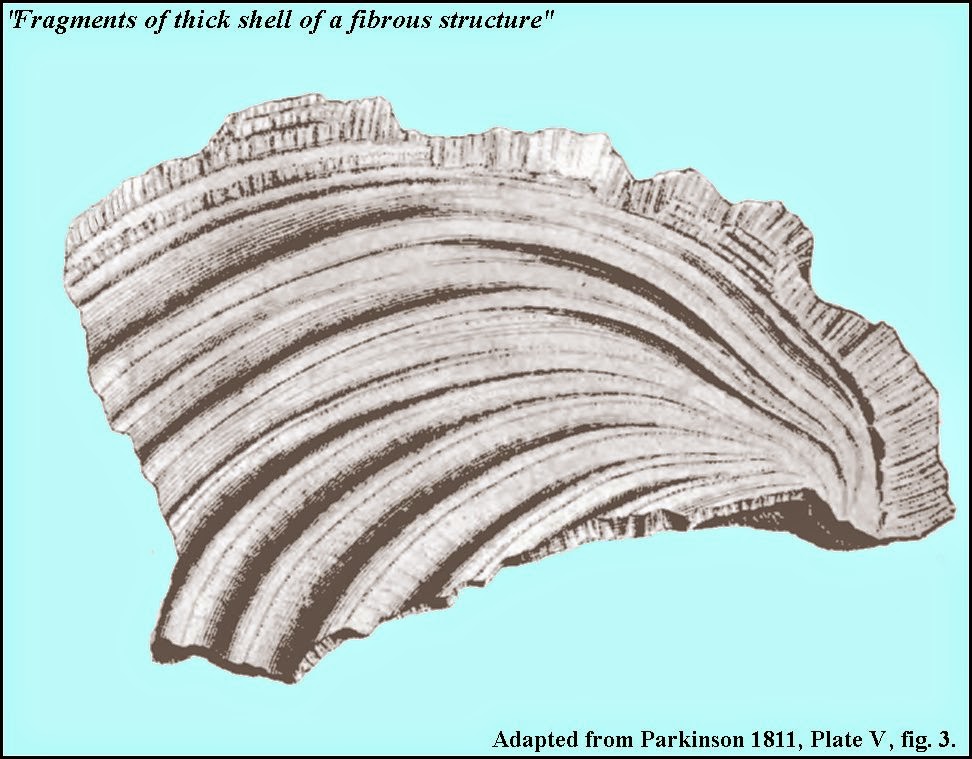
Inoceramid shells were discovered in Great Britain and France in the late 1700s and early 1800s, but they were seldom found complete. Europe in the James Parkinson (1811b) wrote one of the first descriptions of inoceramid shell fragments, in this case Inoceramus cuvieri from the English chalk:
“Fragments of thick shell of a fibrous structure: The doubts expressed respecting the nature of this shell, and the observations made with regard to it, offer another strong point of agreement between the shells of the two strata. The shell here alluded to is most probably that represented Org. Rem. vol. III. pl. V.-fig. 3; the structure of which agrees exactly with that mentioned as found in the French stratum of- chalk. That shell is however described as being of a tubular form; it is therefore right to observe, that fossil that represented Org. Rem. vol. III. pl. V.-fig. 3; the structure of which agrees exactly with that mentioned as found in the French stratum of- chalk. That shell is however described as being of a tubular form; it is therefore right to observe, that fossil pinnae do sometimes possess this peculiar structure.”
The clam had a thick shell paved with “prisms” of calcite deposited perpendicular to the surface, which gave it a pearly luster in life. Most species have prominent growth lines which appear as raised semicircles concentric to the growing edge of the shell. Paleontologists suggest that the giant size of some species was an adaptation for life in the murky bottom waters, with a correspondingly large gill area that would have allowed the animal to survive in oxygen-deficient waters.
Distribution
Species of Inoceramus had a worldwide distribution during the Cretaceous period. Many examples are found in the Pierre Shale of the Western Interior Seaway in North America. Inoceramus can also be found abundantly in the Cretaceous Gault Clay that underlies London. Other locations for this fossil include Vancouver Island, British Columbia, Canada; Texas, Tennessee, Kansas, California and Alaska, USA; Spain, France, and Germany.
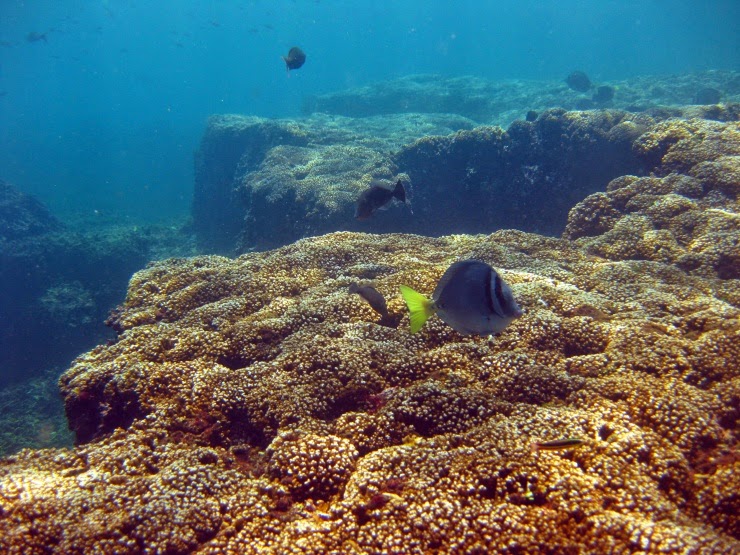
Panamá reef An actively growing reef in Panamá. Credit: Lauren Toth.
A new study has found that La Niña-like conditions in the Pacific Ocean off the coast of Panamá were closely associated with an abrupt shutdown in coral reef growth that lasted 2,500 years. The study suggests that future changes in climate similar to those in the study could cause coral reefs to collapse in the future.
The study found cooler sea temperatures, greater precipitation and stronger upwelling — all indicators of La Niña-like conditions at the study site in Panama — during a period when coral reef accretion stopped in this region around 4,100 years ago. For the study, researchers traveled to Panama to collect a reef core, and then used the corals within the core to reconstruct what the environment was like as far back as 6,750 years ago.
“Investigating the long-term history of reefs and their geochemistry is something that is difficult to do in many places, so this was a unique opportunity to look at the relationship between reef growth and environment,” said Kim Cobb, an associate professor in the School of Earth and Atmospheric Sciences at the Georgia Institute of Technology. “This study shows that there appears to have been environmental triggers for this well-documented reef collapse in Panama.”
The study was sponsored by the Geological Society of America, the American Museum of Natural History and the Smithsonian Institution’s Marine Science Network. The study is scheduled for publication on February 23 in the journal Nature Climate Change. The study was a collaboration with the Florida Institute of Technology, with Cobb’s lab providing an expertise in fossil coral analysis.
Climate change is the leading cause of coral-reef degradation. The global coral reef landscape is now characterized by declining coral cover, reduced growth and calcification, and slowdowns in reef accretion. The new study provides data to assist scientists in understanding how changes in the environment trigger long-term changes in coral reef growth and ecosystem function, which is a critical challenge to coral-reef conservation.
“Temperature was a key cause of reef collapse and modern temperatures are now within several degrees of the maximum these reefs experienced over their 6,750 year history,” said Lauren Toth, the study’s lead author, who was a graduate student at Florida Tech during the study. “It’s possible that anthropogenic climate change may once again be pushing these reefs towards another regional collapse.”
For the study, the research team analyzed a 6,750-year-old coral core from Pacific Panamá. The team then reconstructed the coral’s past functions, such as growth and accretion (accumulation of layers of coral), and compared that to surrounding environmental conditions before, during and after the 2,500-year hiatus in vertical accretion.
“We saw evidence for a different climate regime during that time period,” Cobb said. “The geochemical signals were consistent with a period that is very cool and very wet, with very strong upwelling, which is more like a modern day La Niña event in this part of the Pacific.”
In Pacific Panamá, La Niña-like periods are characterized by a cold, wet climate with strong seasonal upwelling. Due to limited data at the site, the researchers cannot quantify the intensity of La Niña events during this time, but document that conditions similar to La Niña were present at this site during this time.
“These conditions would have been for quite an extended time, which suggests that the reef was quite sensitive to prolonged change in environmental conditions,” Cobb said. “So sensitive, in fact, that it stopped accreting over that period.”
Future climate change, similar to the changes during the hiatus in coral growth, could cause coral reefs to behave similarly, the study authors suggest, leading to another shutdown in reef development in the tropical eastern Pacific.
“We are in the midst of a major environmental change that will continue to stress corals over the coming decades, so the lesson from this study is that there are these systems such as coral reefs that are sensitive to environmental change and can go through this kind of wholesale collapse in response to these environmental changes,” Cobb said.
Future work will involve expanding the study to include additional locations throughout the tropical Pacific.
“A broad-scale perspective on long-term reef growth and environmental variability would allow us to better characterize the environmental thresholds leading to reef collapse and the conditions that facilitate survival,” Toth said. “A better understanding of the controls on reef development in the past will allow us to make better predictions about which reefs may be most vulnerable to climate change in the future.”
Reference:
Lauren T. Toth, Richard B. Aronson, Kim M. Cobb, Hai Cheng, R. Lawrence Edwards, Pamela R. Grothe, Hussein R. Sayani. Climatic and biotic thresholds of coral-reef shutdown. Nature Climate Change, 2015; DOI: 10.1038/nclimate2541
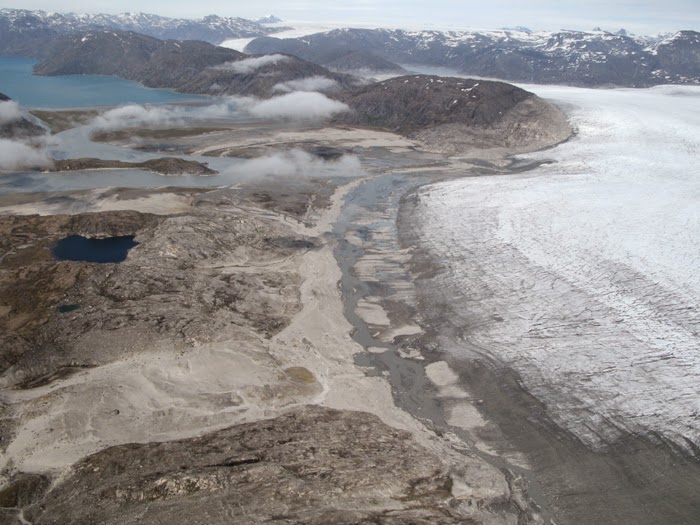
Frederikshåb Isblink in West Greenland. The small lake has previously received meltwater from the glacier when it was further advanced. Photo: Nicolaj Larsen.
A team of scientists lead by Danish geologist Nicolaj Krog Larsen have managed to quantify how the Greenland Ice Sheet reacted to a warm period 8,000-5,000 years ago. Back then temperatures were 2-4 degrees C warmer than present. Their results have just been published in the scientific journal Geology, and are important as we are rapidly closing in on similar temperatures.
While the world is preparing for a rising global sea-level, a group of scientists led by Dr. Nicolaj Krog Larsen, Aarhus University in Denmark and Professor Kurt Kjær, Natural History Museum of Denmark ventured off to Greenland to investigate how fast the Greenland Ice Sheet reacted to past warming.
With hard work and high spirits the scientists spent six summers coring lakes in the ice free land surrounding the ice sheet. The lakes act as a valuable archive as they store glacial meltwater sediments in periods where the ice is advanced. That way is possible to study and precisely date periods in time when the ice was smaller than present.
“It has been hard work getting all these lake cores home, but is has definitely been worth the effort. Finally we are able to describe the ice sheet’s response to earlier warm periods,” says Dr. Nicolaj Krog Larsen of Aarhus University, Denmark.
Evidence has disappeared
The size of the Greenland Ice Sheet has varied since the Ice Age ended 11,500 years ago, and scientists have long sought to investigate the response to the warmest period 8,000-5,000 years ago where the temperatures were 2-4 °C warmer than present.
“The glaciers always leave evidence about their presence in the landscape. So far the problem has just been that the evidence is removed by new glacial advances. That is why it is unique that we are now able to quantify the mass loss during past warming by combining the lake sediment records with state-of-the-art modelling,” says Professor Kurt Kjær, Natural History Museum of Denmark.
16 cm of global sea-level rise from Greenland
Their results show that the ice had its smallest extent exactly during the warming 8,000-5,000 years ago – with that knowledge in hand they were able to review all available ice sheet models and choose the ones that best reproduced the reality of the past warming.
The best models show that during this period the ice sheet was losing mass at a rate of 100 Gigaton pr. year for several thousand years, and delivered the equivalent of 16 cm of global sea-level rise when temperatures were 2-4 °C warmer. For comparison, the mass loss in the last 25 years has varied between 0-400 Gigaton pr. year, and it is expected that the Arctic will warm 2-7 °C by the year 2100.
Reference:
The response of the southern Greenland ice sheet to the Holocene thermal maximum, First published online February 18, 2015, doi: 10.1130/G36476.1
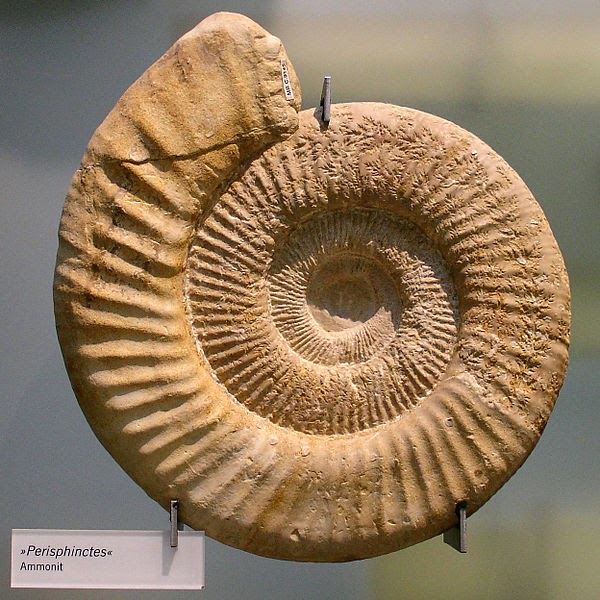
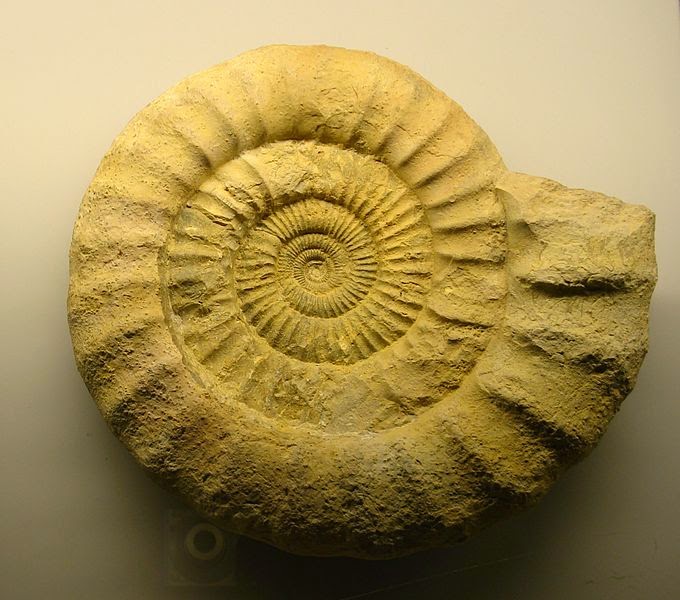
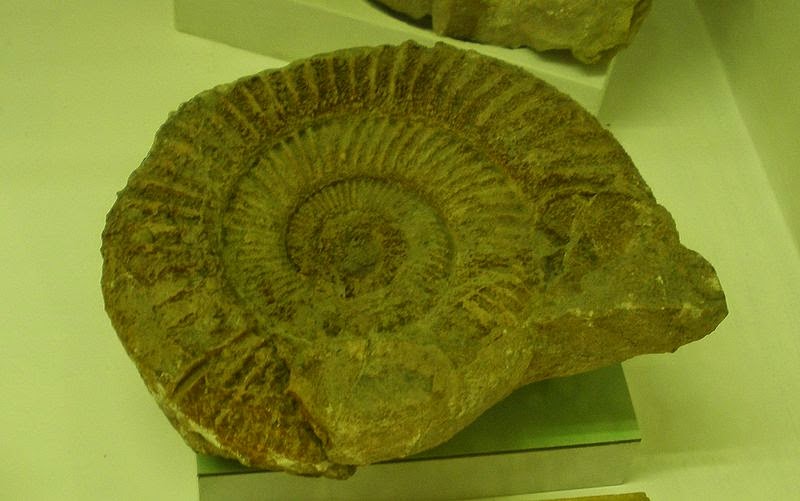
Perisphinctes – ammonite. The exhibit from the Museum of Natural History in Berlin
Perisphinctes is an extinct genus of ammonite cephalopod. They lived during the Jurassic Period and serve as an index fossil for that time period.
The Perisphinctes boweni ammonite was named after the English chemist and geologist E. J. Bowen (1898–1980).
Description
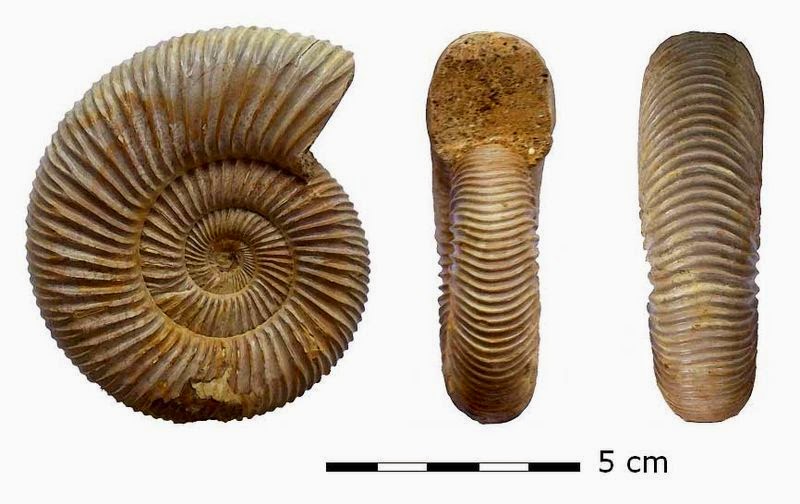
The appearance of the shell of this ammonite is quite conventional: planispirale (wrapped in a flat spiral), symmetrical, serpenticona (shaped like a coiled snake, with little overlap of the turns).
At each stage of growth, the shell has a section sub-square with rounded corners; the navel is very broad but shallow. The ornamentation consists of many coasts angular and slightly proverse (arched forward, i.e. in the direction of the opening). Near the belly, the coasts forking, crossing the ventral region seamless (there are no hulls or ventral furrows). In certain species, in the mature stage (and in general in macroconche) simplifies the ornamentation and the coast can become more sparse, simple and rounded. In juvenile forms are present constraints (bottlenecks) irregular along the spiral of the shell. The suture line (ie the line of insertion of the baffles on the wall of the shell) is of type ammonitico, rather complex, with many elements little but very jagged. The diameter of the shell of the adult forms is on average about 7 centimeters (may vary depending on the species), although specimens are found to more than 20 centimeters.
One of the most known species was Perisphinctes plicatilis.
Habitat
It is thought that Perisphinctes lived in shallow water, in the inner part of the continental shelf and shelf seas interior, like all forms of the same family ( Perisphinctidae ). This ammonite was a form cosmopolitan, widespread in warm-temperate waters worldwide.
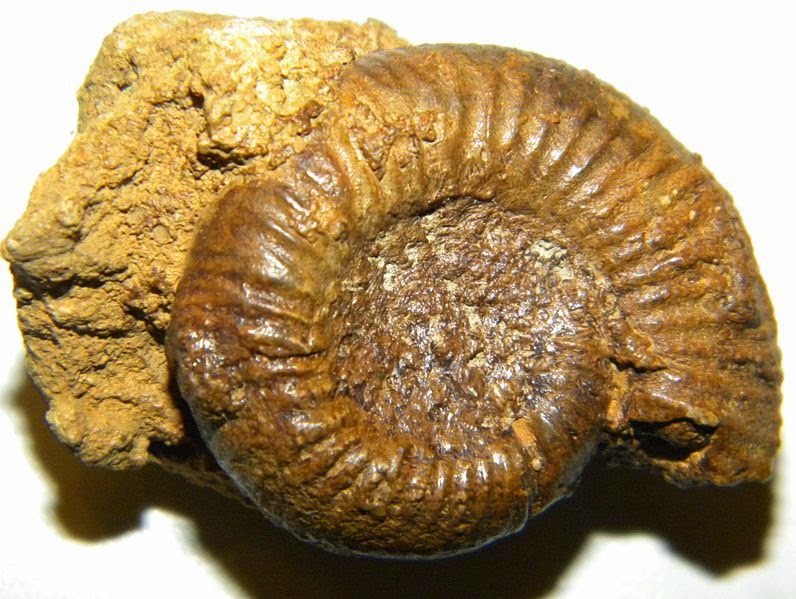
Specimen of Perisphinctes (Prosososphinctes) virguloides (Waagen) from Madagascar. Credit: AntonovPerisphinctes cf P. choffati Credit: GhedoghedoMuseo di Storia Naturale di Verona Credit: GhedoghedoPerisphingtes oxfordien Credit: Bildoj
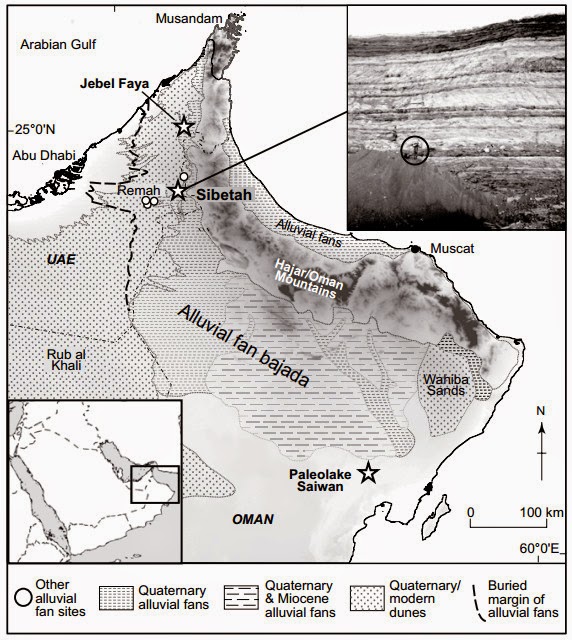
Map showing location of the study site and extent of bajada system in southeast Arabia, including other identified sections of the Al Ain fan (UAE—United Arab Emirates). Credit: Parton et al.
Considerable debate surrounds the migration of human populations out of Africa. Two predominant hypotheses concerning the timing contrast in their emphasis on the role of the Arabian interior and its changing climate. In one scenario, human populations expanded rapidly from Africa to southern Asia via the coastlines of Arabia approx. 50,000 to 60,000 years ago. Another model suggests that dispersal into the Arabian interior began much earlier (approx. 75,000 to 130,000 years ago) during multiple phases, when increased rainfall provided sufficient freshwater to support expanding populations.
Ash Parton and colleagues fall into the second camp, writing, “The dispersal of early human populations out of Africa is dynamically linked with the changing climate and environmental conditions of Arabia. Although now arid, at times the vast Arabian deserts were transformed into landscapes littered with freshwater lakes and active river systems. Such episodes of dramatically increased rainfall were the result of the intensification and northward displacement of the Indian Ocean Monsoon, which caused rainfall to reach across much of the Arabian Peninsula.”
Parton and colleagues present a unique alluvial fan aggradation record from southeast Arabia spanning the past approx. 160,000 years. Situated along the proposed southern dispersal route, the Al Sibetah alluvial fan sequence provides a unique and sensitive record of landscape change in southeast Arabia. This record is to date the most comprehensive terrestrial archive from the Arabian Peninsula, and provides evidence for multiple humid episodes during both glacial and interglacial periods.
Evidence from the Al Sibetah alluvial fan sequence indicates that during insolation maxima, increased monsoon rainfall led to the widespread activation of drainage systems and grassland development throughout regions that were important for the dispersal of early human populations.
Previously, the timing of episodes of increased humidity was largely linked to global interglacials, with the climate of Arabia during the intervening glacial periods believed to be too arid to support human populations. Parton and colleagues suggest, however, that periods of increased rainfall were not driven by mid-high latitude deglaciations every ~100,000 years, but by periods of maximum incoming solar radiation every ~23,000 years.
They write, “The occurrence of humid periods previously identified in lacustrine or speleothem records highlights the complexity and heterogeneity of the Arabian paleoclimate, and suggests that interior migration pathways through the Arabian Peninsula may have been viable approximately every 23,000 years since at least marine isotope state (MIS) 6,” about 191 thousand years ago.
Reference:
A. Parton, A. R. Farrant, M. J. Leng, M. W. Telfer, H. S. Groucutt, M. D. Petraglia, A. G. Parker. Alluvial fan records from southeast Arabia reveal multiple windows for human dispersal. Geology, 2015; DOI: 10.1130/G36401.1
A paper published today in Science provides a case for increasing transparency and data collection to enable strategies for mitigating the effects of human-induced earthquakes caused by wastewater injection associated with oil and gas production in the United States.
The paper is the result of a series of workshops led by scientists at the U.S. Geological Survey in collaboration with the University of Colorado, Oklahoma Geological Survey and Lawrence Berkeley National Laboratory, suggests that it is possible to reduce the hazard of induced seismicity through management of injection activities.
Large areas of the United States that used to experience few or no earthquakes have, in recent years, experienced a remarkable increase in earthquake activity that has caused considerable public concern as well as damage to structures. This rise in seismic activity, especially in the central United States, is not the result of natural processes.
Instead, the increased seismicity is due to fluid injection associated with new technologies that enable the extraction of oil and gas from previously unproductive reservoirs. These modern extraction techniques result in large quantities of wastewater produced along with the oil and gas. The disposal of this wastewater by deep injection occasionally results in earthquakes that are large enough to be felt, and sometimes damaging. Deep injection of wastewater is the primary cause of the dramatic rise in detected earthquakes and the corresponding increase in seismic hazard in the central U.S.
“The science of induced earthquakes is ready for application, and a main goal of our study was to motivate more cooperation among the stakeholders—including the energy resources industry, government agencies, the earth science community, and the public at large—for the common purpose of reducing the consequences of earthquakes induced by fluid injection,” said coauthor Dr. William Ellsworth, a USGS geophysicist.
The USGS is currently collaborating with interested stakeholders to develop a hazard model for induced earthquakes in the U.S. that can be updated frequently in response to changing trends in energy production.
“In addition to determining the hazard from induced earthquakes, there are other questions that need to be answered in the course of coping with fluid-induced seismicity,” said lead author of the study, USGS geophysicist Dr. Art McGarr. “In contrast to natural earthquake hazard, over which humans have no control, the hazard from induced seismicity can be reduced. Improved seismic networks and public access to fluid injection data will allow us to detect induced earthquake problems at an early stage, when seismic events are typically very small, so as to avoid larger and potentially more damaging earthquakes later on.”
“It is important that all information of this sort be publicly accessible, because only in this way can it be used to provide the timely guidance needed to reduce the hazard and consequences of induced earthquakes,” said USGS hydrologist and co-author of the paper, Dr. Barbara Bekins.
Reference:
“Coping with earthquakes induced by fluid injection.” Science 20 February 2015: DOI: 10.1126/science.aaa0494
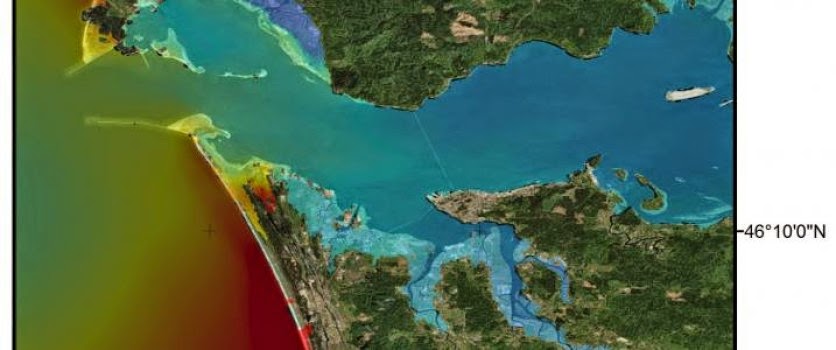
Tsunami impact map. Credit: Image courtesy of Oregon State University
Engineers at Oregon State University have completed one of the most precise evaluations yet done about the impact of a major tsunami event on the Columbia River, what forces are most important in controlling water flow and what areas might be inundated.
They found, in general, that tidal stages are far more important than river flow in determining the impact of a tsunami; that it would have its greatest effect at the highest tides of the year; and that a tsunami would be largely dissipated within about 50 miles of the river’s mouth, near Longview, Wash.
Any water level increases caused by a tsunami would be so slight as to be almost immeasurable around the Portland metropolitan area or Bonneville Dam, the study showed. But water could rise as much as 13 feet just inside the mouth of the Columbia River, and almost 7 feet within a few miles of Astoria.
“There have been previous models of Columbia River run-up as a result of a tsunami, but they had less resolution than this work,” said David Hill, an associate professor of civil engineering in the OSU College of Engineering. “We carefully considered the complex hydrodynamics, subsidence of grounds that a tsunami might cause, and the impacts during different scenarios.”
The impact of tsunamis on rivers is difficult to predict, researchers say, because many variables are involved that can either dampen or magnify their effect. Such factors can include the width and shape of river mouths, bays, river flow, tidal effects, and other forces.
But the major tsunami in Japan in 2011, which was caused by geologic forces similar to those facing the Pacific Northwest, also included significant inland reach and damage on local rivers. As a result, researchers are paying increased attention to the risks facing residents along such rivers.
The OSU research has been published in the Journal of Waterway, Port, Coastal and Ocean Engineering, by Hill and OSU graduate student Kirk Kalmbacher. It’s based on a major earthquake on the Cascadia Subduction Zone and a resulting tsunami, with simulations done at different rivers flows; and high, low, flood and ebb tides.
Of some interest is that the lowest elevation of a tsunami wave generally occurs at a high tide, but its overall flooding impact is the greatest because the tide levels are already so high. Because of complex hydrodynamic interactions, the study also found that only on a flood tide would water actually wash up and over the southern spit of the Columbia River mouth, with some local flooding based on that.
Tides, overall, had much more impact on the reach of a tsunami than did the amount of water flowing in the river.
“We were a little surprised that the river’s water flow didn’t really matter that much,” Hill said. “The maximum reach of a tsunami on the Columbia will be based on the tidal level at the time, and of course the magnitude of the earthquake causing the event.”
Based on a maximum 9.0 magnitude earthquake and associated tsunami, at the highest tide of the year, the research concluded:
Just offshore, the tsunami would raise water levels about 11.5 to 13 feet.
Just inside the mouth of the Columbia River, the water would rise about 13 feet.
At river mile 6, approaching Hammond, Ore., the river would rise about 10 feet.
At river mile 25, near Welch Island, the river would rise about 1.6 feet.
At river mile 50, near Longview, Wash., there would be no measurable rise in the river.
Maps have been developed as a result of this research that make more precise estimates of the areas which might face tsunami-induced flooding. They should aid land owners and land use planners, Hill said, in making improved preparations for an event that researchers now say is inevitable in the region’s future. Experts believe this region faces subduction zone earthquakes every 300-600 years, and the last one occurred in January, 1700.
There are some noted differences in the projections on these newer maps and older ones, Hill said.
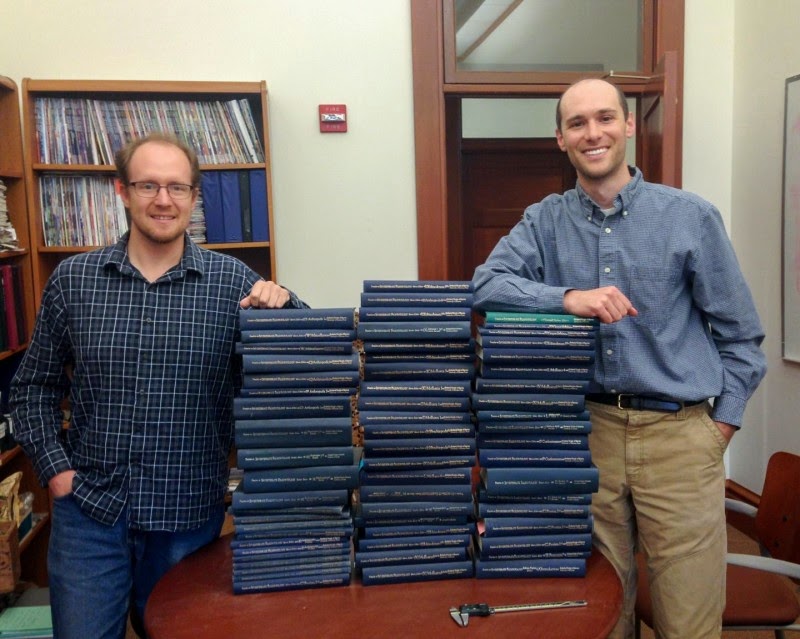
Prof. Jonathan Payne (right) and Noel Heim, a postdoctoral researcher in Payne’s lab, stand next to stacks of the Treatise on Invertebrate Paleontology, which they recently used to provide fresh evidence of Cope’s rule. Credit: Courtesy of Noel Heim
Does evolution follow certain rules? If, in the words of the famed evolutionary biologist Stephen Jay Gould, one could “rewind the tape of life,” would certain biological trends reemerge? Asked another way: can evolution be predicted?
New research suggests that, for at least one important biological trait-body size-the answer is yes.
In one of the most comprehensive studies of body size evolution ever conducted, Stanford scientists have found fresh support for Cope’s rule, a theory in biology that states that animal lineages tend to evolve toward larger sizes over time.
“We’ve known for some time now that the largest organisms alive today are larger than the largest organisms that were alive when life originated or even when animals first evolved,” said Jonathan Payne, a paleobiologist at Stanford’s School of Earth, Energy & Environmental Sciences.
What was unclear, however, was whether the average size of animals has been changing over time and, if so, whether that reflects a trend, or directionality, in body size evolution. “It’s not something that you can know by just studying living organisms or extrapolating from what you see over short time scales. If you do that, you will absolutely be wrong about the rate, and possibly also the direction,” Payne said.
The study, published in the Feb. 20 issue of the journal Science, reveals that over the past 542 million years, the mean sized of marine animals has increased 150-fold. “That’s the size difference between a sea urchin that is about 2 inches long versus one that is nearly a foot long,” Heim said. “This may not seem like a lot, but it represents a big jump.”
The research also found that the increase in body size that has occurred since animals first appeared in the fossil record around 550 million years ago is not due to all animal lineages steadily growing bigger, but rather to the diversification of groups of organisms that were already larger than other groups early in the history of animal evolution.
“That’s also something we didn’t know before,” Payne said. “For reasons that we don’t completely understand, the classes with large body size appear to be the ones that over time have become differentially more diverse.”
A universal trend?
Named after paleontologist Edward Cope, Cope’s rule was formulated in the late 19th century after paleontologists noticed that the body sizes of terrestrial mammals such as horses generally increased over time.
Scientists have attempted to test Cope’s rule in other animal groups, but the conclusions have been mixed. Corals and dinosaurs seem to follow Cope’s rule, for example, but birds and insects do not. As a result, some scientists have wondered whether the pattern observed in land mammals is a real evolutionary phenomenon or merely a statistical one resulting from random, non-selective evolution, also known as neutral drift. “It’s possible that as evolution proceeds, there really is no preference for being larger or smaller,” said Noel Heim, a postdoctoral researcher in Payne’s lab. “What appears to be an increase in average body size may be due to neutral drift.”
To test whether Cope’s rule applies to marine animals as a whole, Payne and a team that included undergraduates and high school interns compiled a dataset including more than 17,000 groups, or genera, of marine animals spanning five major phyla-Arthropods, Brachiopods, Chordates, Echinoderms, and Mollusks-and the past 542 million years. “Our study is the most comprehensive test of Cope’s rule ever conducted,” Heim said. “Nearly 75 percent of all of marine genera in the fossil record and nearly 60 percent of all the animal genera that ever lived are included in our dataset.”
To compile such a vast dataset, the team relied heavily on the Treatise on Invertebrate Paleontology, a 50-volume book set that includes detailed information about every invertebrate animal genus with a fossil record known to science. Using photographs and detailed illustrations of fossils in the Treatise, the team was able to calculate and analyze body size and volume for 17,208 marine genera.
A pattern soon became apparent: not all classes-groups of related species and genera-of animals trended toward larger size, but those that were bigger tended to become more diverse over time. The team suspects this is due to advantages associated with a larger size, such as the ability to move faster, burrow more deeply and efficiently in sediment, or capture larger prey.
“It’s really a story of the survival and diversification of big things relative to small things,” Heim said.
Virtual evolution
To investigate what might drive these trends toward larger body sizes, the team entered their measurement data into a computer model designed to simulate body size evolution. Beginning with the smaller species from each phylum, the model simulated how their body sizes might change as they evolved into new species. “As time marches forward, each species is assigned some probability of producing a new species, of remaining the same, or of going extinct, at which point it drops out of the race,” Heim said.
When a new virtual species was created, the model assigned the new creature a body size that could be bigger or smaller than its ancestor. The scientists ran multiple simulations, each with different assumptions. One scenario, for instance, assumed a neutral drift model of evolution, in which body size fluctuates randomly without affecting the survival of the species. Another assumed natural selection, or “active evolution,” of body size, in which having a larger body size confers certain survival advantages and is thus more likely to propagate through the generations.
The team found that the neutral drift simulation could not explain the body size trends observed in the fossil record. “The degree of increase in both mean and maximum body size just aren’t well explained by neutral drift,” Heim said. “It appears that you actually need some active evolutionary process that promotes larger sizes.”
The team believes that the vast database they compiled will be useful for studying other questions related to body size, such as whether or not organisms near the equator are, on average, bigger or smaller than those living at higher latitudes.
The findings could also prompt other scientists to investigate whether there is a trend in the evolution of other traits. “The discovery that body size often does evolve in a directional way makes it at least worth asking whether we’re going to find directionality in other traits if we measure them carefully and systematically,” Payne said.
Reference:
Noel A. Heim, Matthew L. Knope,†, Ellen K. Schaal,‡, Steve C. Wang, Jonathan L. Payne. Cope’s rule in the evolution of marine animals. Science, 2015 DOI: 10.1126/science.1260065
NGC 4565, an edge-on spiral galaxy. The stars, dust and gas are concentrated into a thin disc, much like the one in our Milky Way galaxy. Credit: Jschulman555
Research by New York University Biology Professor Michael Rampino concludes that Earth’s infrequent but predictable path around and through our Galaxy’s disc may have a direct and significant effect on geological and biological phenomena occurring on Earth. In a new paper in Monthly Notices of the Royal Astronomical Society, he concludes that movement through dark matter may perturb the orbits of comets and lead to additional heating in Earth’s core, both of which could be connected with mass extinction events.
The Galactic disc is the region of the Milky Way Galaxy where our solar system resides. It is crowded with stars and clouds of gas and dust, and also a concentration of elusive dark matter — small subatomic particles that can be detected only by their gravitational effects.
Previous studies have shown that Earth rotates around the disc-shaped Galaxy once every 250 million years. But Earth’s path around the Galaxy is wavy, with the Sun and planets weaving through the crowded disc approximately every 30 million years. Analyzing the pattern of Earth’s passes through the Galactic disc, Rampino notes that these disc passages seem to correlate with times of comet impacts and mass extinctions of life. The famous comet strike 66 million ago that led to the extinction of the dinosaurs is just one example.
What causes this correlation between Earth’s passes through the Galactic disc, and the impacts and extinctions that seem to follow?
While traveling through the disc, the dark matter concentrated there disturbs the pathways of comets typically orbiting far from Earth in the outer Solar System, Rampino observes. This means that comets that would normally travel at great distances from Earth instead take unusual paths, causing some of them to collide with the planet.
But even more remarkably, with each dip through the disc, the dark matter can apparently accumulate within Earth’s core. Eventually, the dark matter particles annihilate each other, producing considerable heat. The heat created by the annihilation of dark matter in Earth’s core could trigger events such as volcanic eruptions, mountain building, magnetic field reversals, and changes in sea level, which also show peaks every 30 million years. Rampino therefore suggests that astrophysical phenomena derived from Earth’s winding path through the Galactic disc, and the consequent accumulation of dark matter in the planet’s interior, can result in dramatic changes in Earth’s geological and biological activity.
His model of dark matter interactions with Earth as it cycles through the Galaxy could have a broad impact on our understanding of the geological and biological development of Earth, as well as other planets within the Galaxy.
Rampino said: “We are fortunate enough to live on a planet that is ideal for the development of complex life. But the history of Earth is punctuated by large scale extinction events, some of which we struggle to explain. It may be that dark matter — the nature of which is still unclear but which makes up around a quarter of the universe — holds the answer. As well as being important on the largest scales, dark matter may have a direct influence on life on Earth.”
In the future, he suggests, geologists might incorporate these astrophysical findings in order to better understand events that are now thought to result purely from causes inherent to Earth. This model, Rampino adds, likewise provides new knowledge of the possible distribution and behavior of dark matter within the Galaxy.
Reference:
Michael R. Rampino. Disc dark matter in the Galaxy and potential cycles of extraterrestrial impacts, mass extinctions and geological events. Monthly Notices of the Royal Astronomical Society, 2015 DOI: 10.1093/mnras/stu2708
A new type of ichthyosaur, an extinct marine reptile which was alive at the same time as the dinosaurs, has been identified from a fossil found on Dorset’s Jurassic coast.
The fossil had been in the collections of Doncaster Museum and Art Gallery for more than 30 years until Dean Lomax (25) palaeontologist and Honorary Scientist at The University of Manchester, uncovered its hidden secrets.
Dean first examined the fossil in 2008 when he noticed several abnormalities in the bone structure which made him think he had something previously unidentified. Working with Professor Judy Massare of Brockport College, New York, he spent over five years travelling the world to check his findings and a paper explaining the discovery is published today in the Journal of Vertebrate Paleontology.
Dean said: “After examining the specimen extensively, both Professor Massare and I identified several unusual features of the limb bones (humerus and femur) that were completely different to any other ichthyosaur known. That became very exciting. After examining perhaps over a thousand specimens we found four others with the same features as the Doncaster fossil.”
Similar-shaped to dolphins and sharks, ichthyosaurs, which are often misidentified as ‘swimming dinosaurs’, swam the seas of the earth for millions of years during the Triassic, Jurassic and Cretaceous periods, before being wiped out. The Doncaster fossil is between 189 and 182 million years old, from a time in the early Jurassic period called the Pliensbachian. It is the world’s most complete ichthyosaur of this age.
“The recognition of this new species is very important for our understanding of ichthyosaur species diversity during the early Jurassic, especially from this time interval, ” Dean added.
The research also looked at the size and age of the new species, and enabled a look at sexual differences (males and females). This included comparison with other groups of reptiles (living and extinct), whose limb bones are different between males and females, something that had never before been applied to ichthyosaurs. The limb bones of the Doncaster specimen were professionally prepared and removed, funded by the Esmée Fairbairn Foundation, as part of a grant awarded to Doncaster Museum Service.
The new species has been named Ichthyosaurus anningae in honour of the British collector, and woman in science, Mary Anning, who first collected ichthyosaurs in the early 1800’s. It is the first new Ichthyosaurus identified for almost 130 years.
Dean added: “Mary worked tirelessly to bring the ichthyosaurs, among other fossils, to the attention of the scientific world. Mary and her brother, Joseph, discovered the first ichthyosaur specimen to be scientifically recognised, collected at Lyme Regis around 1811.”
“It is an honour to name a new species, but to name it after somebody who is intertwined with such an important role in helping to sculpt the science of palaeontology, especially in Britain, is something that I’m very proud of. In fact, one of the specimens in our study was even found by Mary herself! Science is awesome.”
“This discovery shows that new species, and not only ichthyosaurs, are awaiting discovery in museum collections. Not all new discoveries are made in the field.”
Since life originated on Earth between 3.8 and 3.9 Ga ago, microorganisms have significantly shaped and influenced the chemistry of Earth’s surface and subsurface environments. Reconstructing the evolution of early microbial life depends mainly on finding organic and mineral remnants of microbial activity preserved in the rock record.
Even when microfossils are found, there are often controversies about their biological origin, since parameters that lead to a good preservation of microfossils are not well constrained. In a study published in Nature Communications, researchers from the University of Tübingen, Dr. Aude Picard (now at Harvard University in Cambridge, MA), Dr. Martin Obst, Professor Andreas Kappler, and Gregor Schmid, in collaboration with Dr. Luca Quaroni from the Paul Scherrer Institute in Villigen, Switzerland, show that microbial structures that are embedded in iron minerals are preserved under pressure and temperature conditions that occur during rock formation.
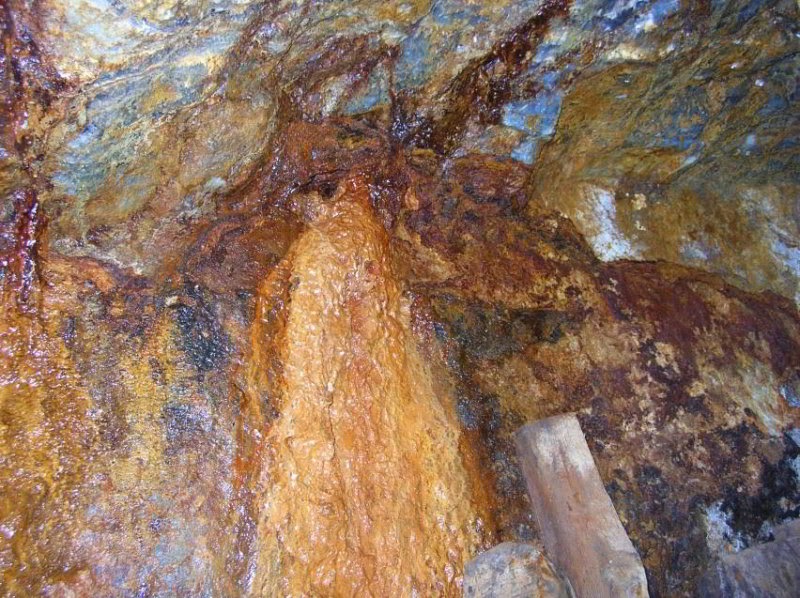
Some microaerophilic Fe(II)-oxidizing bacteria produce organo-mineral structures, so-called twisted stalks, in the presence of high iron and low oxygen concentrations. Nowadays such environments are limited to a few places on Earth, such as caves, mines, deep-sea hydrothermal vents and some lake and marine sediments. But in the past, when the oceans were rich in iron and oxygen started to accumulate in the atmosphere, these microorganisms would have thrived. If found in rocks having experienced a diagenetic history, these structures could help identify the presence of low oxygen concentrations in ancient iron-rich environments.
For this study, Dr. Aude Picard and colleagues Dr. Martin Obst and Gregor Schmid went sampling microbial mats in the historical Segen Gottes silver mine (Black Forest, SW Germany) that contained twisted stalks and submitted them to pressure and temperature conditions that are typically encountered during rock formation, e.g. up to 250°C and 140 MPa. Twisted stalks were then observed using microscopic and spectroscopic techniques, 1) to determine whether structures are preserved and 2) to characterize their mineral and organic composition and 3) to provide spectroscopic signatures that could be useful for microfossil search in the rock record.
Using confocal laser microscopy and electron microscopy, coupled with the use of advanced synchrotron techniques at the Swiss Light Source, in Villigen (Switzerland), and at the Canadian Light Source in Saskatoon, Canada, the team was able to show that not only the morphology of microbial twisted structures is preserved after long incubations under diagenetic conditions, but also organic remnants can be detected in the mineralized twisted structures. During this study they demonstrated the important role that iron plays in the preservation of these structures submitted to extreme conditions. They finally provide experimental signatures that could be of use when studying rock samples. These new findings will help to better identify microfossils in the rock record, especially at a critical time on Earth when oxygen started to be an important component of the atmosphere.
Refernce:
Picard A., Kappler A., Schmid G., Quaroni L., Obst M. (2015) Experimental diagenesis of organo-mineral structures formed by microaerophilic Fe(II)-oxidizing bacteria. Nature Communications, DOI: 10.1038/ncomms7277.
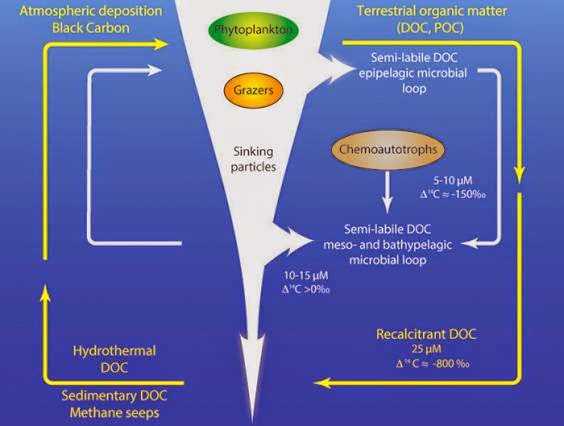
Based on mathematical modeling of dissolved organic carbon, researchers are beginning to see the outlines of a new deep sea carbon cycle — one in which dissolved carbon is continually added and removed by a number of diverse processes. Credit: Dan Repeta/WHOI
Understanding how oceans absorb and cycle carbon is crucial to understanding its role in climate change. For approximately 50 years, scientists have known there exists a large pool of dissolved carbon in the deep ocean, but they didn’t know much about it—such as the carbon’s age (how long it’s been in organic form), where it came from, how it got there, and how long it’s been there, or how these factors influence its role in the carbon cycle.
Now, new research from scientists at MIT and Woods Hole Oceanographic Institute (WHOI) provides deeper insights into this reservoir and reveals a dynamic deep-ocean carbon cycle mediated by the microbes that call this dark, cold environment home. The work, published in Proceedings of the National Academy of Sciences, suggests the deep ocean plays a significant role in the global carbon cycle, and has implications for our understanding of climate change, microbial ecology, and carbon sequestration.
For years, scientists thought that carbon of varying ages made up the deep-ocean reservoir and fueled the carbon cycle, but nobody could prove it. “I’ve been trying for over 20 years,” said Daniel Repeta, a senior scientist in marine chemistry and geochemistry at WHOI and co-author of the study. “Back then we didn’t have a good way to go in and pull that carbon apart to see the pieces individually. We would get half-answers that suggested this was happening, but the answer wasn’t clear enough,” he says. With the help of Daniel Rothman, a professor of geophysics in MIT’s Department of Earth, Atmospheric, and Planetary Sciences (EAPS), and Chris Follett, a postdoctoral associate in Mick Follows’ group and formerly of Rothman’s group, Repeta would soon find the answers he was looking for.
Follett thought a next-generation method called a step-wise oxidation test might be able to reveal the age distribution of the carbon pool. The team exposed water samples taken from the Pacific Ocean to ultraviolet radiation, which converts organic carbon to carbon dioxide. The gas was then collected and measured for radiocarbon, which Follett used to estimate the carbon isotopes’ ages and cycling rate. “At a minimum there are two widely separated components—one extremely young and one extremely old, and this young component is fueling the larger flux through the dissolved carbon pool,” he says.
In other words, the youngest source of dissolved organic carbon in the deep ocean originates from the surface, where phytoplankton and other marine life fix carbon from the atmosphere. Eventually these organisms die and sink down the water column, where they dissolve and are consumed by microbes. Because it takes 1,000 years for the ocean’s surface waters to replace bottom waters, scientists thought the few-centuries-old carbon, some of which is anthropogenic, couldn’t possibly contribute to the deep ocean pool. That’s no longer the case.
The researchers found that as particulate organic carbon sinks through the water column and dissolves, some of it is sequestered in the reservoir and respired by microbes. The results suggest a more active carbon cycle in the deep ocean bolstered by bacteria that utilize the reservoir as a food source. “We previously thought of the deep ocean as a lifeless and very slow system,” Repeta says. “But those processes are happening much faster than we thought.” If this microbial pump is in fact more robust, then it gives more credence to the idea of using the mechanism to sequester carbon in the deep ocean—a concept some scientists have been working on in recent years.
While some carbon in the reservoir may cycle faster, older carbon cycles much slower. This is because older sources such as hydrothermal vents, methane seeps, and ocean sediment produce carbon that isn’t easily consumed. However, these sources are often disregarded in analyses of the marine carbon cycle because they are considered too small in magnitude to be significant. But when Follett accounted for them in calculating the reservoir’s turnover, or the time it takes for carbon to completely cycle, what he found was astounding. The turnover time of the older portion of the reservoir is 30,000 years—30 times longer than it takes for the ocean itself to cycle—which indicates these sources may be relevant. “To find something that is more consistent with the biochemical story was fun and surprising,” says Follett. “A lot of people have proposed these ideas over the years, but they haven’t had the evidence to back them up. It was nice to come in and give them the evidence they needed to support these ideas.”
So what do these findings mean for the climate system? In the short term, not much. But on a longer time-scale, one that spans thousands of years, it could affect projections of the amount of atmospheric and sequestered carbon. “It potentially has a very important influence on climate through its role in sequestration of carbon away from the atmosphere,” says Mick Follows, an EAPS associate professor in the Program of Atmospheres, Oceans, and Climate, who was not involved in the study. “If some radical change occurred that changed the nature of that pool, then it could have an effect on climate through greenhouse gas’ influence on the atmosphere.” Such changes might include, for example, deep-ocean temperature fluctuations affecting microbial activity, or a shifting surface ocean environment that could affect plankton and other organisms from which dissolved organic carbon originates.
“One of the things I’ve taken away from the work is that in a way, they’ve transformed a view of how people are thinking that pool is turning over in the deep ocean and what the sources of that are,” says Follows. “It seems like a very profound change in our understanding of how the system works relative to ingrained perspectives.”
Reference:
“Hidden cycle of dissolved organic carbon in the deep ocean.” PNAS 2014 111 (47) 16706-16711; published ahead of print November 10, 2014, DOI: 10.1073/pnas.1407445111
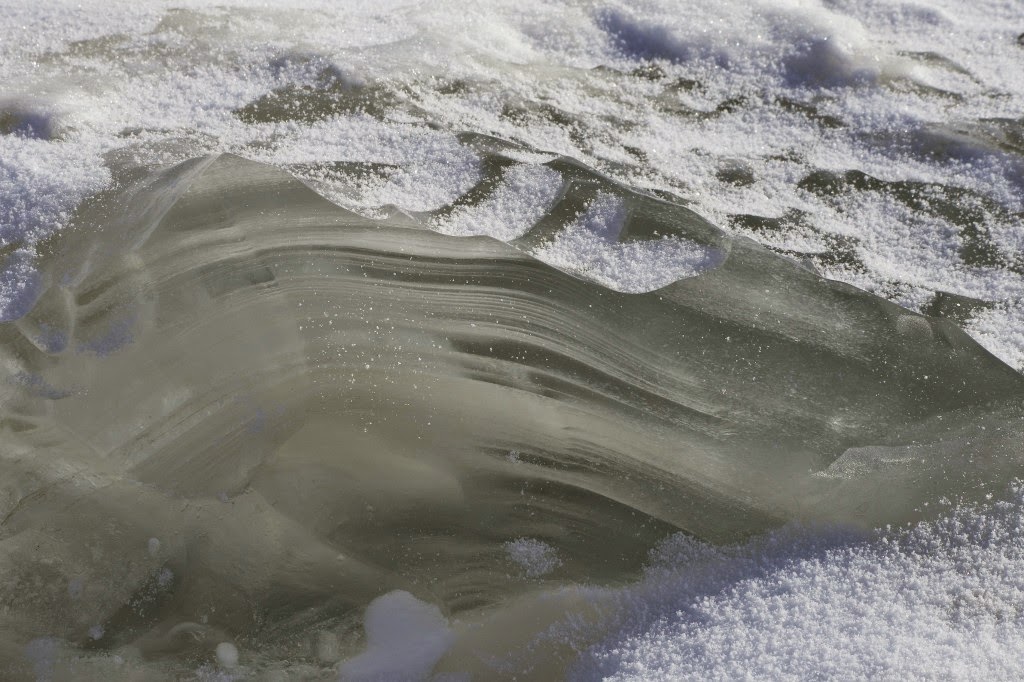
Frozen Spring. Credit: Ali Dean/Australian Antarctic Division
Australian scientists are hoping a rare sub-glacial water eruption near Australia’s Casey station, will reveal why meltwater is present, and the extent of a river and dam system flowing deep under the Law Dome ice cap.
In only the second reported incident of its type in Antarctica a Jökulhlaup, or sudden outburst of basal melt water from beneath the ice cap, erupted near Robinsons Ridge, 15 kilometres south of Casey.
Associate Professor Ian Goodwin from Macquarie University observed the first recorded Antarctic Jökulhlaup, also near Casey station, in 1985-86, and located a large subglacial lake near the ice margin.
The new eruption was first noticed by Casey expeditioners over the 2014 winter, who were puzzled by springs of flowing water erupting from the surface of the ice.
“The expeditioners saw the melt water rising to the surface and dispersing over the surrounding ice sheet, before refreezing,” Professor Goodwin said.
“The refrozen Jökulhlaup water is very prominent because of its striking olive-green colour, which contrasts sharply with the surrounding blue glacial ice and white snow.
“This is a very exciting and rare opportunity to find out more about the conditions under Law Dome from this sub-glacial water which is potentially tens of thousands of years old.”
Samples of the frozen Jökalhlaup water are currently being collected by scientists from the CSIRO and the Australian Nuclear Science and Technology Organisation.
The ice will then be analysed in new ice laboratory facilities at Macquarie University, Curtin University and the Antarctic Climate and Ecosystems CRC.
“There have been advances in technology and techniques since the last known eruption 30 years ago, which will allow us to measure the hydro chemistry in much more detail from these samples,” Professor Goodwin said.
“We will measure the major ionic chemistry and isotopes to find out how the bottom of the ice sheet is melted, how far the water has travelled, and an insight into the stability of the ice sheet.
“We are also attempting to estimate the age of the water,” he said.
“Additionally, if the researchers can get a sample close to the water when it’s erupting, they will take refrozen samples to measure the methane and greenhouse gas content in the sub glacial meltwater.”
Program leader with the Australian Antarctic Division, Dr Tas van Ommen, said previous aerial radar work through the ICECAP project will help the researchers pinpoint the origin of the water.
“The ICECAP work used ice-penetrating radar to map the conditions at the base of the ice sheet in East Antarctica, and this can help identify which areas are more likely to produce basal melting and water,” Dr van Ommen said.
“Putting the whole picture together, with data from ICECAP, deep ice core temperature measurements on Law Dome and samples from the Jökalhlaup, will help us understand the past and present behaviour of the ice cap, and how it might evolve in the future,” he said.
Previously, scientists thought the Law Dome ice cap was frozen to the bedrock. However, the outburst of the frozen spring in 1985 showed water is produced underneath some parts of the ice cap, at least episodically.
“Our observations of the Jökulhlaup confirmed Law Dome had high geo-thermal heat emanating from the Earth’s crust which was melting the bottom of the ice cap,” Professor Goodwin said.
“This water then flowed in river systems under the ice sheet out into the ocean, or in this case, where the rivers are dammed by frozen ice, the water flows up to the surface through weaknesses in the ice sheet,” he said.
The samples from the Jökalhlaup will be flown back to Hobart later this month and analysis of the ice is expected to take several months.
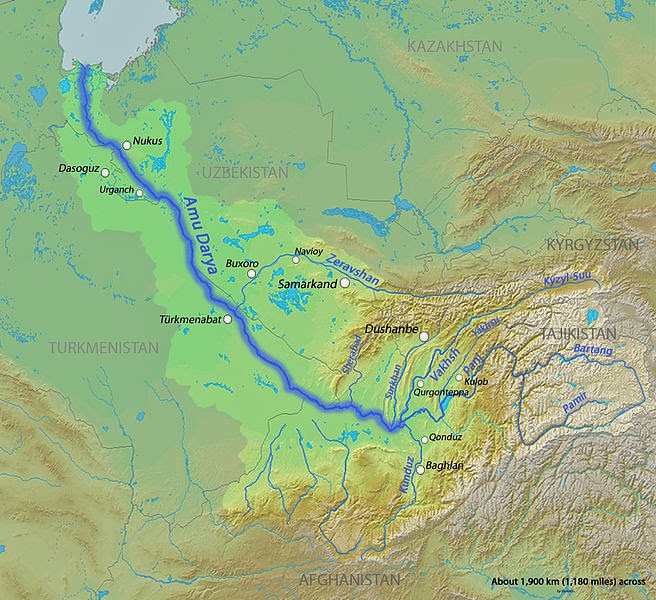
The Amu Darya is a major river in Central Asia. It is formed by the junction of the Vakhsh and Panj rivers and flows into the Aral Sea. In ancient times, the river was regarded as the boundary between Greater Iran and Turan.
Names
In classical antiquity, the river was known as the Ōxus in Latin and Ὦξος Oxos in Greek—a clear derivative of Vakhsh — the name of the largest tributary of the river. In Vedic Sanskrit, the river is also referred to as Vaksu (वक्षु). The Avestan texts too refer to the River as Yaksha-arte.
In ancient Afghanistan, the river was also called Gozan, descriptions of which can be found in the book “The Kingdom of Afghanistan: a historical sketch By George Passman Tate”. In Middle Persian sources of the Sassanid period the river is known as Wehrōd (lit. “good river”).
The name Amu is said to have come from the medieval city of Āmul, (later, Chahar Joy/Charjunow, and now known as Türkmenabat), in modern Turkmenistan, with Darya being the Persian word for “river”.
Medieval Arabic and Muslim sources call the river Jayhoun (جيحون) which is derived from Gihon, the biblical name for one of the four rivers of the Garden of Eden.
Watershed
About 1,385,045 square kilometres (534,769 sq mi) of land is drained by the Amu Darya into the Aral Sea endorheic basin. This includes most of Tajikistan, the southwest corner of Kyrgyzstan, the northeast corner of Afghanistan, a long narrow portion of eastern Turkmenistan and about half of Uzbekistan. Part of the Amu Darya’s drainage divide in Tajikistan forms that country’s border with China (in the east) and Pakistan (to the south). About 61% of the drainage lies within Tajikistan, Uzbekistan and Turkmenistan, while 39% is in Afghanistan. Of the area drained by the Amu Darya, only about 200,000 square kilometres (77,000 sq mi) actively contribute water to the river. This is because many of the river’s major tributaries (especially the Zeravshan River) have been diverted, and much of the river’s drainage is dominated by outlying desert and steppe.
The abundant water flowing in the Amu Darya comes almost entirely from glaciers in the Pamir Mountains and Tian Shan, which, standing above the surrounding arid plain, collect atmospheric moisture which otherwise would probably escape somewhere else. Without its mountain water sources, the Amu Darya would not contain any water—would not exist—because it rarely rains in the lowlands through which most of the river flows. Throughout most of the steppe, the annual rainfall is about 300 millimetres (12 in).
Note : The above story is based on materials provided by Wikipedia.
Esri’s ArcGIS is a geographic information system (GIS) for working with maps and geographic information. It is used for: creating and using maps; compiling geographic data; analyzing mapped information; sharing and discovering geographic information; using maps and geographic information in a range of applications; and managing geographic information in a database.
The system provides an infrastructure for making maps and geographic information available throughout an organization, across a community, and openly on the Web.
ArcGIS includes the following Windows desktop software:
ArcReader, which allows one to view and query maps created with the other ArcGIS products;
ArcGIS for Desktop, which is licensed under three functionality levels:
ArcGIS for Desktop Basic (formerly known as ArcView), which allows one to view spatial data, create layered maps, and perform basic spatial analysis;
ArcGIS for Desktop Standard (formerly known as ArcEditor), which in addition to the functionality of ArcView, includes more advanced tools for manipulation of shapefiles and geodatabases; or
ArcGIS for Desktop Advanced (formerly known as ArcInfo), which includes capabilities for data manipulation, editing, and analysis.
There are also server-based ArcGIS products, as well as ArcGIS products for PDAs. Extensions can be purchased separately to increase the functionality of ArcGIS.
Key Features
Conduct Spatial Analysis
Hundreds of tools for performing spatial analysis are included in ArcGIS for Desktop. These tools allow you to turn data into actionable information and automate many of your GIS tasks.
Manage Your Data More Efficiently
With support for more than 70 data formats, you can easily integrate all types of data for visualization and analysis. An extensive set of geographic, tabular, and metadata management, creation, and organization tools are available.
Explore a World of Content
ArcGIS Online is now a part of an ArcGIS for Desktop license. Take advantage of ArcGIS Online to browse the world’s most extensive online geographic resource and discover maps and data about thousands of topics. Combine content any way you want and see it on a map.
Automate Advanced Workflows
Manipulate data with a minimum number of clicks and automate your editing workflow with powerful editing tools. Advanced editing and coordinate geometry (COGO) tools simplify your data design, input, and cleanup.
Easily Create Maps
Produce high-quality maps without the hassles associated with complex design software. With ArcGIS for Desktop you can take advantage of:
A large library of symbols
Simple wizards and predefined map templates
Start Geocoding
From simple data analysis to business and customer management, there is a wide range of applications for which geocoding can be used. With geocoded addresses, you can display the address locations and see patterns within the information.
Access Advanced Imagery
There are many ways you can work with image data (raster data) in ArcGIS for Desktop. You can use it as a background (basemap) to analyze other data layers, apply different types of specifications to the image dataset, or use it as part of the analysis.
Video:
ArcGIS Overview
System Requirements
ArcGIS for Desktop has been certified for Windows operating systems and requires
Microsoft .NET Framework to be installed. Read the complete list of System Requirements for
additional information.