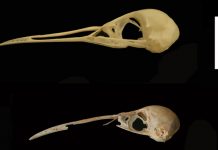
The world’s first study into the brain anatomy of an ichthyosaur, a marine reptile that lived at the same time as the dinosaurs, has shed light on how the reptilian brain adapted to life in the oceans. The work, led by University of Bristol undergraduate Ryan Marek, is out this week in the journal Palaeontology.
With strong ties to Mary Anning, the renowned nineteenth century fossil collector, ichthyosaurs are ingrained within the history of palaeontological research, having first been discovered over 200 years ago. Despite this, research into these ancient marine reptiles is difficult as their fossilised remains are usually found compressed and flattened, making studies of skull function and brain anatomy near impossible.
However, one specimen from the Bath Royal Literary and Scientific Institute, originally found locally at a site now lost to science in Strawberry Bank, Somerset, is almost complete, and is preserved spectacularly in three dimensions.
Ryan Marek, lead author on the paper said: “The fossil is incredible – its skull is in a good enough condition to use the latest visualisation techniques, allowing us to carry out work that’s never been done on ichthyosaurs before.”
Ichthyosaurs were a group of marine reptiles closely related to plesiosaurs and pliosaurs, all of which are found on various British coastlines on a semi-regular basis. They superficially resemble dolphins, however ichthyosaurs have much larger eyes, used to see when diving to depths of up to 600 metres, and longer, thinner snouts.
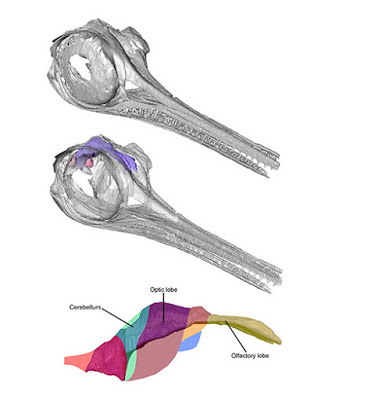
Using CT scanning and digital visualisation software, the researchers were able to fully restore the skull of the ichthyosaur, which was assigned to the species Hauffiopteryx typicus that lived 180 million years ago. Then, by infilling the cavity in the skull which the brain used to occupy, the researchers, for the first time ever, were able to study the brain anatomy of an ichthyosaur.
The study found enlarged optic lobes, which correspond to the specimen’s huge eyes and allows it to see when diving to deeper waters. The ichthyosaur also had an enlarged cerebellum, the part of the brain responsible for motor control, enabling it to be a highly mobile, visual predator. Unexpectedly, the olfactory region, the area responsible for processing smell, is enlarged.
Co-author Professor Mike Benton said: “These results both confirm previous hypotheses on ichthyosaur sensory biology and also offer new insights into how these marine reptiles interacted with their environments – perhaps the creatures relied more on their sense of smell than we previously thought.”
Not only does the study break new ground on ichthyosaur brain anatomy, it also provides scientists with more information on other aspects of ichthyosaur skull anatomy, previously difficult to study due to the flattened nature of many ichthyosaur skull fossils.
Another co-author, Benjamin Moon said: “Identifying these features allows us to better understand the evolutionary relationships of ichthyosaurs, and how the group evolved, and this study will hopefully encourage others to research other ichthyosaur specimens with the latest techniques.”
Reference:
“The skull and endocranium of a Lower Jurassic ichthyosaur based on digital reconstructions.” Palaeontology. DOI: 10.1111/pala.12174
Along the way, the investigation sheds light on the long-held urban myth of the fluidity of stained glass.
In some circles, no matter how much experimentation and research is done that gives a definitive answer to the contrary, some urban myths continue to live.
Even in the scientific community some urban legends never seem to go away. One of those involves whether glass flows over time, using the example of stained-glass windows in medieval cathedrals as an example where the glass pieces appear thicker at the bottom. The thinking is the glass flowed downward over centuries.
A pair of Texas Tech University professors and a doctoral student, however, recently used prehistoric amber to test theories of glasses and concurrently provided new information to dispel that myth. Their findings were highlighted by the National Science Foundation (NSF), which funded the research.
The study by Greg McKenna, Horn Professor and the John R. Bradford Chair in the Department of Chemical Engineering, Sindee Simon, Horn Professor and chemical engineering department chair; and Jing Zhao, a chemical engineering doctoral student, tested the thermal, mechanical and flow properties of 20 million-year-old Dominican amber glass.
What they found was the density of the amber after 20 million years of aging is just roughly 2 percent more than the same amber that had been heated past its glass transition temperature and then rapidly cooled, a process referred to as thermal rejuvenation. In the first heating, they determined the fictive temperature of the amber to be about 44 degrees Celsius lower than the glass transition temperature, an important piece of their study.
McKenna and his colleagues showed the molecular mobility of the amber in the temperature window between the fictive temperature and the glass transition temperature does not diverge as suggested by classical glass theory. In addition, McKenna commented the extremely long time to get a 2 percent density change in the amber at a temperature only 110 degrees Celsius below the glass transition temperature shows that the glass in windows that are 900-1,200 years old and multiple hundreds of degrees Celsius below the glass transition would certainly not have noticeably changed in that time frame, thus dispelling the myth of glass flowing far below its glass transition temperature.
“It’s a cute story,” McKenna said. “If you do the calculations you can show that it’s really not true. But it makes it exciting to show that the time scale involved in this process is way too long for cathedral glass to be flowing.”
Necessary time
The impetus for the experiment began, McKenna said, after Zhao carried out experiments for her doctorate qualifying exam where a polyvinyl acetate polymer was aged 22 days at about 14 degrees Celsius below the glass temperature. That’s a long time in the life of a graduate or doctoral student but not long enough to answer fundamental questions regarding glass transition temperature.
McKenna said for common window glass, the glass transition temperature is more than 1,000 degrees Celsius, while for many polymer glasses it is about 100 degrees Celsius. Even in high-performance polymers it may be below 250 degrees Celsius. McKenna said it is important to understand that range of temperatures and the glass theories that he and his colleagues were testing form the current basis for making long-term predictions about materials such as polymeric adhesives or polymer resin-based composites that are used in products such as passenger jet airplanes.
McKenna, Simon and Zhao, however, wanted to take the experiment beyond the 220 days, so McKenna was able to find a reliable source for Dominican amber through the Dead Bug in Amber Club, and Zhao “took the amber and ran with it,” McKenna said.
Through heating the material and cooling it either rapidly or gradually, the researchers discovered that, in the course of 20 million years, the reduction in glass transition temperature to fictive temperature was only about 45 degrees, a relatively slow change considering the age of the material.
“For us, that window is important because previously, it was only about 15 degrees in 22 days,” McKenna said. “To go from 22 days to 20 million years and only get an extra 30 degrees, it shows how slow things move in glass forming materials once they are below the glass transition temperature. Then we were able to establish with the amber in that window that the paradigm of diverging time scales above absolute zero didn’t seem to be true, and that’s what we were looking to test.
“By working between fictive temperature and the glass transition temperature we’re able to say the upper-bound behavior is not close to the extrapolated models.”
The myth lives
McKenna points to a 1995 comment in the journal Science on the nature of glass by Phillip Anderson, who won the Nobel Prize in Physics in 1977, as a reason why research continues in this area. Anderson said, “The deepest and most interesting unsolved problem in solid state theory is probably the theory of the nature of glass and the glass transition.”
McKenna said many theories arising from the research tend to be those of the behavior of glass above the glass transition temperature when the material is in equilibrium. The problem, he said, is that below glass transition temperature, the material falls out of equilibrium.
“It is these really long time scales that are needed to get it back into equilibrium,” McKenna said. “Scientists want to know if, below the glass transition, is the behavior as predicted by theory? And we’ve found there is a whole class of theory that does not agree with what has been found. And, in my opinion, that class of theory should be abandoned because it is incorrect and you will never be able to correctly predict below glass transition behavior using such theories. New theories are being developed in laboratories, and the amber data are good enough that we can actually discriminate among these theories.”
McKenna said a group of scientists at the University of Wisconsin has developed a way to create 10 million-year-old glass in 10 minutes through a method called physical vapor deposition, and this may provide researchers a way to conduct more thorough examinations of glass dynamics. McKenna also is planning to test theories using metallic glass.
The ultimate goal is to make long-term predictions on the behavior of materials in the glassy state and how those materials can be used. Examples range from the new Airbus A-380 or the Boeing 787 Dreamliner place that make broad use of composite materials that are made with glassy organic resins and polymers that will age over the lifespan of the aircraft.
“Understanding that aging will also affect our understanding and ability to predict when they will break,” McKenna said. “We think it’s important. For example, I was just at a workshop last year at the NSF where scientists from universities and industry got together to look at lifetime issues. The reality is there’s a whole group of people who say the same thing, that we don’t know enough about the behavior of these materials in the glassy state to make reliable long-term predictions.”
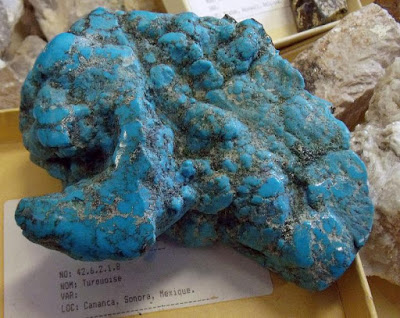
This is a turquoise sample from Cananea, Sonora, Mexico. Credit: Wikipedia; CC BY 2.0
Turquoise has had cultural significance for Native American peoples in the southwestern United States and Mexico for more than a millennium, and turquoise artifacts have been recovered from archaeological sites hundreds of kilometers distant from known sources of the mineral. Evidence for pre-Hispanic turquoise mining has been recognized across much of the southwestern United States and northern Mexico, including as far north as Leadville, Colorado, and as far south as Zacatecas.
Detailed archaeological studies of ancient turquoise mines are rare, and little is known about the timing of their exploitation or the cultural identities of the miners In this study, Alyson M. Thibodeau and colleagues show that many geological sources of turquoise in the southwestern U.S. and northern Mexico can be distinguished from each other through the measurement of lead and strontium isotopic ratios. These isotopic analyses thus provide a new way to investigate the mining and movement of this mineral in prehistory.
Reference:
Isotopic evidence for the provenance of turquoise in the southwestern United States
A.M. Thibodeau et al., Dickinson College, Carlisle, Pennsylvania, USA. Published online ahead of print on 3 June 2015; DOI: 10.1130/B31135.1
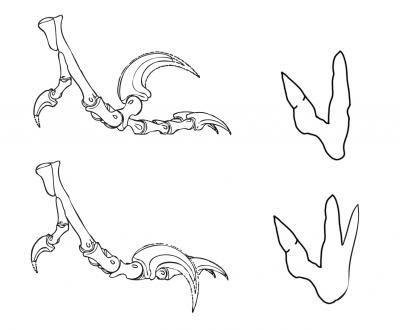
This is an illustration representing raptor tracks. Credit: Illustration by Scott Persons and Lida Xing
In this summer’s much anticipated blockbuster Jurassic World, actor Chris Pratt joins forces with a pack of swift and lethal velociraptors. ‘Velociraptor belongs to a group of predatory dinosaurs called the deinonychosaurs, or simply the ‘raptors’,’ says University of Alberta paleontologist Scott Persons. ‘Raptors are characterized by particularly nasty feet. Their big toes each bore an enlarged and wickedly hooked talon, which makes raptors well suited for Hollywood fight scenes.’
Persons and University of Alberta alumnus Lida Xing are part of the research team that has just documented a rich fossil footprint site in central China, which contains the tracks of several kinds of dinosaurs, including raptors. From these tracks, the team has gained new insights into raptor locomotion. The raptor track research was published this month in the scientific journal PaleoWorld.
‘The enlarged raptorial claw was a killing tool. To keep it sharp, raptors normally held it in a raised position,’ Persons explains. ‘That way, the claw stayed sharp. Otherwise, it would have become dulled as it dug into the ground when the dinosaur walked. Modern cats retract their claws while walking or running for the same purpose.’
This unique foot posture makes the tracks of raptors easy to identify. ‘Most other carnivorous dinosaur tracks show three forward-pointing toes, like a bird. But a raptor footprint usually only records two complete toes and sometimes just the base of a third — although we have discovered that there are exceptions,’ Persons notes, referring to one of the study’s new findings.
In a small percentage of the raptor tracks, an impression of the usually raised big-toe claw was found. The claw’s thin edge left a long and narrow gouge that does not have the splay of a typical toe print. ‘It’s unclear why the raptors occasionally lowered their killing claws into the ground,’ Persons says. ‘One hypothesis is that, because the tracks were left in the soft mud of a lake shore, the raptors might have needed a little extra traction. So, although the hooked claw was primarily a weapon, it could also be deployed like a big cleat.’
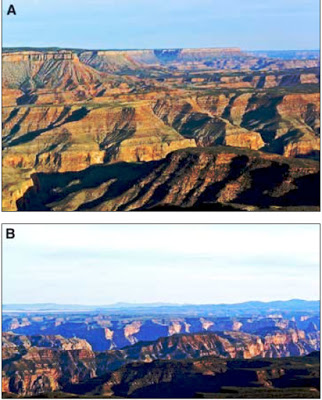
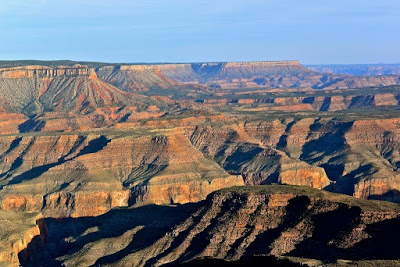
Figure 2 from Darling and Whipple: Photographs taken from Twin Point overlook by Rich Rudow. (A) View to the southeast, showing the Shivwitz Plateau escarpment above the Sanup Plateau. (B) View to the south, showing the Sanup Plateau in the foreground and the Hualapai Plateau in the background. Surprise and Spencer canyons are prominent recesses in the plateau. Credit: Photographs taken from Twin Point overlook by Rich Rudow; Geosphere, 10 June 2015.
The age of the Grand Canyon (USA) has been studied for years, with recent technological advances facilitating new attempts to determine when erosion of this iconic canyon began. The result is sometimes conflicting ages based on different types of data; most data support the notion that the canyon began to erode to its current form about six million years ago. Then even newer, “high-tech,” data became available and questions were again raised about whether the western end of the canyon could be older.
Two numbers are used as general time markers for these alternate hypotheses. The first suggests that the canyon may have started incising 17 million years ago. The second suggests that the canyon may have looked largely as it does today 70 million years ago. The time contrast between these hypotheses is striking, and any accurate concept of the canyon would have to be consistent with all observations.
Other researchers have studied the Grand Wash Fault, which truncates the western Grand Canyon. The fault runs north to south, nearly perpendicular to the Canyon. The fault slides in such a way that the west side of the fracture moves down relative to the east side, leaving a cliff face called the Grand Wash Cliffs. This slip, called “normal slip,” has led to the opening of a valley called the Grand Wash trough along the east end of Lake Meade. Erosion of hillslopes and canyons in the Grand Wash Cliffs is driven by the fault movement exposing the rock at the surface. These hillslopes and canyons are similar to the Colorado River’s tributaries in Grand Canyon, except hills and side streams are all steeper in Grand Canyon.
This comparison is useful because the Grand Wash fault has been studied extensively, and other scientists have shown that the fault completed most of its sliding between 18 and 12 million years ago. The rocks and climate in both regions are similar, so the difference in landform shape is most likely due to when the landforms started eroding.
In this new article for Geosphere, Andrew Darling and Kelin Whipple focus on the western Grand Canyon, west of the Hurricane fault. Their data show that the Grand Canyon must be younger than the fault slip that occurred 18 to 12 million years ago. Comparing their data to other datasets suggests that the notion that the canyon starting eroding around six million years ago is still the best scientific idea for the age of the Grand Canyon.
Reference:
Geomorphic constraints on the age of the western Grand CanyonAndrew Darling and Kelin Whipple, Arizona State University, Tempe, Arizona, USA. Published online on 10 June 2015; DOI: 10.1130/GES01131.1.
The Natural Gas Initiative will expand Stanford’s research on energy and the environment by focusing additional resources on the growing importance of natural gas. Credit: Courtesy of Stanford University
In the transition to a low-carbon energy system, how can society use increasing supplies of natural gas to minimize greenhouse gas emissions, improve air quality, boost economies and strengthen energy security? Stanford University’s new Natural Gas Initiative will work to answer that question, as well as myriad scientific, technological and policy questions that underlie it.
The new program will expand Stanford’s research on energy and the environment by focusing additional resources on the growing importance of natural gas. U.S. production has risen almost 50 percent in the past 10 years, and global demand for gas is anticipated to outpace all other fossil fuels. More than 35 professors and research staff from a dozen Stanford academic departments have already affiliated with the Natural Gas Initiative.
‘If developed in a responsible manner, natural gas can be the critical transition fuel that reduces the environmental impacts of fossil fuels and keeps us on a path toward a decarbonized energy future,’ said Mark Zoback, a professor of geophysics and NGI’s director.
‘When electric power plants burn natural gas instead of coal, that reduces emissions of carbon dioxide and other pollutants, which are rising in many countries,’ Zoback said. ‘If done properly, domestic gas development can also improve energy security and boost economic growth elsewhere, as it has in North America.’
U.S. emissions of CO2 have declined to the level of the mid-1990s. Compared with burning coal, natural gas emits about half the carbon dioxide and substantially less soot, mercury and sulfur. Natural gas has also revitalized several domestic industries and reduced the U.S. trade imbalance. Idle natural gas import terminals are being retooled to export liquefied natural gas to Asia and Europe, which is looking to lessen its dependence on Russia for natural gas.
However, the technologies that have released the new supplies — hydraulic fracturing and horizontal drilling — have also unleashed anxieties about contaminated drinking water, induced earthquakes and lenient regulation. At times directly affecting residential neighborhoods, the large-scale industrial process has strained many U.S. communities. The increased use of natural gas has angered opponents of fossil fuels and heightened concerns about methane leaks throughout the U.S. natural gas production and pipeline system.
‘Natural gas must be developed with safeguards to reduce impacts on water, air quality, land, nearby communities and ecosystems,’ Zoback said. ‘While we have to meet both short-term energy and economic needs, we also need to meet society’s long-term environmental goals.’
Initial research projects funded
The Natural Gas Initiative has begun funding early stage, exploratory research, following a ‘seed grant’ model used by Stanford’s Precourt Institute for Energy, one of NGI’s hosting organizations. The program will fund interdisciplinary research in six key areas: resource development, uses, environmental impacts and climate change, global markets and finance, policy and regulatory reform, and geopolitical impacts.
‘The growth of natural gas is happening, and that presents both opportunities and challenges,’ said Pamela Matson, dean of Stanford’s School of Earth, Energy & Environmental Sciences, which is NGI’s other hosting organization. ‘Stanford can bring our expertise — in engineering, geophysics, water resources, environmental science, economics, policy and law — to address the issues.’
In one of the first research projects NGI is funding, Robert Jackson, professor of environmental Earth system science, and Adam Brandt, assistant professor of energy resources engineering, are starting to develop a more accurate, faster and less expensive method for detecting leaks of methane — a very potent greenhouse gas and the primary component of natural gas — at well pads and gas processing stations. At a natural gas field in Utah thought to have particularly high methane leakage, the investigators will couple helicopter-based infrared imaging with aircraft and ground-based estimates of methane leaks to develop software to recognize plumes. Jackson, a member of the Earth System Science Department, has mapped thousands of natural gas leaks across city streets in Boston and Washington, and published the first studies of hydraulic fracturing’s impact on drinking water. Brandt, in Energy Resources Engineering, led a national study last year on methane leaks in the U.S. natural gas system.
NGI’s other four inaugural research projects are:
To aid government decision-making, John Weyant and Hillard Huntington of the Management Science & Engineering Department and Michael Wara of Stanford Law School are designing a robust structure for evaluating the opportunities, economics and environmental impacts of exporting U.S. natural gas to Europe and Asia.
Chemical Engineering’s Thomas Jaramillo is experimenting with electrochemically converting natural gas into higher-value products, like methanol. Such fuels could lower greenhouse gas emissions from transportation compared with gasoline and diesel fuel.
Eric Shaqfeh of the Chemical Engineering and Mechanical Engineering departments and Gianluca Iaccarino of Mechanical Engineering are making a computational tool for inventing new, benign fluids for use in hydraulic fracturing.
Eric Dunham of the Geophysics Department is developing methods for three-dimensional imaging of complex fracture networks in order to identify the location of constrictions or regions of partial closure.
‘Making the most of our natural gas resources and making sure they provide the environmental benefits we seek will require much more than technology,’ said Sally Benson, director of the Precourt Institute for Energy and a professor in energy resources engineering. ‘Good policies, international engagement and a rich dialogue with key stakeholders will be critical for success.’
Additional leadership
Bradley Ritts will be NGI’s managing director. Ritts, most recently with Chevron Asia Pacific Exploration & Production Co., earned a doctorate in geological and environmental sciences at Stanford. Previously the Robert R. Shrock Professor of Sedimentary Geology at Indiana University, Ritts is a National Science Foundation CAREER grant recipient, and an expert on oil and gas exploration. Tisha Schuller, who earned a bachelor’s degree in Earth systems from Stanford, will be a strategic advisor. Schuller was president of the Colorado Oil & Gas Association when that state’s energy companies and the Environmental Defense Fund worked with state regulators to enact the first rules in the United States to reduce methane emissions and volatile gases.
Initial funding for NGI was provided by Stanford’s School of Earth, Energy & Environmental Sciences; the Precourt Institute for Energy; the Office of the Dean of Research; and the President’s Office. Zoback, Ritts and Schuller are in the process of building out NGI’s corporate affiliates program. Support will also come from individual donors, non-governmental organizations and foundations.
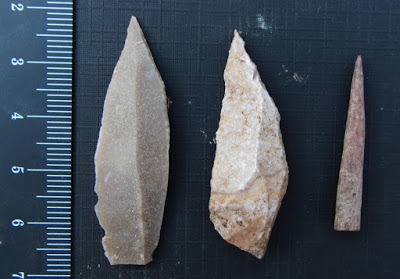
Two stone tool points were made using a prismatic blade technique (left and center), and a bone point or needle (right). Credit: Photo by Aaron Stutz, Emory University.
Thousands of stone tools from the early Upper Paleolithic, unearthed from a cave in Jordan, reveal clues about how humans may have started organizing into more complex social groups by planning tasks and specializing in different technical skills.
The Journal of Human Evolution published a study of the artifacts from Mughr el-Hamamah, or Cave of the Doves, led by Emory University anthropologists Liv Nilsson Stutz and Aaron Jonas Stutz.
“We have achieved remarkably accurate estimates of 40,000 to 45,000 years ago for the earliest Upper Paleolithic stone tools in the Near East,” Aaron Stutz says. “Our findings confirm that the Upper Paleolithic began in the region no later than 42,000 years ago, and likely at least 44,600 years ago.”
The rich array of artifacts shows a mix of techniques for making points, blades, scrapers and cutting flakes. “These toolmakers appear to have achieved a division of labor that may have been part of an emerging pattern of more organized social structures,” Stutz says.
The theory that greater social division of labor was important at this prehistoric juncture was first put forward by anthropologists Steven Kuhn and Mary Stiner.
“Our work really seems to support that idea,” Stutz says. “The finds from Mughr el-Hamamah give us a new window onto a transitional time, on the cusp of modern human cultural behaviors, bridging the Middle and Upper Paleolithic.”
This pivotal time also marked the ebbing of Neanderthals as a last wave of anatomically modern humans spread out from Africa and into the Near East. This region, also known as the Levant, comprises the eastern Mediterranean at the crossroads of western Asia and northeast Africa. As the final surge of modern humans passed through the Levant, they would likely have encountered human populations that arrived earlier, and they may also have interbred with Neanderthals.
“Our find sits right in the Levantine corridor, midway between the Dead Sea and the Sea of Galilee, where each generation expanding into Eurasia would have foraged for food and made campsites,” Stutz says. “We don’t know if these toolmakers were mainly Neanderthals or anatomically modern humans, but recent evidence from other studies now raises the possibility that they were a mix of different populations. What we see at the Mughr el-Hamamah site is that individuals were starting to live, work and form families in larger, more culturally structured social networks.”
Mughr el-Hamamah is located in a limestone outcrop 240 feet above sea level. It overlooks the Jordan Valley, opposite the Nablus Mountains in the West Bank. The Stutzes, a husband-and-wife team, led excavations of the cave in 2010, funded by a grant from the National Science Foundation.
The relatively undisturbed Upper Paleolithic layer included fireplaces stacked atop one another that yielded chunks of well-preserved charcoal from hearths associated with the tools. Co-authors Jeff Pigati of the U.S. Geological Survey and Jim Wilson of Aeon Laboratories derived radiocarbon dates for the charcoal specimens, using advanced techniques that minimized the chances of contamination.
The cave is about 30-feet deep with an entrance about 20-feet wide. “We can speculate that several families shared the space and worked alongside one another,” Aaron Stutz says. “We found burned animal bones, so they were likely roasting meat, and perhaps boiling plants in hides suspended over their fires as they sat nearby making tools. From the mouth of the cave, they would have had a commanding view of what was likely wetlands and open-vegetation terrain. They could see approaching visitors and deer and gazelle wandering in the distance. If their kids were playing outside, they might also be watching for leopards or other predators.”
Toolmaking was a major activity of the group, as evidenced by their prolific output. Co-author John Shea, an anthropologist from Stony Brook University and an expert flint knapper himself, is continuing to analyze the thousands of implements they left behind.
Many discoveries of Near Eastern tool assemblages dating prior to the early Upper Paleolithic show that humans focused on just one technology. The tools tend to look similar and likely served many uses – the Stone Age version of a Swiss Army Knife. “It takes a good bit of cleverness to be able to devise a tool that helps you cover lots of different situations,” Stutz says. “And it makes sense in a context where you don’t necessarily know what you’re going to need your piece of flint for that day.”
The group of toolmakers at Mughr el-Hamamah, however, used different technologies to get different tools. “They were investing in the kinds of activities that require maintaining relationships and group planning,” Stutz says. “They were gearing up for a clearly defined division of labor, including firewood gathering, plant gathering, hunting and food foraging.”
They produced large quantities of blades for knives, and for hafting onto spears, using a prismatic blade technique that yields long, narrow points that are nearly identical. “This standardization minimizes waste of the rock while maximizing the end product,” Stutz says. “It’s the conceptual forerunner to assembly-line production.”
Through this method, the toolmakers could have efficiently produced the armature for multiple hunters going out on a lengthy foray, increasing the chances for finding and striking a target, he says.
“It would have been socially advantageous for individuals to give blades that they made to others, to entice them to stay together as a group,” he adds. “That kind of reciprocity builds relationships. And the stronger the connectivity of your social networks, the greater chance of increasing the number of calories and the quality of nutrients for the group.”
Artifacts from the cave also included scraping tools, made on thick blades for hafting onto a handle and likely used for working wood and animal hides.
Other tools continued to be crafted with what is known as the Levallois technique, which was more often used to make the multi-use flakes and triangular points so common in earlier periods.
Even more surprising, Shea’s analysis identified hundreds of basic flakes made from the oldest, easiest Stone Age technology of striking a rock that the toolmaker balances on a stone anvil. These tiny, sharp flakes may have served almost like disposable cutlery – handy implements that could be grabbed for a variety of purposes and tossed aside when no longer needed, Stutz says.
It is not yet known if the few fragments of human bones found at Mughr el-Hamamah have left enough intact fragments of DNA for any genetic analysis. But the diverse tool technologies, in use throughout the occupation period of the cave, support the theory of hunter-gatherer populations starting to band together in larger, more interconnected social networks.
As humans began to dominate the landscape, the researchers theorize, they reached a population density threshold for living in larger groups and gained access to a range of technologies. That process may have helped tip the balance for the rise of modern human culture and the disappearance of the Neanderthals.
“Our findings positively show that the cultural changes associated with Neanderthal extinction in the Near East and wider western Eurasia really are more complex than many leading researchers have assumed,” Stutz says. “Instead of looking for a smoking-gun technology or climatic fluctuation or volcanic eruption, it’s clear we need to look at interconnected behavioral, population and ecological processes. That approach might reveal more clearly the similarities, as well as differences, between our mainly African, and slightly Neanderthal, biological inheritance.”
Reference:
Early Upper Paleolithic chronology in the Levant: new ABOx-SC accelerator mass spectrometry results from the Mughr el-Hamamah Site, Jordan. DOI:10.1016/j.jhevol.2015.04.008
Note: The above story is based on materials provided by Emory Health Sciences. The original article was written by Carol Clark.
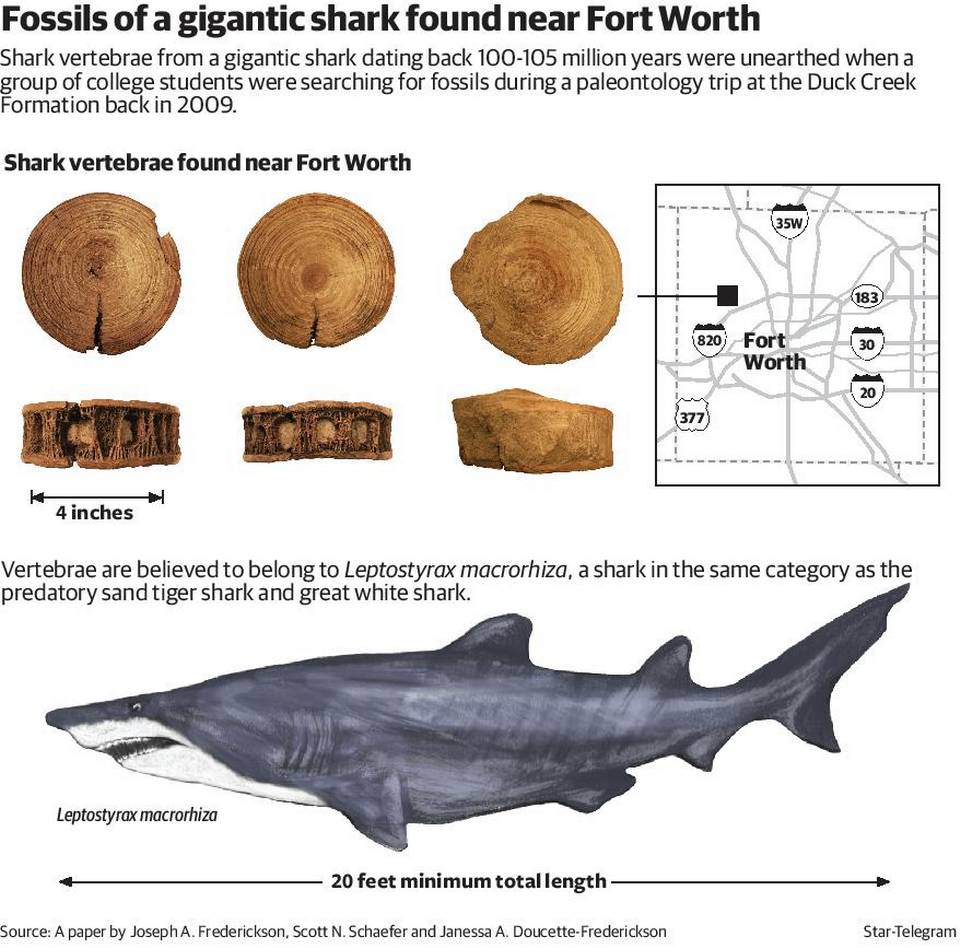
Paleontologists literally stumbled upon fossils just outside Fort Worth that were vertebrae of a monster shark that trolled the shallow seas that covered Texas a hundred millennia ago.
A group of college students was searching for fossils in 2009 during a paleontology trip to the Duck Creek Formation, hoping to bring home some pieces to display.
Walking along a section of the formation with exposed limestone, Joseph Frederickson’s wife, Janessa Doucette-Frederickson, tripped over a boulder and noticed a fossil.
“We dig it out and realize it was a unique fossil,” Joseph Frederickson told the Fort Worth Star-Telegram. “None of us had seen anything of this size before – we ended up digging up three total fossils.”
The fossils are vertebrae that belonged to a shark at least 20 feet long, dating from 100 million to 105 million years ago. In comparison, present-day great white sharks average 15 feet long.
The Duck Creek Formation, home to Cretaceous Period fossils, is just west of Fort Worth and extends all the way to Oklahoma. Frederickson and his wife are now graduate students at the University of Oklahoma.
Last week, the couple and their colleague Scott Schaefer published their findings, “A Gigantic Shark From the Lower Cretaceous Duck Creek Formation of Texas,” in the scientific journal PLOS One.
While the paleontologists were studying the vertebrae, they learned of other large shark fossils found in Kansas dating from the same period. That shark would have been 27 feet long.
“They would have been living alongside each other,” Frederickson said. “The impressive thing about this is that we have this gigantic shark – over 20 feet – that’s as large as the largest documented great white.”
The finding changes the way people view sharks of that era.
“We didn’t even know there were sharks this large that could have been dominant predators,” Frederickson said. ” … These sharks kind of paved the way for other gigantic species.”
Scientists previously thought that Cretaceous sharks were really small.
“Now we know that they weren’t,” he said.
Frederickson, now a doctoral student in ecology and evolutionary biology at OU, is moving the study forward by looking into the ontogeny of the shark – how it developed.
“Was it quick? Or did it live 100 years and do it really slowly?”
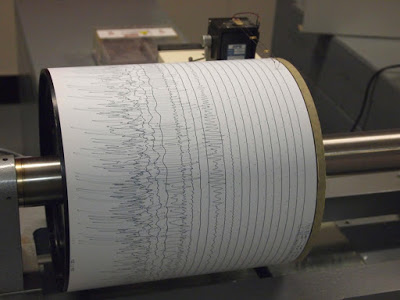
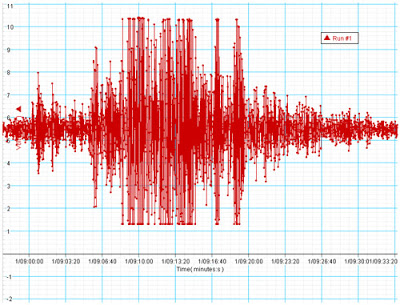
Seismogram being recorded by a seismograph at the Weston Observatory in Massachusetts, USA. Credit: Wikipedia
Water injected into an inactive fault can cause aseismic slip along the fault — movement without detectable earthquakes — that may then indirectly lead to micro-earthquakes. That’s the result from a controlled experiment by Yves Guglielmi and colleagues, who observed these events in real time after injecting fluid into a natural fault near an underground experimental facility in southeastern France.
Researchers are intensely interested in this type of induced seismicity, especially with a rise in earthquakes caused by injections of wastewater from gas and oil exploration. The experiment by Guglielmi and colleagues offers a better look at how friction in fluid-filled faults contributes to slip along the fault. In this case, the injected water caused very slow, four-micrometers-per-second aseismic creep on the fault before transitioning to a faster, 10-micrometers-per-second seismic slip and a series of tiny earthquakes. As Francois Cornet notes in a related Perspective article, experiments like this could guide monitoring at injection sites by potentially keeping the injection flow rate at a level that maintains aseismic slip rather than triggering earthquakes.
Reference:
“Seismicity triggered by fluid injection-induced aseismic slip,” by Y. Guglielmi; P. Henry at University of Aix-Marseille in Aix-en-Provence, France; Y. Guglielmi; P. Henry at CNRS in Aix-en-Provence, France; Y. Guglielmi; P. Henry at Institut de recherche pour le développement (IRD) in Aix-en-Provence, France; F. Cappa at University of Nice Sophia-Antipolis in Sophia-Antipolis, France; F. Cappa at CNRS in Sophia-Antipolis, France; F. Cappa at Institut de recherche pour le développement (IRD) in Sophia-Antipolis, France; F. Cappa at Côte d’Azur Observatory in Sophia-Antipolis, France; F. Cappa; J.-P. Avouac at California Institute of Technology in Pasadena, CA; D. Elsworth at Pennsylvania State University in University Park, PA; J.-P. Avouac at University of Cambridge in Cambridge, UK. DOI: 10.1126/science.aab0476
Researchers injected water into a geological fault in France to understand how fluids affect seismic activity. Credit: Yves Guglielmi/Institut Pythéas
Injecting water into a geological fault causes the rock to move harmlessly for a short time before it slips enough to produce an earthquake, a study shows. The discovery suggests that energy companies might be able to control the start of the earthquakes that they sometimes trigger as they inject fluids into the ground during oil, gas or geothermal exploration.
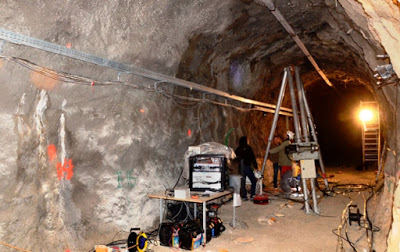
To test how fluid injections affect seismic activity, geologists squirted water 282 metres deep into rocks at an underground laboratory in southeastern France. They measured, more carefully than ever before, exactly how the ground shifted as the fluid coursed through it.
For the first several minutes, the ground moved quietly, with no earthquakes. “Only after a while do you see some seismicity occurring,” says team leader Yves Guglielmi, a geologist at the University of Aix-Marseille in France, whose findings are published in Science.
Pumping fluid into the ground can trigger earthquakes by unclamping the stresses that hold the sides of a geological fault together. The extra fluid relieves those stresses and allows the rock to shift.
Researchers have understood the basics of this phenomenon since the late 1960s and early 1970s, when the US Geological Survey counted the earthquakes set off as operators injected fluids down an industrial well. But Guglielmi’s team went further by carefully controlling and measuring the whole process from start to finish.
Slip and slide
The researchers developed a cylindrical probe that can record precisely how a fault moves in all three dimensions, while monitoring fluid pressure. They lowered the instrument into a borehole that penetrates a fault in limestone rocks at the Low-Noise Underground Laboratory in Rustrel, France.
Over a half an hour, the scientists injected a total of 950 litres of water into the fault, at rates comparable to industrial injections. During the first part of the test injection, the rocks crept along without generating any earthquakes. Then they began to move faster, and small earthquakes began to break out. By the time the researchers turned off the water, one rock face in the fault had moved a little more than 1 millimetre past the other. “The experiment is quite tiny,” says Guglielmi.
If operators of commercial wells can monitor their equipment as carefully as the research team did, they might be able to control how much the ground slips by adjusting the rate of fluid injection, says François Cornet, a geophysicist at the University of Strasbourg in France. In 2009, a geothermal project in Basel, Switzerland, was shut down because of the risk of triggering earthquakes. In Oklahoma, oil and gas operators are facing a huge public backlash because of a rash of small earthquakes that have been rattling the region, almost certainly linked to wells that inject waste water deep into the underlying rocks.
Cornet warns that the discovery applies to only one particular hole, and that it might not hold up in areas with different geology. Still, in 1993, he and his colleagues injected large amounts of water down a geothermal well in northeastern France, and measured what could have been the same sort of non-earthquake slip as pressure built up along the fault.
Guglielmi says that his team has already run tests at a second borehole drilled into shale, with similar results.
Note : The above story is based on materials provided by Nature. The original article was written by Alexandra Witze.
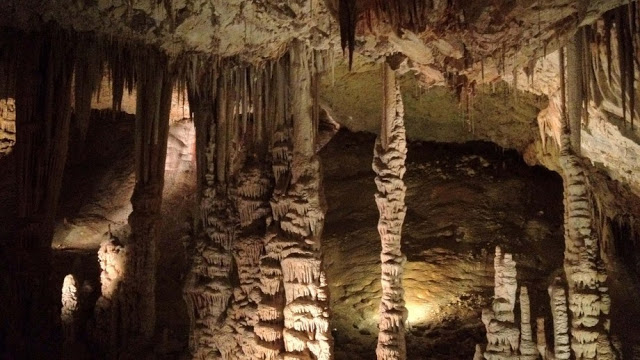
Speleotherms from Soreq Cave. Credit: Eelco Rohling
An international team of scientists has found a dramatic ice sheet collapse at the end of the ice age before last caused widespread climate changes and led to a peak in the sea level well above its present height.
The team found the events 135,000 years ago caused the planet to warm in a different way to the end of the most recent ice age about 20,000 to 10,000 years ago.
The findings will help scientists understand the processes that control Earth’s dramatic climate changes, said the leader of the study, Dr Gianluca Marino of the Research School of Earth Sciences.
“We knew the sea level had overshot its present levels during the last interglacial period, but did not know why. Now we for the first time can explain the processes that caused the sea levels to exceed the present levels,” said Dr Marino.
“Ice-age cycles may superficially look similar to one another, but there are important differences in the relationships between melting of continental ice sheets and global climate changes.”
The team, which includes researchers from ANU as well as the Universities of Southampton and Swansea in the UK, has published their findings in Nature.
At the end of an ice age the continental ice sheets, ocean, and atmosphere change rapidly. Scientists have previously only been able to reconstruct in detail the changes at the end of the last ice age.
“We have compared the fluctuations at the end of an earlier ice age, and we found that the patterns were different,” said co-author Professor Eelco Rohling, from both ANU and the University of Southampton.
“At the end of the older ice age, 135,000 years ago, we found that a dramatic collapse of the Northern Hemisphere ice sheets into the North Atlantic Ocean suppressed the ocean circulation and caused cooling in the North Atlantic.”
“North Atlantic cooling was counterbalanced by Southern Ocean warming that then destabilised Antarctic land ice, causing a continuation of melting that eventually drove sea level rise to several meters above the present,” he said.
This is very different from the end of the last ice age, said Dr Marino.
“The northern hemisphere ice-sheet collapse and climate change did not occur at the same time, and that caused much less warming in Antarctica,” he said.
The team used precisely-dated cave records and marine sediments from the Mediterranean region to reconstruct the sequence of changes in all critical climate parameters.
Reference:
Bipolar seesaw control on last interglacial sea level, Nature, DOI: 10.1038/nature14499
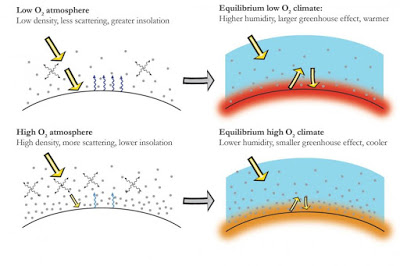
This is a schematic of the influence of oxygen concentrations on global climate. Credit: Chris Poulsen, University of Michigan
Variations in the amount of oxygen in Earth’s atmosphere significantly altered global climate throughout the planet’s history. Efforts to reconstruct past climates must include this previously overlooked factor, a new University of Michigan-led study concludes.
Oxygen currently comprises about 21 percent of Earth’s atmosphere by volume but has varied between 10 percent and 35 percent over the past 541 million years.
In periods when oxygen levels declined, the resulting drop in atmospheric density led to increased surface evaporation, which in turn led to precipitation increases and warmer temperatures, according to University of Michigan paleoclimatologist Christopher Poulsen.
“The connection between oxygen levels and climate has never been considered. It turns out that it’s an important factor over geological timescales,” said Poulsen, a professor in the Department of Earth and Environmental Sciences. While not as critical to climate as levels of heat-trapping carbon dioxide gas, oxygen plays a key role, he said.
“Oxygen concentration can help explain features in the paleoclimate record not accounted for by variations in carbon dioxide levels, and it must considered if we are to fully understand past climates,” Poulsen said. “However, variations in oxygen levels are not an important factor in present-day climate change.”
The study is scheduled for online publication in the journal Science on June 11.
Throughout Earth’s history, oxygen levels repeatedly rose and fell. Removing oxygen molecules thins the atmosphere, increasing the likelihood that incoming sunlight will make it to the surface without getting scattered away.
More sunlight means more evaporation from the surface, which leads to higher humidity levels and increased precipitation. As humidity levels rise, temperatures also increase because water vapor is a potent heat-trapping “greenhouse” gas.
Adding oxygen molecules has the opposite effect: a thicker atmosphere, more scattering of incoming sunlight, reduced surface evaporation, and less heat trapped by water vapor.
In their Science paper, Poulsen and two colleagues quantify the effect of changing oxygen levels on climate using an atmospheric global climate model to account for changes in atmospheric density, mass and molecular weights.
The team’s computer simulations focused on the mid-Cretaceous, a period characterized by high atmospheric carbon dioxide levels and the warmest conditions of the last 100 million years. Specifically, they focused on Cenomanian Age, from 100.5 million years ago to 93.9 million years ago.
They developed a series of simulations in which oxygen levels varied from a low of 5 percent to a high of 35 percent. They found that decreased oxygen levels led to substantial increases in global precipitation rates and temperature.
Changing oxygen concentrations could help explain features of the paleoclimate record not accounted for by variations in carbon dioxide levels, such as warm polar temperatures and unexpectedly high precipitation rates in some periods, the researchers conclude.
Though previously unappreciated for its influence on climate, changing atmospheric oxygen levels have long been recognized for shaping the course of life on Earth. Billions of years ago, for example, photosynthesizing cyanobacteria in the oceans released massive amounts of oxygen that eventually made it possible for animals to colonize the land.
Reference:
Christopher J. Poulsen, Clay Tabor, Joseph D. White. Long-term climate forcing by atmospheric oxygen concentrations. Science, 2015 DOI: 10.1126/science.1260670
Did dinosaurs roam the Grand Canyon? Well, the answer depends on whom you talk to. And how old they believe the majestic canyon to be.
Although it might be fun to imagine scientists and researchers arguing about whether giant reptiles were hanging around Arizona’s most famous landmark 65 million years ago, this isn’t a debate about dinosaur territories. It’s a question of when the deep walls of the Grand Canyon were eroded by the snaking Colorado River.
Recently two different groups published papers that suggested the Grand Canyon started forming more than 6 million years ago. One group said the canyon had eroded to nearly its current form by 70 million years ago, and another said it started eroding 17 million years ago. These papers have caused several groups to take a closer look at both old and new data sets – including researchers from Arizona State University.
“We are confident the western canyon is younger than 6 million years and is certainly younger than 18 million years,” said Andrew Darling, a graduate student in ASU’s School of Earth and Space Exploration. The research is published online June 10 in the journal Geosphere.
The problem with the assertion is that studying the age of the Grand Canyon isn’t easy.
Measuring time can be tricky when everything you’re studying is eroding away. And the whole region has been eroding for a long time, so not much is left of the landscape that was there when the Grand Canyon started forming. Yet, most people think the Grand Canyon is young – around 6 million years old based on what is preserved.
While many different detective methods exist to gauge the canyon’s age, Darling and his adviser, Kelin Whipple, a professor in ASU’s School of Earth and Space Exploration, decided to see whether the shape of the landscape could be used to infer the timing of canyon incision in a different way.
They analyzed the shape of the land and an understanding about how landforms change, plus comparisons to other thoroughly dated features in the region – like the Grand Wash Fault and the cliff-band along it.
As Darling put together computer analyses of the landscape, he and Whipple noticed the cliffs that make the edge of the Colorado Plateau (the Grand Wash Cliffs) look different than the cliffs that make the Grand Canyon. The Grand Canyon cliffs are steeper. Looking more closely, the tributary streams that pour into the Colorado River are also steeper than those in the Grand Wash Cliffs.
Many other researchers have shown the fault that formed the Grand Wash Cliffs experienced most of its movement in a long period of fault slip between 18 million and 12 million years ago. The west side of the fault has slipped downward a few kilometers, making a hole for sediment eroding from the Grand Wash Cliffs to pile into. As erosion occurs, steep cliffs become more gradual slopes and rivers flatten out over time. But the western Grand Canyon has steeper cliffs and steeper tributary rivers than those along the Grand Wash Cliffs.
“We think this means that the western Grand Canyon is younger and started eroding more recently and at a higher rate than the area of the Grand Wash Cliffs,” Darling explained.
In both landscapes, the amount of erosion measured vertically is about the same: but the time taken to do that erosion is different and hence the erosion rates are different.
Using this inference, they evaluated the three previous hypotheses for the age of incision of Western Grand Canyon: 70 million years ago, 17 million years ago or about 6 million years ago.
“Since the canyon seems to be younger than the fault slip, only the most recent 6-million-year-old incision idea is supported by the topographic and erosion rate data,” Darling said.
Which, if Darling is correct, means we have an answer to our question: “There’s no way dinosaurs overlapped with what we call the Grand Canyon.”
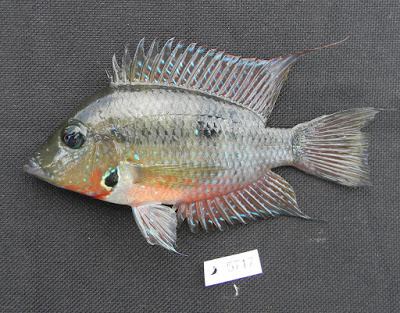
One of the cichlid fish from Guatemala, Thorichthys meeki, collected by LSU Curator of Ichthyology Prosanta Chakrabarty for the study that refuted the date in which the Isthmus of Panama was formed. Credit: Courtesy of Prosanta Chakrabarty, LSU
A long-standing fact widely accepted among the scientific community has been recently refuted, which now has major implications on our understanding of how Earth has evolved.
Until recently, most geologists had determined the land connecting North and South America, the Isthmus of Panama, had formed 3.5 million years ago. But new data shows that this geological event, which dramatically changed the world, occurred much earlier. In a comprehensive biological study, researchers have confirmed this new information by showing that plants and animals had been migrating between the continents nearly 30 million years earlier.
‘This means the best-dated geological event we ever had is wrong,’ said Prosanta Chakrabarty, LSU associate professor in the Department of Biological Sciences and Curator of Ichthyology at the LSU Museum of Natural Science. His research on the evolution of freshwater and marine organisms in Central America was part of the study with colleagues at the Smithsonian Tropical Research Institute, American Museum of Natural History and the University of Gothenburg, which included living and extinct mammals, birds, plants, fish and invertebrate animals published by the Proceedings of the National Academy of Sciences.
The researchers found large pulses of movement among these plants and animals between North and South America from 41 million, 23 million and eight million years ago. These coordinated spikes in migration imply that geological changes in Central America, such as landmass formation and new freshwater corridors, were aiding migration for many kinds of plants and animals.
‘Before, South America was thought of as an island with no communication until 3.5 million years, so the only way to explain such high biodiversity was to say that it accumulated extremely fast. Now, with a longer history, we know that processes and patterns took a lot of time to form,’ said Christine Bacon, lead author of the study and associate researcher at the University of Gothenburg. ‘Our results change our understanding of the biodiversity and climate, both at the regional and global levels.’
Even after the reported geological closure, geminate marine species, those close relatives found on opposite sides of the narrow isthmus, also provide evidence that this landmass between North and South America is more like a sponge where organisms can periodically pass rather than a solid barrier. The current expansion of the Panama Canal has yielded new fossils that have informed these observations.
‘Now we know that the closure of the Isthmus of Panama, which is supposed to be one of the biggest deals in geology, is just one part of a really complicated puzzle of how the continents came together,’ Chakrabarty said.
He and colleagues at LSU mapped the evolution of two major families of fishes in Central America — cichlids, which include many aquarium fish, and poeciliids, which include guppies and swordtails. They collected samples of fishes from every country in Central America and sequenced the DNA to determine the genetic relationship between species. Matching the skeletal structure of fish found in the fossil record, they calibrated the DNA-based evolutionary tree and determined the age of each species.
Because freshwater fish can only migrate when a new passage way opens to a river or lake, there must have been dry land with freshwater running through it, Chakrabarty said. Therefore, their arrival in Central America signifies early geological changes.
‘The cool thing is there are so many freshwater fish species that are essentially stuck in one place until the land changes, so they can tell us about the history of the Earth,’ he said.
The formation of the Isthmus of Panama had large-scale effects on the planet. It divided the Atlantic and Pacific oceans, thus changing sea levels and ocean currents. This affected global temperatures possibly causing periods of glaciation.
‘The geology of this whole region is so complicated, and it’s amazing to me that the biology can inform us of that,’ he said.
Chakrabarty has been conducting research on Central American freshwater fish for about 15 years. He has received more than $1 million in National Science Foundation funding for this work. He and his lab have collected fish species from every country in Central America and have expanded the specimen collection at LSU to South America, the Greater Antilles and much of Asia. He is currently researching the evolution and migration of freshwater fish between South America, Central America and the Greater Antilles that may have began 50 to 60 million years ago.
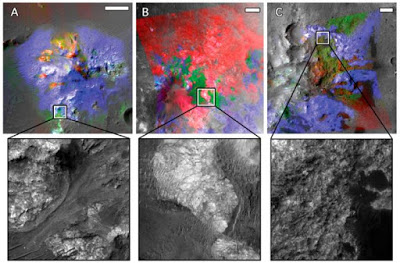
Compact Reconnaissance Imaging Spectrometer for Mars (CRISM) maps of modeled mineralogy (olivine in red; mafic glass in green; pyroxene in blue) projected over Context Camera (CTX) imagery. Credit: Geology (Geological Society of America) and Kevin M. Cannon and John F. Mustard, Brown University, Providence, Rhode Island, USA.
Quenched glasses formed by asteroid impacts can encapsulate and preserve biological material for millions of years on Earth, and can also serve as a substrate for microbial life. These impact glasses are thus an important target to search for signs of ancient life on Mars, but until now they have not been definitively detected on the martian surface.
In this study, Kevin Cannon and John Mustard used orbital remotely sensed data to investigate spectral signatures of geologic units on Mars that were formed during impacts (impactites).
Using spectral mixture modeling, they found that glass is in fact present in these units, mixed with other minerals like olivine and pyroxene. This modeling approach allows for the identification glass signatures that are not otherwise obvious when glass is present in a mixture.
The glass-rich impactites Cannon and Mustard have identified have been preserved on billion-year timescales, old enough to date back to more clement surface conditions on Mars. Their preservation is likely due to the current cold and dry surface environment; therefore, fossilization in glass, as proposed previously, seems to be a promising target to search for possible ancient martian biological activity.
Reference:
Preserved glass-rich impactites on Mars
Kevin M. Cannon and John F. Mustard, Brown University, Providence, Rhode Island, USA. Published online ahead of print on 5 June 2015; DOI: 10.1130/G36953.1
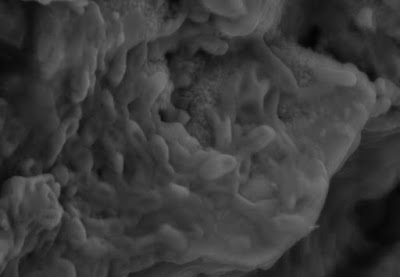
A zoom-in of potential red blood cells inside a fossil fragment that has been sliced open with a focused ion beam. Credit: Image courtesy of Imperial College London
Scientists have found remnants that have some similarities to red blood cells and collagen fibres in fragments of dinosaur fossils.
The team from Imperial College London have detected what look like soft tissue remnants in the fragments of 75 million year old dinosaur fossils even though the fossils are poorly preserved. Scientists have previously only found soft tissue in dinosaur fossils that have been exceptionally well preserved, which are very rare and far fewer in number.
The researchers suggest their study, published today in Nature Communications, may cause palaeontologists to rethink how fossils are preserved, and may be the first step towards a better understanding of the biology of dinosaurs and the relationships between different species.
In the study, the team analysed eight fossil fragments that have for more than a century been in the Natural History Museum’s Sternberg and Cutler collections.
The researchers examined part of a fossilised dinosaur claw and identified tiny structures that look ovoid and with an inner denser core. These could potentially be red blood cells although the researchers caution that further evidence would be needed to confirm that the structures do not have another origin. The hope is that if red blood cells can be found in fossilised dinosaur fragments, this could help scientists to understand when dinosaurs evolved a warm blooded, bird-like metabolism.
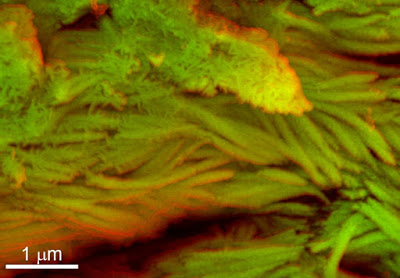
In one dinosaur fossil fragment, the team also found structures that looked fibrous and had a banded structure similar to the banding that can be seen in modern day collagen fibres. The structure of collagen varies between different animal groups, providing a type of fingerprint to link related creatures. Further evidence would be needed to definitively conclude that the structures found originate from a preservation of collagen. If verified, the identification of collagen-like structures could in the future provide a new independent line of evidence to show how various dinosaur groups are related to each other.
Study author Dr Sergio Bertazzo, a Junior Research Fellow from the Department of Materials at Imperial College London, said: “We still need to do more research to confirm what it is that we are imaging in these dinosaur bone fragments, but the ancient tissue structures we have analysed have some similarities to red blood cells and collagen fibres. If we can confirm that our initial observations are correct, then this could yield fresh insights into how these creatures once lived and evolved.”
Study author Dr Susannah Maidment, a Junior Research Fellow from the Department of Earth Science and Engineering at Imperial College London, added: “Our study is helping us to see that preserved soft tissue may be more widespread in dinosaur fossils than we originally thought. Although remnants of soft tissues have previously been discovered in rare, exceptionally preserved fossils, what is particularly exciting about our study is that we have discovered structures reminiscent of blood cells and collagen fibres in scrappy, poorly preserved fossils. This suggests that this sort of soft tissue preservation might be widespread in fossils. Early indications suggest that these poorly preserved fossils may be useful pieces in the dinosaur jigsaw puzzle to help us to understand in more detail how dinosaurs evolved into being warm blooded creatures, and how different dinosaur species were related.”
To carry out their study the team used a range of techniques. The first involved the use of a scanning electron microscopy device to observe the structure, composition and location of the soft tissue inside the dinosaur fossil fragments. The team then used a focused ion beam to slice into the samples and observe the internal structure of the fossils. They also examined the fossils using a transmission electron microscope to detect the fibrous structures.
Birds are the distant relatives of dinosaurs, so the researchers used an ion mass spectrometer device to compare their ancient soft tissue to a blood sample taken from an Emu. This enabled them to compare and contrast the samples and see that their fossils had some similarities in the organic signatures to the blood cells present in the emu blood sample.
The next step will see the team carrying out more research to confirm that the structures that they’ve observed are found in a wider range of fossil samples and also to understand how widespread this sort of soft tissue preservation might be in dinosaur fossils, how far back this type of preservation could go in the fossil records and the reasons why it may have occurred.
Reference:
Sergio Bertazzo, Susannah C. R. Maidment, Charalambos Kallepitis, Sarah Fearn, Molly M. Stevens and Hai-nan Xie. Fibres and cellular structures preserved in 75-million–year-old dinosaur specimens. Nature Communications, 2015 DOI: 10.1038/ncomms8352
Undated picture released by the journal Nature on June 5, 2015 shows density-dependent colour scanning electron micrographs of samples extracted from ribs of an indeterminate dinosaur, displaying mineralized fibres
Scientists said Tuesday they have discovered what appear to be red blood cells and collagen fibres in dinosaur bones, a find that may boost prospects of prising organic remains from a much wider range of fossils.
Using molecular microscopy, a British team analysed eight bone fragments from dinosaurs that lived some 75 million years ago, in the Cretaceous period.
The fossils were so poorly conserved that it was impossible to tell precisely what type of animal some of them came from, study co-author Sergio Bertazzo from Imperial College London told AFP.
The samples included the claw of a meat-eating dinosaur, a few toe bones from a ceratopsid (a group that included the horned Triceratops) and a duck-billed hadrosaur, and rib fragments from an unknown species.
All the bones are from the Dinosaur Park Formation in Alberta, Canada, and have been in the Natural History Museum in London since they were collected about 100 years ago.
“What we found are structures that could be original red blood cells from the dinosaur specimens and also other structures that could be the original collagen fibres,” Bertazzo said by email.
Other researchers have previously found remnants of organic material in dinosaur bones, but in exceptionally well-preserved fossils—which are few and far between.
“Therefore we indicate that the likelihood of finding organic material in fossils is much higher than previously thought, at least at the microscopic scale,” said Bertazzo.
It had long been thought that protein molecules cannot survive for longer than four million years.
Bertazzo and a team used a special microscope which uses a beam of heavy atoms to make infinitely small cuts in a sample at the nanometric scale (a nanometre is a billionth of a metre).
“The same microscope also has a robotic arm with a micro needle that can be used to pick up and move things inside the microscope,” explained Bertazzo.
“So, combining the beam and the needle, we could cut small bits of the fossils and perform an analysis to check for any fragment of amino acids.”
The team had set out to analyse gaps left in bone by decomposed organic material, instead finding structures that appear to be red blood cells, and fibres similar to collagen, a protein which makes up the bulk of connective tissues in animals.
‘Blown away’
“Totally blown away!” is how Bertazzo described the team’s breakthrough, while cautioning that further evidence is needed to confirm the nature of the structures.
“This was absolutely not what we were expecting to find at all. It actually took quite a while for us to be convinced of what we saw.”
The team compared their ancient soft tissue to an Emu blood sample, and intriguingly found “similarities”.
Dinosaurs are distant ancestors of modern-day birds, and scientists are hoping this type of research will reveal how, and when, a cold-blooded lizard gave rise to warm-blooded birds with a fast metabolism.
In vertebrate animals, the smaller the blood cell, the higher the metabolic rate, said Bertazzo.
“If we can find blood cells in lots of different dinosaurs, the range in size might provide an independent line of evidence for when dinosaurs became warm-blooded,” he said.
The main breakthrough of the research is to show that this type of soft tissue preservation is likely much more common than once thought, and Bertazzo said he “cannot even begin to speculate about what can be found in future.”
As for the possibility of one day discovering DNA, however, “many more studies should be done before we are even able to say if it is possible or not”.
Video
Scanning electron micrographs and 3D reconstructions from
serial sections of erythrocyte-like structures. Credit: Bertazzo et al., Nature Communications
Note : The above story is based on materials provided by AFP.
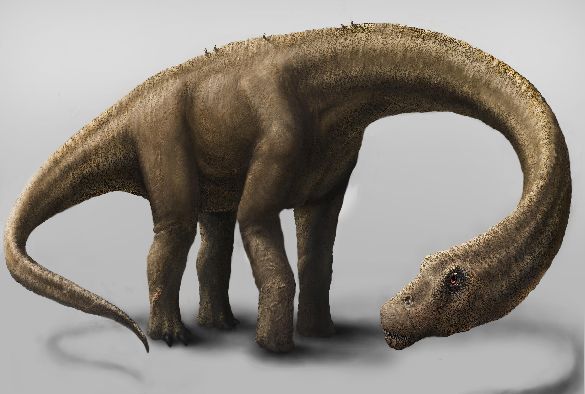
An artist’s rendering of the dinosaur Dreadnoughtus. Credit: Jennifer Hall
Scientists at the University of Liverpool have shown that the most complete giant sauropod dinosaur skeleton, Dreadnoughtus, discovered by palaeontologists in South America in 2014, was not as large as previously thought.
Found in Patagonia, the huge fossil had almost all of the major bones intact, allowing scientists to confidently estimate its overall size – measuring in at 26 metres long.
Preserved in rock, it is thought that the animal was close to maturity but not fully grown when it died, and may have grown to be even larger. The long-necked, plant-eating dinosaur was the biggest to ever walk the earth.
Colossal 60 tonnes
To estimate the mass of Dreadnoughtus scientists originally used a scaling equation that predicts body mass based on the size of thigh and arm bones. This method produced a range of estimates with the average being a colossal 60 tonnes.
Scientists at the University of Liverpool, in collaboration with researchers from Liverpool John Moores University, the University of Manchester, and Imperial College, re-evaluated this estimate after it became clear that other sauropod dinosaurs, only marginally smaller than the giant, weighed considerably less than 60 tonnes.
The team used a three-dimensional skeletal modelling technique to examine body mass more directly. This method involves mathematically reconstructing a ’skin’ volume around bones of Dreadnoughtus on a computer and then expanding that skin outline to account for muscle, fat and other tissues.
The size of expanded skin outline is based on similar data from living animals. By exploring a range of expansions the team could more accurately predict how heavy Dreadnoughtus could realistically have been.
Digital modelling
The team found that the mass of the Dreadnoughtus was more likely to be between 30 and 40 tonnes, considerably less than originally thought.
Dr Karl Bates, from the University’s Institute of Ageing and Chronic Disease, explains: “Estimating the body mass of an extinct animal from approximately 77 million years ago of this size from only its fossilised bones is extremely challenging and relies on the availability of certain data from living animals and modelling techniques.
“The original method used to calculate the mass of the animal is a common one and has been used successfully on many specimens. The highest estimates produced for this particular giant, however, didn’t quite match up.
“Using digital modelling and a dataset that took in species, alive and dead, we were able to see that the creature couldn’t be as large as originally estimated.”
“Our analysis suggests that only the lower estimates produced by previous methods are plausible. Estimates of 60 tonnes and above do not fit with our current understanding of the mass characteristics of living land animals.”
It is unclear how accurate previous predictions on the scale of these creatures have been, but future studies of living animals and developments in modelling techniques could help build a more fulsome picture of the size and lifestyles of the dinosaurs.
The research is published in the Royal Society journal Biology Letters.
Reference:
Karl T. Bates, Peter L. Falkingham, Sophie Macaulay, Charlotte Brassey, Susannah C. R. Maidment. Downsizing a giant: re-evaluating Dreadnoughtus body mass. DOI: 10.1098/rsbl.2015.0215
The discovery of a new fundamental rock property will improve estimates of underground resources, such as hydrocarbons and drinking water, as well as CO₂ storage reservoir capacity.
The revelation that electricity can flow more easily through sedimentary rocks in the vertical, rather than horizontal, direction is contrary to established scientific wisdom. This finding will improve the interpretation of geological fluid flow from geophysical surveys.
Fluids and electrical currents can flow through sedimentary rock via a network of gaps in between the sediment grains, called pores. Because gravity applies a vertical force, when sediments are compacted into sandstone the horizontal pathways in the pore network become more compressed and contorted than their vertical counterparts. These differences mean that it is easier for fluids and electrical current to flow through the less contorted and compressed vertical pathways. Prior to this study it was thought the horizontal layering of sediments and the horizontal alignment of sedimentary grains would cause electricity to flow more easily in the horizontal direction.
This discovery, made by scientists at the National Oceanography Centre (NOC), was published in the journal Geophysical Prospecting in November. Earlier this week this study was awarded the EAGE’s Loránd Eötvös prize for the ‘best research paper in 2014’ due to its ground breaking nature.
Lead author, Laurence North from the NOC, explained “It was the development of world leading technology at the NOC that allowed us to make this discovery. There have been a number of studies that showed similar effects, yet scientists dismissed their own findings as experimental error. However, because the unique electrical resistivity measurement system and processing software that I developed at the NOC is so accurate, I knew that the data must be the result of a ‘real’ rock property. Explaining the result, however, took a real lightbulb moment”.
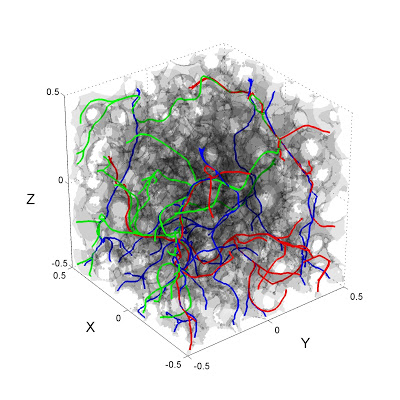
Co-author Angus Best, Head of Marine Geoscience at the NOC, added “because this is the discovery of a fundamental rock property, it will be extremely useful for sub-seafloor fluid flow research in general, as well as for commercial applications.
We are very pleased to receive this prestigious award from the European Association of Geoscientists and Engineers, which gives wider recognition of the world-leading rock physics research we have been conducting at the NOC.
We are already using the results and related novel technology to advance sub-seafloor fluid flow studies of Arctic methane hydrate dissociation and geological CO₂ storage, as well as engaging with hydrocarbon industry partners.”
Seismologists studying the recent dramatic upswing in earthquakes triggered by human activity want to clear up a few common misconceptions about the trend.
There is increasing evidence that these earthquakes are caused by injecting fluids from oil and gas operations deep into the earth. These human-caused earthquakes are sometimes called “induced earthquakes.”
A Seismological Research Letters focus section to be published online June 10 addresses some common misconceptions about induced seismicity—the biggest of which is that it is primarily related to oil and gas recovery by hydraulic fracturing or “fracking.” The focus section will appear in the July/August print issue.
Guest editor Justin Rubinstein, a scientist with the U.S. Geological Survey, explains that most of the induced earthquakes felt in the United States are from the disposal of large amounts of wastewater from oil and gas production. The majority of this wastewater is ancient ocean brine that was trapped in rock layers along with gas and oil deposits. Only a small percentage of induced seismicity comes from fracking processes that inject liquid into the ground to break up rock layers to free oil and gas for recovery.
Wastewater disposal from oil and gas operations has increased in the U.S. in the past decade, especially in states like Oklahoma where the amount of wastewater disposal doubled between 1999 and 2013.
“Wastewater disposal is expanding and waste fluids are being injected into new locations. There have been changes in production practices as well, so in some areas there is much more wastewater that needs to be disposed,” Rubinstein noted.
Not all fluid injection causes earthquakes that can be detected or felt, Rubinstein added. Only a few dozen of the tens of thousands of wastewater disposal, enhanced oil recovery and hydraulic fracture wells in the U.S. have been linked to induced earthquakes that can be felt.
The central United States has experienced a surge in seismicity in the past six years, rising from an average of 24 earthquakes magnitude 3.0 or larger per year between 1973 and 2008 to an average of 193 earthquakes of this size every year between 2009 and 2014, with 688 occurring in 2014 alone.
Researchers are also tracking induced earthquakes in Canada, and the current batch of studies suggests that fracking might be more significant than wastewater disposal for causing earthquakes in that country, according to focus section co-editor David Eaton of the University of Calgary.
“There appear to be interregional differences between the U.S. and Canada,” he noted, “but it’s too early to say yet whether those reflect operational differences in the geological site conditions, or if it simply reflects the focus of studies that have been completed to date.”
As research continues in both countries, experts are recommending a more proactive approach to the risks of induced seismicity. A focus section article by Randi Jean Walters and colleagues at Stanford University outlines a possible workflow to reduce pre and post-injection risks at oil and gas sites. The workflow would incorporate seismic monitoring, a thorough understanding of a region’s past and present geology and detailed information on the industrial methods used in an oil and gas operation. Perhaps most important, they write, an ongoing risk assessment would take into account what sorts of resources—from buildings to natural settings—would be affected by seismic activity, and what kinds of seismic activity the surrounding population is willing to tolerate.
Another focus section paper by James Dieterich and colleagues at the University of California, Riverside explores the mechanics of induced seismicity. Their study uses an earthquake simulation program called RSQSim to explore how simple faults with various levels of pre-existing stress respond to fluid injection. Their model is able to reproduce many of the observed characteristics of induced seismicity and relate them to physical quantities such as injection duration and injected volumes. If the simulator can model more complex situations in future trials, it may offer guidance on managing the seismic risks at injection sites and estimating the probabilities of inducing earthquakes.
Other articles in the issue investigate characteristics of induced earthquakes that have been proposed to be different in natural and induced earthquakes, including their ground shaking and faulting styles.