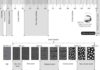
Southern part of the Barberton Greenstone Belt, South Africa, shows mafic/ultramafic volcanics and cherts of the Kromberg Formation, Onverwacht Group, in the foreground and to the right, looking SSW toward the reddish-colored sediments of the Fig Tree and Moodies Groups at the Swaziland border. See the open-access article by Frances Westall et al. Credit: Westall et al., Geology, 2015.
The modern sedimentary environment contains a diversity of microbes that interact very closely with the sediments, sometimes to such an extent that they form “biosediments.” But can such a phenomenon be fossilized? How far back in time can “biosedimentation” be traced? In this study for Geology, Frances Westall and colleagues examine some of the oldest rocks on Earth — in the Barberton Greenstone Belt, South Africa (older than 3.3 billion years), to answer this question.
Westall and colleagues use multi-scale methods to document the simultaneous presence of diverse types of microorganisms, including phototrophs and chemotrophs, directly interacting with coastal volcanic sediments that were bathed by hydrothermal fluids. They note that the hydrothermal fluids acted as a major nutrient source for the chemotrophic microbial communities and thus strongly controlled their development and distribution, while distribution of the photosynthetic biofilms was, of course, controlled by access to sunlight.
The silica-rich hydrothermal fluids also contributed to the rapid fossilization of the microbes and lithification of the sediments, fixing the diversity of microbial life and their interactions with the sediments for posterity. Westall and colleagues thus show that intricate microbe-sediment systems are deep-rooted in time and that at least some early life may indeed have been thermophilic.
Reference:
Archean (3.33 Ga) microbe-sediment systems were diverse and flourished in a hydrothermal context
Frances Westall et al., Centre de Biophysique Moléculaire (CBM), Centre National de la Recherche Scientifique (CNRS), Orléans, France. Published online ahead of print on 26 May 2015; DOI: 10.1130/G36646.1. This article is OPEN ACCESS online.
Earthquakes kill, but their aftershocks can cause the rapid collapse of buildings left standing in the aftermath of the initial quake. Research published in the International Journal of Reliability and Safety offers a new approach to predicting which buildings might be most susceptible to potentially devastating collapse due to the ground-shaking aftershock tremors.
Negar Nazari and John W. van de Lindt of the Department of Civil and Environmental Engineering, at Colorado State University in Fort Collins and Yue Li of Michigan Technological University, in Houghton, USA, point out that it is relatively obvious that buildings that survive a main shock will be at varying degrees of risk of collapse as aftershocks travel through the earthquake zone. Aftershocks are usually several orders of magnitude less intense than the primary earthquake, but can nevertheless have high ground motion intensity, last longer and occur at different vibration frequencies. In addition, changes in the structure of a building and its foundations, whether crippling or not, mean that the different energy content of the ground acceleration can during an aftershock further complicates any analysis. This adds up to a very difficult risk assessment for surviving buildings.
In order to compute the risk of collapse, the probability, for building damaged by a main shock, the team has introduced a logical method based on two key earthquake variables: magnitude and site-to-source distance. They have carried out tests using different site-to-source distances with an incremental dynamic analysis based on simulated ground motions caused by the main shock and aftershocks and applied this to a computer modeled, two-storey, timber-frame building in a hypothetical town in California relatively close to a geological fault line, as a proof of principle. Full-scale structural data was available from an actual building.
The team found that collapse probability increased if there were a sequence of aftershocks following a main shock just 10 kilometers distant from the building. Stronger aftershocks mean greater risk that correlates with the actual magnitude of the shock. As one might also expect if the site-to-source distance is greater, risk is lower. Overall, however, the analysis allows the team to quantify this risk based on the two variables, distance and aftershock magnitude.
Reference:
Nazari, N., van de Lindt, J.W. and Li, Y. (2014) ‘Effect of aftershock intensity on seismic collapse fragilities’, Int. J. Reliability and Safety, Vol. 8, Nos. 2/3/4, pp.174-195. DOI: 10.1504/IJRS.2014.069526
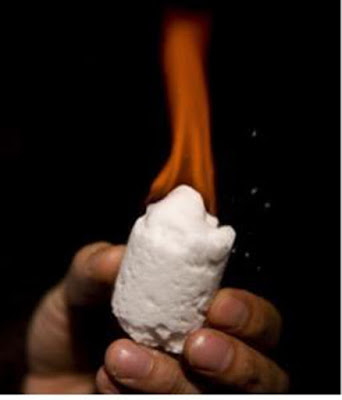
Set-up as part of the Syracuse University Lava Project, this cook-off was a collaboration with experimental UK chef Sam Bompas and the Syracuse University earth sciences team, who have created a car-sized, man-made volcano that melts rock down into lava in around 70 hours.
The researchers use these synthetic lava flows to learn more about the morphology and behaviour of molten rock, but in July last year they decided to team up with Bompas to see if they could create the hottest barbeque in the world. The result? A grill that reached just over 1,000 degrees Celsius (2,000 Fahrenheit) – more than double the maximum temperature of average ovens.
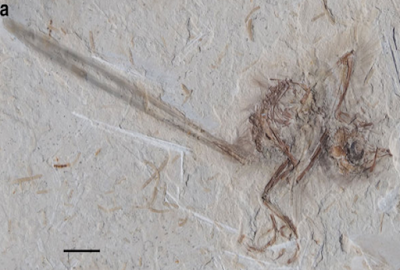
This is a feather under reflected and matrix fluoresced illumination. (A) Reflected light microscopy, with only barbs visible. (B) Polarized light, some traces of barbules. (C) A laser-stimulated fluorescence of matrix behind carbon film backlights the feather and renders the barbules visible across the entire field of view. Credit: KU News Service/University of Kansas
A team of scientists based largely at the University of Kansas and the Burke Museum of Natural History and Culture in Washington has developed methods of using commercial-grade laser equipment to find and analyze fossils of dinosaurs. Their techniques are introduced via a paper in the journal PLOS ONE today.
The new laser method causes fossil samples to fluoresce, revealing complex details unseen with traditional visual enhancers like ultraviolet light.
“Nobody else is doing this, as far as I know,” said David Burnham, preparator at KU’s Biodiversity Institute & Natural History Museum and a co-author on the paper. “Basically you want to excite electrons in the object so it emits photons you can see. This requires a camera filter of some kind, and that’s where an orange or yellow long-pass filter is used — it takes away everything else so we can see the photons.”
The authors first used lasers a few years ago during examination of a Microraptor specimen from China, when they noticed a second fossil in the surrounding material.
“We had a mystery fossil on the same piece,” Burnham said.
The KU researchers contacted Thomas Kaye of the Burke Museum for help identifying it. “We sent him the specimen, and he came up with this laser technique,” Burnham said.
Since then, the researchers have worked to fine-tune the laser-identification process, often using lasers on samples from Jehol Biota, a “mother lode” of 27-million-year-old fossils unearthed in the Chinese province of Liaoning.
“There have been many dinosaurs with feathers and scales that nobody has seen before because of this locality in China, where volcanic ash has preserved fossils much like in Pompeii,” Burnham said. “Tissues are preserved — not just the bones. With things like feathers, we can see details really well using lasers. If the fossils themselves won’t fluoresce, the background will. We can see if a primitive feather looks like a modern feather.”
Because high-end technology has become less expensive, the researchers have been able to buy medium-power short wavelength lasers on websites like eBay and experiment with digital photographic equipment and filters. Thus, they’ve developed novel uses for lasers, such as backlighting opaque specimens to reveal detail and even finding new fossils hidden within rocks or dirt.
“We’re finding that a blue hand-held laser is easiest to use — it’s sold by a company called Dragon Laser,” Burnham said. “You can buy them at different wavelengths and energy levels — you just have to be really careful to wear protective glasses.”
In the PLOS ONE paper, the researchers give examples of using lasers in various ways: silhouette illumination of carbon fibers, such as the feathers of a primitive bird; microscopic imaging of specimens fluorescing beneath the specimen surface to capture details; and in-situ analysis with minimal invasiveness, where the team analyzed the arm bracelet on the skeleton of a small girl from the mid-Holocene without removing or disturbing it, finding it was fashioned from a hippopotamus tooth.
Indeed, the researchers have even developed a proof-of-concept automated fossil sorter that employs a laser beam to pick microfossils from surrounding rocks and dirt.
“The reason we collect microfossils is to find tiny little teeth and they preserve well because they’re enamel — the hardest substance body produces,” Burnham said. “You walk around, find fossils, take burlap sack and fill it with dirt, or matrix. Before, we’d bring it back to museum and go through it with a magnifying glass, separating things by hand, one by one — mostly getting rocks. To speed this up, now we have a machine that emits laser light and pops out the teeth.”
Beyond these applications, the KU researcher said that lasers would allow paleontologists to spot phony fossils, or specimens cobbled together from many fossils and passed off as whole. This is because bones from different places or times would emit dissimilar fluorescence once exposed to laser light.
“It allows us to detect fakes,” Burnham said. “It’s been going on ever since man has been around. People are trying to make the specimen look better or more intact. Museums want pretty things, so people doctor these up to make them look better. People do it fraudulently because they’re easier to sell when you make something more complete. Some artists are so good you can’t tell where the real thing stops and the fake thing begins. With lasers, now we’ll know.”
Reference:
Thomas G. Kaye, Amanda R. Falk, Michael Pittman, Paul C. Sereno, Larry D. Martin, David A. Burnham, Enpu Gong, Xing Xu, Yinan Wang. Laser-Stimulated Fluorescence in Paleontology. PLOS ONE, 27 May 2015 DOI: 10.1371/journal.pone.0125923
Casts of the jaws of Australopithecus deyiremeda, a new human ancestor species from Ethiopia, held by principal investigator and lead author Dr. Yohannes Haile-Selassie of The Cleveland Museum of Natural History. Photo credit: Laura Dempsey Credit: Cleveland Museum of Natural History
A new relative joins “Lucy” on the human family tree. An international team of scientists, led by Dr. Yohannes Haile-Selassie of The Cleveland Museum of Natural History, has discovered a 3.3 to 3.5 million-year-old new human ancestor species. Upper and lower jaw fossils recovered from the Woranso-Mille area of the Afar region of Ethiopia have been assigned to the new species Australopithecus deyiremeda. This hominin lived alongside the famous “Lucy’s” species, Australopithecus afarensis. The species will be described in the May 28, 2015 issue of the international scientific journal Nature.
Lucy’s species lived from 2.9 million years ago to 3.8 million years ago, overlapping in time with the new species Australopithecus deyiremeda. The new species is the most conclusive evidence for the contemporaneous presence of more than one closely related early human ancestor species prior to 3 million years ago. The species name “deyiremeda” (day-ihreme-dah) means “close relative” in the language spoken by the Afar people.
Australopithecus deyiremeda differs from Lucy’s species in terms of the shape and size of its thick-enameled teeth and the robust architecture of its lower jaws. The anterior teeth are also relatively small indicating that it probably had a different diet.
“The new species is yet another confirmation that Lucy’s species, Australopithecus afarensis, was not the only potential human ancestor species that roamed in what is now the Afar region of Ethiopia during the middle Pliocene,” said lead author and Woranso-Mille project team leader Dr. Yohannes Haile-Selassie, curator of physical anthropology at The Cleveland Museum of Natural History. “Current fossil evidence from the Woranso-Mille study area clearly shows that there were at least two, if not three, early human species living at the same time and in close geographic proximity.”
“The age of the new fossils is very well constrained by the regional geology, radiometric dating, and new paleomagnetic data,” said co-author Dr. Beverly Saylor of Case Western Reserve University. The combined evidence from radiometric, paleomagnetic, and depositional rate analyses yields estimated minimum and maximum ages of 3.3 and 3.5 million years.
“This new species from Ethiopia takes the ongoing debate on early hominin diversity to another level,” said Haile-Selassie. “Some of our colleagues are going to be skeptical about this new species, which is not unusual. However, I think it is time that we look into the earlier phases of our evolution with an open mind and carefully examine the currently available fossil evidence rather than immediately dismissing the fossils that do not fit our long-held hypotheses,” said Haile-Selassie.
Scientists have long argued that there was only one pre-human species at any given time between 3 and 4 million years ago, subsequently giving rise to another new species through time. This was what the fossil record appeared to indicate until the end of the 20th century. However, the naming of Australopithecus bahrelghazali from Chad and Kenyanthropus platyops from Kenya, both from the same time period as Lucy’s species, challenged this long-held idea. Although a number of researchers were skeptical about the validity of these species, the announcement by Haile-Selassie of the 3.4 million-year-old Burtele partial foot in 2012 cleared some of the skepticism on the likelihood of multiple early hominin species in the 3 to 4 million-year range.
The Burtele partial fossil foot did not belong to a member of Lucy’s species. However, despite the similarity in geological age and close geographic proximity, the researchers have not assigned the partial foot to the new species due to lack of clear association. Regardless, the new species Australopithecus deyiremeda incontrovertibly confirms that multiple species did indeed co-exist during this time period.
This discovery has important implications for our understanding of early hominin ecology. It also raises significant questions, such as how multiple early hominins living at the same time and geographic area might have used the shared landscape and available resources.
Discovery of Australopithecus deyiremeda
The holotype (type specimen) of Australopithecus deyiremeda is an upper jaw with teeth discovered on March 4, 2011, on top of a silty clay surface at one of the Burtele localities. The paratype lower jaws were also surface discoveries found on March 4 and 5, 2011, at the same locality as the holotype and another nearby locality called Waytaleyta. The holotype upper jaw was found in one piece (except for one of the teeth which was found nearby), whereas the mandible was recovered in two halves that were found about two meters apart from each other. The other mandible was found about 2 kilometers east of where the Burtele specimens were found.
Location of the Discovery
The fossil specimens were found in the Woranso-Mille Paleontological Project study area located in the central Afar region of Ethiopia about 325 miles (520 kilometers) northeast of the capital Addis Ababa and 22 miles (35 kilometers) north of Hadar (“Lucy’s” site). Burtele and Waytaleyta are local names for the areas where the holotype and paratypes were found and they are located in the Mille district, Zone 1 of the Afar Regional State.
The Woranso-Mille Project
The Woranso-Mille Paleontological project conducts field and laboratory work in Ethiopia every year. This multidisciplinary project is led by Dr. Yohannes Haile-Selassie of The Cleveland Museum of Natural History. Additional co-authors of this research include: Dr. Luis Gibert of University of Barcelona (Spain), Dr. Stephanie Melillo of the Max Planck Institute (Leipzig, Germany), Dr. Timothy M. Ryan of Pennsylvania State University, Dr. Mulugeta Alene of Addis Ababa University (Ethiopia), Drs. Alan Deino and Gary Scott of the Berkeley Geochronology Center, Dr. Naomi E. Levin of Johns Hopkins University, and Dr. Beverly Z. Saylor of Case Western Reserve University. Graduate and undergraduate students from Ethiopia and the United States of America also participated in the field and laboratory activities of the project.
Video
Reference:
Yohannes Haile-Selassie, Luis Gibert, Stephanie M. Melillo, Timothy M. Ryan, Mulugeta Alene, Alan Deino, Naomi E. Levin, Gary Scott, Beverly Z. Saylor. New species from Ethiopia further expands Middle Pliocene hominin diversity. Nature, 2015; 521 (7553): 483 DOI: 10.1038/nature14448
Lip reading normally involves deciphering speech patterns, movements, gestures and expressions just by watching a person speak. Planet Earth has LIPS, too – they are an acronym for Large Igneous Provinces, huge accumulations of igneous rocks that form when hot magma extrudes from inside the Earth and flows onto the surface of the seafloor under several kilometres of water.
An international team of scientists including University of Sydney geophysicists Professor Dietmar Müller, Dr Simon Williams and Dr Maria Seton from the School of Geosciences have found a novel way to ‘read the Earth’s LIPS’. Their findings are reported in a Nature Geoscience article in which they show for the first time that LIPS have a close working relationship with underwater mountain ranges called mid-ocean ridges.
LIPS are known to form at hotspots where hot cylindrical upwellings called plumes are rising from the deep Earth’s interior, intersecting the surface.
Professor Müller explains: “Conventional wisdom has it that these plumes, and their associated catastrophic LIPS, have no relationship to mid-ocean ridges where the slow divergence between tectonic plates gives rise to volcanism that steadily and continuously generates new ocean crust.”
Now the research team has uncovered a previously missed connection between LIPS and mid-ocean ridges. They found that mantle plumes can anchor mid-ocean ridges over long periods of time, leading to a connection of mid-ocean ridges and hotspots that cannot easily be broken up.
This attraction of mid-ocean ridges to plumes promotes successive eruptions of LIPS near mid-ocean ridges over long time periods, resulting in a myriad of igneous extrusions on top of and next to each other.
“It is important in our understanding of LIPS in the ocean basins, as it means that not all LIPS form as giant eruptions over very short times, as was originally thought,” said Dr Williams.
Unlike massive eruptions on continents, the undersea eruptions are not catastrophic and are unlikely to have caused mass extinctions and climate change. However, they are just as impressive in terms of volume.
Dr Seton adds: “It means that LIPS in the oceans are less dangerous to life on Earth, as they trickle out in many successive eruptions, not just one giant outpouring of lava, as LIPS on continents.”
“The findings change our understanding of massive volcanism deep in the ocean basins”, said Professor Müller. “For example, the Kerguelen Plateau in the southern Indian Ocean, is over twice as big as New South Wales, and has acquired its massive size over tens of millions of years, whereas the similarly large Siberian Flood Basalts wiped out the majority of marine and land species on Earth within just 60,000 years.”
Reference:
Long-term interaction between mid-ocean ridges and mantle plumes, Nature Geoscience 8, 479–483 (2015) DOI: 10.1038/ngeo2437
Tons of volcanic ash entered the atmosphere in 2010 when the Icelandic volcano erupted. Researchers want to understand the ash particle properties and how well these particles can provide a nucleus for cloud ice crystals.
When tons of ash spewed into the atmosphere from a 2010 Icelandic volcano it caused havoc for vacationers across Europe. But did it also dramatically change clouds? Researchers at Pacific Northwest National Laboratory found that volcanic ash is not as efficient as common dust in birthing clouds’ ice particles. Using a novel laboratory testing chamber they formed cloud ice, a process called ice nucleation, around particles of dust and volcanic ash. Their results revealed the importance of optimal particle structure to efficiently attract super cold water vapor to nucleate ice.
“We described the detailed particle properties of ash, not currently included in atmospheric models,” said Dr. Gourihar Kulkarni, atmospheric scientist at PNNL and lead author of the study. “By including the missing information, we can increase model confidence in simulating the deposition mode of ice nucleation.”
Volcanic eruptions occur almost every day somewhere around the globe. These eruptions provide a constant source of fine ash injected into the part of the atmosphere where clouds are born. These particles can alter clouds but the process is not yet well understood. Researchers at PNNL are using novel techniques to simulate how ash particles compete with already existing natural particles such as dust to birth cloud ice. Because more than half the Earth’s precipitation comes from cloud ice particles, scientists are working to understand all the ways ice crystals are formed during ice nucleation. Including these fundamental discoveries about cloud formation in climate and weather forecast models will support new insight for precipitation and prediction of climate change.
PNNL scientists and a collaborator from the Qatar Environment and Energy Research Institute investigated the ice nucleating properties of ash particles from the 2010 Iceland volcanic eruption at Eyjafjallajökull (see sidebar, Cloud Ice Birthing, and the Icelandic Volcano with the Hard-to-Say Name). They used the ice nucleation chamber at PNNL’s Atmospheric Measurement Laboratory (AML) to test and compare how ash and dust particles nucleate ice in a super cold atmosphere.
At the same time, they applied bulk and single-particle techniques to analyze the surface elemental composition, morphology structural, and shape factor properties of volcanic ash particles at the U.S. Department of Energy’s Environmental Molecular Sciences Laboratory (EMSL) user facility. Researchers also examined the relative importance of ice nucleation behavior of these particles to proxy natural dust particles. These techniques provide detailed information at a molecular level to compare and understand the ice formation ability of ash and dust particles.
Detailed quantification of structural properties is necessary to develop the simplified equations, called parameterizations, used to describe heterogeneous (water to non-water particle) ice nucleation in climate models. Determining ice nucleation efficiencies of volcanic ash particles from different eruption periods will further explain the impact of volcanic particles on clouds. Understanding cloud condensation nucleation properties of these volcanic particles will advance the long-term goal to provide a fundamental theory basis representing the ice nucleation process in climate models.
Reference:
“Effects of Crystallographic Properties on the Ice Nucleation Properties of Volcanic Ash Particles.” Geophysical Research Letters 42. DOI: 10.1002/2015GL063270.
Figure 2A from Jackson et al.: Regional map showing the main basement-involved structures and salt-related structural domains of Santos Basin, offshore Brazil. Click on the figure for a larger image. This paper is open access online.
Salt rock behaves as a fluid and can play a pivotal role in the large-scale, long-term collapse of the world’s continental margins. However, the precise way in which this occurs is laced in controversy; nowhere is this controversy more apparent than along the Brazilian continental margin, where the origin of a feature called “the Albian Gap” has generated much heated debate over several decades.
In this new, open-access GSA Bulletin article, Christopher A-L. Jackson and colleagues enter this debate, critiquing the geological and geophysical evidence forwarded in support of the two main competing genetic models. Their study suggests that much of this evidence is not diagnostic of either model and that a revised model is required. Although their results are unlikely to be universally accepted, they at least will stimulate ongoing debate regarding the origin of this enigmatic structure.
Reference:
Understanding passive margin kinematics: A critical test of competing hypotheses for the origin of the Albian Gap, Santos Basin, offshore Brazil C. A-L. Jackson et al., Bureau of Economic Geology, Jackson School of Geosciences, The University of Texas at Austin, University Station, Austin, Texas, USA. Published online ahead of print on 19 May 2015; DOI: 10.1130/B31290.1. This paper is OPEN ACCESS online.
The birth of Sholan island. First image in 2010, last image in 2012. Credit: Jónsson et al., Nature Communications
The birth of a volcanic island is a potent and beautiful reminder of our dynamic planet’s ability to make new land. Given the destruction we’ve seen following natural events like earthquakes and tsunamis in the past few years, stunning images of two islands forming in the southern Red Sea are most welcome.
The images have been published as part of a study in Nature Communications. It describes how the two new islands formed during volcanic eruptions in 2011 and 2013 respectively, are now being steadily eroded back into the depths. And they erode quickly: one of the islands has lost 30% of its area in just two years. Superb images document the birth and growth of these new islands and also document their changing shape as the Red Sea washes over them.
Ridges and rifts
Magma from an undersea eruption has a difficult journey to travel from the sea floor to the surface to form a new volcanic island, as it becomes continually quenched by an endless supply of water. But that’s what happened when the two volcanic islands, dubbed Sholan and Jadid, formed in the remote Zubair archipelago, part of Yemen.
The southern Red Sea is not a part of the world that many people would recognise as being volcanically active, but it is part of an immense African rift system – a chain of cracks in the Earth’s crust more than 3,000km long. The southern Red Sea is a place where a new ocean is forming as the tectonic plates spread apart at about 6mm per year. Underneath the Red Sea is an embryonic mid-ocean ridge, an undersea range of mountains created by volcanic eruptions.
Mid-ocean ridge spreading is mimicked in the system that feeds the eruptions – long and linear magma-filled cracks called dykes. The researchers used satellite images and knowledge of ground deformation to understand the eruptions and their feeder systems. They discovered that the dykes were at least 10km in length whereas the islands are both less than 1km in diameter.
This is similar to what happens in other volcanic areas where spreading takes place such as Iceland, where a long fissure may be active at the very start of an eruption, but as the eruption progresses the activity becomes focused around just a few vents. These features support the claim by the researchers that active spreading is taking part.
Growing archipelago?
Another key finding of the research is that the seismic swarms that occurred during the formation of these volcanic islands have been observed in the past, but without eruptions being witnessed (this is a remote area). The authors argue that these older seismic swarms were caused by dyke intrusions or submarine eruptions – either of which would suggest that this area is more volcanically active than previously thought.
This is corroborated by observations that the islands in the Zubair archipelago are all constructed of a type of fragmental volcanic rock that characterises the magma-water interactions which occur when volcanic islands are formed.
The value of this research is that by combining high-resolution optical imagery, satellite (InSAR) observations, and seismicity, the researchers have characterised the birth and development of two volcanic islands along a mid-ocean ridge system with unprecedented detail.
Perhaps the most exciting finding of the new research is that the birth of these islands suggests that the Zubair archipelago is undergoing active spreading and that further submarine and island-building eruptions are to be expected.
Video
Note : The above story is based on materials provided by The Conversation. This story is published courtesy of The Conversation (under Creative Commons-Attribution/No derivatives).
This Landsat 8 image, acquired on September 6, 2014, is a false-color view of the Holuhraun lava field north of Vatnajökull glacier in Iceland. The image combines shortwave infrared, near infrared, and green light to distinguish between cooler ice and steam and hot extruded lava. The Bárðarbunga caldera, visible in the lower left of the image under the ice cap, experienced a large-scale collapse starting in mid-August. Credit: USGS
On August 16 of last year, Mark Simons, a professor of geophysics at Caltech, landed in Reykjavik with 15 students and two other faculty members to begin leading a tour of the volcanic, tectonic, and glaciological highlights of Iceland. That same day, a swarm of earthquakes began shaking the island nation—seismicity that was related to one of Iceland’s many volcanoes, Bárðarbunga caldera, which lies beneath Vatnajökull ice cap.
As the trip proceeded, it became clear to scientists studying the event that magma beneath the caldera was feeding a dyke, a vertical sheet of magma slicing through the crust in a northeasterly direction. On August 29, as the Caltech group departed Iceland, the dike triggered an eruption in a lava field called Holuhraun, about 40 kilometers (roughly 25 miles) from the caldera just beyond the northern limit of the ice cap.
Although the timing of the volcanic activity necessitated some shuffling of the trip’s activities, such as canceling planned overnight visits near what was soon to become the eruption zone, it was also scientifically fortuitous. Simons is one of the leaders of a Caltech/JPL project known as the Advanced Rapid Imaging and Analysis (ARIA) program, which aims to use a growing constellation of international imaging radar satellites that will improve situational awareness, and thus response, following natural disasters. Under the ARIA umbrella, Caltech and JPL/NASA had already formed a collaboration with the Italian Space Agency (ASI) to use its COSMO-SkyMed (CSK) constellation (consisting of four orbiting X-Band radar satellites) following such events.
Through the ASI/ARIA collaboration, the managers of CSK agreed to target the activity at Bárðarbunga for imaging using a technique called interferometric synthetic aperture radar (InSAR). As two CSK satellites flew over, separated by just one day, they bounced signals off the ground to create images of the surface of the glacier above the caldera. By comparing those two images in what is called an interferogram, the scientists could see how the glacier surface had moved during that intervening day. By the evening of August 28, Simons was able to pull up that first interferogram on his cell phone. It showed that the ice above the caldera was subsiding at a rate of 50 centimeters (more than a foot and a half) a day—a clear indication that the magma chamber below Bárðarbunga caldera was deflating.
The next morning, before his return flight to the United States, Simons took the data to researchers at the University of Iceland who were tracking Bárðarbunga’s activity.
“At that point, there had been no recognition that the caldera was collapsing. Naturally, they were focused on the dyke and all the earthquakes to the north,” says Simons. “Our goal was just to let them know about the activity at the caldera because we were really worried about the possibility of triggering a subglacial melt event that would generate a catastrophic flood.”
Luckily, that flood never happened, but the researchers at the University of Iceland did ramp up observations of the caldera with radar altimetry flights and installed a continuous GPS station on the ice overlying the center of the caldera.
Last December, Icelandic researchers published a paper in Nature about the Bárðarbunga event, largely focusing on the dyke and eruption. Now, completing the picture, Simons and his colleagues have developed a model to describe the collapsing caldera and the earthquakes produced by that action. The new findings appear in the journal Geophysical Journal International.
“Over a span of two months, there were more than 50 magnitude-5 earthquakes in this area. But they didn’t look like regular faulting—like shearing a crack,” says Simons. “Instead, the earthquakes looked like they resulted from movement inward along a vertical axis and horizontally outward in a radial direction—like an aluminum can when it’s being crushed.”
To try to determine what was actually generating the unusual earthquakes, Bryan Riel, a graduate student in Simons’s group and lead author on the paper, used the original one-day interferogram of the Bárðarbunga area along with four others collected by CSK in September and October. Most of those one-day pairs spanned at least one of the earthquakes, but in a couple of cases, they did not. That allowed Riel to isolate the effect of the earthquakes and determine that most of the subsidence of the ice was due to what is called aseismic activity—the kind that does not produce big earthquakes. Thus, Riel was able to show that the earthquakes were not the primary cause of the surface deformation inferred from the satellite radar data.
“What we know for sure is that the magma chamber was deflating as the magma was feeding the dyke going northward,” says Riel. “We have come up with two different models to explain what was actually generating the earthquakes.”
In the first scenario, because the magma chamber deflated, pressure from the overlying rock and ice caused the caldera to collapse, producing the unusual earthquakes. This mechanism has been observed in cases of collapsing mines (e.g., the Crandall Canyon Mine in Utah).
The second model hypothesizes that there is a ring fault arcing around a significant portion of the caldera. As the magma chamber deflated, the large block of rock above it dropped but periodically got stuck on portions of the ring fault. As the block became unstuck, it caused rapid slip on the curved fault, producing the unusual earthquakes.
“Because we had access to these satellite images as well as GPS data, we have been able to produce two potential interpretations for the collapse of a caldera—a rare event that occurs maybe once every 50 to 100 years,” says Simons. “To be able to see this documented as it’s happening is truly phenomenal.”
Reference:
“The collapse of Bárðarbunga caldera, Iceland.” Geophys. J. Int. (July, 2015) 202 (1): 446-453 DOI: 10.1093/gji/ggv157
This mixture of multicellular organisms, small zooplanktonic animals, larvae, and single cell protists was collected from the Pacific Ocean. Credit: Christian Sardet/CNRS/Tara Expeditions
Plankton are vital to life on Earth — they absorb carbon dioxide, generate nearly half of the oxygen we breathe, break down waste, and are a cornerstone of the marine food chain. Now, new research indicates the diminutive creatures are not only more diverse than previously thought, but also profoundly affected by their environment.
Tara Oceans, an international consortium of researchers from MIT and elsewhere that has been exploring the world’s oceans in hopes of learning more about one of its smallest inhabitants, reported their initial findings this week in a special issue of Science. From 2009 to 2012, a small crew sailed on a 110-foot schooner collecting 35,000 samples of marine microbes and viruses from 200 locations around the globe — facing pirates, high winds, and ice storms in the process. But the effort was worth it. Among the studies’ findings: millions of new genes, thousands of new viruses, insights into microbial interactions, and ocean temperature’s impact on species diversity.
The researchers identified 40 million genes in the upper ocean, most of which are new to science. In comparison, the human gut microbiome only has 10 million genes. Additionally, researchers identified more than 5,000 viruses, only 39 of which were known previously.
Underneath the ocean surface, viruses, plankton, and other microbes battle one another for survival. These interactions — which are mainly parasitic in nature — are vital for maintaining diversity, as they prevent one species from dominating the environment, the study’s authors found. The expedition also revealed that species diversity is shaped by ocean temperature, which is on the rise. The new plethora of data should allow researchers to build predictive models that show how microbial communities will change in a warming world and its resulting impacts on oxygen production, carbon dioxide absorption, and ecosystem dynamics.
“The finding that temperature shapes which species are present, for instance, is especially relevant in the context of climate change, but to some extent this is just the beginning,” says Chris Bowler, a plant biologist from the French National Centre for Scientific Research. “The resources we’ve generated will allow us and others to delve even deeper, and finally begin to really understand the workings of this invisible world.”
Mick Follows, an MIT oceanographer and a co-author of one of the studies did just that, providing a new understanding of how ocean physics and chemistry affect microbial diversity. Agulhas rings are eddies that mediate the transport of waters from the Indian Ocean to the South Atlantic, bringing with them populations of plankton. As currents travel from the Indian Ocean around the tip of South Africa, sweeping up plankton along the way, large swirls (or rings) form that drastically mix and cool the microscopic hitchhikers. Only a fraction of the species survive the journey. What’s more, the unique environment inside the rings — characterized by a complex nitrogen cycle — may act as the filter.
“Oceanography is controlling the communication of these different organisms through the channel,” Follows says. “Our contribution has been to help untangle the complex nitrogen cycle inside the rings.”
Crew members on the Tara expedition collected samples from some of these rings and examined how the water’s biological markers changed over time. They found a large spike in the nitrite levels of younger rings, but had no clue as to its cause. That’s where Follows and colleagues Oliver Jahn and Chris Hill come in.
Using MIT’s General Circulation Model, they found that a combination of energy provided by storms and a weak temperature gradient in the water contribute to strong mixing in the rings, which set in motion a unique nitrogen cycle. Strong mixing dredges up nitrate and other nutrients, sparking an explosion of plankton populations. As the plankton feast they convert the nitrate into ammonium, which is then devoured by other microbes and converted into nitrite.
“Nitrification is a globally important process,” Follows says. “What happens in one ring isn’t necessarily a globally significant amount, but what’s beautiful is that it’s so exaggerated there that we can clearly interpret some of the environmental factors driving it.”
Other co-authors examined the abundance of nitrogen cycle-related genes in the rings, which revealed a very complex set of interactions. “That’s one thing that surprised me,” he said. “A whole suite of genes have been upregulated for all kinds of nitrogen cycle processes. It’s not a one way street. There is a complex enhancement of local nitrogen cycling, which will take some time to fully disentangle.”
Follows’ research is a small part of a larger effort to understand this ecosystem’s intricacies. The five studies released this week provided major insights from just 579 of 35,000 samples. Members of the more than 200-person research team composed of experts from 18 institutions are continuing to analyze the mountain of data, which is now publicly available.
Reference:
P. Bork, C. Bowler, C. de Vargas, G. Gorsky, E. Karsenti, P. Wincker. Tara Oceans studies plankton at planetary scale . DOI: 10.1126/science.aac5605
Note : The above story is based on materials provided by Massachusetts Institute of Technology. The original article was written by Cassie Martin. This story is republished courtesy of MIT News (web.mit.edu/newsoffice/), a popular site that covers news about MIT research, innovation and teaching.
Carrie Eaton, curator of collections at the University of Wisconsin-Madison Geology Museum, displays a bone that revealed the true history of the museum’s famous mastodon skeleton. Credit: Jeff Miller
Through a combination of modern-day scientific sleuthing, historical detective work, and a plethora of persistence, researchers at the University of Wisconsin-Madison have rewritten the story of a celebrated mastodon whose skeleton has been on display for a century.
Two years ago, Carrie Eaton, curator of collections at the university’s Geology Museum, began searching for a way to honor the centennial of the Boaz mastodon, which went on display in 1915. The elephant-like creature is arguably one of the most famous fossils in Wisconsin
Mastodons and mammoths were two of the more than 40 large mammals that roamed North America toward the end of the last Ice Age. Mastodons were smaller than their mammoth cousins, which are more closely related to modern-day elephants. Both died out in the Midwest after the glaciers retreated.
Eaton visited UW Archives, looking for records that might reveal more about the Boaz mastodon’s discovery and how it ended up at the university. The deeper she and UW Archives Director David Null dug, the more surprises they uncovered.
“It got complicated because a couple of mastodons were found at the same time,” says Null.
In July 1898, Dean E.A. Birge wrote E.F. Riley, secretary of the UW-Madison Board of Regents, describing a “considerable number of bones” that had washed out of a ravine “not far from Fennimore,” about 70 miles west of Madison. E.R. Buckley, assistant geologist at the Wisconsin Geological Survey, paid $75 for them because he knew “Professor (Charles) Van Hise was desirous of obtaining mastodon bones with the design of gradually accumulating enough to make a complete skeleton.”
Newspaper articles from that time—published in outlets like the Milwaukee Sentinel, the Wisconsin State Journal, the LaCrosse Tribune and the Fennimore Times Review—described two separate discoveries of mastodon bones in southwestern Wisconsin, just a year apart.
The first was at Boaz, in July 1897, uncovered by four boys on the Dosch family farm. Buckley visited the site, detailed in his field notes the bones found there and purchased them for $50.
The second was at Anderson Mills in July 1898, found after a heavy rain by young Harry Anderson on his way to the field for a day of work.
Museum curator Eaton, puzzling over this information, remembered a set of intriguing photographs a visitor had shown her a decade earlier.
“He came to the museum with photos of these bones from Anderson Mills, asking if we knew where they were,” says Eaton. “At the time, the answer was no.”
The photos had been filed away, like many remnants of the past that fill the cabinets and drawers of Weeks Hall. The museum is home to 120,000 geological and paleontological specimens and exhibits that draw more than 50,000 visitors each year.
Eaton dug them out: rich photographs of a spread of mastodon bones, the family who found them and Buckley himself, who was at Anderson Mills following the find. She noticed something: a piece of the mastodon’s femur, at the kneecap end, was broken off. She wondered, could she find a bone in the museum with that very break?
She scanned and enlarged a photograph and brought it to the specimen in the museum for comparison. But it was difficult to tell, because in 1913, as workers prepared and mounted the bones for display, they had covered them in plaster and painted over them, masking many of their superficial features.
Working with museum scientist Dave Lovelace and staff at the Wisconsin Institute for Medical Research, Eaton put the femur through a CT scan, a type of medical X-ray, to see if she could find the break.
She also scanned a pair of ribs she thought might be from Anderson Mills, which had been described in the newspaper articles as “knitted” – a phenomenon caused by bone fractures that healed while the mastodon was still living.
The images she got back were convincing. She then inspected the rest of the skeleton and noted how the natural staining on the elements she had scanned matched most of the other bones. Just two of the bones were notably different in their appearance: the first left rib and the right tibia.
Eaton sent genetic samples from those two bones to McMaster University’s Ancient DNA Centre in Ontario, Canada, as well as samples from the left femur and humerus, which were stained like most of the other bones on display. She also sent samples from these four bones to a radiocarbon dating lab to determine their ages.
Her work confirmed that the right tibia and left first rib were likely from the same animal and that they are 700 to 800 years younger than the bones from Anderson Mills, which make up most of the mounted skeleton. For now, only these two bones can be attributed to the Boaz mastodon.
However, the age of the Boaz bones—which date to roughly 12,100 years ago—indicates the animal could have been among the “last mastodons standing,” Eaton says, placing it just before their Midwest extinction. A colleague at the Illinois State Museum, Chris Wigda, is piecing together that story.
So how did the entire mastodon end up attributed to the two-bone find at Boaz, leaving the Anderson Mills discovery forgotten?
“We assume both sat somewhere in Science Hall and it’s possible the labels got mixed up or the material got co-mingled and they mounted the skeleton thinking everything they had was from Boaz,” Eaton says.
For her, the story is far from over, as the project has raised more questions she and the Geology Museum staff—including Director Rich Slaughter and Assistant Director Brooke Norsted—would like to answer.
For now, the staff are planning outreach efforts throughout Dane County, teaching children more about Ice Age beasts and the “new” stories of the Boaz and Anderson Mills mastodons. This includes printing a 3D replica of the femur that provided the crucial evidence.
With funding from the American Girl Fund for Children, the Friends of the Geology Museum, and the Brittingham Trust—which was founded by a UW-Madison alumnus who attended the university when the mastodon was first mounted—they are also working on a new museum exhibit.
Eaton continues to try to reach relatives of the Anderson family to let them know their role in Wisconsin’s fossil record. On the backs of the pivotal photographs donated to the museum is the name W. Paul Dietzman, grandson of the original J.W. Anderson, Harry Anderson’s father. Dietzman, a decorated World War II veteran and UW-Madison alumnus, passed away in 2001.
“I would imagine that somewhere out there are some Anderson relatives who would love to hear this story,” Eaton says. “I only wish I could be the one to tell them.”
This is the tetragonal crystal structure of NaFe2As2, courtesy of Alexander Goncharov. Sodium (Na) is represented by the black balls, iron (Fe) by the red balls, and arsenic (As) by the yellow balls. Courtesy of Alexander Goncharov. Credit: Alexander Goncharov
Superconductivity is a rare physical state in which matter is able to conduct electricity–maintain a flow of electrons–without any resistance. It can only be found in certain materials, and even then it can only be achieved under controlled conditions of low temperatures and high pressures. New research from a team including Carnegie’s Elissaios Stavrou, Xiao-Jia Chen, and Alexander Goncharov hones in on the structural changes underlying superconductivity in iron arsenide compounds–those containing iron and arsenic. It is published by Scientific Reports.
Although superconductivity has many practical applications for electronics (including scientific research instruments), medical engineering (MRI and NMR machines), and potential future applications including high-performance power transmission and storage, and very fast train travel, the difficulty of creating superconducting materials prevents it from being used to its full potential. As such, any newly discovered superconducting ability is of great interest to scientists and engineers.
Iron arsenides are relatively recently discovered superconductors. The nature of superconductivity in these particular materials remains a challenge for modern solid state physics. If the complex links between superconductivity, structure, and magnetism in these materials are unlocked, then iron arsenides could potentially be used to reveal superconductivity at much higher temperatures than previously seen, which would vastly increase the ease of practical applications for superconductivity.
When iron arsenide is combined with a metal–such as in the sodium-containing NaFe2As2 compound studied here–it was known that the ensuing compound is crystallized in a tetrahedral structure. But until now, a detailed structure of the atomic positions involved and how they change under pressure had not been determined.
The layering of arsenic and iron (As-Fe-As) in this structure is believed to be key to the compound’s superconductivity. However, under pressure, this structure is thought to be partially misshapen into a so-called collapsed tetragonal lattice, which is no longer capable of superconducting, or has diminished superconducting ability.
The team used experimental evidence and modeling under pressure to actually demonstrate these previously theorized structural changes–tetragonal to collapsed tetragonal–on the atomic level. This is just the first step toward definitively determining the link between structure and superconductivity, which could potentially make higher-temperature superconductivity a real possibility.
They showed that at about 40,000 times normal atmospheric pressure (4 gigapascals), NaFe2As2 takes on the collapsed tetragonal structure. This changes the angles in the arsenic-iron-arsenic layers and is coincident with the loss in superconductivity. Moreover, they found that this transition is accompanied by a major change in bonding coordination in the formation of the interlayer arsenic-arsenic bonds. A direct consequence of this new coordination is that the system loses its two-dimensionality, and with it, superconductivity.
“Our findings are an important step in identifying the hypothesized connection between structure and superconductivity in iron-containing compounds,” Goncharov said. “Understanding the loss of superconductivity on an atomic level could enhance our ease of manufacturing such compounds for practical applications, as well as improving our understanding of condensed matter physics.”
Researchers taking measurements in the Mera Glacier region of the Dudh Kosi basin. Credit: Patrick Wagnon
If greenhouse-gas emissions continue to rise, glaciers in the Everest region of the Himalayas could experience dramatic change in the decades to come. A team of researchers in Nepal, France and the Netherlands have found Everest glaciers could be very sensitive to future warming, and that sustained ice loss through the 21st century is likely. The research is published today (27 May) in The Cryosphere, an open access journal of the European Geosciences Union (EGU).
“The signal of future glacier change in the region is clear: continued and possibly accelerated mass loss from glaciers is likely given the projected increase in temperatures,” says Joseph Shea, a glacier hydrologist at the International Centre for Integrated Mountain Development (ICIMOD), Kathmandu, Nepal, and leader of the study.
The glacier model used by Shea and his team shows that glacier volume could be reduced between 70% and 99% by 2100. The results depend on how much greenhouse-gas emissions continue to rise, and on how this will affect temperature, snowfall and rainfall in the area.”Our results indicate that these glaciers may be highly sensitive to changes in temperature, and that increases in precipitation are not enough to offset the increased melt,” says Shea. Increased temperatures will not only increase the rates of snow and ice melt, but can also result in a change of precipitation from snow to rain at critical elevations, where glaciers are concentrated. Together, these act to reduce glacier growth and increase the area exposed to melt.
Glaciers in High Mountain Asia, a region that includes the Himalayas, contain the largest volume of ice outside the polar regions. The team studied glaciers in the Dudh Kosi basin in the Nepal Himalaya, which is home to some of the world’s highest mountain peaks, including Mt Everest, and to over 400 square kilometres of glacier area. “Apart from the significance of the region, glaciers in the Dudh Kosi basin contribute meltwater to the Kosi River, and glacier changes will affect river flows downstream,” says Shea.
Changes in glacier volume can impact the availability of water, with consequences for agriculture and hydropower generation. While increased glacier melt initially increases water flows, ongoing retreat leads to reduced meltwater from the glaciers during the warmer months, with greatest impact for the local populations before the monsoon when rainfall is scarce. Glacier retreat can also result in the formation and growth of lakes dammed by glacial debris. Avalanches and earthquakes can breach the dams, causing catastrophic floods that can result in river flows 100 times greater than normal in the Kosi basin.
To find out how glaciers in the region will evolve in the future, the team started by using field observations and data from local weather stations to calibrate and test a model of glacier change over the past 50 years. “To examine the sensitivity of modelled glaciers to future climate change, we then applied eight temperature and precipitation scenarios to the historical temperature and precipitation data and tracked how glacier areas and volumes responded,” says study co-author Walter Immerzeel of Utrecht University in the Netherlands.
Part of the glacier response is due to changes in the freezing level, the elevation where mean monthly temperatures are 0°C. “The freezing level currently varies between 3200 m in January and 5500 m in August. Based on historical temperature measurements and projected warming to the year 2100, this could increase by 800-1200m,” says Immerzeel. “Such an increase would not only reduce snow accumulations over the glaciers, but would also expose over 90% of the current glacierized area to melt in the warmer months.”
The researchers caution, however, that the results published in The Cryosphere should be seen as a first approximation to how Himalayan glaciers will react to increasing temperatures in the region. Patrick Wagnon, a visiting scientist at ICIMOD and glaciologist at the Institut de Recherche pour le Développement in Grenoble, France, says: “Our estimates need to be taken very cautiously, as considerable uncertainties remain.” For example, the model simplifies glacier movements, which impact how glaciers respond to increases in temperature and precipitation.
But the researchers stress in the paper that “the signal of future glacier change in the region is clear and compelling” and that decreases in ice thickness and extent are expected for “even the most conservative climate change scenario.”
Reference:
J. M. Shea, W. W. Immerzeel, P. Wagnon, C. Vincent, and S. Bajracharya. Modelling glacier change in the Everest region, Nepal Himalaya . DOI:10.5194/tc-9-1105-2015
Distribution of thematic layers on a scale of 1:50,000 over the satellite images of Google Earth. Above shows the area left of the Strait of Gibraltar. Credit: USAL; Image courtesy of Plataforma SINC
A team from the University of Salamanca has developed a tool that allows a 3D journey in ten sites of geological and palaeontological interest in the Guadalquivir basin (Huelva, Spain). In the virtual tour, developed with Google Earth, you can visit and explore treasures of this area, such as records of the opening of the Atlantic Ocean, using tablets and smartphones.
Researchers from the University of Salamanca (USAL) have designed a geological and palaeontological virtual tour in 3D in which various locations can be viewed around Huelva. The tour includes, among many other conserved treasures, five-million-year-old marine fossils. The results of the project have been published in the journal Environmental Earth Sciences.
As Antonio M. Graña, professor in the Geology department at this university and co-author of the study, comments, “the objective is to showcase the geological and palaeontological heritage of the area and generate educational resources and research.”
Building on the extensive experience of the team in the Upper Neogene deposits in the province of Huelva, on the western edge of the Guadalquivir basin, “we wanted to do something different to bring geology and palaeontology closer to earth science students, using the abilities of Google Earth and everyday technologies such as tablets and smartphones.”
In particular, Graña indicates that geo-informatics tools have been applied, such as the geographical information system ArcGis 10.2, “to produce a virtual 3D tour of the geo-referenced sites including multiple digital layers grouped by geological and topographical maps, digital terrain models and orthophotos.”
The educational resources generated, which include a virtual route, flight simulator, field notebook with questionnaires, videos and augmented reality, are implemented with models and mapping. They can be downloaded free of charge from the homepages of the Spanish Geology and Mining Institute (Instituto Geológico y Minero de España) and the National Geographical Institute (Instituto Geografico Nacional).
Google Earth’s free virtual globe
Each stop on the route of the ten interest sites selected “contains descriptive and graphical elements which can be seen on Google Earth’s free virtual globe, together with diagrams, photographs and information factsheets to quantitatively evaluate the scientific, educational and cultural value of each site of geographical and palaeontological interest,” the expert highlights.
Using this 3D digital geological database, a virtual flight route is proposed which can be shown in video format and is compatible with smartphones and tablets.
As the professor says “When you start getting closer with these virtual flights you can see how the geological mapping is superimposed on the orthophotographs loaded in Google Earth. We can zoom in or out to get closer to or distance ourselves from the geosite, analysing the geological context of the study sector. The tool also gives us an overall spatial view of the route and places us on the different geological and palaeontological materials available in 3D.”
The tour also allows us to observe the topographical position and the sequence with other lithologies. To enhance the virtual tour, “each stop is bursting with graphical documentation from the different information factsheets, field photographs of the actual outcrop and even sometimes includes the Google streetview option to analyse the structure and the outcrop that we want to visit on the route,” he adds.
The virtual flight can directly record a route in which the different layers that are superimposed on the satellite image and aerial photos of Google Earth can be activated or deactivated.
“The flight can be created directly from the computer keyboard or by guiding the flight simulator with a joystick.” It can fly over the map and geosites as if it were a videogame and you can choose different types of plane and observe the different panoramas using the controls,” says Graña.
Ten geological stops
The ten geosites on the geological and palaeontological tour of the Guadalquivir basin have been selected for different reasons. “Some have records of the opening of the Atlantic ocean in the Mesozoic, such as pillow lavas (similar to that found in the Atlantic part of Iceland) located between the towns of Niebla and Bonares, next to the Seville-Huelva motorway,” he adds.
Another of these locations “contains five-million-year-old marine fossils which are found in the same place in which they lived, which allows for palaeoecological interpretations of the characteristics of the Pliocene sea.” This site is in a place known as Casa del Pino, next to Bonares.
The virtual 3D tour also includes geological stops located in places where scientific surveys have been made up to 250 metres in depth in which many environmental changes have been dated with great accuracy by studying calcareous microplankton (next to the bullring in Huelva and next to the Montemayor chapel in Moguer). Graña explains that these explorations are mentioned in numerous international publications.
The team from USAL does not limit itself to the area of the Guadalquivir basin in its projects. It has also made a 3D geological tour of the Protected National Park of Las Batuecas (Salamanca) and is now developing a 3D georoute on foot of a stretch of the Portuguese Algarve.
Other initiatives include similar routes relating to the Miocene in Lisbon, one of the most representatives in Europe, as well as on Lanzarote and the island of Maio (Cape Verde), concludes Graña.
Reference:
J. A. González-Delgado, A. M. Martínez-Graña, J. Civis, F. J. Sierro, J. L. Goy, C. J. Dabrio, F. Ruiz, M. L. González-Regalado, M. Abad. Virtual 3D tour of the Neogene palaeontological heritage of Huelva (Guadalquivir Basin, Spain). Environmental Earth Sciences, 2014; 73 (8): 4609 DOI: 10.1007/s12665-014-3747-y
Evolution of diving specializations within the Hesperornithiformes. Credit: Image courtesy of Taylor & Francis
A new study of some primitive birds from the Cretaceous shows how several separate lineages evolved adaptations for diving.
Living at the same time as the dinosaurs, Hesperornithiform bird fossils have been found in North America, Europe and Asia in rocks 65-95 million years old. Dr Alyssa Bell and Professor Luis Chiappe of the Dinosaur Institute, Natural History Museum of Los Angeles County, publishing in the Journal of Systematic Palaeontology, have undertaken a detailed analysis of their evolution, showing that separate lineages became progressively more adept at diving into water to catch fishes, like modern day loons and grebes.
The Hesperornithiformes are a highly derived but very understudied group of primitive birds from the Cretaceous period. This study is the first comprehensive phylogenetic analysis, or evaluation of evolutionary relationships, to ever be undertaken on the entire group.
The results of this study confirm that the Hesperornithiformes do form a single group (or clade), but that within this group the inter-relationships of the different taxa are more complex than previously thought. Additionally, this study finds that anatomical changes were accompanied by enlargement in overall body size, which increased lung capacity and allowed deeper diving.
Overall, this study provides evidence for understanding the evolution of diving adaptations among the earliest known aquatic birds.
Reference:
Alyssa Bell, Luis M. Chiappe. A species-level phylogeny of the Cretaceous Hesperornithiformes (Aves: Ornithuromorpha): implications for body size evolution amongst the earliest diving birds. Journal of Systematic Palaeontology, 2015; 1 DOI: 10.1080/14772019.2015.1036141
Although lowland Amazon forests look monotonously green from satellites, Carnegie scientists have discovered that they are actually arranged in chemically-distinct communities patterned by the soils and microtopography that underlie the forest. This Carnegie Airborne Observatory (CAO) image reveals floodplain forest canopies in red that are naturally packed with growth chemicals, as compared to forest canopies on neighboring terraces in yellow-green that are outfitted with fewer growth chemicals. These CAO maps explain the geographic pattern of carbon dioxide uptake in the lowland Amazon, and help to predict forest responses to climate change. Credit: Image is courtesy of Greg Asner
You know the old saying: Location, location, location? It turns out that it applies to the Amazon rainforest, too. New work from Carnegie’s Greg Asner illustrates a hidden tapestry of chemical variation across the lowland Peruvian Amazon, with plants in different areas producing an array of chemicals that changes across the region’s topography. His team’s work is published by Nature Geoscience.
“Our findings tell us that lowland Amazon forests are far more geographically sorted than we once thought,” Asner explained. “It is not simply a swath of green that occurs with everything strewn randomly. Place does matter, even if it all appears to be flat and green monotony at first glance.”
The Amazonian forest occupies more than five million square kilometers, stretching from the Atlantic coast to the foothills of the Andes. Thousands of tree and other plant species are found throughout this area, each synthesizing a complex portfolio of chemicals to accomplish a variety of functions from capturing sunlight to fighting off herbivores, to attracting pollinators, not to mention the chemical processes involved in adapting to climate change.
The lowland forests of the Amazon rest on a hidden, underlying mosaic of geologic and hydrologic variation. It turns out that this mosaic affects the diversity of chemical functions that forest plants undertake, because the varying topography affects water, nutrients, and other plant resources. Understanding how the chemical activity of plants varies geographically is crucial to understanding the way an ecosystem functions on a large scale.
To figure it out, Asner and his team took a high-tech approach based on data collected from their Carnegie Airborne Observatory, or CAO, and developed the first high-resolution maps of the forest’s canopy chemistry. A novel combination of instruments onboard the CAO, including a high-fidelity imaging spectrometer and a laser scanner, was used to map four huge forested landscapes along two Amazonian river systems. The instruments enabled the team to capture previously hidden chemical fingerprints of rainforest canopy species.
“This is the first time that so many chemicals have been measured and mapped in any forest ecosystem on Earth,” Asner said. “No one has done the mapping we have achieved here, which enabled a discovery that the lowland Amazon is anything but monotonous or similar everywhere.”
Their results reveal that the pattern of chemical properties in canopy trees changes along the paths of the two rivers–the Madre de Dios River and the Tambopata River–as well as across the landscape’s topography on a ‘microscale’, with very small changes in elevation making all the difference to the plants living there. CAO’s laser-guided spectroscopic mapping is unsurpassed in its ability to connect biological and geological processes. Studies of this kind help scientists to better understand Earth’s tremendous diversity and its geographic patterning, both of which are required to understand evolution or the future of species in a changing world.
“Looking at the lowland Amazon with this kind of detail, you can see back in time, from the way the topography was shaped millions of years ago, which still affects soils and mineral availability today, to the way that different species evolved to take advantage of this great variety of subtly changing conditions,” Asner explained. “And we can peer into the future and see how quickly human activity is changing the kaleidoscope of diversity that has been uniquely shaped over millions of years.”
Reference:
Felipe Sinca et al. Landscape biogeochemistry reflected in shifting distributions of chemical traits in the Amazon forest canopy. Nature Geoscience, May 2015 DOI: 10.1038/ngeo2443
Surfer 12 was released January 14, 2014. New Features including reverseable axes, date/time format, log Z scale, download air photos from NAIP WMS (Web Map Services), save old formats, export drawn objects with a map, multiple post map labels, base map editing, blank a buffered convex data zone, and import and export new file formats including vector GeoPDF, JPEG2000, SVG, KML/KMZ and more.
Surfer is a contouring and 3D surface mapping software program that runs under Microsoft Windows. The Surfer software quickly and easily converts your data into outstanding contour, surface, wireframe, vector, image, shaded relief, and post maps. Virtually all aspects of your maps can be customized to produce exactly the presentation you want using Surfer’s software tools. Producing publication quality maps has never been quicker or easier.
Features
Map Projections
Load maps in any map projection, and convert between projections.
Surfer now supports map projections! Choose from an endless list of coordinate systems for your map to display. Specify the source coordinate system for each of the layers in your map, and choose to display the map in any other coordinate system! For example, load data and grid files in UTM or State Plane coordinates, and display the map in Latitude/Longitude coordinates! It is simply that easy! Save the coordinate system information for your grid to an external file for future reuse.
Contour Maps
Surfer software’s contour maps give you full control over all map parameters.
You can accept the Surfer intelligent defaults to automatically create a contour map, or double-click a map to easily customize map features. Display contour maps over any contour range and contour interval, or specify only the contour levels you want to display on the map. And with the Surfer software you can add color fill between contours to produce dazzling displays of your maps, or produce gray scale fills for dramatic black and white printouts.
Contour Map Features
Automatic or user-defined contour intervals and ranges
Full control over contour label format, font, frequency, placement, and spacing
Drag contour labels to place them exactly where you want them
Automatic or user-defined color for contour lines
Color fill between contours, either user-specified or as an automatic spectrum of your choice
Save and retrieve custom line styles and fills for contour maps
Full control over hachures
Regulate smoothing of contour lines
Reshape contour lines
Blank contour lines in areas where you don’t want to show any data
Specify color for blanked region
Rotate and tilt contour maps to any angle
Add color scale or distance scale bars
Independently scale in the X and Y dimensions
Full control over axis tick labels, tick spacing, grid lines and titles
Create any number of contour maps on a page
Print maps in black-and-white or full color
Overlay base, vector, shaded relief, image, or post maps on contour maps
Drape contour maps over 3D surfaces for dramatic displays
Export contours in 3D DXF format
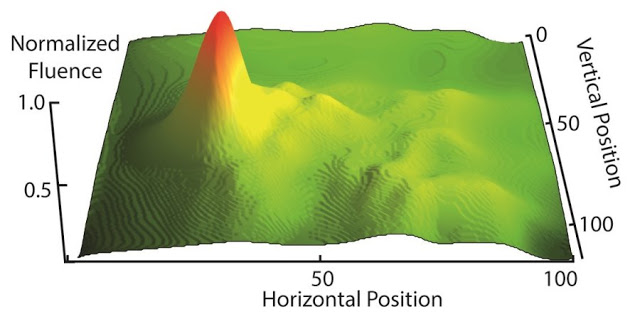
3D Surface Maps
The 3D surface map uses shading and color to emphasize your data features.
Change the lighting, display angle and tilt with a click of the mouse. Overlay several surface maps to generate informative block diagrams.
3D Surface Map Features
Specify surface color gradation, shininess, base fill and line color
Control mesh line frequency, color, style, surface offset
Set lighting horizontal and vertical angles, ambient, diffuse, and specular properties
Overlay contour maps, image maps, post maps, shaded relief maps, raster and vector base maps, and other surface maps for spectacular presentations
Choose overlay resample method and resolution, color modulation (blending) of surface and overlays
Change View tilt, rotation, field of view angles, perspective or orthographic projection
Set XYZ scales in map units or page length, choose proportional or independent XY scaling
Use data XY limits or specify a subset of the map
Control background fill and line color and styles
Add color scales to explain the data values corresponding to each color
Disable the display of blanked grid nodes or map the blanked areas to a specific Z level
Produce a detailed report of the grid statistics
Substitute a new grid file into an existing map
3D Wireframe Maps
Surfer wireframe maps provide an impressive three dimensional display of your data.
Use color zones, independent X,Y,Z scaling, orthographic or perspective projections at any tilt or rotation angle, and different combinations of X, Y and Z lines to produce exactly the surface you want. Drape a color-filled contour map over a wireframe map to create the most striking color or black-and-white representations of your data. The possibilities are endless.
3D Wireframe Map Features
Display any combination of X,Y, and Z lines
Use automatic or user-defined color zones to highlight different Z levels
Stack any number of 3D surfaces on a single page
Optional hidden line removal
Overlay any combination of contour, filled contour, base, post, and classed post maps on a surface
Views of the top or bottom of the surface, or both
Proportional or independent scaling in the X,Y, and Z dimensions
Full control over axis tick marks and tick labels
Add a base with optional vertical base lines
Display the surface at any rotation or tilt angle
Vector Maps
Instantly create vector maps in Surfer to show direction and magnitude of data at points on a map.
You can create vector maps from information in one grid or two separate grids. The two components of the vector map, direction and magnitude, are automatically generated from a single grid by computing the gradient of the represented surface. At any given grid node, the direction of the arrow points in the direction of the steepest descent. The magnitude of the arrow changes depending on the steepness of the descent. Two-grid vector maps use two separate grid files to determine the vector direction and magnitude. The grids can contain Cartesian or polar data. With Cartesian data, one grid consists of X component data and the other grid consists of Y component data. With polar data, one grid consists of angle information and the other grid contains length information. Overlay vector maps on contour or wireframe maps to enhance the presentation!
Vector Map Features
Define arrow style, color, and frequency
Symbol color may be fixed or based on vector magnitude
Display map scales, color scale bars, and vector scale legends
Scale the arrow shaft length, head length, and width
Control vector symbol origin
Choose from linear, logarithmic, or square root scaling methods
Image Maps
Surfer image maps use different colors to represent elevations of a grid file.
Create image maps using any grid file format: GRD, DEM, SDTS DDF, GTOP30 HDR. Surfer automatically blends colors between percentage values so you end up with a smooth color gradation over the map. You can add color anchors at any percentage point between 0 and 100. Each anchor point can be assigned a unique color, and the colors are automatically blended between adjacent anchor points. This allows you to create color maps using any combination of colors. Any color fill you choose for an image map can be used with any other image map, even if the associated grid files cover distinctly different Z ranges. Image maps can be created independently of other maps, or can be combined with other maps. They can be scaled, resized, limited and moved.
Image Map Features
Pixel maps or smoothed images
Dither bitmaps if needed
Create an associated color scale
Create custom color spectrum files for use on any image or shaded relief map
Overlay image maps with contour, post, or base maps
More information is now at your fingertips. Download image layers from hundreds of free online Web Map Services (WMS) through Surfer’s new, integrated WMS browser. Connect to online data sources, pick the layers of interest you want to download, and Surfer seamlessly downloads and imports the images into your projects.
Grid and Display Maps with Log Z Scaling
Effectively display Z data that range over several orders of magnitude! You can grid data taking the log of the Z value prior to gridding, choose to have logarithmically scaled contour levels, or have logarithmic scaling applied to the color scale. This is extremely useful when your data file has extreme data ranges, such as concentration data where the Z values can span multiple orders of magnitude (i.e. > 1 to < 20000).
Post Map Enhancements
Create your post maps the way you want them! Many new enhancements have been made to post and classed post maps so that you can create the map you envision. Add multiple labels to points, connect the points with a line, and use the symbol color as the label font color, just to name a few.
Post maps also offer the ability to color the symbols using a column in the data file of either numeric values (and you can choose a color gradient to apply to the data range) or discrete color names. Classed post maps offer the option to apply a color gradient to the symbols, apply a gradational size to the symbols, and set the symbol properties for all symbols at once.
Creating just the right map of your point locations is better than ever!
“Loving the multiple post labels function – big thanks for that one!” – Shane Wilkes, Hydrogeologist
The perching toe from chicken to dinosaur. Credit: Image courtesy of Universidad de Chile
A unique adaptation in the foot of birds is the presence of a thumb-like opposable toe, which allows them to grasp and perch. However, in their dinosaur ancestors, this toe was small and non- opposable, and did not even touch the ground, resembling the dewclaws of dogs and cats. Remarkably, the embryonic development of birds provides a parallel of this evolutionary history: The toe starts out like their dinosaur ancestors, but then its base (the metatarsal) becomes twisted, making it opposable. Brazilian researcher Joâo Botelho, working at the lab of Alexander Vargas at the University of Chile, decided to study the underlying mechanisms. Botelho observed that the twisting occurred shortly after the embryonic musculature of this toe was in place.
“This is one of the clearest examples of how indirect the morphological consequences of genetic change are mediated,” Gunter Wagner, evolutionary geneticist and professor at Yale.
Bird embryos move a lot inside the egg during development, and the onset of movement at this toe coincided with the twisting of its base. Botelho also demonstrated that in this toe, genes of cartilage maturation were expressed at a much later stage than other digits: It retains many rapidly dividing stem cells for a much longer period. Such immature cartilage is highly plastic and easily transformed by muscular activity.
These observations suggested the toe is twisted as a result of mechanical forces imposed on it by the embryonic musculature. Definitive proof, however, would come from experiments. When Botelho applied Decamethonium bromide, a pharmacological agent capable of paralyzing embryonic musculature, the result was a non-opposable toe with a straight, non-twisted base identical to that of their dinosaur ancestors. Only a few experiments are known to recover dinosaur traits in birds (such as a dinosaur-like shank and tooth-like structures). The undoing of the perching digit is thus an important new addition, and the results have now been published in Scientific Reports, an open-access journal of the Nature Publishing Group.
The significance of this experiment, however, goes beyond the fact that a dinosaur-like toe is being retrieved. Evolutionary research often centers on mutations, but the development and evolution of the perching toe cannot be understood without the forces of embryonic muscular activity. The study is described as “true developmental mechanics” by Gunter Wagner, an evolutionary geneticist and professor at Yale. “This is one of the clearest examples of how indirect the morphological consequences of genetic change are mediated. The experiments prove that interactions about organ systems channel the directions of organismal evolution.”
Reference:
João Francisco Botelho, Daniel Smith-Paredes, Sergio Soto-Acuña, Jorge Mpodozis, Verónica Palma, Alexander O. Vargas. Skeletal plasticity in response to embryonic muscular activity underlies the development and evolution of the perching digit of birds. Scientific Reports, 2015; 5: 9840 DOI: 10.1038/srep09840
This is a photo of the small stalagmite in the Mawmluh cave before it was collected. Below, a gray-scale image of a slab of the stalagmite after it was prepared for analysis. The red lines show the locations where the layers were counted and the green lines show the locations where the material was dated. The adjacent numbers are the dates with the uncertainties of the measurements. Credit: Courtesy of Jessica Oster.
When the conversation turns to the weather and the climate, most people’s thoughts naturally drift upward toward the clouds, but Jessica Oster’s sink down into the subterranean world of stalactites and stalagmites.
That is because the assistant professor of earth and environmental sciences at Vanderbilt University is a member of a small group of earth scientists who are pioneering in the use of mineral cave deposits, collectively known as speleothems, as proxies for the prehistoric climate.
It turns out that the steady dripping of water deep underground can reveal a surprising amount of information about the constantly changing cycles of heat and cold, precipitation and drought in the turbulent atmosphere above. As water seeps down through the ground it picks up minerals, most commonly calcium carbonate. When this mineral-rich water drips into caves, it leaves mineral deposits behind that form layers which grow during wet periods and form dusty skins when the water dries up.
Today, scientists can date these layers with extreme precision based on the radioactive decay of uranium into its daughter product thorium. Variations in the thickness of the layers is determined by a combination of the amount of water seeping into the cave and the concentration of carbon dioxide in the cave’s atmosphere so, when conditions are right, they can provide a measure of how the amount of precipitation above the cave varies over time. By analyzing the ratios of heavy to light isotopes of oxygen present in the layers, the researchers can track changes in the temperature at which the water originally condensed into droplets in the atmosphere changes and whether the rainfall’s point of origin was local or if traveled a long way before falling to the ground.
The value of this information is illustrated by the results of a study published May 19 in the journal Geophysical Research Letters by Oster’s group, working with colleagues from the Berkeley Geochronology Center, the Smithsonian Institution National Museum of Natural History and the University of Cambridge titled “Northeast Indian stalagmite records Pacific decadal climate change: Implications for moisture transport and drought in India.”
In the study, Oster and her team made a detailed record of the last 50 years of growth of a stalagmite that formed in Mawmluh Cave in the East Khasi Hills district in the northeastern Indian state of Meghalaya, an area credited as the rainiest place on Earth.
Studies of historical records in India suggest that reduced monsoon rainfall in central India has occurred when the sea surface temperatures in specific regions of the Pacific Ocean were warmer than normal. These naturally recurring sea surface temperature “anomalies” are known as the El Niño Modoki, which occurs in the central Pacific, and the Pacific Decadal Oscillation, which takes place in the northern Pacific. (By contrast, the historical record indicates that the traditional El Niño, which occurs in the eastern Pacific, has little effect on rainfall levels in the subcontinent.)
When the researchers analyzed the Mawmluh stalagmite record, the results were consistent with the historical record. Specifically, they found that during El Niño Modoki events, when drought was occurring in central India, the mineral chemistry suggested more localized storm events occurred above the cave, while during the non-El Niño periods, the water that seeped into the cave had traveled much farther before it fell, which is the typical monsoon pattern.
“Now that we have shown that the Mawmluh cave record agrees with the instrumental record for the last 50 years, we hope to use it to investigate relationships between the Indian monsoon and El Niño during prehistoric times such as the Holocene,” said Oster.
The Holocene Climate Optimum was a period of global climate warming that occurred between six to nine thousand years ago. At that time, the global average temperatures were somewhere between four to six degrees Celsius higher than they are today. That is the range of warming that climatologists are predicting due to the build-up of greenhouse gases in the atmosphere from human activity. So information about the behavior of the monsoon during the Holocene could provide clues to how it is likely to behave in the future. This knowledge could be very important for the 600 million people living on the Indian subcontinent who rely on the monsoon, which provides the area with 75 percent of its annual rainfall.
“The study actually grew out of an accidental discovery,” said Oster. Vanderbilt graduate student Chris Myers visited the cave, which co-author Sebastian Breitenbach from Cambridge has been studying for several years, to see if it contained enough broken speleothems so they could use them to date major prehistoric earthquakes in the area.
Myers found a number of columns that appear to have broken off in the magnitude 8.6 earthquake that hit Assam, Tibet in 1950. But he also discovered a number of new stalagmites that had begun growing on the broken bases. When he examined these in detail he found that they had very thick layers and high concentrates of uranium, which made them perfect for analysis.
Because of the large amount of water running into the cave, the stalagmite they choose to analyze had grown about 2.5 centimeters in 50 years. (If that seems slow, compare it with growth rates of a few millimeters in a thousand years found in caves in arid regions like the Sierra Nevada.) As a result, the annual layers averaged about 0.4 millimeters thick – wide enough for the researchers to get seven to eight samples per layer, which is slightly better than one measurement every two months.
The amount of information about the climate that scientists can extract from the stalagmites and stalactites in a cave is amazing. But the value of this approach increases substantially as the number of caves that can act as climate proxies increases.
It is not a simple task. Because each cave is unique, the scientists have to study it for several years before they understand it well enough to use it as a proxy. For example, they must establish how long it takes water to move from the surface down to the cave, a factor that can vary from days to months.
Efforts to use the mineral deposits in caves as climate proxies began in the 1990’s. Currently, there are only a few dozen scientists who are pursuing this line of research and they have analyzed the mineral deposits from 100 to 200 caves in this fashion.
Warren D. Sharp from the Berkeley Geochronology Center, Ralf Bennartz, professor of earth and environmental sciences at Vanderbilt, Neil P. Kelley from the Smithsonian National Museum of Natural History and Vanderbilt Laboratory Manager and doctoral student Aaron Covey also contributed to the study, which was supported by the Vanderbilt International Office, National Science Foundation grant OISE-0968354 and additional awards and grants from the Cave Research Foundation, the Geological Society of America and the Swiss National Science Foundation.
Video
Reference:
Christopher G. Myers, Jessica L. Oster, Warren D. Sharp, Ralf Bennartz, Neil P. Kelley, Aaron K. Covey, Sebastian F.M. Breitenbach. Northeast Indian stalagmite records Pacific decadal climate change: Implications for moisture transport and drought in India. DOI: 10.1002/2015GL063826