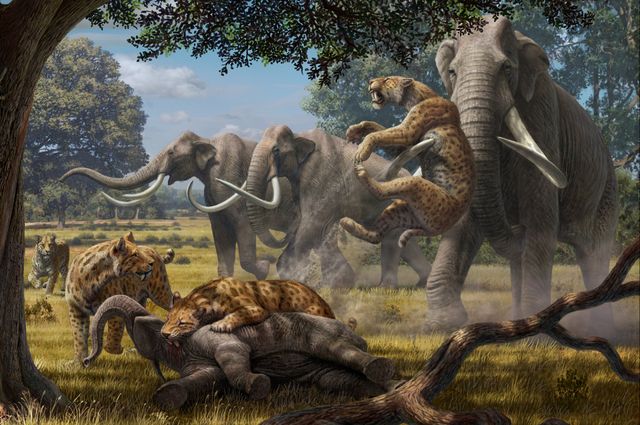
Violent attacks by carnivores are illustrated. Credit: Painting by Mauricio Anton
For years, evolutionary biologists have wondered how ecosystems during the Pleistocene epoch survived despite the presence of many species of huge, hungry herbivores, such as mammoths, mastodons and giant ground sloths. Observations on modern elephants suggest that large concentrations of those animals could have essentially destroyed the environment, but that wasn’t the case.
Now life scientists from UCLA and other universities in the U.S. and England argue that the ecosystem was effectively saved by predatory animals that helped keep the population of large herbivores in check. Their findings, reported this week in the journal Proceedings of the National Academy of Sciences, show that intense, violent attacks by packs of some of the world’s largest carnivores — including lions much larger than those of today and sabertooth cats — went a long way toward shaping ecosystems during the Pleistocene epoch.
The research could have implications for animal conservation efforts today. The paper notes that many of today’s endangered species evolved during or before the Pleistocene epoch, and under very different conditions from today’s.
“Recreating these [Pleistocene] communities is not possible, but their record of success compels us to maintain the diversity we have and rebuild it where feasible,” the researchers write.
Led by Blaire Van Valkenburgh, a UCLA evolutionary biologist, the researchers found that, because of their larger size, the ancient carnivores were very capable of killing young mammoths, mastodons and other species, which prevented those animals from destroying ecosystems in the Pleistocene, which ended about 11,700 years ago. The paper suggests that the extinction of the largest of the “hyper-carnivores” (such as lions, sabertooth cats and hyenas) during the late Pleistocene almost certainly was caused by the disappearance of their preferred prey, including young mega-herbivores (the mammoths, mastodons and giant ground sloths).
“Based on observations of living mega-herbivores, such as elephants, rhinos, giraffes and hippos, scientists have generally thought that these species were largely immune to predation, mainly because of their large size as adults and strong maternal protection of very young offspring,” said Van Valkenburgh, who holds an appointment in the UCLA College’s department of ecology and evolutionary biology.
“Data on modern lion kills of elephants indicates that larger prides are more successful and we argue that Pleistocene carnivore species probably formed larger prides and packs than are typically observed today — making it easier for them to attack and kill fairly large juveniles and young adult mega-herbivores.”
The scientists used several different techniques and data sources to estimate information about the Pleistocene animals. Among them:
Examining fossils of their teeth and applying the ratio of tooth size to body mass of today’s animals. (This led the researchers to estimate that the extinct species were between 50 and 100 percent larger than today’s tigers, African lions and spotted hyenas.)
Synthesizing data on the relationship between the age and shoulder height of the extinct animals versus shoulder height and body mass of today’s elephants.
Analyzing data on 50,000 instances of kills in the wild to estimate the typical and maximum sizes of the prey of Pleistocene carnivores.
Many scientists had thought that the populations of mammoths, mastodons and giant ground sloths were limited through evolution by changes in reproductive timing in response to shortages in resources like food and water.
Today’s large predators benefit their ecosystems in part by providing carcasses that feed an array of smaller species. The same was true during the Pleistocene, when keeping mega-herbivore populations in check meant that there was more vegetation for smaller mammals and birds. The predators might even have had indirect effects on river ecosystems, because the banks of the rivers were not being denuded by mega-herbivores and less likely to erode.
The study’s co-authors are Matthew Hayward of Bangor University College of Natural Sciences in England, William Ripple of Oregon State University, Carlo Meloro of Liverpool John Moores University in England and V. Louise Roth of Duke University.
Reference:
Blaire Van Valkenburgh, Matthew W. Hayward, William J. Ripple, Carlo Meloro, and V. Louise Roth. The impact of large terrestrial carnivores on Pleistocene ecosystems. PNAS, October 26, 2015 DOI: 10.1073/pnas.1502554112
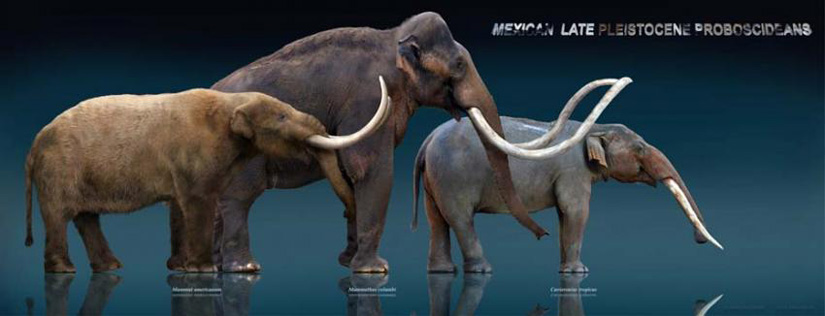
Three elephant ancestors: the mastodon, mammoth and gomphothere. When these animals went extinct, vegetation and small mammal populations radically changed. Credit: Sculptures by Sergio de la Rosa
Large land animals such as elephants, wildebeest and other big plant-eaters are worth preserving in part because their disappearance could have permanent effects on the plants and animals they coexist with, according to an analysis of past large-mammal extinctions in North and South America.
University of California, Berkeley, paleontologists and colleagues at Stanford University, the University of Chile and California State University Sacramento, investigated the ecosystem impacts of large animal, or megafauna, extinctions in the Americas since humans moved in about 15,000 years ago. They found long-lasting changes in the local landscape after the largest of the land animals — among them mammoths and mastodons — disappeared.
Recent studies, for example, point to the loss of mammoths, native horses and other large animals in Alaska and the Yukon as the reason a productive mix of forest and grassland turned into unproductive tundra that dominates the region today.
Similarly, mammoth and mastodon extinctions in the Pacific Northwest and the northeastern United States seemed to have changed the vegetation and, in the western United States, decreased the diversity of small mammals, said study leader Anthony Barnosky, a UC Berkeley professor of integrative biology.
“Ecological studies have shown that if you pull out a top predator or a key herbivore today, you get dramatic change in the ecosystem,” he said. “Our study makes it clear that in the past, such changes have lasted for thousands of years. These extinctions really do permanently change the dynamics. You can’t go back.”
Yet not all extinctions left major changes in the ecosystem, the researchers found. Ground sloth and glyptodont extinctions in South America had no noticeable effect on the vegetation of Patagonia and the Pampas, for example.
“It’s not a simple story, where if you pull out a big beast you see major changes in the landscape,” Barnosky said. “It’s actually dependent on how big a beast you pull out, and also how that beast interacts with the plants and animals in the area, and what other plants and animals are there. It depends on what the animal does for a living.”
Elephant browsers
Large browsers like mammoths, mastodons and today’s elephants, for example, eat small trees and shrubs and uproot or break down trees, as well as trample and churn the soil. Other large herbivores, such as bison and moose, also keep shrubs in check and change soil structure and nutrients as they feed, defecate and urinate. As a result, such large-bodied plant eaters play a key role in keeping forests from overrunning grasslands, as the group found happened in North America.
“You see the impact of defaunation today in Africa, where the removal of elephant populations has led to these shrubby, scraggly acacias filling the savanna landscape,” said co-author Charles Marshall, a professor of integrative biology and director of the UC Museum of Paleontology. “Africa today, with its elephant populations, seems to fit the model of North America with its mammoths and mastodons.”
In the pampas of Argentina, however, the disappearance of the South American mastodon had no observable effect on the flora and fauna, probably because the weather and rainfall are not conducive to forests.
Understanding these relationships can be important today in targeting conservation efforts, said co-author Emily Lindsey, a UC Berkeley postdoctoral fellow.
“This information could be useful to conservation biologists in pinpointing which types of ecosystems are likely to be affected by global climate change, and which would be most responsive to conservation and restoration efforts,” she said.
Barnosky, Lindsey and their colleagues will publish their study this week in the online early edition of the journal Proceedings of the National Academy of Sciences.
Barnosky cautioned that the current study captures only the grossest environmental changes resulting from large-mammal extinctions, since not all ecosystem changes leave traces in the fossil record.
“The fact that we saw the impact we saw is a pretty robust conclusion that these ecosystems were changed forever by the disappearance of these animals,” he said. “Anytime you pull a big animal out of an ecosystem, there are some pretty huge effects, as demonstrated by ecologists today. But they might not be recognizable in the fossil record.”
Extinctions followed human invasion of New World
Barnosky said the current study was sparked by ecological studies today of the impacts of adding or subtracting large mammals such as deer and elk from American landscapes, or removing wildebeest and elephants in Africa. He and his colleagues decided to look for traces of ecosystem change resulting from the loss of about three-quarters of all large land mammals that roamed North and South America after humans arrived from Siberia about 15,000 years ago. About 60 large mammals died out in North America about 12,000 years ago, probably due to a combination of hunting and changing climate. Mammoths and mastodons, as well as horses, elk, moose and carnivores such as the saber tooth cat and the dire wolf, disappeared.
It took longer for South American species to go extinct, but the continent eventually lost about 99 species, including llamas, giant armadillos, saber toothed cats, giant ground sloths and mastodon relatives called gomphotheres.
In three areas of North America — northwestern and northeastern America and Alaska/Yukon — fossils showed not only a change in plant communities with an increase in fire frequency, but also a decrease in diversity of small mammals. A study conducted by co-author and Stanford University professor Elizabeth Hadly, for example, documented a decrease of small rodent diversity in California after these extinctions, allowing the most widespread “weedy” mouse species to dominate the landscape.
“The take-home message from western North America is that grazing and browsing by extinct megafauna such as proboscideans favored open-habitat mosaics,” Hadly said. “When these ecosystem engineers became extinct at the end of the Pleistocene, denser deciduous forests established. The loss of the mosaic Pleistocene habitats in western North America led to a decrease in the diversity of small mammals.”
“If we lose some of these big-bodied animals that are threatened with extinction today, we lose a lot more than those animals, we lose the entire ecosystems of which they are part,” Barnosky said. “We are moving into new territory in terms of what the planet will look like.”
Co-authors with Barnosky, Marshall, Hadly and Lindsey are UC Berkeley graduate student Natalia Villavicencio, Enrique Bostelmann of the University of Chile and James Wanket of California State University, Sacramento. The work was funded by the National Science Foundation (Earth Sciences Grant 1148181).
Reference:
Anthony D. Barnosky, Emily L. Lindsey, Natalia A. Villavicencio, Enrique Bostelmann, Elizabeth A. Hadly, James Wanket, and Charles R. Marshall. Variable impact of late-Quaternary megafaunal extinction in causing ecological state shifts in North and South America. PNAS, October 26, 2015 DOI: 10.1073/pnas.1505295112
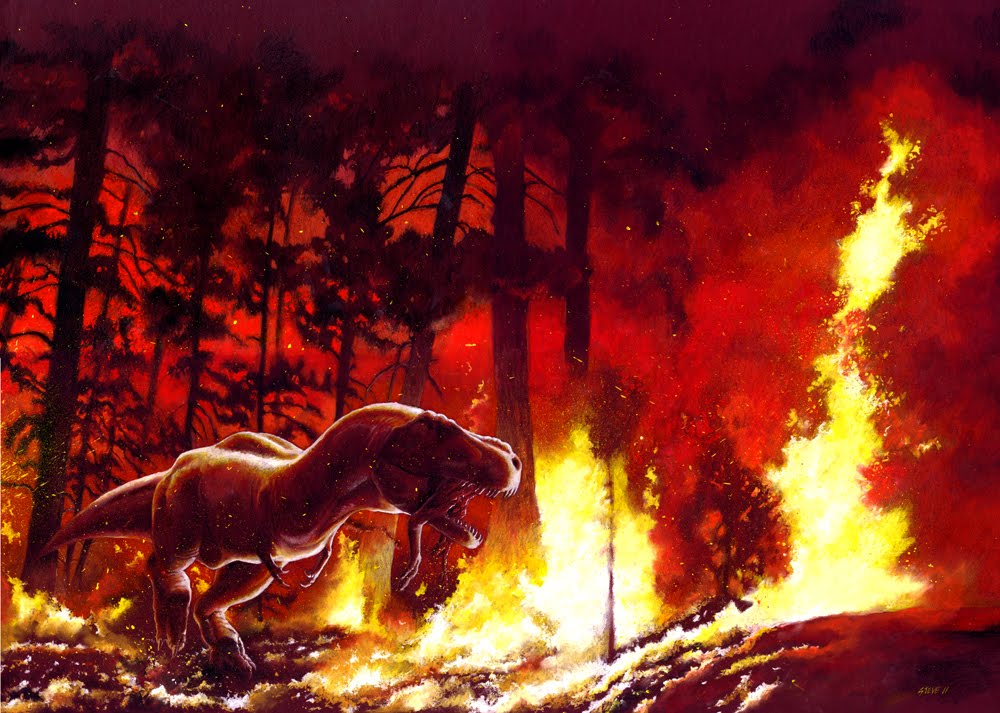
T-Rex in a Forest Fire Credit: SharkeyTrike/Deviantart
Scientists from the Department of Earth Sciences at Royal Holloway, University of London together with colleagues from the USA, Russia and China, have discovered that forest fires across the globe were more common between 300 and 250 million years ago than they are today. This is thought to be due to higher level of oxygen in the atmosphere at that time.
The study which was published in the journal Frontiers in Plant Science, found that peats that were to become coal contained high levels of charcoal that could only be explained by the high levels of fire activity.
The team used the data from charcoal in coal to propose that the development of fire systems through this interval was controlled predominantly by the elevated atmospheric oxygen concentration (p(O2)) that mass balance models predict prevailed. At higher levels of p(O2), increased fire activity would have rendered vegetation with high moisture contents more susceptible to ignition and would have facilitated continued combustion.
In the study they examine the environmental and ecological factors that would have impacted fire activity and conclude that of these factors p(O2) played the largest role in promoting fires in Late Paleozoic peat-forming environments and, by inference, ecosystems generally, when compared with their prevalence in the modern world.
Professor Andrew Scott, one of the lead authors, said: “High oxygen levels in the atmosphere at this time has been proposed for some time and may be why there were giant insects and arthropods at this time but our research indicates that there was a significant impact on the prevalence and scale of wildfires across the globe and this would have affected not only the ecology of the plants and animals but also their evolution.”
Professor Scott and his colleagues and students at Royal Holloway have pioneered the study of fire in Earth’s deep past. Professor Scott, added: “We have been able to show that wildfire was an important element in Earth System many hundreds of millions of years before the arrival of humans.”
Reference:
Ian J. Glasspool, Andrew C. Scott, David Waltham, Natalia Pronina, Longyi Shao. The impact of fire on the Late Paleozoic Earth system. Frontiers in Plant Science, 2015; 6 DOI: 10.3389/fpls.2015.00756
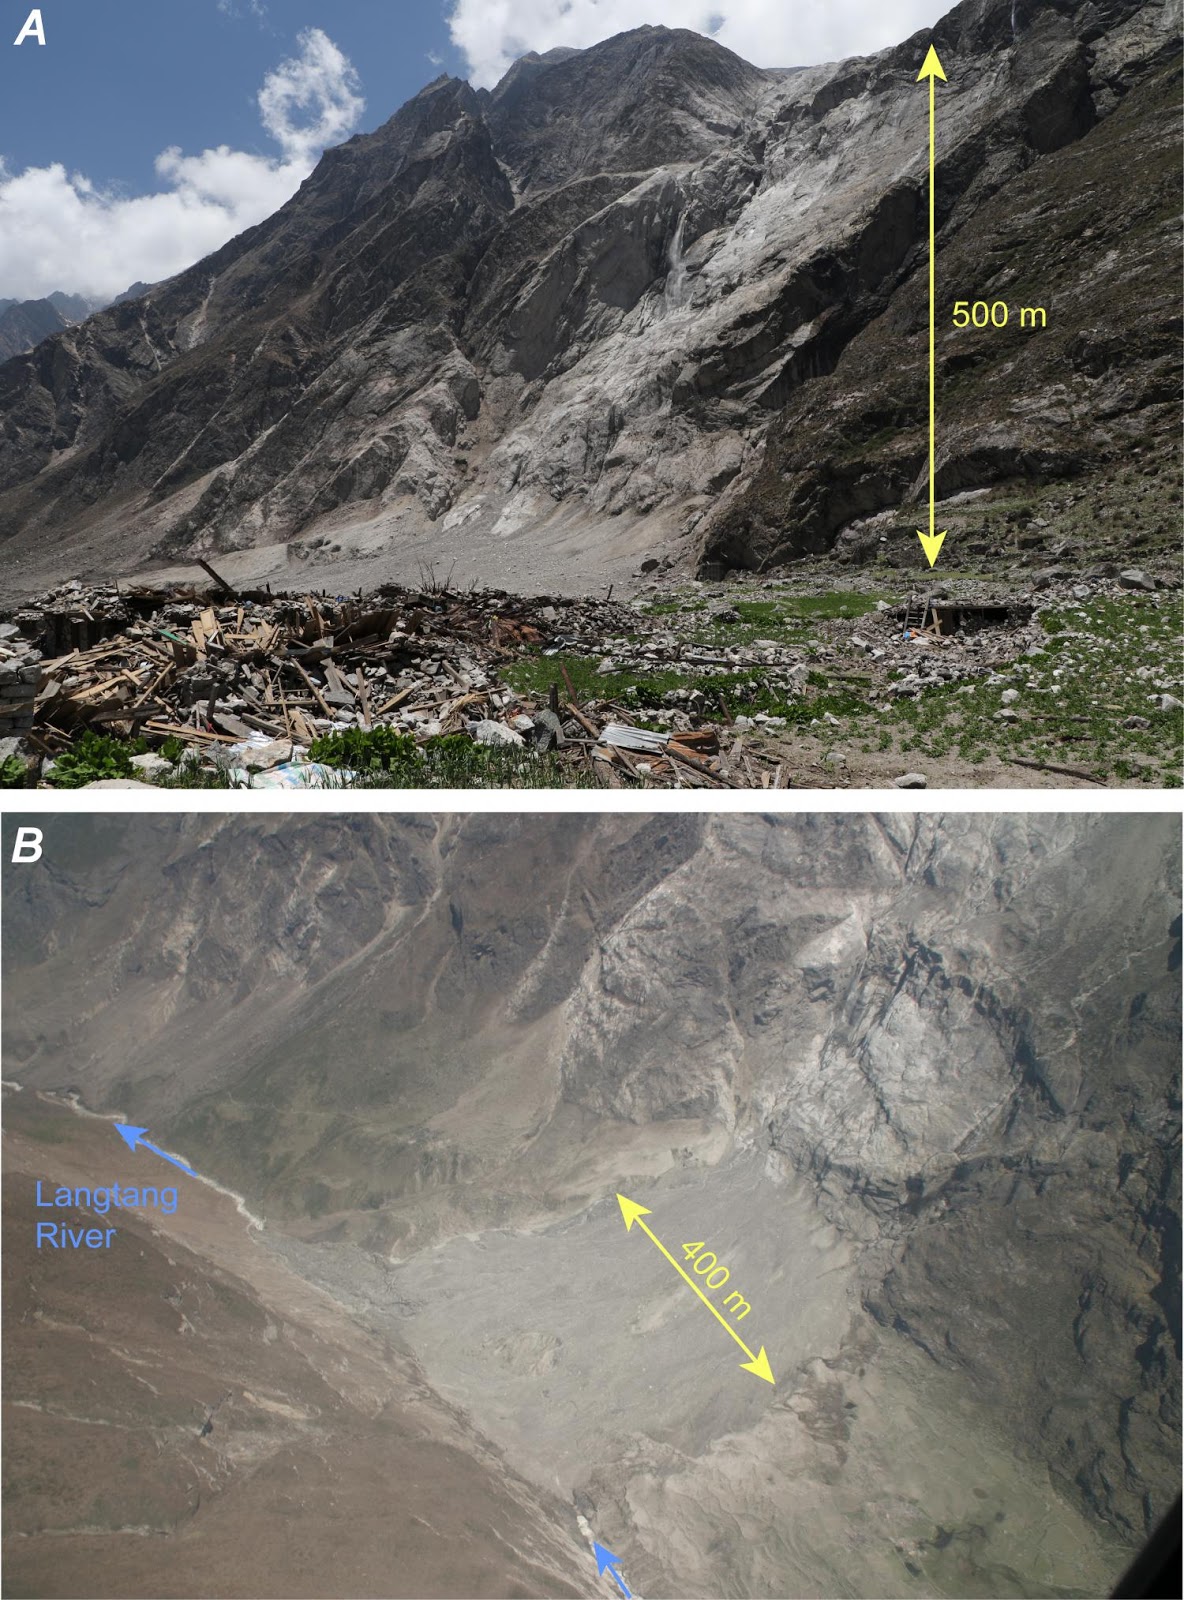
The largest and most destructive landslide resulting from the April earthquake was the Langtang landslide, which began as a snow and ice avalanche. Debris became airborne off a 500-meter-tall cliff, reaching velocities of 100 meters per second. Credit: Reproduced from USAID-supportedwork by the USGS
The April 2015 Gorkha earthquake that struck Nepal produced less damage and weaker shaking than might be expected from a magnitude 7.8 quake in the area, according to a group of ten new articles published this week in Seismological Research Letters.
In a region of major faulting and massive tectonic plate collisions, with an especially dense population centered on the country’s capital of Kathmandu, seismologists had expected the worst from a major earthquake. And the quake and its major aftershocks did cause more than 8,000 fatalities, 22,000 injuries and hundreds of thousands of collapsed or damaged buildings. But the damage was not as catastrophic as expected, said U.S. Geological Service geophysicist Susan Hough, guest editor of the Gorkha focus section papers.
“The world community of earthquake professionals expected an earthquake like this directly beneath Nepal would take a far greater toll on property and lives. So it poses a major challenge to understand and explain the shaking from the earthquake,” said Hough.
Hough and others conclude that the shaking was less damaging than expected because of how the Kathmandu valley’s “bowl” of ancient lake bed sediments responded. “We know that valleys like this greatly amplify shaking from small and moderate earthquakes, but in very large earthquakes, something that we call a nonlinear effect kicks in,” Hough said.
“We can think about the valley as a bowl of jello that shakes, but in a very big earthquake a valley is more like a bowl of sand,” she explained. “When shaken strongly, the grains aren’t able to transmit energy in the same way that a solid rock does.”
Other papers in the SRL focus section map out the main earthquake’s rupture within the Himalayan area’s complex fault system, concluding that the fault broke adjacent to the rupture from a 1934 magnitude 8.0 -8.4 earthquake. The historical and geologic record suggests that much larger earthquakes have occurred both east and west of the fault.
Scientists studying the earthquake combined data from the sparse seismic stations within Nepal with global observations and swift fieldwork. In some cases, the data were collected by cutting-edge “earthquake science from space,” such as the before-and-after satellite imagery of the region, reported in a study by Jet Propulsion Laboratory researcher Sang-Ho Yun and colleagues. Newspaper and other accounts provided a wealth of information that Earth Observatory of Singapore researcher Stacey Martin and his colleagues considered in detail to map out the severity of shaking throughout Nepal and neighboring countries.
In other cases, researchers were quickly out on to the precarious roads of Nepal to survey effects of the earthquake in Kathmandu as well as rural villages . Robb Moss of Cal Poly Pomona and his colleagues examined soil liquefaction within Kathmandu valley and several key landslide sites, and University of Nevada researcher Steven Angster and his team confirmed initial indications that the fault rupture did not reach the surface.
Eric Thompson, Brian Collins and Randy Jibson of the USGS collected extensive data on landslides, one of the largest causes of infrastructure damage from the earthquake. Thompson said that the scientists consulted satellite images and news reports and undertook extensive helicopter surveillance to assess the severity and locations of landslides throughout the mountainous region.
A study led by Rémy Bossu of the European Mediterranean Seismological Centre suggests that smartphone apps and Twitter also played a unique role in collecting information about the earthquake and especially its aftershocks. Bossu and colleagues analyzed how the LastQuake smartphone app gathered eyewitness accounts of the earthquake and provided hazard updates, using thumbnail images instead of more elaborate text surveys to collect information from its users. With this input from the app users, LastQuake was able to publish a map of the earthquake’s epicenter within minutes of the mainshock.
Bossu and colleagues say the two-way, real-time communication channel offered by apps like LastQuake can be useful to understanding the extent of an earthquake, as well as offer rapid advice to people to avoid the immediate risks from shaking.
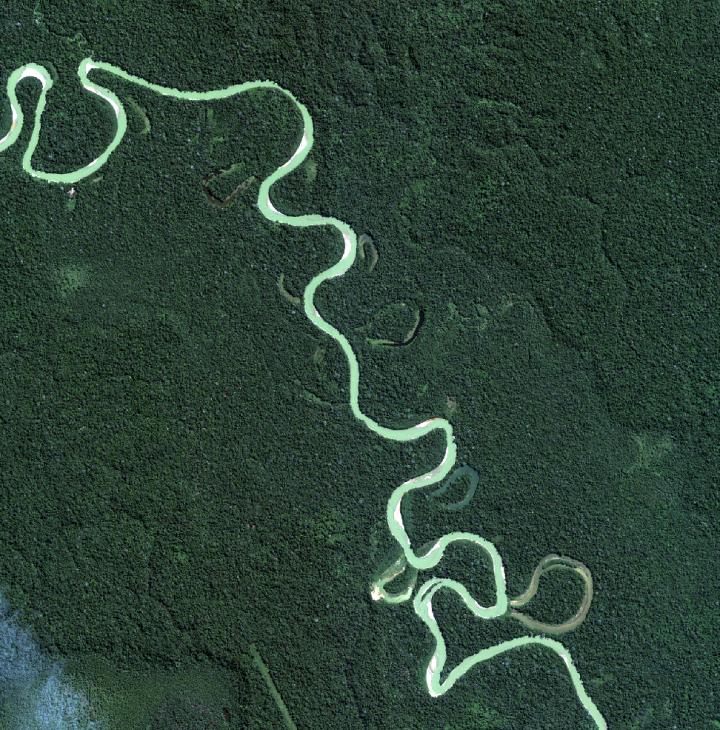
This is a false-color satellite image of a western Amazonian river showing abandoned ox-bow channels and ox-bow lakes where the river has meandered in its floodplain. Beyond the limit of the ox-bows is the terra firme forest. A new study finds the impact of people living near rivers on the surrounding land is less than earlier theories had suggested. Credit: Florida Institute of Technology
New research led by Florida Institute of Technology shows that the impacts of indigenous people prior to European contact impacted riverside forests, but that such impacts were largely limited to an area within a day’s walk from a river.
The findings by the international team of archaeobotanists, paleoecologists and ecologists will be published online in the paper “Anthropogenic influence on Amazonian forests in prehistory: An ecological perspective” on Oct. 28 in the Journal of Biogeography.
The new research, conducted using plant fossils, estimates of mammal density, remote sensing and human population modeling, reinforces that Amazonian forests may be very vulnerable to disturbance by logging , mining and other large enterprises. The study refutes an emerging theory from some archaeologists and anthropologists that Amazonian rain forests are the result of ancient managed landscapes – a notion that undermines the ecological view of these forests as fragile ecosystems.
“Nobody doubts the importance of human actions along the major waterways,” said Mark Bush, professor of biological sciences at the Florida Institute of Technology and the lead author of the paper. “But whether humans had a greater impact on the ecosystem than any other large mammal has yet to be established in much of western Amazonia.”
Dolores Piperno, curator of archaeobotany and South American archaeology at the American Museum of Natural History and co-author of the study, said the recent emphasis on Amazonia as a manufactured and domesticated landscape overstates the facts.
“At nearly the size of the continental United States, Amazonia is a vast landscape with considerable biotic and abiotic heterogeneity. Extrapolations being made from relatively few archaeological sites mainly located along water courses as to the overall effect of prehistoric human occupation must be tempered in the face of available and yet-to-be-accumulated empirical data.”
“This is not a debate solely about what happened over 500 years ago,” Bush added. “The implications are very relevant to modern society and conservation.”
He said if the forests were heavily modified prior to European arrival and have regrown in just over one tree generation to such a vast level of biodiversity, this rapid recovery could be used as a justification to log forests aggressively. If, however, humans had a very limited influence, as their findings have shown, then logging and other major disturbances would have long-lasting, possibly irreversible, consequences on the forest.
“This distinction becomes increasingly important as policy makers decide whether to enforce or relax protections of areas already designated as parks, including the Yasuni of Ecuador and protected areas in Brazil,” said Bush, who has spent almost 30 years conducting research in the Amazon.
The study is also relevant in shaping our understanding of the extent to which the Amazon Basin might offset carbon dioxide produced in industrialized areas. The young forest implied by the man-made-disturbance scenario leads to a large potential for further uptake of carbon, helping to offset carbon emissions from other regions. Bush and colleagues, however, project that very little of Amazonia will behave this way, suggesting that the massive amount of carbon held in Amazonian forest is most likely already close to a maximum capacity.
The researchers conclude that pre-European land-use by native peoples in Amazonia was highly variable, with dense settlements and profound forest disturbance over a relatively small proportion of the basin, leaving large areas little affected by human activity.
Reference:
Mark B. Bush1, Crystal H. McMichael, Dolores R. Piperno, Miles R. Silman, Jos Barlow, Carlos A. Peres, Mitchell Power and Michael W. Palace. Anthropogenic influence on Amazonian forests in pre-history: An ecological perspective. DOI: 10.1111/jbi.12638
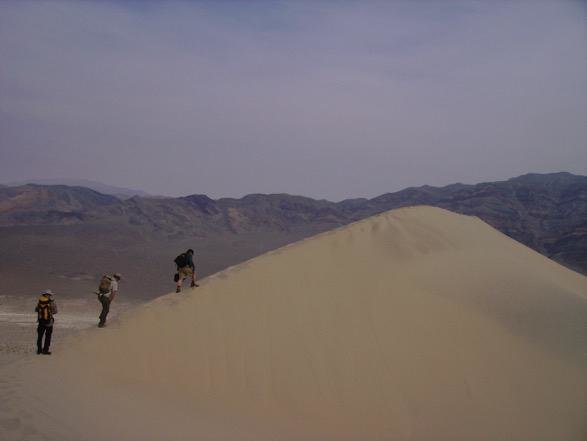
This image shows researchers climbing with heavy field equipment to the top of the 200m-high Eureka Dune in Death Valley National Park, Calif. Credit: Vriend
Avalanching sand from dune faces in Death Valley National Park and the Mojave Desert can trigger loud, rumbling “booming” or short bursts of “burping” sounds — behaving as a perfectly tuned musical instrument.
This sound is persistent and the dunes “sing” in frequencies ranging from 70 to 105 Hertz, with higher harmonics. Prior to the onset of a nearly monotone booming, burps of sound of smaller amplitude occur over a significantly broader span of frequencies.
As a group of researchers from California Institute of Technology and the University of Cambridge report in AIP’s journal Physics of Fluids, from AIP Publishing, they discovered that the “booming” and “burping” correspond to the transmission of a class of different waves within the dune.
“Intrigued by these odd sounds emanating from the dunes, Nathalie Vriend researched this phenomenon as a Ph.D. student at Caltech with Melany Hunt, a professor of mechanical engineering. They collaborated with Rob Clayton, a professor of geophysics and borrowed a variety of geophysical scientific instruments to go out and “probe” the dunes’ acoustical mystery. Vriend has since moved to the University of Cambridge.”
“During approximately 25 individual summer field days, on very hot and sandy dunes in California, we probed booming dunes,” Vriend said, “and they slowly revealed their underlying physics to us.”
The group focused on discovering how, specifically, the booming and burping sounds travel through sand. “We measured the wave propagation characteristics, which include the motion of grains and frequency and energy of the emitted sound. This, in turn, revealed that booming and burping are two different, but related, phenomena,” she said.
To do this, they used geophones to measure seismic vibrations within the ground, which are similar to microphones that pick up acoustical vibrations — sound pressure — in the air. “The waves travelling through the dune move individual grains of sand, which exert a force on the geophone that we use for measurements,” Vriend added.
It turns out that “burping sounds correspond to a surface Rayleigh wave, travelling radially along the surface of the dune in a nonlinear manner,” noted Vriend. “This means that relations between these properties are complicated because of the influence of individual grains.”
The loud booming sounds, she pointed out, originate from “linear P-waves that travel volumetrically and are reflected from internal layers inside the actual dune.”
The group was somewhat surprised to learn that for both booming and burping, the surface and volumetric signals are present with their own characteristic features and properties — but the dominant signals are different.
Another revelation was being able to excite the natural dune resonance on one occasion by simply providing an “impulse” on the dune surface. “A blow of a hammer on a plate triggered a natural resonance — around the booming frequency — inside the dune, which is something we’ve never seen described in literature,” Vriend said.
Since the group’s study revealed that burping and booming emissions are different acoustic phenomena, governed by different physical principles, it may also help explain some differences in measurements and interpretations regarding singing sand dunes made during the past decade.
“More broadly, seismic surveys for oilfield exploration or earthquake investigations tend to rely on length scales that are usually much larger than those used by our study,” she added. “Even if the study is done on a sandy substrate, the ‘effective medium’ response is recorded and individual grain interactions aren’t usually relevant. Our work illustrates the dual behavior of wave propagation when scales are reduced to a length where small- and larger-scale wave propagation converge.”
Vriend is now a Royal Society Research Fellow within the Department of Applied Mathematical and Theoretical Physics at the University of Cambridge. Her research group is working on a variety of projects to probe and solve other mysteries of granular dynamics.
One of these projects involves exploring “the granular dynamics during avalanching and its influence on the origin of structure in sand dunes in greater detail,” she said. “Our recent work involves using field and laboratory techniques to probe natural avalanching and sorting on large desert dunes in Qatar.”
Reference:
N.M. Vriend, M.L. Hunt and R.W. Clayton. Linear and Nonlinear Wave Propagation in Booming Sand Dunes. Physics of Fluids, 2015 DOI: 10.1063/1.4931971
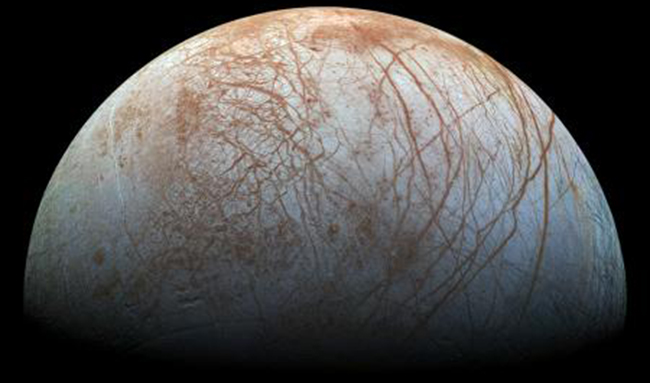
The puzzling, fascinating surface of Jupiter’s icy moon Europa looms large in images taken by NASA’s Galileo spacecraft. Credit: NASA/JPL-Caltech/SETI Institute
Jupiter’s moon Europa is believed to possess a large salty ocean beneath its icy exterior, and that ocean, scientists say, has the potential to harbor life. Indeed, a mission recently suggested by NASA would visit the icy moon’s surface to search for compounds that might be indicative of life. But where is the best place to look? New research by Caltech graduate student Patrick Fischer; Mike Brown, the Richard and Barbara Rosenberg Professor and Professor of Planetary Astronomy; and Kevin Hand, an astrobiologist and planetary scientist at JPL, suggests that it might be within the scarred, jumbled areas that make up Europa’s so-called “chaos terrain.”
“We have known for a long time that Europa’s fresh icy surface, which is covered with cracks and ridges and transform faults, is the external signature of a vast internal salty ocean,” Brown says. The areas of chaos terrain show signatures of vast ice plates that have broken apart, shifted position, and been refrozen. These regions are of particular interest, because water from the oceans below may have risen to the surface through the cracks and left deposits there.
“Directly sampling Europa’s ocean represents a major technological challenge and is likely far in the future,” Fischer says. “But if we can sample deposits left behind in the chaos areas, it could reveal much about the composition and dynamics of the ocean below.” That ocean is thought to be as deep as 100 kilometers.
“This could tell us much about activity at the boundary of the rocky core and the ocean,” Brown adds.
In a search for such deposits, the researchers took a new look at data from observations made in 2011 at the W. M. Keck telescope in Hawaii using the OSIRIS spectrograph. Spectrographs break down light into its component parts and then measure their frequencies. Each chemical element has unique light-absorbing characteristics, called spectral or absorption bands. The spectral patterns resulting from light absorption at particular wavelengths can be used to identify the chemical composition of Europa’s surface minerals by observing reflected sunlight.
The OSIRIS instrument measures spectra in infrared wavelengths. “The minerals we expected to find on Europa have very distinct spectral fingerprints in infrared light,” Fischer says. “Combine this with the extraordinary abilities of the adaptive optics in the Keck telescope, and you have a very powerful tool.” Adaptive optics mechanisms reduce blurring caused by turbulence in the earth’s atmosphere by measuring the image distortion of a bright star or laser and mechanically correcting it.
The OSIRIS observations produced spectra from 1600 individual spots on Europa’s surface. To make sense of this collection of data, Fischer developed a new technique to sort and identify major groupings of spectral signatures.
“Patrick developed a very clever new mathematical tool that allows you to take a collection of spectra and automatically, and with no preconceived human biases, classify them into a number of distinct spectra,” Brown says. The software was then able to correlate these groups of readings with a surface map of Europa from NASA’s Galileo mission, which mapped the Jovian moon beginning in the late 1990s. The resulting composite provided a visual guide to the composition of the regions the team was interested in.
Three compositionally distinct categories of spectra emerged from the analysis. The first was water ice, which dominates Europa’s surface. The second category includes chemicals formed when ionized sulfur and oxygen¬¬–thought to originate from volcanic activity on the neighboring moon Io¬¬–bombard the surface of Europa and react with the native ices. These findings were consistent with results of previous work done by Brown, Hand and others in identifying Europa’s surface chemistry.
But the third grouping of chemical indicators was more puzzling. It did not match either set of ice or sulfur groupings, nor was it an easily identified set of salt minerals such as they might have expected from previous knowledge of Europa. Magnesium is thought to reside on the surface but has a weak spectral signature, and this third set of readings did not match that either. “In fact, it was not consistent with any of the salt materials previously associated with Europa,” Brown says.
When this third group was mapped to the surface, it overlaid the chaos terrain. “I was looking at the maps of the third grouping of spectra, and I noticed that it generally matched the chaos regions mapped with images from Galileo. It was a stunning moment,” Fischer says. “The most important result of this research was understanding that these materials are native to Europa, because they are clearly related to areas with recent geological activity.”
The composition of the deposits is still unclear. “Unique identification has been difficult,” Brown says. “We think we might be looking at salts left over after a large amount of ocean water flowed out onto the surface and then evaporated away. “He compares these regions to their earthly cousins. “They may be like the large salt flats in the desert regions of the world, in which the chemical composition of the salt reflects whatever materials were dissolved in the water before it evaporated.”
Similar deposits on Europa could provide a view into the oceans below, according to Brown. “If you had to suggest an area on Europa where ocean water had recently melted through and dumped its chemicals on the surface, this would be it. If we can someday sample and catalog the chemistry found there, we may learn something of what’s happening on the ocean floor of Europa and maybe even find organic compounds, and that would be very exciting.”
A researcher from the University of Southampton will join an international team of scientists, setting sail from Southampton today (26 October 2015) for the middle of the Atlantic Ocean, to drill rocks that were once part of the Earth’s mantle.
Dr Gaye Bayrakci, a postdoctoral researcher from Ocean and Earth Science, is part of IODP Expedition 357 on board the Royal Research Ship James Cook that will explore the Atlantis Massif, a 4,000 metre high underwater mountain on the Mid-Atlantic Ridge, which is part of the world’s longest mountain chain. This the first time a UK research ship will be used for scientific ocean drilling.
Dr Bayrakci and the team will collect cores of rocks and take fluid and microbial samples using two specialist robot drills. During the six-week expedition, the team plan to drill at 11 sites in water depths of 720 to 1,770 metres and recover cores between 50 and 70 metres in length.
Dr Bayrakci said: “Scientifically the Atlantis Massif is remarkable because it is made up of rocks that were recently part of the Earth’s mantle. In the presence of seawater these rocks produce the greenhouse gas methane, hydrogen and heat, among other things. Such rock reactions are exciting because they provide possible energy sources to fuel life in the absence of sunlight. The reactions occurring at the Atlantis Massif today may be similar to conditions found on other planets, or early in Earth’s history.”
The expedition is part of the International Ocean Discovery Program (IODP) and will be conducted by the European Consortium for Ocean Research Drilling (ECORD). The two rock drills installed on the RRS James Cook are designed and operated by the British Geological Survey and MARUM, the Center for Marine Environmental Sciences in Bremen, Germany. It is the first scientific ocean drilling expedition to use this type of remotely operated seabed rock drilling technology. When successful, this will open a whole new avenue to investigating the ocean floor that complements traditional approaches using very large drill ships such as the JOIDES Resolution.
Professor Damon Teagle, from Ocean and Earth Science at the University of Southampton and a veteran of numerous scientific ocean drilling expeditions, said: “It is very exciting for IODP to be using a British ship and new technologies to investigate the strange reactions that occur when seawater meets rocks of the upper mantle. It is a long time since a scientific ocean drilling expedition sailed from a UK port. It is great that this cruise departed from the National Oceanography Centre Southampton, which hosts a large scientific community that uses ocean drilling as a key tool to unravel how our planet operates and past climate and tectonic cycles.”
At the end of the Pleistocene, mammoths of Northern Eurasia used to experience chronic mineral hunger. They became extinct due to geochemical stress arising from deep abiotic changes in ecosystems. Most likely, they were receiving insufficient amounts of essential chemical elements. This hypothesis was developed by TSU paleontologists and based on a large-scale, 15-year research project. Detailed information was published in Archaeological and Anthropological Sciences. Sergei Leshchinsky, head of the Laboratory of Mesozoic and Cenozoic continental ecosystems at Tomsk State University is the first author.
Researchers around the world seek the causes of the extinction of the most prominent late Pleistocene megafauna, the mammoths. One theory holds that the species declined due to changes in microclimate and anthropogenic pressure, and possibly the simultaneous effect of both factors. There are other much less popular theories of their extinction: infectious diseases or the impacts of celestial objects. However, little research exists exploring geochemical environmental changes where mammoths lived.
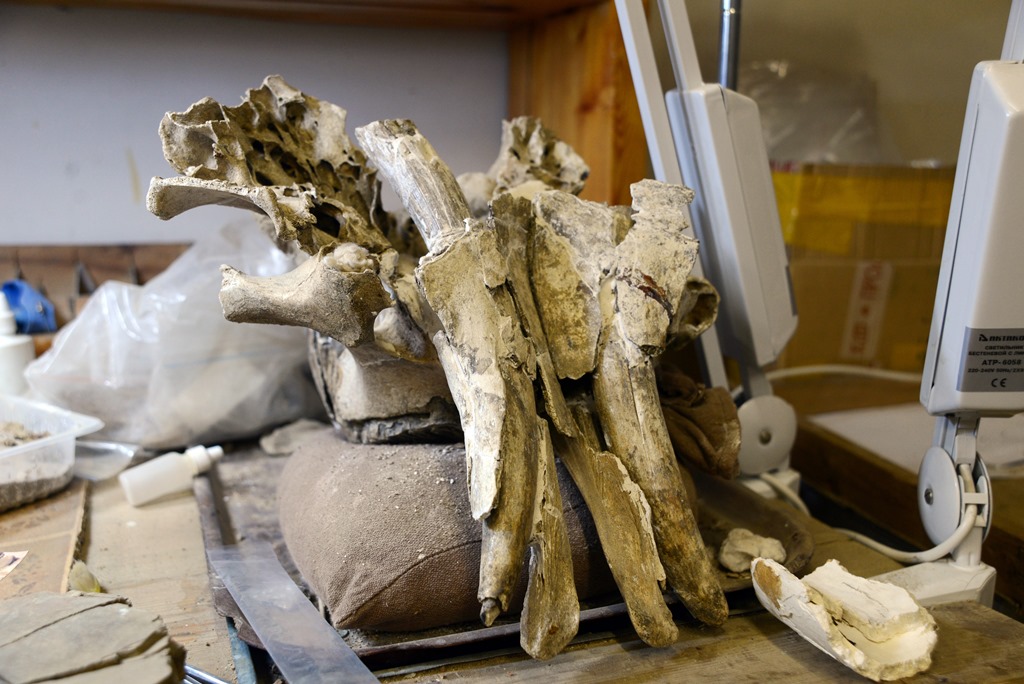
Investigating the remains of late mammoths, researchers frequently find obvious signs of skeletal diseases such as osteoporosis, osteofibrosis, osteomalacia (softening and bending of bones), arthrosis, and other joint diseases, according to Leshchinsky. He emphasizes that articular surfaces of extremity bones in some individuals appear to be damaged and mutilated by these diseases. Osteoporosis was observed in 90 percent of specimens in separate collections.
These diseases resulted in significant trauma in the animals, which suffered sprains and fractures, even at very low loads. Mammoths with broken limbs or spines could not find food in sufficient quantities and could not follow the herd. Such individuals died quickly, hunted by predators. As a result, nature was stronger than the giant animals, and mammoths became instinct.
From 2003 to 2013, Leshchinskiy analyzed over 23,500 bones and teeth of mammoths in Northern Eurasia to identify the symptoms of enzootic diseases. The destructive changes were revealed with the help of a magnifying glass (×10), in polished sections and histological sections under a stereomicroscope (magnification up to 200×) and a scanning electron microscope (magnification up to 10,000×), as well as by roentgenoscopy and densitometry.
Lechinsky investigated mammoth bones and teeth discovered in beast solonetzs lacustrine-alluvial localities of Russia, Poland and the Czech Republic.
The beast solonetz is the Russian term for a ground surface area characterized by a high content of certain macro- and micro-elements; as such, it has a broader interpretation than “salt lick,” “mineral lick” and “mineral source.” Within the confines of the beast solonetz, animals eat soil and rocks and drink mineralized water from springs to maintain homeostasis, which is equivalent to the definition of “lithophagy.”
Most chemical elements are necessary for animals to maintain the health of bones, muscles, skin, sensory systems, and others. Mineral starvation can result in mass deaths.
Lithophagy or geophagy as practiced by primates is a com¬mon phenomenon; there is little doubt, therefore, that the mammoth was the largest of all lithophages in the Late Pleistocene of Northern Eurasia. This assertion is also confirmed by the frequent availability of mineral substances in the gastro-intestinal tracts of mammoth carcasses and their coprolites, sometimes reaching 90 percent of their mass.
Acute mineral starvation became widespread in mammoths and other large mammals. Mammoths’ particular vulnerability to mineral starvation is reflected by specific mammoth “cemeteries” of the late Pleistocene.
TSU researchers found widespread destructive changes in mammoth bones and teeth in up to 70 percent or more of the remains in different collections. In most cases, multiple conditions due to mineral starvation accompany one another, which may indirectly show the same causes. The most common disease observed is osteoporosis. Researchers note rarefaction in all age groups including infant mammoths, which means that disease development began in the prenatal period, since females suffered from mineral starvation. Above all, since bone resorption in osteoporosis may be mild, the real proportion of remains with signs of osteodystrophy is likely to be higher than can be detected via superficial examination.
Why did mammoths and other large herbivores with large skeletons experience strong geochemical stress during the Pleistocene?
At that time, there was a considerable expansion of acidic and acidic gley geochemical landscapes, resulting in a drastic deficiency of Ca, Mg, Na, P, I, Co, Cu, Se, Zn and other vital chemical elements. The change in habitat is closely associated with the drastic replacement of favourable Ca-Mg-Na landscapes with acidic and acidic-gley ones.
Acidic-gley landscapes reached maximum range by the end of the Pleistocene, and are still the predominant landscape in most of Northern Eurasia today. This transition can be explained by the general neotectonic lift, which was subsequently followed (17-10 ka BP) by changes in the macroclimate, which became more humid and warmer. As a result, coastal lowlands were flooded and central areas were swamped (degrading permafrost being one of the reasons). The soils of the high plains and foothills were heavily leached due to a lowering of the ground water levels and increased precipitations. In this situation, only rare beast solonetz landscapes could have served as geochemical oases where the large herbivores could satisfy their mineral hunger. However, by the early Holocene, there may have been an insufficient number of these oases to support the viability of isolated mammoth populations. A similar abiotic scenario may prevail for North America, where mammoths went extinct at the same time.
Mammoth body size decrease and massive destructive changes in their bones and teeth indicate the negative impact of the abiotic environment. Osteoporosis, osteomalacia, and diseases of the joints indicate a metabolic disorder of alimentary nature.
The analysis of the clinical picture of the diseases deserves special attention—how rapidly did the disturbances in homeostasis and the formation of osteodystrophy occur in unfavourable geochemical conditions? Based on this study, it appears that the destructive changes developed rapidly. Extensive bone pathologies such as those found in the Taymyrskiy mammoth or in the Shestakovo-Kochegur, Berelyokh, Lugovskoe and Krakow Spadzista Street mammoth populations are incompatible with a long developmental period. Conditions of smaller and fewer geochemical oases and winter drinking water restricted to snow or acidic swampy-ground waters suggests that the “later” mammoths may have suffered from chronic mineral deficiency for six to 10 months a year.
“It is highly probable that these severe conditions lasted for more than 15 thousand years and may have proven fatal for the largest representatives of the terrestrial fauna at high latitudes,” Leshchinskiy said. The wool lyrhinoceros and cave bear may have suffered the same fate. Other large herbivores like bisons, horses and deer, have overcome the Holocene border, perhaps due to greater mobility, although with a significant reduction of habitat and population size. Large cats and hyenas likely went extinct due to drastic reduction of nutritional resources at the time of the disintegration of the single “mammoth” ecosystem.
The very high percentage of skeleton pathologies suggests a high murrain among mammoths, irrespective of anthropogenic impact, which could not lead to species extermination throughout its huge territory. Man was a witness and one of the participants in the natural process of the Pleistocene megafauna’s extinction.
Reference:
Sergey Leshchinskiy. Enzootic diseases and extinction of mammoths as a reflection of deep geochemical changes in ecosystems of Northern Eurasia, Archaeological and Anthropological Sciences (2014). DOI: 10.1007/s12520-014-0205-4
There is an infinite amount of energy lying right beneath our feet. It is a renewable and stable energy source – free of CO2 emissions. Researchers are now planning to drill deep into the Earth to extract it. If they succeed it will be a major technological breakthrough. Credit: Illustration: Doghouse
There is an inexhaustible amount of energy lying right beneath our feet. It is a renewable and stable energy source — free of CO2 emissions. Researchers are now planning to drill deep into the Earth to extract it. If they succeed it will be a major technological breakthrough.
Ninety-nine per cent of planet Earth has a temperature in excess of 1,000 degrees Celsius as a result of residual heat inherited from the Earth’s primordial origins and the breakdown of radioactive materials. This heat can be transformed into energy — and there is more than enough to go round.
“If we succeed in drilling for and extracting even just a small fraction of this geothermal heat, it will be enough to supply the entire planet with energy — energy that is clean and safe.” So said Are Lund, a senior research scientist at SINTEF Materials and Chemistry, in 2010.
Today, five years later, researchers and technologists from all over Europe are joining forces to pursue a common cause — to make sure that the world’s potentially most energy-rich geothermal well becomes a reality. The well will be drilled in Larderello in Tuscany, and EUR 15.6 of research funding has been earmarked for the project.
Global green energy producer Enel Green Power is heading the project called DESCRAMBLE (Drilling in dEep, Super-CRitical AMBients of continentaL Europe), where the aim is to extract the maximum possible energy from the well. The extreme heat in the rocks deep beneath northern Italy means that both pressures and temperatures will be right at the limit of what even innovative technologies can currently cope with. However, such conditions also mean that the energy output from such a well can be as much as ten times greater than for standard geothermal wells, and will help to ensure that the new well will be very profitable if the project succeeds.
“SINTEF’s contribution to this EU project is to run simulations of the drilling operation and to develop a new instrument to monitor the well,” says Øyvind Stamnes, a researcher and Project Manager at SINTEF ICT. Taming supercritical fluids Achieving the project’s aim is a challenging assignment. No-one has previously managed to control a well under such extreme high temperature and pressure conditions. Specially developed equipment will be needed. — “One of the major uncertainties is the presence of what we call supercritical fluids,” explains physicist Roar Nybø at SINTEF Petroleum Research. At depths of two to three kilometres in the Earth’s interior, ambient physical conditions change dramatically. Temperature increases. And so does the pressure. Something very special happens when temperatures reach 374 degrees and the pressure 218 times the air pressure at the surface. We encounter what we call supercritical water.
It isn’t a liquid, and nor is it steam. It occurs in a physical form incorporating both phases, and this means that it takes on entirely new properties. Supercritical water behaves like a powerful acid, and will attack anything — including electronics and drilling equipment. “In a TV fantasy series it would probably be called ‘dragon water’,” chuckles Nybø, whose background is as a theoretical particle physicist. Where he comes from, it’s not uncommon to be contemplating even more extreme conditions than this project faces.
But the ‘dragon water’ has its advantages too. It can transport from depth up to ten times more energy that normal water and steam can achieve in a standard geothermal well. It also flows more easily through rock fractures and pores. If researchers can succeed in controlling the forces involved without the technology breaking down, we may be on the verge of a deep Earth technological breakthrough.
If all this wasn’t enough, supercritical water can also transport valuable minerals to the surface in solution. This could provide potential incidental revenues. “The dragon of the deep may thus help us open a real treasure trove,” says Nybø.
Technology transfer is the key
There’s no doubt that the drilling operation requires highly advanced technical preparation. For this reason, the ‘major breakthrough’ must first be modelled in a specially designed simulator. This has already been developed by SINTEF for drilling operations for oil and gas, and is similar to an aircraft flight simulator.
It will now be installed with all available data about the planned well and its location. This will enable the researchers to take virtual “test flights” of the entire drilling operation.
“This approach to the exploitation of geothermal heat has much in common with oil recovery,” says Nybø. “Oil exploration wells have been drilled to depths of more than ten kilometres,” he says. “So there are good reasons for involving Norwegian drilling technologists in this project. Geothermal heat quite simply represents a unique opportunity for the oil and gas sector to advance its technological development. We strongly believe that this know-how can become a key Norwegian export,” says Nybø, and lists the following similarities:
Seismic technology is used to identify the correct well location.
New equipment must be developed to withstand extreme conditions.
The drilling operation itself.
Getting the fluid to flow from depth through the rocks.
Flushing the well to remove sediment.
Recovery of the fluid (maintaining production and keeping the reservoir pressure stable throughout the lifetime of the well).
Unpredictable conditions
This isn’t the first time that researchers and geologists have been looking deep into the Earth’s interior to extract the inexhaustible amounts of energy it contains. Iceland has been exploiting geothermal heat for many years. The power station at Krafla has been using steam from below ground to generate electricity since 1977. Its annual production is 480 GWh, which is approximately equivalent to the annual electricity consumption of a town the size of Lillehammer.
In fact, twenty-five per cent of Iceland’s energy needs are sourced from geothermal heat, while the remainder is hydroelectric.
In 2009 a team of Icelandic researchers set up some drilling equipment on the volcanic island. Their aim was to drill to 4,000 metres and establish the world’s most effective geothermal well. In a frenzy of creativity, they named it DDP-1. Unfortunately, things didn’t go to plan — the geologists encountered lavas as shallow as 2,000 metres depth. But, after two years of tests and studies the well had to be shut down, without having generated any electricity at all. However, the Icelanders learned a great deal from their attempt, and have not given up in their efforts to win the race to drill the world’s deepest geothermal well. They are currently planning a new well, with a new name — DDP-2.
But their hoped for victory is now under threat from the Italians, who are armed with Norwegian oil and gas expertise and experience, and more favourable geological conditions. “Our well will encounter completely different types of rocks,” explains Nybø.
“In Iceland the geology is “open” all the way down to the Earth’s mantle, while in Italy the heat accumulates in so-called ‘hot spots’. Areas such as this are also found in many other places in Europe, and success may lead to opportunities for the efficient exploitation of geothermal heat in many other locations around the world,” he says.
Crystal ball
But to achieve this success, the supercritical water must be controlled. In order to predict as accurately as possible how this fluid will behave both at depth in the well and on its journey to the surface, the entire process has to be modelled in a so-called ‘flow simulator’. Such tools have been employed in the oil and gas industry for many years to obtain more accurate predictions about how oil, gas and water are transported through subsea pipelines. After years of research, technologists have succeeded in controlling processes such as corrosion, hydrate (ice-like plugs) formation, and wax deposits in pipelines. The flow simulator ‘LedaFlow’ makes it possible to analyse more detailed and complex flow scenarios involving so-called ‘multiphase transport’, where oil, gas and water all flow along the same pipeline.
“The simulator is able to visualise waves, fluid plugs, phase transitions and hydrate precipitation, and can contribute towards reducing the risk of these factors causing operational difficulties,” explains Bjørn Tore Løvfall at SINTEF Materials and Chemistry. “It also provides valuable information such as how much pressure support (gas injected into a reservoir) a well needs to deliver streamlined production. The simulator will now be used to provide a better insight into how supercritical water will behave,” he says. Read more about the LedaFlow simulator here: Link to ‘Stroman genome diet’ (Flow at great depth).
Løvfall continues: “Today, the LedaFlow simulator is used by engineers who design, scale and operate subsea multiphase transport systems,” he says. “It provides its users with a chance to “zoom in” on whatever aspect of flow they may want to visualise along a pipeline, enabling them to obtain detailed simulations of flow conditions at predefined locations.
The simulator is the result of one of SINTEF’s most comprehensive research projects ever. However, for the DESCRAMBLE project it will be expanded with the aim of predicting the behaviour of supercritical water. This will entail developing an entirely separate module designed to answer questions such as how deep in the well the water makes its phase transformation, and how it behaves as it rises to the surface carrying its maximum energy load.
Developing a ‘super tool’
While work on the modelling and simulation of the advanced drilling operation continues, yet another research team will be getting to grips with some completely different problems.
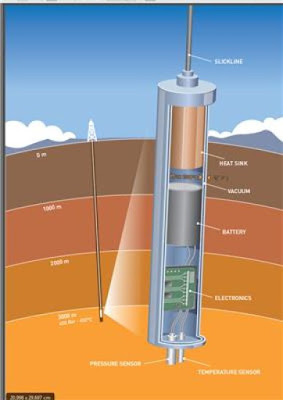
SINTEF ICT has a research group working under the inspiring name of ‘Harsh Environment Instrumentation’. Øyvind Stamnes is a member of this group, working on the development of a specialised probe that will be lowered into the well to log and measure how the well behaves.
The drilling operation must be monitored in detail, so that if something unforeseen happens we can gain as much control of the well as possible. But how is it possible to build a system of electronics and sensors capable of withstanding temperatures of up to 450 degrees, and pressures that would destroy most instruments that we are familiar with today? One thing is certain. Such equipment is not currently on the market.
“We know that when the well reaches its maximum temperature, all known measuring instruments will stop functioning,” says Stamnes. The electronics will encounter temperatures high enough to cause short circuits due to excessive leakage flows,” says Øyvind Nistad Stamnes.
So how do you get around that? With a combination of custom-designed high-temperature electronics enclosed in a kind of thermos flask. Or in technical language — A Dewar flask. The container must be well insulated to protect the measuring instrument which has to record conditions in the well over periods of several hours in ambient temperatures of 450°C, and 250°C in the interior of the container.
“You could say that our approach involves developing instruments enclosed in space suits,” explains Stamnes. Building electronics for high-temperature applications is nothing new to researchers at SINTEF ICT. They’ve been looking into this since the 1990s. But the challenge now will be to assemble an array of components that can all withstand the high temperatures — with something of a safety margin built in as well. “For example, there are no batteries on the market that can withstand temperatures greater than 200°C.. So we’re working together with manufacturers to produce batteries that are safe to use at even higher temperatures,” says Stamnes.
The project was launched in Pisa in Italy in mid-May, and drilling is planned to start in autumn 2016. If everything goes as planned, this well once completed will provide ten times the output of a standard shallow geothermal well.
The project will give a radical boost to the competitiveness of green, geothermal energy because the drilling costs for a well of this type are between 30 and 50 per cent of the total costs. “This makes for exciting times here at SINTEF ICT,” says Stamnes as he returns to his lab to continue working on the “space suit for sensors” on which the entire project relies.
FACTS: An inexhaustible source
Low-temperature geothermal energy involves the extraction of geothermal heat from between 150 and 200 metres below the surface. At these depths, the temperature is between six and eight degrees Celsius. Such energy is extracted using ground source heat pumps combined with energy wells, and is currently produced in large volumes. High-temperature geothermal heat has tremendous potential because it represents an inexhaustible, and virtually emissions-free, energy source.
Heat energy can be found in a variety of rocks in the Earth’s crust. The deeper we drill, the hotter it gets. About half of the heat at depth originates from primordial heat derived from the Earth’s mantle (the layer immediately below the crust) and core. The remaining fifty per cent is derived from the continuous breakdown of radioactive material in the Earth’s crust. All this heat is transported towards the surface through the overlying formations.
Oil companies are currently making healthy profits from the recovery of oil from reservoirs at depths of 5,000 metres, where temperatures can reach up to 170 degrees Celsius. At deeper levels, drilling operations and materials integrity are faced with major challenges. Steel becomes brittle, and materials such as plastics and electronics either fail or start to melt. Normally, electronics only function for a short time at temperatures greater than 200 degrees Celsius. These problems must be resolved if the extraction of high-temperature geothermal heat is to become a going concern.
Facts: A democratic source
One of the unique properties of geothermal heat is that it exists all over the world. Potentially, everyone on the planet can exploit this democratic energy source that is both stable and independent of variations in climatic conditions at the Earth’s surface. The depths to which we have to drill to achieve the desired temperatures will vary from country to country. This is due to variations in the thickness of the Earth’s crust and the geothermal gradient. Here in Norway, temperature increases by about 20 degrees per kilometre, while in other parts of the world, this may be as high as 40 degrees per kilometre. The average is about 25. Countries currently leading the way in the generation of electricity from geothermal sources are the USA, the Philippines, Mexico, Indonesia and Italy. Iceland is lower down the list at number eight.
Facts about the DESCRAMBLE project The aim of the project is to achieve a ten-fold increase in output compared with traditional, shallow geothermal wells. For comparison, the Krafla geothermal energy plant on Iceland generates 480 GWh annually. This is equivalent to the electricity consumption of a town the size of Lillehammer. Participating countries: Italy, Germany and Norway. The Norwegian research partners are SINTEF ICT located in Oslo, and SINTEF Petroleum Research in Trondheim and Bergen. Coordinator: Italy’s Enel Green Power, represented by Ruggeri Brentani Duration: 36 months following project kick-off in May Total budget: EUR 16,615,957, funded via the EU programme Horizon 2020.
Note: The above post is reprinted from materials provided by SINTEF.
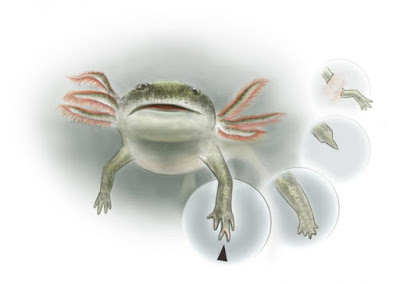
This illustration shows a reconstruction of the fossil amphibian Micromelerpeton credneri from the Early Permian of Germany. Regeneration of the forelimb is indicated in the sequence and results in a hand with malformations. Credit: Kalliopi Monoyios – Science Illustration and Communication
A team of paleontologists of the Museum für Naturkunde Berlin, the State University of New York at Oswego and Brown University shows in a new study of fossil amphibians that the extraordinary regenerative capacities of modern salamanders are likely an ancient feature of four-legged vertebrates that was subsequently lost in the course of evolution.
Salamanders are extraordinary among modern four-legged vertebrates in showing an astonishing capacity to regenerate limbs, tails, and internal organs that were injured or lost due to amputation repeatedly and throughout their entire lifespan. The mechanisms controlling this high regenerative capacity are the focus of a large field of research driven by the hope to some day apply the findings to human medicine.
Salamanders are not only special with respect to their ability to regenerate their limbs, but also in the way their legs develop initially during embryogenesis. Generally limb development follows a highly conservative process in all tetrapods (four-legged vertebrates) — from frogs to humans — despite the enormous variety of forms and functions vertebrate limbs have.
“Salamanders on the contrary form their fingers in a reversed order compared to all other four-legged vertebrates, a phenomenon that has puzzled scientist for over a century” said Dr. Nadia Fröbisch, first author of the study. “The question that we wanted to address was, if and how this different way of developing limbs is evolutionarily linked with the high regenerative capacities.”
The regenerative capacities of salamander tails are likewise remarkable.
“As opposed to lizards, which usually can only regenerate their tails once or twice and merely replace the vertebral column in the tail with a cartilaginous rod, salamanders regenerate a genuine tail including vertebral elements, the neural spine, and associated musculature” said Dr. Constanze Bickelmann, co-author on the study.
Not just salamanders?
Classically the high regenerative capacities of salamanders were considered something special and derived for salamanders. New data from the fossil record offers a new perspective on the evolution of the enormous regenerative capacities of modern salamanders. In their studies the authors investigated different amphibian groups of the Carboniferous and Permian periods (ca. 300 million years ago) and showed that different groups of fossil tetrapods were able to regenerate their legs and tails in a way previously exclusively known from modern salamanders.
“We were able to show salamander-like regenerative capacities in both — fossil groups that develop their limbs like the majority of modern four-legged vertebrates as well in groups with the reversed pattern of limb development seen in modern salamanders,” said Dr. Jennifer Olori of State University of New York at Oswego, co-author on the study.
The fossils used in the study derive from the collections of a number of Natural history museums among them the Museum für Naturkunde Berlin.
“The amphibians fossilized under excellent conditions for preservation and are represented by a large number of individuals and developmental stages” explains Florian Witzmann of Brown University, co-author on the study. “This extraordinary fossil record allowed for the detailed study of limb development and regeneration.”
And that led to important insights about the evolution of the regeneration capacity. Many lineages may have lost it.
“The fossil record shows that the form of limb development of modern salamanders and the high regenerative capacities are not something salamander-specific, but instead were much more wide spread and may even represent the primitive condition for all four-legged vertebrates” says Nadia Fröbisch. “The high regenerative capacities were lost in the evolutionary history of the different tetrapod lineages, at least once, but likely multiple times independently, among them also the lineage leading to mammals.”
The new findings are surprising, the researchers said, and may also be of interest for biomedical studies aiming to unravel the mechanisms responsible for salamander regeneration, as they indicate that not only salamander-specific factors may play a role for the high regenerative capacities, but also mechanisms that all land vertebrates carry within them due to their common evolutionary heritage.
Reference:
Florian Witzmann et al. Deep-time evolution of regeneration and preaxial polarity in tetrapod limb development. Nature, October 2015 DOI: 10.1038/nature15397
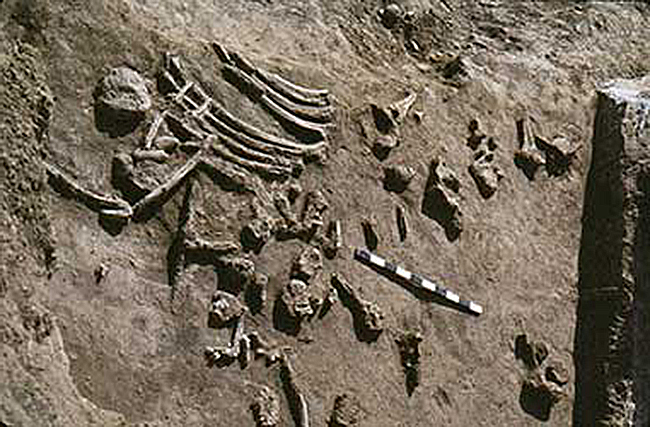
These are the remains of a mammoth that was killed by humans near LaPrele Creek in Converse County about 13,000 years ago. Credit: Danny Walker and State Archaeologist’s Office Photo
Radiocarbon analysis of the decline and extinction of large mammals in the Americas lends support to the idea that hunting by humans led to the animals’ demise—and backs the generally accepted understanding of when humans arrived in, and how they colonized, the Western Hemisphere.
Those findings by University of Wyoming researchers are reported this week in an article published in the Proceedings of the National Academy of Sciences, a major scientific journal. The study was conducted by Professor Todd Surovell and graduate student Spencer Pelton in UW’s Department of Anthropology; Professor Richard Anderson-Sprecher in the Department of Statistics; and Assistant Professor Adam Myers in the Department of Physics and Astronomy.
Their work supports a hypothesis forwarded in 1973 by well-known geoscientist Paul Martin that the chronology of the extinction of animals such as mammoths, mastodons, camels, horses and ground sloths in the Americas could be used to map the spread of humans through the New World.
“The heavy ecological footprint of human societies throughout prehistory is becoming increasingly apparent through a variety of environmental (indicators) independent of the archeological record,” the researchers wrote. “Past human societies have disrupted ecological communities in dramatic ways for many tens, if not hundreds of thousands, of years.”
The study involved compiling radiocarbon dates from fossils of now-extinct animals from North and South America, and looking at how those dates correspond with initial evidence of human colonization. The researchers found that, as Martin predicted, decline and extinction of the large mammals began between 13,300-15,000 years ago in Alaska and areas near the Bering Strait; between 12,900-13,200 years ago in the contiguous United States; and between 12,600-13,900 years ago in South America.
That supports the generally accepted understanding of how humans colonized the Americas: first, that they crossed from Siberia to Alaska across a Bering Strait land bridge; and then that they moved southward across North America and into South America. Hunting of the native large mammals is thought to have fueled rapid human population growth and expansion.
A number of hypotheses have been forwarded to explain the extinction of those animals. The “overkill hypothesis” connects their demise directly to overhunting by humans, and that is supported by the north-to-south extinction trend observed in the new study.
“… (T)he north to south time-transgressive pattern is striking, and, barring significant new data, it would be difficult to reconcile this pattern with extinction hypotheses that invoke a single climatic, ecological or catastrophic extinction mechanism across the entirety of the Americas,” the researchers wrote.
Still, they acknowledge that the issue isn’t completely settled. They note that the radiocarbon results show that the initial decline of large mammals in the far north began earlier than has been estimated by Martin and others, pointing to human colonization earlier than the current archeological record suggests; and that there is some evidence of isolated human populations in North America as early as 15,500 years ago, before significant declines in large mammal populations. Further study is needed to resolve those issues, the researchers say.
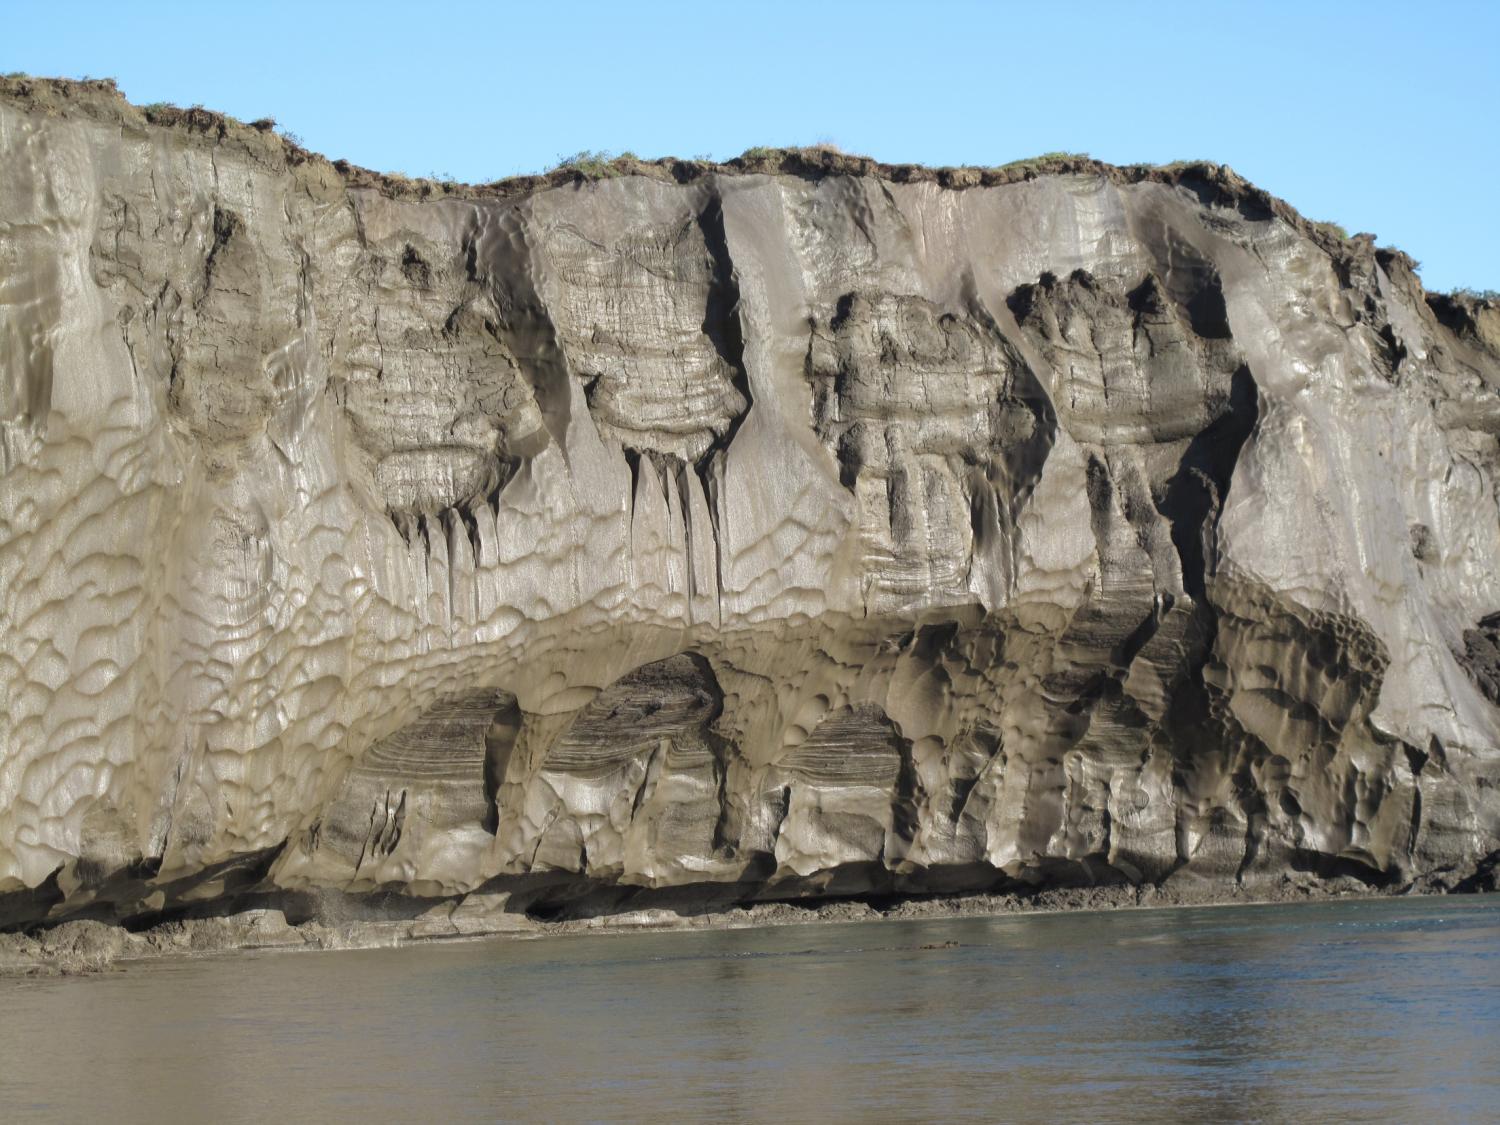
A general view of a 35-meter-high riverbank exposure of the ice-rich syngenetic permafrost (yedoma) containing large ice wedges along the Itkillik River in northern Alaska. Credit: Mikhail Kanevskiy; University of Alaska Fairbanks, Institute of Northern Engineering
Researchers from the U.S. Geological Survey and key academic partners including the University of Colorado Boulder have quantified how rapidly ancient permafrost decomposes upon thawing and how much carbon dioxide is produced in the process.
Huge stores of organic carbon in permafrost soils—frozen for hundreds to tens of thousands of years across high northern latitudes worldwide—are currently isolated from the modern day carbon cycle. However, if thawed by changing climate conditions, wildfire, or other disturbances, this massive carbon reservoir could decompose and be emitted as the greenhouse gases carbon dioxide and methane, or be carried as dissolved organic carbon to streams and rivers.
“Many scientists worldwide are now investigating the complicated potential end results of thawing permafrost,” said Rob Striegl, USGS scientist and study co-author. “There are critical questions to consider, such as: How much of the stored permafrost carbon might thaw in a future climate? Where will it go? And, what are the consequences for our climate and our aquatic ecosystems?”
At a newly excavated tunnel operated by the U.S. Army Corps of Engineers near Fairbanks, Alaska, a research team from USGS, CU-Boulder and and Florida State University set out to determine how rapidly the dissolved organic carbon from ancient (about 35,000 years old) “yedoma” soils decomposes upon soil thaw and how much carbon dioxide is produced.
Yedoma is a distinct type of permafrost soil found across Alaska and Siberia that accounts for a significant portion of the permafrost soil carbon pool. These soils were deposited as wind-blown silts in the late Pleistocene age and froze soon after they were formed.
“It had previously been assumed that permafrost soil carbon this old was already degraded and not susceptible to rapid decomposition upon thaw,” said Kim Wickland, the USGS scientist who led the team.
The researchers found that more than half of the dissolved organic carbon in yedoma permafrost was decomposed within one week after thawing. About 50 percent of that carbon was converted to carbon dioxide, while the rest likely became microbial biomass.
“What this study adds is that we show what makes permafrost so biodegradable,” said Travis Drake, the lead author of the research. “Immediately upon thaw, microbes start using the carbon and then it is sent back into the atmosphere.” Drake was both a USGS employee and a master’s degree student at CU-Boulder during the investigation.
The researchers attribute this rapid decomposition to high concentrations of low molecular weight organic acids in the dissolved organic carbon, which are known to be easily degradable and are not usually present at high concentrations in other soils.
These rates are among the fastest permafrost decomposition rates that have been documented. It is the first study to link rapid microbial consumption of ancient permafrost soil-derived dissolved organic carbon to the production of carbon dioxide.
An important implication of the study for aquatic ecosystems is that dissolved organic carbon released by thawing yedoma permafrost will be quickly converted to carbon dioxide and emitted to the atmosphere from soils or small streams before it can be transported to major rivers or coastal regions.
The research was recently published in the Proceedings of the National Academy of Sciences.
Note: Note: The above post is reprinted from materials provided by University of Colorado Boulder, Florida State University, National Science Foundatio.
QGIS (previously known as “Quantum GIS”) is a cross-platform free and open-source desktop geographic information system (GIS) application that provides data viewing, editing, and analysis capabilities.
Functionality
Similar to other software GIS systems QGIS allows users to create maps with many layers using different map projections. Maps can be assembled in different formats and for different uses. QGIS allows maps to be composed of raster or vector layers. Typical for this kind of software the vector data is stored as either point, line, or polygon-feature. Different kinds of raster images are supported and the software can perform georeferencing of images.
Advanced functions
QGIS provides integration with other open-source GIS packages, including PostGIS, GRASS, and MapServer to give users extensive functionality.[2] Plugins, written in Python or C++, extend the capabilities of QGIS. Plugins exist to geocode using the Google Geocoding API, to perform geoprocessing (fTools) similar to the standard tools found in ArcGIS, and to interface with PostgreSQL/PostGIS, SpatiaLite and MySQL databases.
Features
QGIS offers many common GIS functionalities provided by core features and plugins. A short summary of six general categories of features and plugins is presented below, followed by first insights into the integrated Python console.
View data
You can view and overlay vector and raster data in different formats and projections without conversion to an internal or common format. Supported formats include:
Spatially-enabled tables and views using PostGIS, SpatiaLite and MS SQL Spatial, Oracle Spatial, vector formats supported by the installed OGR library, including ESRI shapefiles, MapInfo, SDTS, GML and many more. See section Working with Vector Data.
Raster and imagery formats supported by the installed GDAL (Geospatial Data Abstraction Library) library, such as GeoTIFF, ERDAS IMG, ArcInfo ASCII GRID, JPEG, PNG and many more. See section Working with Raster Data.
GRASS raster and vector data from GRASS databases (location/mapset). See section GRASS GIS Integration.
Online spatial data served as OGC Web Services, including WMS, WMTS, WCS, WFS, and WFS-T. See section Working with OGC Data.
Explore data and compose maps
You can compose maps and interactively explore spatial data with a friendly GUI. The many helpful tools available in the GUI include:
QGIS browser
On-the-fly reprojection
DB Manager
Map composer
Overview panel
Spatial bookmarks
Annotation tools
Identify/select features
Edit/view/search attributes
Data-defined feature labeling
Data-defined vector and raster symbology tools
Atlas map composition with graticule layers
North arrow scale bar and copyright label for maps
Support for saving and restoring projects
Create, edit, manage and export data
You can create, edit, manage and export vector and raster layers in several formats. QGIS offers the following:
Digitizing tools for OGR-supported formats and GRASS vector layers
Ability to create and edit shapefiles and GRASS vector layers
Georeferencer plugin to geocode images
GPS tools to import and export GPX format, and convert other GPS formats to GPX or down/upload directly to a GPS unit (On Linux, usb: has been added to list of GPS devices.)
Support for visualizing and editing OpenStreetMap data
Ability to create spatial database tables from shapefiles with DB Manager plugin
Improved handling of spatial database tables
Tools for managing vector attribute tables
Option to save screenshots as georeferenced images
DXF-Export tool with enhanced capabilities to export styles and plugins to perform CAD-like functions
Analyse data
You can perform spatial data analysis on spatial databases and other OGR- supported formats. QGIS currently offers vector analysis, sampling, geoprocessing, geometry and database management tools. You can also use the integrated GRASS tools, which include the complete GRASS functionality of more than 400 modules. (See section GRASS GIS Integration.) Or, you can work with the Processing Plugin, which provides a powerful geospatial analysis framework to call native and third-party algorithms from QGIS, such as GDAL, SAGA, GRASS, fTools and more. (See section Introduction.)
Publish maps on the Internet
QGIS can be used as a WMS, WMTS, WMS-C or WFS and WFS-T client, and as a WMS, WCS or WFS server. (See section Working with OGC Data.) Additionally, you can publish your data on the Internet using a webserver with UMN MapServer or GeoServer installed.
Screenshots
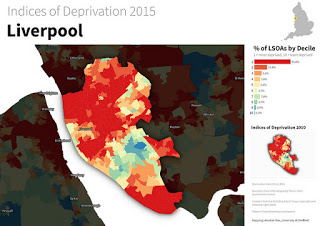
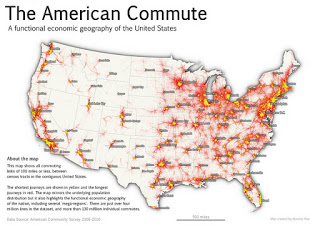
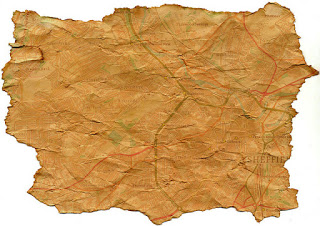
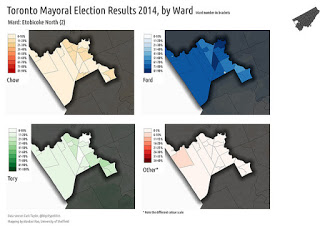
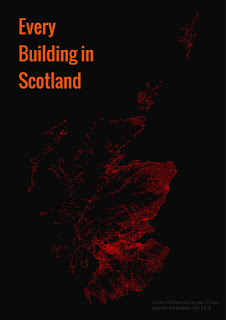
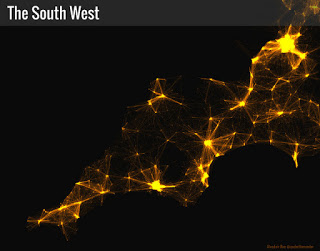
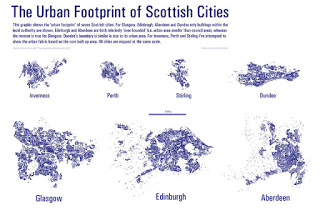
Deprivation in Liverpool (2015)Mapping the American CommuteOld-style parchment mapToronto Mayoral Election 2014All Buildings in ScotlandMigration in South West England, 2011Scottish City Footprints
Mac Installer Package for both OS X Mavericks (10.9), Mountain Lion (10.8) and Lion (10.7). KyngChaos QGIS download page
Download for Linux
For many flavors of GNU/Linux binary packages (rpm and deb) or software repositories (to add to your installation manager) are available. Please select your choice of distro below:
When people think of the Mesozoic, most people think of dinosaurs. Rightfully so: dinosaurs were major components of terrestrial ecosystems for almost all of the Mesozoic. Dinosaurs are charismatic; people are naturally fascinated by them, especially iconic taxa like Tyrannosaurus, Stegosaurus, and Ankylosaurus. One of the big questions in dinosaur paleontology, however, is what allowed this successful increase in diversity and body size throughout their reign. We know from the global fossil record that the Triassic was a time of odd archosauromorphs living alongside small and relatively rare dinosaurs.
We know that by the middle of the Jurassic Period these large diverse, dinosaur-dominated assemblages were in place. What happened in between? How did the small theropod dinosaurs of the Late Triassic become the large dominant predators of the Jurassic? The Early Jurassic terrestrial fossil record is sparse but there is one animal that can help: Dilophosaurus wetherilli. On Friday, 10/16/15, Adam Marsh, a PhD candidate at the University of Texas at Austin, gave a talk about his research on this animal. His research and a history of the animal itself are given here.
In 1942 a local Navajo man named Jessie Williams discovered several large theropod dinosaur skeletons near the small town of Tuba City, Arizona. Williams reported his find to paleontologist Charles Camp who in turn relayed the information to paleontologist Sam Welles. Recognizing that no dinosaurs had ever been published from the Kayenta Formation, he named it Megalosaurus wetherilli, after trader John Wetherill. It wasn’t until 1964 that a larger, more complete specimen was found. The skull of this newer, larger specimen preserved the famous crests for which Welles eventually named the genus: two-crested reptile. Dilophosaurus.
Despite the abundance of material (at least three individuals) the animal remained something of an enigma to paleontologists for decades. This is partially due to the fragmentary and often frustrating preservation found in the Kayenta Formation. Specimens tend to be crusted with hard mineral coatings and are often severely crushed by diagenetic processes. The bones of theropod dinosaurs, noted for their hollow nature, suffer under these preservational conditions. In addition, Welles’ 1984 seminal monograph on the taxon relied heavily on line drawings of specimens. In some cases Welles’ illustrations either oversimplified elements or showed portions of the anatomy that were actually not preserved. Welles also used composite information from the holotype, paratype, and the 1964 specimen to inform his descriptions, conclusions, and reconstructions. It was often not clear from what specimen he was drawing his data. In addition Welles believed, as of 1984, that the larger specimen may have represented a new taxon. While Welles changed his mind on this topic (based on his personal communication saved at the UCMP) after publication of his monograph, the idea limited what information was presented in this tome.
So where does this leave the state of early theropod evolution? Pretty unsettled. Welles did not use modern phylogenetic techniques to analyze the relationships of Dilophosaurus with respect to other taxa but subsequent authors have. Most have found it to lie outside of Averostra (a group of dinosaurs including Allosaurus, Ceratosaurus, Tyrannosaurus, and modern birds), with some placing it back within the Coelophysoidea, a group of predominately Late Triassic dinosaurs that also have Early Jurassic relatives. The biggest issue with these analyses is that they coded Dilophosaurus as a composite of all the specimens, just as Welles had described them. So what to do? As with most questions in paleontology, the answer is to find more fossils. This is exactly what happened at the University of Texas at Austin in the field seasons during the late 1990s and early 2000s. As Adam said to me, “Tim Rowe wanted a Dilophosaurus, so they went looking for Dilophosaurus.” They came back successful! At least two new specimens have been discovered by crews from the University of Texas at Austin. Together with Adam’s reanalysis of the specimens at the University of California Museum of Paleontology at Berkeley, California, we now have a better picture of what Dilophosaurus looked like and its relationships to other early theropods.
First of all: the crests. Everyone always falls in love with the crests, even in the horrid-looking Dilophosaurus from Jurassic Park. For some time, at least since the mid-1990s, there has been some question as to whether all specimens of Dilophosaurus possessed paired cranial crests. Although the new specimens housed in Texas don’t preserve that portion of the cranium, all other specimens do show a pair of crests on the top of the skull. Previously thought to be made of bony extensions of the nasal and lacrimal bones, reanalysis of the UCMP specimens also shows a contribution to the crest by the premaxilla! The bony protrusion seen on the posterior lacrimal portion of the crest also appears to be real and not a preservational artifact. There’s also apparently a large preorbital boss on the lacrimal, though exactly what that looked like in the specimen or in life was not discussed. Still – paleoartists take note! The limbs are also apparently highly derived; a poster at SVP by Phil Senter talked about the grappling capabilities of the arms of Dilophosaurus being well-suited for restraining large, struggling prey but I did not get a chance to see it since it was during one of my posters. Adam told me that in general he agrees with the idea that Dilophosaurus was using its forelimbs for prey manipulation but distortion of the limbs is likely due to postmortem processes.
With these new data, Adam performed a phylogenetic analysis using each specimen as an OTU, or operational taxonomic unit. He did this sequentially by starting with just the holotype specimen, then the paratype, and so forth, adding each additional specimen until all UCMP and TMM specimens were included in his matrix. What he found was that all specimens show up as more derived than Cryolophosaurus and just outside of Averostra. Even more significantly, they end up forming a monophyletic group by themselves. What we have been calling Dilophosaurus since the latter half of the 20th century appears to represent a valid fossil taxon. Suggestions of systematic or sexual differences, Adam said, are better explained as ontogeny and individual variation within a single taxon. This is a point that I agree with; I said the same thing in 2005 but I was approaching the problem in a different way than Adam has tackled the issue.
Another interesting point that Adam raised is that Dilophosaurus is now known from a much larger portion of the Kayenta Formation. Welles’ specimens were found very low in the section while the TMM material was recovered fairly high up. At least one of the TMM specimens was recovered from the Sarahsaurus type quarry near Gold Spring, in what is called the “middle third” of the formation. Some of the work that Adam is doing focuses specifically on figuring how much time this stratigraphic interval represents. By measuring stratigraphic sections and tying in the specimens that have been found, Adam hopes to see how these animals are related in time and space.
What lies in store for our friend Dilophosaurus in the near future? Adam wants to do some more laser ablation ICP-MS detrital zircon dating. His preliminary results suggest an age significantly younger than previous reports. He also wishes to study fossils that have previously been closely related to Dilophosaurus in past phylogenetic analyses. This will be especially useful for testing how theropod traits were acquired and modified in the early history of the clade, as well as for understanding how theropod dinosaurs acquired their large body sizes after the end-Triassic mass extinction. Outside of just Dilophosaurus, Adam is working on revising anatomical descriptions and systematic placements of some important but poorly understood Early Mesozoic taxa, such as Chindesaurus (a herrerasaurid from the Late Triassic of Arizona and New Mexico) and Sarahsaurus (an early sauropodomorph also known from the Kayenta Formation). By looking at his revised phylogenies and updated U-Pb dates for the Kayenta Formation, Adam hopes to be able to test ideas on vicariance and dispersal for the various North American saurischian clades as they recovered from the Triassic/Jurassic extinction.
Japanese guidelines could assist other tsunami prone nations
Japan’s lead in implementing sea defence improvements to guard against future disasters is an important reference point for other tsunami-prone nations, a study led by Plymouth University has suggested.
Before 2011, Japan was considered to be the best prepared nation on earth to withstand a large tsunami on its coasts, with structures specifically designed to afford sufficient protection to coastal settlements and critical infrastructure.
However, the size of the waves generated by the Great East Japan Earthquake in March that year led to sea defences and other coastal structures being overwhelmed, and in many cases completely or partially destroyed.
These included the brand new tsunami defence breakwater at Kamaishi, the sea dikes defending the international airport at Sendai, the 10m seawall in Tar? and, most critically, the seawall that protected the Fukushima Daiichi nuclear power station.
Since then, new engineering guidelines have been drawn up transforming Japan’s coastal defences, and devising new ways to keep its coastlines safe in the future.
But research in the International Journal of Disaster Risk Reduction suggests other nations in known tsunami risk areas have not yet followed suit.
The study, led by Dr Alison Raby, Associate Professor in the School of Marine Science and Engineering at Plymouth University, includes a full analysis of Japan’s history of coastal defence design and measures taken since 2011.
Dr Raby says: “After the 2004 Boxing Day tsunami in the Indian Ocean, much of the world’s efforts concentrated on tsunami early warning and evacuation. Such non-structural measures already in place in Japan were quite effective and meant that tsunami casualty figures – although exceeding 18,000 – were relatively low in comparison to the levels of devastation caused and the population living in the inundated areas. What the 2011 event did result in was Japan rethinking and revising its design codes for sea defence structures in an effort to limit inundation extent and devastation from future events. It is essential that Japan’s new sea defence plans are disseminated as widely as possible, both to inform industrialised nations and those that rely on international codes.”
The research, funded by the Engineering and Physical Sciences Research Council, enabled Dr Raby and other UK scientists and engineers to join an international team of experts on field trips to Japan. These two trips were conducted by the Earthquake Engineers Field Investigation Team and are part of a wider international effort to reduce the impacts of earthquakes globally.
During the initial visit in mid-2011, they were able to observe the levels of destruction caused, while a follow-up in 2013 enabled them to see the recovery, newly-completed sea defences and the design guidelines being implemented to mitigate against future catastrophes.
Their analysis involved translating the disaster scenario manual prepared by Japan’s National Institute for Land and Infrastructure Management, which features comprehensive material enabling designers to appreciate possible failure mechanisms. They also compared it with its European and US equivalents, and highlighted potential deficiencies.
“This is understandable in some regions where less developed countries face competing pressures for limited financial resources, but it is notable that this threat is not addressed in design codes for at-risk European countries,” the final paper says. “There needs to be more joined-up thinking between those who understand the tsunami sources and the implications for populations and infrastructure.”
Dr. Paul Evans from UQ’s Australian Centre for Ecogenomics is analyzing a microbial community from a deep coal seam aquifer. Credit: University of Queensland
Textbooks on methane-metabolising organisms might have to be rewritten after researchers in a University of Queensland-led international project today announced discovery of two new organisms.
Deputy Head of UQ’s Australian Centre for Ecogenomics in the School of Chemistry and Molecular Biosciences Associate Professor Gene Tyson said these new organisms played an unknown role in greenhouse gas emissions and consumption.
“We sampled the microorganisms in the water from a deep coal seam aquifer 600m below the earth’s surface in the Surat Basin, near Roma, Queensland, and reconstructed genomes of organisms able to perform methane metabolism,” Associate Professor Tyson said.
“Traditionally, these type of methane-metabolising organisms occur within a single cluster cluster group of microorganisms called Euryarchaeota.”
“This makes us wonder how many other types of methane-metabolising microorganisms are out there?”
However, Dr Tyson’s group discovered novel methane metabolising organisms belonging to a group of microorganisms, called the Bathyarchaeota which are an evolutionarily diverse group of microorganisms found in a wide range of environments, including deep-ocean and freshwater sediments.
” To use an analogy, the finding is like knowing about black and brown bears, and then coming across a giant panda,” Dr Tyson said.
“They have some basic characteristics in common, but in other ways these they are fundamentally different.”
Dr Tyson said: “This makes us wonder: how many other types of new ‘bears’ or of methane-metabolising microorganisms are out there, that science has still not identified?
“The significance of the research is that it expands our knowledge of diversity of life on Earth and suggests we are missing other organisms involved in carbon cycling and methane production.”
The discovery of the novel methane-metabolising microorganisms was made using techniques that sequence DNA on a large scale and assemble these sequences into genomes using advanced computational tools, many of which were developed at The Australian Centre for Ecogenomics over the past 24 months.
Video
Reference:
Paul N. Evans, Donovan H. Parks, Grayson L. Chadwick, Steven J. Robbins, Victoria J. Orphan, Suzanne D. Golding, Gene W. Tyson. Methane metabolism in the archaeal phylum Bathyarchaeota revealed by genome-centric metagenomics. Science, 2015 DOI: 10.1126/science.aac7745
An artist’s depiction of the turtle Arvinachelys goldeni as it would have appeared in life 76 million years ago in southern Utah. Credit: Victor Leshyk
In the 250-million-year evolutionary history of turtles, scientists have seen nothing like the pig nose of a new species of extinct turtle discovered in Grand Staircase-Escalante National Monument by a team from the Natural History Museum of Utah.
“It’s one of the weirdest turtles that ever lived,” said Joshua Lively, who described the new species today in the Journal of Vertebrate Paleontology. “It really helps add to the story emerging from dinosaur research carried out at the Natural History Museum of Utah.”
Lively studied the fossil as part of his master’s thesis at the University of Utah. He is now a doctoral student at the University of Texas at Austin.
The extinct turtle was about 2 feet long from head to tail. Its streamlined shell was adapted for living in a riverine environment. When it was alive, 76 million years ago during the Cretaceous Period, Southern Utah looked more like present-day Louisiana. The climate was wet and hot, and the landscape was dominated by rivers, bayous and lowland flood plains.
It lived alongside tyrannosaurs, armored ankylosaurs, giant duck-billed dinosaurs such as Gryposaurus and Parasaurolophus, and other dinosaurs that left abundant fossil remains in the Upper Cretaceous Kaiparowits Formation of Southern Utah. But those fossil beds also hold the remains of many crocodilians, turtles, lizards and amphibians that don’t look much different from their modern relatives.
Unlike any turtle ever found, the broad snout of the newly discovered species has two bony nasal openings. All other turtles have just one external nasal opening in their skulls; the division between their nostrils is only fleshy.
Golden’s bacon turtle
The pig-nosed turtle’s scientific name, Arvinachelys goldeni, derives from arvina, a Latin word for pig fat or bacon¬, and chelys, Latin for tortoise. And goldeni honors Jerry Golden, a volunteer fossil preparator at the Natural History Museum of Utah, who prepared the new holotype specimen — and many others in the museum’s collections.
“Volunteers are involved in every aspect of what we do, from field work and digging up specimens to preparing them,” said Randall Irmis, curator of paleontology at the museum and associate professor at the University of Utah. “In 2014, volunteers provided 14,500 hours of work. It’s a massive contribution. We couldn’t do what we do without them. We really consider them key team members.”
Most ancient turtle species are represented by fossil remains that often consist of nothing more than an isolated skull or shell. And finds that associate skulls with shells are rare. The new specimen includes not only the skull and the shell, but also a nearly complete forelimb, partial hindlimbs, and vertebrae from the neck and tail of Arvinachelys.
Scientifically important
It’s important because it fills a gap in understanding the evolution of turtles. “With only isolated skulls or shells, we are unable to fully understand how different species of fossil turtles are related, and what roles they played in their ecosystems,” Irmis said.
During the time of Arvinachelys, western North America was a large island continent named Laramidia. A sea stretching from the Arctic to the Gulf of Mexico separated Laramidia from eastern North America.
During the Late Cretaceous Period, dinosaurs of southern Laramidia (southern Utah, New Mexico and Texas) seem to have diversified in isolation from their relatives in the northern part of the continent (Montana and Alberta). The apparent confinement of Arvinachelys and other species of turtles to southern Laramidia fits that same pattern.
It remains a mystery what kept northern and southern populations isolated from each other. The Earth’s climate was in a hothouse phase with high temperatures not varying as greatly from equator to the poles as they do today. “The assumption has always been that organisms would be able to range over broad areas,” Lively said.
A combination of rising sea levels and persistent changes in the climate might have created barriers to dispersal during the Cretaceous Period. Lively said that understanding how ancient animals coped with a changing climate will help scientists understand how modern animals and ecosystems are likely to respond to present day and future climate change.
The study was funded by the Bureau of Land Management, Geological Society of America, Grand Staircase-Escalante Partners, the Paleontological Society Kenneth & Annie Caster Award and University of California Museum of Paleontology Welles Research Fund. Fieldwork was conducted under permits issued by the Bureau of Land Management.
Video
A CT scan of Arvinachelys goldeni’s skull. Most ancient turtle species’ fossil remains consist of nothing more than an isolated skull or shell. The new specimen includes both the skull and the shell, thereby filling an important gap in understanding the evolution of turtles.
Credit to Joshua Lively
Reference:
Lively, J.R. A new species of baenid turtle from the Kaiparowits Formation (Upper Cretaceous: Campanian) of southern Utah. Journal of Vertebrate Paleontology, 2015
An artist’s illustration of a major asteroid impact on Earth. Credit: NASA
Mass extinctions occurring over the past 260 million years were likely caused by comet and asteroid showers, scientists conclude in a new study published in Monthly Notices of the Royal Astronomical Society.
For more than 30 years, scientists have argued about a controversial hypothesis relating to periodic mass extinctions and impact craters — caused by comet and asteroid showers — on Earth.
In their MNRAS paper, Michael Rampino, a New York University geologist, and Ken Caldeira, a scientist in the Carnegie Institution’s Department of Global Ecology, offer new support linking the age of these craters with recurring mass extinctions of life, including the demise of the dinosaurs. Specifically, they show a cyclical pattern over the studied period, with both impacts and extinction events taking place every 26 million years.
This cycle has been linked to periodic motion of the Sun and planets through the dense mid-plane of our galaxy. Scientists have theorized that gravitational perturbations of the distant Oort comet cloud that surrounds the Sun lead to periodic comet showers in the inner solar system, where some comets strike Earth.
To test their hypothesis, Rampino and Caldeira performed time-series analyses of impacts and extinctions using newly available data offering more accurate age estimates.
“The correlation between the formation of these impacts and extinction events over the past 260 million years is striking and suggests a cause-and-effect relationship,” says Rampino.
Specifically, he and Caldeira found that six mass extinctions of life during the studied period correlate with times of enhanced impact cratering on Earth. One of the craters considered in the study is the large (180 km diameter) Chicxulub impact structure in the Yucatan, which dates to about 65 million years ago — the time of a great mass extinction that included the dinosaurs.
Moreover, they add, five out of the six largest impact craters of the last 260 million years on earth correlate with mass extinction events.
“This cosmic cycle of death and destruction has without a doubt affected the history of life on our planet,” Rampino observes.
Reference:
Michael Rampino et al. Periodic impact cratering and extinction events over the last 260 million years. Monthly Notices of the Royal Astronomical Society, October 2015. DOI: 10.1093/mnras/stv2088
Scanning Electron Micrographs of Fossil Charcoal of a small primitive fern-like plant from from the late Devonian (355 million years ago) from North America. Credit: Image courtesy of University of Royal Holloway London
A study, carried out by Professor Andrew C. Scott of the Department of Earth Sciences at Royal Holloway, University of London and Professor Sue Rimmer from Southern Illinois University, reveals widespread fire occurred on Earth more than 80 million years after plants first invaded the land.
The findings, published in the American Journal of Science, indicate that although plants were first detected on land more than 440 million years ago there is only scant evidence of fire at that time.
Professor Scott, said: “What surprised us was that many of these early extensive fires were surface fires burning the undergrowth, as we can see the anatomy of the plants being burned through scanning electron microscope studies of larger pieces of the fossil charcoal.”
He added: “This may be because plants were small and were limited in their distribution but over the following 50 million years they diversified and spread across the globe and some of the plants were trees and could have provided a good fuel to burn. Extensive forest fires soon followed, however and we see widespread charcoal deposits throughout the Lower Carboniferous (Mississippian) Period 358-323 million years ago.”
Professor Scott and Professor Rimmer made the discovery after analysing charcoal which was washed in to an ocean that lay across what is now part of present day North America.
The team believes that it was not fuel availability that prevented widespread fire, or climate, but that the atmospheric oxygen levels were too low. It had been suggested that only when oxygen levels rose to above 17% (it is 21% today) that widespread fires would be found. This new data suggests that it was at around 360 million years ago, in the latest Devonian Period, that this threshold was reached and probably never went below this level for the rest of geological history.
This time period defines a new phase of the evolution of Earth System and regular wildfire would have played an important role in the evolution of both animals and plants.
Reference:
S. M. Rimmer, S. J. Hawkins, A. C. Scott, W. L. Cressler. The rise of fire: Fossil charcoal in late Devonian marine shales as an indicator of expanding terrestrial ecosystems, fire, and atmospheric change. American Journal of Science, 2015; 315 (8): 713 DOI: 10.2475/08.2015.01