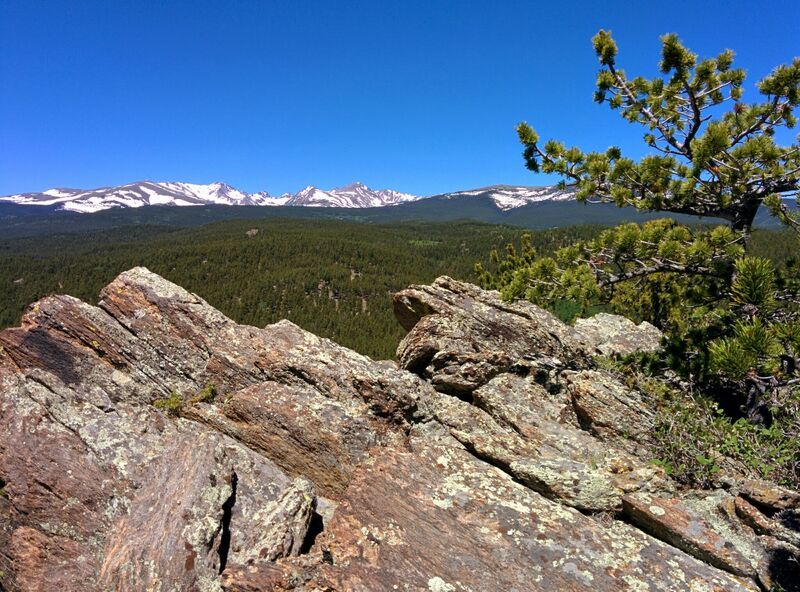
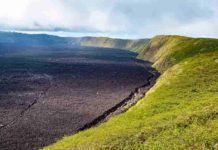
Gordon Gulch in Colorado Credit: Taylor Perron/MIT
Research by a UCLA geologist and colleagues could give builders and urban planners more detailed information about how susceptible areas are to landslides and earthquakes.
The study, by Seulgi Moon, a UCLA assistant professor of geology, and colleagues at MIT and the University of Wyoming, is published Oct. 30 in the journal Science. Their findings also could help predict the characteristics of reservoirs that hold groundwater, and identify hills and mountains that are unstable and could be prone to landslides.
Their research focused on bedrock, just beneath the soil and roots and the Earth’s surface. Bedrock is the layer at the bottom of what geologists refer to as the “critical zone” because its cracks and fractures provide pathways for air and water, which break down rock and form the soil that is an essential ingredient for all living organisms.
The chemical and physical breakdown of rocks in the bedrock layer — which scientists refer to as “weathering” –can influence how Earth’s landscapes evolve over time, and the chemical reactions help regulate Earth’s climate by consuming carbon dioxide.
But until now, scientists have been unable to accurately predict how wide or deep the weathered part of the bedrock extends, or how extensive the weathering is in any given location.
Moon and her colleagues devised a mathematical model that estimates the amount of stress the bedrock is under — from the weight of rocks in the layers above and from the forces of tectonic plates below — which will enable them and other scientists to predict where fractures may occur. The study is the first to use real data from geophysical imaging of bedrock at depth to demonstrate that the shape of the landscape, or topography, can influence the fracturing of the bedrock.
Moon conducted the research from 2013 through earlier this year, when she was an MIT postdoctoral scholar working with Taylor Perron, an MIT associate professor. They found that if a landscape is undergoing only a small amount of compression from the movement of tectonic plates, fractured zones in the bedrock mimic the topography. On the other hand, if a region is undergoing a high degree of compression from tectonic plates, the bottom of fractured zones will essentially be the inverse of the surface topography.
To test the model, the group collaborated with University of Wyoming researchers who specialize in measuring seismic waves in bedrock as well as electrical resistivity and borehole imaging, which can detect the amount of fracturing present within the bedrock. The team analyzed seismic surveys of sites with different amounts of tectonic compression in Colorado, South Carolina and Maryland, and they found that the measured shapes of fractured zone of bedrock in all three sites matched the profiles predicted by their model.
The research was funded in part by the U.S. Army Research Office.
Reference:
J. St. Clair, S. Moon, W. S. Holbrook, J. T. Perron, C. S. Riebe, S. J. Martel, B. Carr, C. Harman, K. Singha, D. d. Richter. Geophysical imaging reveals topographic stress control of bedrock weathering. Science, 2015; 350 (6260): 534 DOI: 10.1126/science.aab2210
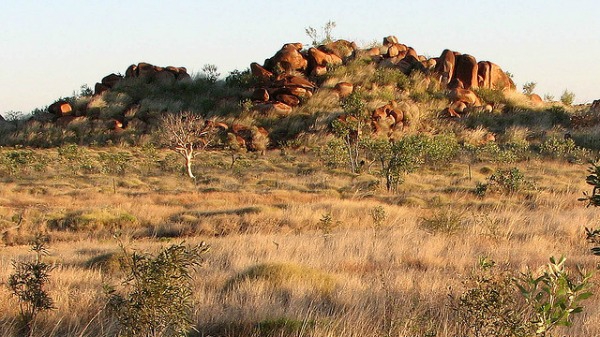
They take the form of eroding rocky outcrops with little vegetation, the eroded material forming black soil plains that are valuable grazing land. Credit: yaruman5/flickr
CHINA’S stated intention to restrict vanadium exports may stimulate greater Australian efforts to mine it, so it comes as good timing that geologists are finding prospective areas for vanadium and titanium in the Kimberley.
The work is part of Geological Survey of Western Australia-funded research which is adding to knowledge of the poorly-understood Kimberley Craton, a former tectonic plate now welded to the North Australia and Pilbara Cratons.
Much of the craton is covered by two sedimentary basins, one above the other, known as the Kimberley Basin and below it, the Speewah Basin.
The research involved detecting old sub-surface cracks in the landscape called Hart Dolorites which occurred about 1797 million years ago and was led by University of Tasmania research fellow Karin Orth.
The Hart Dolerites appear to have once acted as conduits for magma forcing its way upwards through weaker sections of the region’s rock strata, Dr Orth says.
The team analysed samples from Hope Creek near the Yampi Peninsula which show vanadium, titanium and iron levels comparable to geologically-similar structures at Speewah Dome in the East Kimberley.
As vanadium and titanium have been found at the Speewah Dome, she says other Hart Dolorite structures should be prospective for those minerals.
Dr Orth discovered the Hart Dolerites by walking transect lines in remote regions and at the same time she collected samples, took measurements and made notes on a tablet computer with a GPS that geolocated the data she entered.
Back in the office she submitted samples for geochemistry analysis and sometimes for dating, overlaying the data with geophysical data and Landsat images.
“In the field we’d also be taking measurements of some of the properties of those rocks that we then would sample,” she says.
“That can then be used to see how it relates to those more regional datasets.”
While larger Hart Dolorite structures occur along the Carr-Boyd Ranges, Bob Black Hills and Leopold Ranges, there are smaller structures in the northern Kimberley, north of the present-day Gibb River Road.
They take the form of eroding rocky outcrops with little vegetation, the eroded material forming black soil plains that are valuable grazing land.
If these structures prove to contain vanadium it would require ready access to roads or wharves to turn them into payable mines.
Note: The above post is reprinted from materials provided by ScienceNetwork WA. The original article was written by Geoff Vivian.
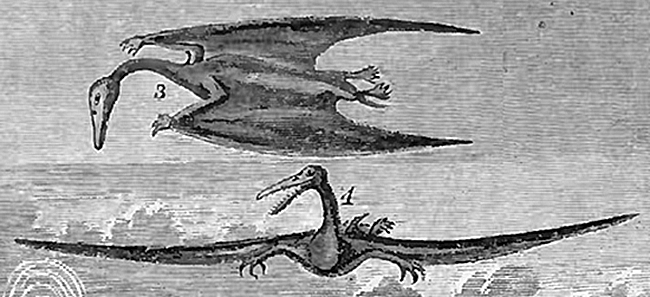
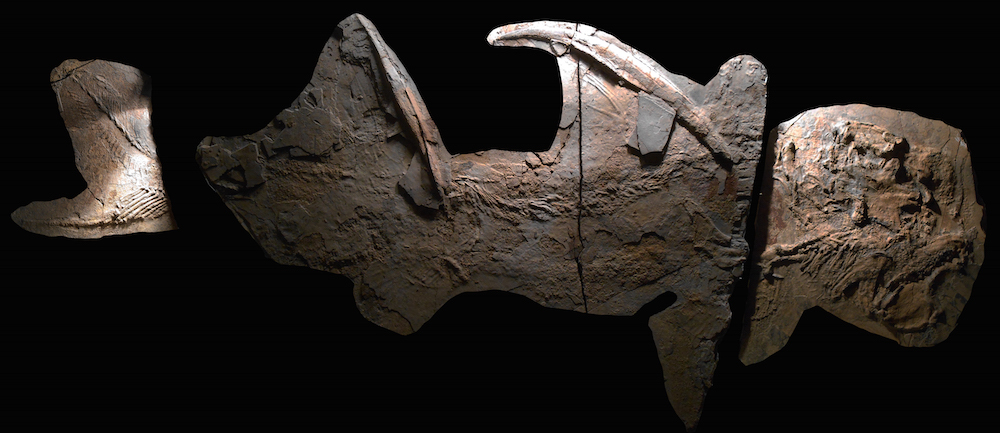
Early interpretation of Pteranodon. Credit: E.D. Cope. Public Domain.
In the Mesozoic Era, the time of dinosaurs, the skies were filled with monsters.
Leathery wings, long beaks, bizarre forelimbs modified for flight. Think of Disney’s Fantasia or Don Bluth’s The Land Before Time. Like demon reptile bats, they ruled the air while birds were just getting their start on the evolutionary stage, and long before bats were a twinkle in Earth’s eye.
But those monsters were not, in fact, dinosaurs.
The pterosaur clade encompasses a broad diversity of flying reptiles, all in their own distinct group, distant cousins of dinosaurs. The name, aptly, translates to “winged reptile”.
One of the most famous pterosaurs, one that has featured in numerous films and has been turned into many plastic toys, is Pteranodon. This is the creature that many people think of when they think of pterosaurs: a long, pointed, toothless snout, with a long crest at the back of its head. Tailless, and probably a little awkward; that is, until it flies. I like to think of them as fairly graceful, once they were airborne.
There have been several studies on just how Pteranodon flew, how it grew, and how it lived, but relatively little on its osteohistology – the inner structure of its bone. Starting with early discoveries by paleontology rivals Othniel Charles Marsh and Edward Drinker Cope in the late 19th Century, Pteranodon catapulted to stardom as the first pterosaur found outside of Europe, with its strange toothless skull and large size. The wingspan of Pteranodon longiceps, one of two currently valid species, was over 20 feet (6 meters). Can you imagine something like that swooping through the skies today? It’s definitely unusual, and there Pteranodon really inspires the imagination.
The second valid species as of this article’s writing is Pteranodon (=Geosternbergia) sternbergi, named for George Sternberg, its collector and one of the namesakes of the Sternberg Museum of Natural History at Fort Hays State University, in Hays, Kansas.
It is only fitting that the Sternberg Museum of Natural History is the place where further studies on the osteohistology of Pteranodon are being undertaken. The museum’s chief curator and Fort Hays assistant professor Laura E. Wilson is at the forefront of Pteranodon histology, a topic that is in need of a more robust set of data. Wilson has one of the largest collections of Pteranodon bones in North America at her disposal, and was able to present her preliminary findings on how Pteranodon limb bones can be linked to bone growth.
At the 75th annual meeting of the Society of Vertebrate Paleontology, Wilson explained how she had taken delicate thin sections of Pteranodon bone and analyzed the patterns of growth within those sections.
Like rings on a slice of tree, bone can shed a lot of light on how animals grow, when they stop growing, and whether some of the bone is remodeled or undergoes resorption.
Strangely enough, when Pteranodon long bones such as this femur below are sliced in cross-section, they look a lot like bacon – according to Wilson, who is a bacon fan! I pretty much agree with her, it does look enticing.
But there’s more here than the appearance of crispy goodness. Histological sections like this one allow Wilson to study different sizes of Pteranodon and determine whether they are all adult specimens – in spite of a wide range of presumably adult, full-grown sizes.
For example, Wilson took three size ranges of Pteranodon from the Late Cretaceous Niobrara chalk deposits of Kansas and made thin sections of single femur bones. If Pteranodon grew like other vertebrates – and that’s a big if – then juvenile specimens would be expected to have fast-growing, woven bone, versus the slow-growing parallel fibers along the outer edges, or periosteum, of adult bone. Other juvenile bone features include primary osteons – common structures of newly growing bone – and a wide variety of vascular canal shapes.
In the small, medium, and large femora of the Pteranodon specimens, Wilson noted that Pteranodon may have had abundant resorption of bone in juvenile animals, erasing any early woven features and replacing it with the uniquely thin, parallel periosteal lamellae of adults. That is, if Pteranodon laid down woven bone at all – to date Wilson has no evidence to suggest they did or didn’t. But, like thin layers of geologic strata, the hallmark adult-bone lamellae signal one thing: there is a really big variation in adult Pteranodon body sizes.
According to Wilson, the “medium and small specimens are not skeletally mature” – and therefore not fully adult. That means they don’t have the thin lamellae, either. The smallest appears to be a sub-adult, close to skeletal maturity, which is strange considering its relatively small size. Interestingly, the medium-sized specimen might be the youngest of the three. Primary osteons, abundant vascular canals, and the orientation of these canals – through which blood vessels flow – are, says Wilson, key indicators of the quasi-juvenile state in this mid-sized Pteranodon.
So, the smallest specimen is a sub-adult, the mid-ranger is younger than expected, and the biggest specimen is most definitely adult.
The indication that Pteranodon bones grew to a wide range of adult sizes is intriguing, and there’s still no evidence of woven, obviously juvenile bone. “If they did deposit woven bone as fast-growing juveniles,” says Wilson, emphasizing the ‘if’, “then that bone has been resorpted by the time they [were] big or old enough to fly out to sea.” That’s the Western Interior Seaway, which drowned much of Kansas during the Late Cretaceous, and was home base for Pteranodon.
Wilson found that the smallest specimens were still 60% of the adult body size, and even these specimens appear to be approaching maturity. The Niobrara specimens were deposited far from shore, and the wings of these ancient creatures would have developed in a way to carry them there. What happened to cause their ultimate demise at sea is something of a mystery, but the way in which they lived and grew is only going to become clearer the more researchers look at the structure of their bones.
What’s next for Wilson and the Pteranodon specimens at Sternberg? More bones will need to be cross-sectioned and studied to see if the trend is observed across lots of specimens and body sizes.
Especially enticing is the prospect of one day finding more small juvenile Pteranodon specimens in the field. “One of the big obstacles to my research is that we may never be able to get a full picture of the growth, or ontogeny, of these animals until we find small juveniles – which are missing from our fossil record at this point,” says Wilson. “It’s very difficult to understand how Pteranodon grew from hatchling to adulthood without the lower half of the body size distribution.”
Reference:
Mark P. Witton et al. On the Size and Flight Diversity of Giant Pterosaurs, the Use of Birds as Pterosaur Analogues and Comments on Pterosaur Flightlessness, PLoS ONE (2010). DOI: 10.1371/journal.pone.0013982
Note: The above post is reprinted from materials provided by Public Library of Science. This story is republished courtesy of PLOS Blogs: blogs.plos.org.
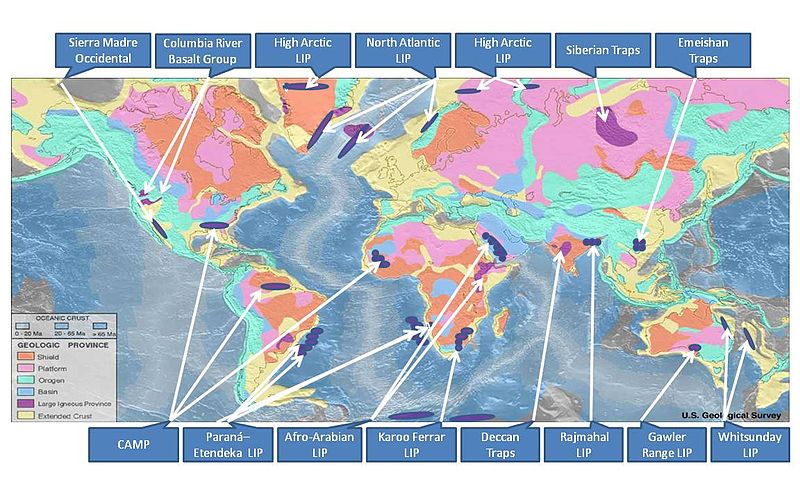
Large igneous provinces overlaid on a map produced by United States National Oceanic and Atmosphere Administration’s National Geophysical Data Center. Credit: Williamborg/Wikimedia Commons
Mass extinction events are sometimes portrayed in illustrations of volcanic eruptions causing widespread destruction. According to Dr. Richard E. Ernst of Carleton University, Ottawa, Canada, expert on Large Igneous Provinces (LIPs), this interpretation may have some truth behind it, but not in the instantaneous way we might think. Ernst will report on his research on 1 November at the Geological Society of America’s Annual Meeting in Baltimore, Maryland, USA.
The basaltic lava flowing from ancient volcanoes and the portion of magma (liquid rock) emplaced underground can create geologic conditions linked with climate change and, subsequently, extinction events. This climatic effect is particularly true for LIPs, in which mainly basaltic magma up to millions of cubic kilometers can be emplaced in a geologically short time of less than a few million years.
“The most dramatic climatic effect is global warming due to greenhouse-gases from LIPs,” explains Ernst. “Subsequent cooling (and even global glaciations) can be caused by CO2 drawdown by weathering of LIP-related basalts.”
There are currently numerous LIPs correlated with the timing of extinction events over the last few hundred million years, so there is a clear link to be explored by researchers like Ernst and his colleagues. He notes that the research literature on the links between LIPs and catastrophic climatic change is rapidly expanding.
How do researchers know this occurred? Improved isotope dating is confirming the long-proposed extinction-LIP link. Additionally, the environmental/climatic changes can be recorded in sedimentary isotopic compositions that record the structure of seawater in ancient times.
There are additional environmental effects associated with LIP deposition, Ernst reports. “Effects associated with LIPs also include oceanic anoxia (massive marine organism die off due to oxygen deficiency), sea level changes, etc.” The sheer size of an LIP is not the only factor. “Also contributing to climatic/extinction effects are the abundance of LIP-produced pyroclastic material and volatile fluxes that reach the stratosphere, and in particular the role of super-eruptions.”
Climate feedbacks are also an important factor. Warming caused by LIPs could cause the destabilization of frozen methane clathrates, which then releases more greenhouse gases and causes more warming. Ernst notes that paleogeography and location of the LIPs may have affected the climate as well. “An important global terrane effect is the surface extent of basalts at the time, and the portion which is at low latitudes –factors which increase the efficiency of the CO2 drawdown (and global cooling) through weathering.”
The well-preserved fossil of a 300-million-year-old shark from New Mexico. The “Texas supershark” fossils (not pictured) are less complete, but suggest the supershark was even larger than the New Mexican shark. Credit: John-Paul Hodnett
Previously, giant sharks had only been recovered from rock dating back 130 million years, during the age of the dinosaurs. The largest shark that ever lived, commonly called “Megalodon”, is much younger, with an oldest occurrence at about 15 million years ago. This means the new fossils from Texas indicate giant sharks go much further back into the fossil record.
After the generous donation of these fossils and careful study with Dr. John Maisey of the American Museum of Natural History in New York, the team was able to estimate how big the entire sharks would have been by comparison with smaller and more complete fossils of closely related sharks. The results were very impressive.
The size range estimated for these two Texas ‘supersharks’ was between 18 and 26 feet in length (5.5 to 8 meters). The largest of these specimens was 25% bigger than today’s largest predatory shark, the Great White. Although not nearly as large as Megalodon, which might have reached up to 67 feet in length (about 20 meters), the fossil sharks from Texas would have been by far the biggest sharks in the sea.
These fossil braincases may belong to an extinct species of shark called Glikmanius occidentalis, or they may represent a new and larger related species that is new to science. Closely related sharks are known from as far off as Scotland, showing this group of sharks was capable of dispersing across great distances.
Maisey, McKinzie, and Williams timed their research results very well, being able to present their Texas ‘supershark’ at the annual meeting for the Society of Vertebrate Paleontology in Dallas, Texas. According to Maisey, even 300 million years ago, “everything is bigger in Texas!”
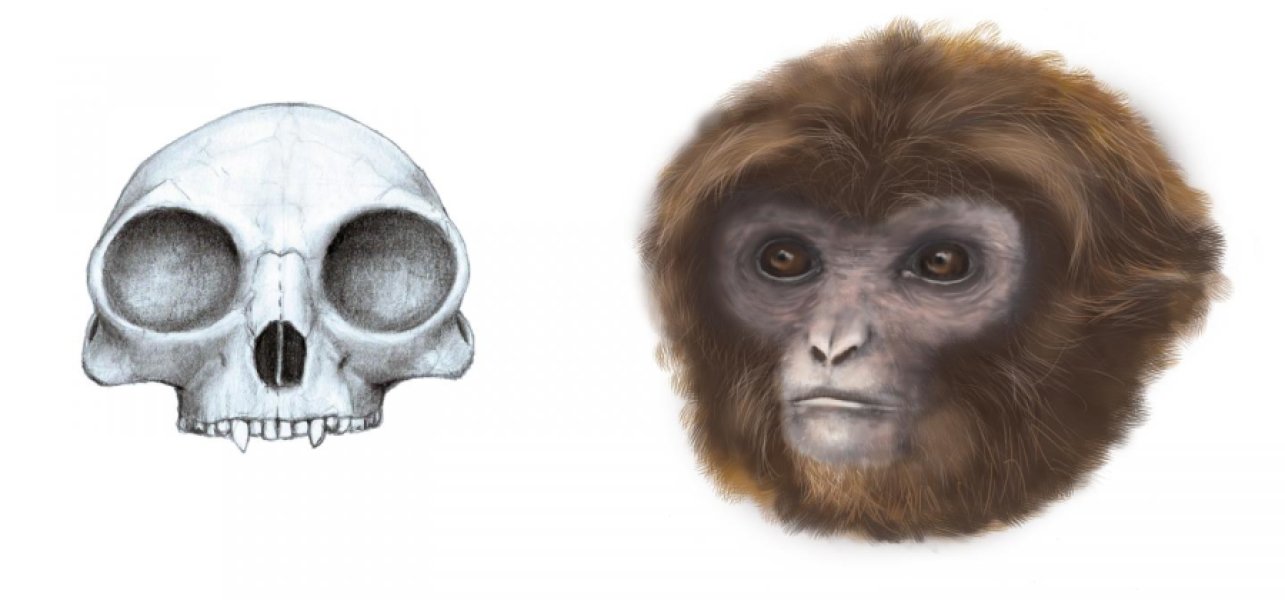
Reconstruction of the skull (front and side view) and representation of life appearance of Pliobates cataloniae are shown. Credit: Marta Palmero / Institut Català de Paleontologia Miquel Crusafont
Living hominoids are a group of primates that includes the small-bodied apes (the lesser apes, or gibbons and siamangs, which constitute the family Hylobatidae) and the larger-bodied great apes (orangutans, gorillas and chimpanzees), which, along with humans, belong to the family Hominidae. All extant hominoids share several features, such as the lack of external tail, an orthograde body plan that enables an upright trunk position, and several cranial characteristics. All these features might have been present in the common ancestor of hominids and hylobatids that, according to molecular data, would have lived about 15-20 million years ago.
Researchers from the ‘Institut Català de Paleontologia Miquel Crusafont’ (ICP) have described the new genus and species of extinct hominoid, Pliobates cataloniae, based on a partial skeleton composed of 70 fossil remains found in 2011 in one of the sites within the stratigraphic series of Abocador de Can Mata (els Hostalets de Pierola, Barcelona, Catalonia, NE Iberian Peninsula). These include most of the skull and dentition as well as a considerable portion of the left arm, including several elements of the elbow and wrist joints. They belong to an ape similar in size to the smallest of living gibbons (4 to 5 kg), which lived 11.6 million years ago. Pliobates shows, for the first time in a primate fossil of this size, a set of characteristic features of extant hominoids, presumably inherited from their last common ancestor, which probably lived in Africa several million years before Pliobates.
This find radically changes the hitherto accepted morphotype of the hylobatid-hominid ancestor and provides very solid clues about the origin of extant gibbons. “The origin of gibbons is a mystery because of the lack of fossil record, but until now most scientists thought that their last common ancestor with hominids must have been large, because all of the undoubted fossil hominoids found so far were large-bodied,” explains David M. Alba, the ICP researcher leading the study published in the journal Science. All the small-bodied (5 to 15 kg) fossil anthropoids found before Pliobates displayed a body plan too primitive to be closely related to extant hominoids. “This find overturns everything,” according to this ICP researcher.
Pliobates retains some primitive characteristics. However, its arm anatomy, specifically the wrist bones and the joint between the humerus and radius, already possesses the basic design of living hominoids. A phylogenetic analysis, based on more than 300 characters, very consistently places Pliobates as the stem hominoid closest to the divergence between lesser and great apes (hylobatids and hominids, respectively), and suggests that the last common ancestor of extant hominoids might have been more similar to living gibbons than to the extant great apes than previously thought.
In fact, the skull and some parts of the postcranial skeleton of Pliobates cataloniae show some features that are exclusive to extant gibbons. “This suggests that, alternately, Pliobates might be the sister group of extant gibbons only,” asserts Salvador Moyà-Solà, ICREA researcher and director of the ICP, who also participated in the study. “We hope that future discoveries in the landfill of Can Mata will help us to clarify the role played by small-bodied catarrhines in hominoid evolution and, finally, to solve the enigma of extant gibbons’ origins,” concludes Moyà-Solà.
The adaptations of the postcranial skeleton of Pliobates cataloniae are indicative of a locomotor repertoire mostly consisting in slow and cautious climbing through the canopy, with a great flexibility of movement and some capacity of below-branch suspension. Its encephalization degree was similar to that of living monkeys and gibbons, but lower than that of living great apes. Microscopic marks left by food items on the occlusal surfaces of its teeth shortly before death indicate an essentially frugivorous diet (i.e., based mainly on ripe and soft fruit), like in living gibbons.
The cranial remains were so fragmentary that researchers relied on a virtual reconstruction based on high-resolution computed-tomography imagery to study them.
The name of the new genus (Pliobates) is a combination of Pliopithecus (which means “more ape”) and Hylobates (“the one who walks or haunts”), in allusion to the primitive similarities with other previously-known small-bodied anthropoids (pliopithecoids) and the resemblances, in derived features, with extant gibbons (hylobatids). The species epithet (cataloniae) is a geographical reference the location of the site in Catalonia. The specimen has been nicknamed “Laia,” a familiar diminutive of “Eulalia,” the patron of Barcelona, which literally means “well spoken, eloquent” because of the new knowledge that means to science.
Abocador de Can Mata, an exceptional site
The finding of Pliobates demonstrates once again that the complex of sites at Abocador de Can Mata is one of the most important places worldwide to study the origin of extant hominoids. The paleontological surveillance performed during the enlargement of the landfill over the last 13 years, under the scientific supervision of the ICP, has enabled the recovery of extraordinary fossil primate remains from 12.5 to 11.5 million years ago. Most noteworthy are the skeleton of Pierolapithecus catalaunicus (known as “Pau”), found in 2002 and described in 2004, as well as the skull of Anoiapithecus brevirostris (“Lluc”), described in 2009.
During the middle and early late Miocene, the area where the current landfill is located was a closed forest with a warm and wet climate with some permanent waterbodies nearby. This environment facilitated a great faunal diversity, as it is represented by the nearly 80 mammalian species that have been identified at the site, in addition to several amphibians, reptiles and birds. Thus, besides hominoid and pliopithecoid primates, small mammals (insectivores and rodents), ungulates (such as horses, rhinos and deer), many carnivorans (including those known as “false saber-toothed cats,” currently extinct), and proboscideans distantly related to modern elephants have been found in this area.
Video
A team of researchers from the ‘Institut Català de Paleontologia Miquel Crusafont’ describes in the Science magazine the new genus and species, Pliobates cataloniae, based on a skeleton recovered from the landfill of Can Mata (els Hostalets de Pierola, Catalonia, Spain). The fossil remains belong to an adult female individual named “Laia” by her discoverers. “Laia” weighed 4-5 kg, consumed soft fruit items and moved through the forest canopy by climbing and suspending below branches. Pliobates lived 11.6 million years ago and precedes the divergence between hominids (great apes and humans) and hylobatids (gibbons), which has important implications for reconstructing the last common ancestor of both groups. In this video, David Alba, the leading researcher of this project, talks on this find.
Reference:
D. M. Alba, S. Almecija, D. DeMiguel, J. Fortuny, M. P. de los Rios, M. Pina, J. M. Robles, S. Moya-Sola. Miocene small-bodied ape from Eurasia sheds light on hominoid evolution. Science, 2015; 350 (6260): aab2625 DOI: 10.1126/science.aab2625
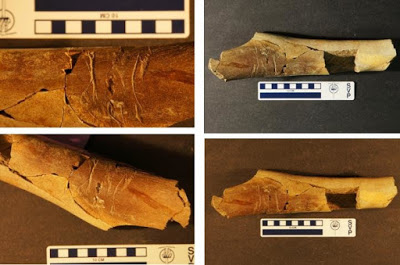
This is a recently unearthed tyrannosaur bone with peculiar teeth marks that strongly suggest it was gnawed by another tyrannosaur. Credit: Photos by Matthew McLain.
A nasty little 66-million-year-old family secret has been leaked by a recently unearthed tyrannosaur bone. The bone has peculiar teeth marks that strongly suggest it was gnawed by another tyrannosaur. The find could be some of the best evidence yet that tyrannosaurs were not shy about eating their own kind.
“We were out in Wyoming digging up dinosaurs in the Lance Formation,” said paleontologist Matthew McLain of Loma Linda University in California. “Someone found a tyrannosaur bone that was broken at both ends. It was covered in grooves. They were very deep grooves.”
The grooves were clearly those of an animal pulling the flesh off the bone — pulling in a direction perpendicular to the bone, in the same way humans eat a piece of fried chicken. But one groove stood out. It was located at the larger end of the bone and contained smaller parallel grooves caused by the diner’s head turning, so that the serrated edges of its teeth dragged across the bone.
Serrated teeth rule out crocodiles and point directly to a theropod dinosaur like T. rex. The fact that the only large theropods found in the Lance Formation are two tyrannosaurs –Tyrannosaurus rex or Nanotyrannus lancensis — eliminates all interpretations but cannibalism, explained McLain, who will be presenting the discovery on 1 Nov. at the annual meeting of the Geological Society of America in Baltimore.
“This has to be a tyrannosaur,” said McLain. “There’s just nothing else that has such big teeth.”
The direction of the grooves is consistent with getting flesh from bones off an animal that was quite dead at the time. The bones don’t reveal whether the cannibal was scavenging or was also the killer of the tyrannosaur.
“Exactly who did the eating that day, in the Late Cretaceous, could still be sorted out by the same grooves,” McLain said.
The serration grooves are a valuable clue to the size of the animal who owned the teeth. Previous work using Komodo dragon teeth has demonstrated the relationship between serration sizes and the size of the animal. This approach has been used on tyrannosaurs, and McLain thinks it will work in this case, too.
“It only works if you know what species it is,” he said. “And since tyrannosauruses are the only large predators in these formations, it’s pretty straightforward.”
Even without knowing the size of the eater, it may be easy to say which species of tyrannosaur was eating, because, according to McLain, many paleontologists believe Nanotyrannus were really juvenile T. rex.
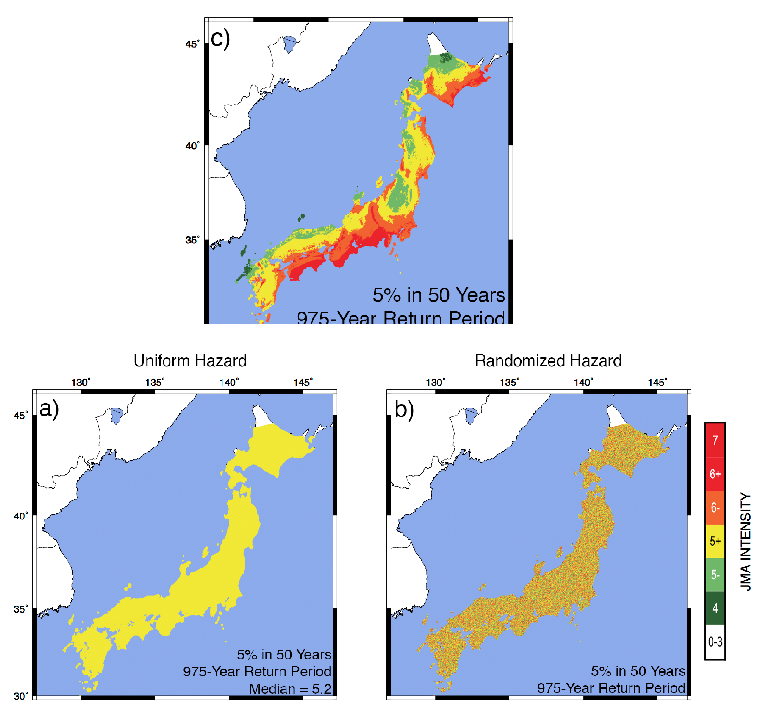
Comparison of Japanese national earthquake hazard map (top) to uniform and randomized versions. The map predicts the level of shaking, shown by colors from red (highest) to white (least) expected to be exceeded at 5% of the sites on the map in the next 50 years. Surprisingly, by the most commonly used measure, the uniform and randomized maps work better than the published maps. Credit: Seth Stein, Northwestern University.
Northwestern University researchers have turned to an unusual source—Major League Baseball—to help learn why maps used to predict shaking in future earthquakes often do poorly.
Earthquake hazard maps use assumptions about where, when, and how big future earthquakes will be to predict the level of shaking. The results are used in designing earthquake-resistant buildings. However, as the study’s lead author, earth science and statistics graduate student Edward Brooks, explains “sometimes the maps do well, and sometimes they do poorly. In particular, the shaking and thus damage in some recent large earthquakes was much larger than expected.”
Part of the problem is that seismologists have not developed ways to describe how well these maps perform. As Seth Stein, William Deering Professor of Geological Sciences explains “we need the kind of information the weather service has, where they can tell you how much confidence to have in their forecasts.”
The question is how to measure performance. Bruce Spencer, professor of statistics, explains that “it’s like asking how good a baseball player Babe Ruth was. The answer depends on how one measures performance. In many seasons Ruth led the league in both home runs and in the number of times he struck out. By one measure he did very well, and by another, very poorly. In the same way, we are using several measures to describe how hazard maps perform.”
Another problem is that the hazard maps try to forecast shaking over hundreds over years, because buildings have long lifetimes. As a result, it takes a long time to tell how well a map is working. To get around this, the team looked backwards in time, using records of earthquake shaking in Japan that go back 500 years. They compared the shaking to the forecasts of the published hazard maps. They also compared the shaking to maps in which the expected shaking was the same everywhere in Japan, and maps in which the expected shaking at places was assigned at random from the published maps.
The results were surprising. In Brook’s words “it turns out that by the most commonly used measure using the uniform and randomized maps work better than the published maps. By another measure, the published maps work better.”
The message, in Stein’s view, is that seismologists need to know a lot more about how these maps work. “Some of the problem is likely to be that how earthquakes occur in space and time is more complicated that the maps assume. Until we get a better handle on this, people using earthquake hazard maps should recognize that they have large uncertainties. Brightly colored maps look good, but the earth doesn’t have to obey them and sometimes won’t.”
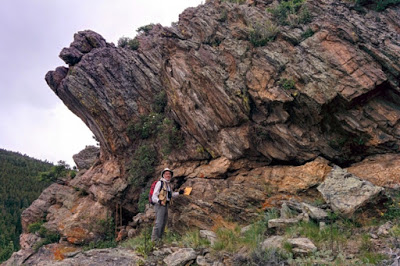
A rock outcrop in Gordon Gulch, Colo., with Stephen Martel of the University of Hawaii pictured in the foreground. Credit: Taylor Perron
Just below Earth’s surface, beneath the roots and soil, is a hard, dense layer of bedrock that is the foundation for all life on land. Cracks and fissures within bedrock provide pathways for air and water, which chemically react to break up rock, ultimately creating soil—an essential ingredient for all terrestrial organisms. This weathering of bedrock is fundamental to life on Earth.
Now scientists at MIT, the University of Wyoming, and elsewhere have found a way to predict the spatial extent of bedrock weathering, given a location’s topography. The results are published today in the journal Science.
The group sought to estimate the depth to which bedrock is broken up, or fractured. This fractured rock forms the base of a layer scientists have dubbed Earth’s “critical zone,” where the interaction of rock, air, and water allows life to thrive.
The group developed a model that estimates the thickness of this critical zone, given the forces generated by topography, gravity, and plate tectonics. The researchers found that if a landscape is undergoing little tectonic compression, the fractured zone should parallel the overlying topography, like layers of lasagna. If, however, a region is under high tectonic compression, the fractured zone will resemble a mirror image of the landscape—thicker beneath ridges, and thinner under valleys.
To test the model’s predictions, the researchers went to three sites in the United States with varying tectonic forces. In each location, they took extensive seismic and electrical conductivity measurements to gauge the extent of fracturing in the underlying bedrock. They found that their measurements matched well with their model’s predictions.
Seulgi Moon, a former MIT postdoc and a co-author of the paper, says the model may be used to better understand how Earth’s critical zone functions, and how it may shape the diversity of terrestrial life in the future. The model may also have applications for human development.
“[The model] will help us estimate mechanical properties of the bedrock,” says Moon, who is now an assistant professor of geology at the University of California at Los Angeles. “When you design building codes, this can give some idea of how susceptible an area may be to landslides and earthquakes.”
Cracking under pressure
While geologists have suspected that a region’s topography might influence the fracturing of its bedrock, there had been few attempts to test this idea with field measurements.
“The calculations that had been done were on idealized landforms,” says Taylor Perron, an associate professor of geology in MIT’s Department of Earth, Atmospheric and Planetary Sciences. “Imagine a single ridge or valley with no surrounding topography. That’s a problem you can do on paper, but it’s not the same as having a real landscape, where you have multiple ridges and valleys with irregular shapes.”
Perron and Moon created a procedure to numerically model the stresses underneath real, three-dimensional topography. The model computes the local effect of topography on gravitational forces due to the weight of overlying rock, and regional forces associated with the push or pull of tectonic plates.
“If you’re underneath a ridge, versus under a valley, the rock there should feel different stresses,” Perron says.
The model takes these stresses into account to determine whether and to what extent bedrock will crack under the pressure associated with a given landscape’s topography.
After simulating multiple complex landforms, the group observed that bedrock’s fractured zone varied with tectonic compression: In scenarios where the landscape was undergoing little compression, the modeled fractured zone ran parallel to the topography, dipping where there were valleys, and rising where there were ridges.
Conversely, in scenarios with high compression, the modeled fractured zone resembled a mirror image of the topography, being thicker under ridges, and thinner below valleys.
Gaining a foothold
To test the model, the group teamed up with researchers at the University of Wyoming who measure seismic waves in bedrock. As Perron explains, the speed at which seismic waves travel through rock can provide data on the mechanical state of the rock: Seismic waves move faster through solid rock, and slower through rock containing many fractures filled with air, water, or weathered material such as clay.
Perron, Moon, and the Wyoming group analyzed seismic surveys of sites with different amounts of tectonic compression in Colorado, South Carolina, and Maryland. They also measured electrical conductivity, another measure of the abundance of fractures filled with water or clay.
Based on their measurements, Perron and Moon found that the fractured zone of bedrock in all three sites matched the profiles predicted by their model. They confirmed these results by looking at pictures taken within boreholes. Such pictures of bedrock, at depth, gave the researchers further confirmation that the seismic and conductivity measurements did indeed reveal fractured zones.
“The presence of topography, and how that interacts with gravity and tectonics, actually makes a difference in the fracturing and weathering of the rock,” Perron says. “In order for life to gain a foothold in landscapes, you really have to break the rock apart and weather it. Fracturing the rock is the first step in creating this critical zone.”
Video
See how researchers can predict the extent of bedrock weathering based on a location’s topography.
Video: Melanie Gonick/MIT
Reference:
“Geophysical imaging reveals topographic stress control of bedrock weathering,” by J. St. Clair et al. Science, DOI: 10.1126/science.aab2210
Finding parasites on fossils is a rarity, since, as we humans have experienced with a shudder, they tend to attach to skin or soft tissue and not skeleton. However, a discovery led by the University of Cincinnati not only has uncovered the ancient remnants of two parasites on marine animals, but also revealed how the parasites and hosts evolved over hundreds of years. Carlton Brett, a University of Cincinnati University Distinguished Professor of geology, is among the UC researchers and more than 7,000 geoscientists from around the world to present discoveries at the Geological Society of America’s Annual Meeting, which takes place Nov. 1-4, in Baltimore, Md.
Both of the discoveries involved parasitic interactions with crinoids, a marine animal including the modern sea lilies. They’re stemmed ancient echinoderms, hard-coated marine animals that are also grouped with starfish, sea urchins and sand dollars. These crinoids existed on ancient sea bottoms hundreds of millions of years ago – including in the Greater Cincinnati region.
Parasitic Snails with Spines
The first example involved gastropods or snails, which attached to the crinoids. The snails acted as the parasite, positioning themselves over the waste chute of the crinoids. The crinoids’ waste was the snails’ free meal. So at first, neither animal was harmed in this so-called symbiotic relationship during the Silurian Period. Previous research found that over time, the snails apparently became more aggressive and harmful parasites, using their tongue as a drill to feed directly out of the gut of the crinoids, as discovered by Tomasz Baumiller, a professor of earth and environmental sciences at the University of Michigan, and UC alumnus Forest Gahn, a professor of geology at Brigham Young University-Idaho.
The UC research turned up yet another twist. As these creatures evolved during the Devonian Period – about 360-to-420 million years ago, there’s an increased frequency of snails on certain crinoids, and furthermore, the crinoids affected by the snails started developing a spiny appearance, as did the snails. Brett noted that only certain crinoids – about 10 species – were hosts for the snails, and that a majority of them showed large spines. Yet, of over 40 non-host species, none had well-developed spines, suggesting that only the crinoids that attracted snails developed spines. “We connected the spine growth to the rise of fish predators in the Devonian Period,” says Brett. “During the Devonian Period, there was a revolution of swimming predators, such as sharks, that could swim above the bottom of the sea and go after hard-shelled prey. Although the crinoids may not have been very delectable, based on living forms, the gastropods may well have been delicious ‘escargot’ to these larger predators. In this sense, the crinoids that hosted the snails were ‘targeted’ by the predators, which was detrimental to both the crinoids and their attached snails.” Brett suggests that because both species were adapting to fending off larger predators, they both developed their spiny appearance in an effort to avoid becoming a meal.
Longest-Known Parasitic Interaction
Brett says the second discovery involves the longest known parasitic-host relationship, in which the parasite is no longer believed to exist.
Its activity is traced from the mid-Ordovician to the mid-Jurassic periods – a span of about 300 million years. Some species of crinoids have nearly 50 percent of populations afflicted by this parasite. These parasites, believed to be worm-like, also affected certain crinoids by drilling out major parts of the skeleton, causing pitting and swelling. “Certain species of crinoids have as much as 40 percent of their skeleton removed by parasitic holes riddled out of them,” says Brett.
“One of our interesting discoveries is that the crinoids that were affected by the snails noted above were never crinoids that have the holes and pits in them, and vice versa,” continues Brett. “I’m suggesting that, in another twist, there might be a relationship in which the gastropods actually aided crinoids in keeping these worm-like parasites off their hosts, but this will require more study.”
Brett says the discoveries document two of the most long-lasting parasitic relationships known to scientists – involving animals living together in unbroken chains for 200 million to more than 300 million years. “The parasites never really were so harmful that they killed the hosts, but persisted in ‘ecological standoffs,’ even through major biological crises. Eventually, however, both groups became extinct,” says Brett.
Brett says he’s interested in exploring future research on populations of crinoids to see how they were affected over time by the parasites, for example, if they may have been stunted.
Other researchers on the project are Mark Wilson, the Lewis M. and Marian Senter Nixon Professor of Natural Sciences and Geology at the College of Wooster; and James Thomka, who recently earned his doctoral degree from UC and is now a college lecturer in geology at the University of Akron.
Numerous UC faculty and graduate students in geology are represented as lead or contributing authors on papers, posters and other presentations at the annual Geological Society of America meeting. Geoscientists from around the world – representing more than three dozen disciplines – will present new findings at the meeting that enlarge the body of geoscience knowledge and define directions for future study.
UC’s nationally ranked Department of Geology conducts field research around the world in areas spanning paleontology, quaternary geology, geomorphology, sedimentology, stratigraphy, tectonics, environmental geology and biogeochemistry.
James St. Clair, a University of Wyoming doctoral student, is the lead author on a Science paper that discovers the distribution of porosity in the subsurface of mountain watersheds can be determined by looking at the state of stress in the earth’s crust. Credit: Steve Holbrook Photo
University of Wyoming geoscientists have discovered that the underground water-holding capacity of mountain watersheds may be controlled by stresses in the earth’s crust. The results, which may have important ramifications for understanding streamflow and aquifer systems in upland watersheds, appears Oct. 30 in Science, one of the world’s leading scientific journals.
The scientists conducted geophysical surveys to estimate the volume of open pore space in the subsurface at three sites around the country. Computer models of the state of stress at those sites showed remarkable agreement with the geophysical images. The surprising implication, says Steve Holbrook, a UW professor in the Department of Geology and Geophysics, is that scientists may be able to predict the distribution of pore space in the subsurface of mountain watersheds by looking at the state of stress in the earth’s crust. That state of stress controls where subsurface fractures are opening up — which, in turn, creates the space for water to reside in the subsurface, he says.
“I think this paper is important because it proposes a new theoretical framework for understanding the large-scale porosity structure of watersheds, especially in areas with crystalline bedrock (such as granite or gneiss),” Holbrook says. “This has important implications for understanding runoff in streams, aquifer recharge and the long-term evolution of landscapes.”
James St. Clair, a UW doctoral student, is lead author of the paper, titled “Geophysical Imaging Reveals Topographic Stress Control of Bedrock Weathering.” Holbrook, Cliff Riebe, a UW associate professor of geology and geophysics; and Brad Carr, a research scientist in geology and geophysics; are co-authors of the paper.
Researchers from MIT, UCLA, the University of Hawaii, Johns Hopkins University, Duke University and the Colorado School of Mines also contributed.
Weathered bedrock and soil together make up the life-sustaining layer at Earth’s surface commonly referred to as the “critical zone.” Two of the three study sites were part of the national Critical Zone Observatory (CZO) network — Gordon Gulch in Boulder Creek, Colo., and Calhoun Experimental Forest, S.C. The third study site was Pond Branch, Md., near Baltimore.
“The paper provides a new framework for understanding the distribution of permeable fractures in the critical zone (CZ). This is important because it provides a means for predicting where in the subsurface there are likely to be fractures capable of storing water and/or supporting groundwater flow,” St. Clair says. “Since we cannot see into the subsurface without drilling holes or performing geophysical surveys, our results provide the means for making first order predictions about CZ structure as a function of the local topography and knowledge (or an estimate) of the regional tectonic stress conditions.”
The research included a combination of geophysical imaging of the subsurface — conducted by UW’s Wyoming Center for Environmental Hydrology and Geophysics (WyCEHG) — and numerical models of the stress distribution in the subsurface, work that was done at MIT and the University of Hawaii, Holbrook says.
The team performed seismic refraction and electrical resistivity surveys to determine the depth of bedrock at the three sites, which were chosen due to varying topography and ambient tectonic stress. At the two East Coast sites, the bedrock showed a surprising mirror-image relationship to topography; at the Rocky Mountain site, the bedrock was parallel to topography. In each case, the stress models successfully predicted the bedrock pattern.
“We found a remarkable agreement between the predictions of those stress models and the images of the porosity in the subsurface with geophysics at a large scale, at the landscape scale,” Holbrook says. “It’s the first time anyone’s really looked at this at the landscape scale.”
St. Clair says he was fortunate to work with a talented group of scientists with an extensive amount of research experience. He adds the experience improved his ability to work with a group of people with diverse backgrounds and improve his writing.
“Our results may be important to hydrologists, geomorphologists and geophysicists,” St. Clair says. “Hydrologists, because it provides a means for identifying where water may be stored or where the flow rates are likely to be high; geomorphologists, because our results predict where chemical weathering rates are likely to be accelerated due to increased fluid flow along permeable fractures; and geophysicists, because it points out the potential influence of shallow stress fields on the seismic response of the CZ.”
Despite the discovery, Holbrook says there is still much work to be done to test this model in different environments.
“But, now we have a theoretical framework to guide that work, as well as unique geophysical data to suggest that the hypothesis has merit,” he says.
Reference:
J. St. Clair1, S. Moon, W. S. Holbrook, J. T. Perron, C. S. Riebe, S. J. Martel, B. Carr, C. Harman, K. Singha, D. deB. Richter. Geophysical imaging reveals topographic stress control of bedrock weathering. DOI: 10.1126/science.aab2210
The Colima volcano is regarded as one of the most dangerous in Mexico due to its large explosive eruptions
Researchers from the Department of Earth Sciences at Royal Holloway, University of London, have developed a new method which could more accurately determine the conditions needed for a volcano to erupt. The study will be published on 28 October in Scientific Reports.
The team, composed of PhD students John Browning and Sandy Drymoni and Professor Agust Gudmundsson, used newly collected geological data and historical data on previous eruptions of the Santorini volcano in Greece, to work out the capacity of the volcano’s magma-chamber. They were then able to build a model which allowed them to estimate the pressure increase in the magma-chamber when it’s being refilled and therefore forecast when it’s likely to rupture and potentially cause an eruption.
The team travelled to island of Santorini in Greece to collect data on the type of magma which feeds eruptions. They took measurements of magma-filled fractures (dykes) which are exposed in impressive form along the northern wall of the Santorini caldera. Using geodetic data from 2012, when the volcano was thought to be close to an eruption, the team determined, using their new method, that the magma chamber did, in fact, not rupture at that time. Thus, while great volume of new magma was received by the Santorini chamber in 2012, so that it came close to rupture (and possible eruption), the chamber did not quite reach the rupture stage.
The new model has the potential to forecast when magma chambers in other volcanoes could rupture and potentially lead to eruptions, which should aid emergency planning and risk assessments.
John Browning, said: “We have been able to provide constraints on the volume of magma stored in a shallow magma chamber underneath Santorini Caldera. We believe our new model can be used to forecast the timing of magma-chamber rupture at Santorini and, eventually, at well-monitored volcanoes worldwide. Whilst this is an important step towards reliable prediction of volcanic eruptions, a number of challenges still exist. For example, even if the magma chamber were to rupture we currently have no way of predicting whether the magma-filled fracture (the dyke) injected from the chamber will make it to the surface. In most cases the magma stalls or stops before it reaches the surface. Under which conditions magma stalls in volcanoes (preventing eruption) is among the most important unsolved problems in volcanology.”
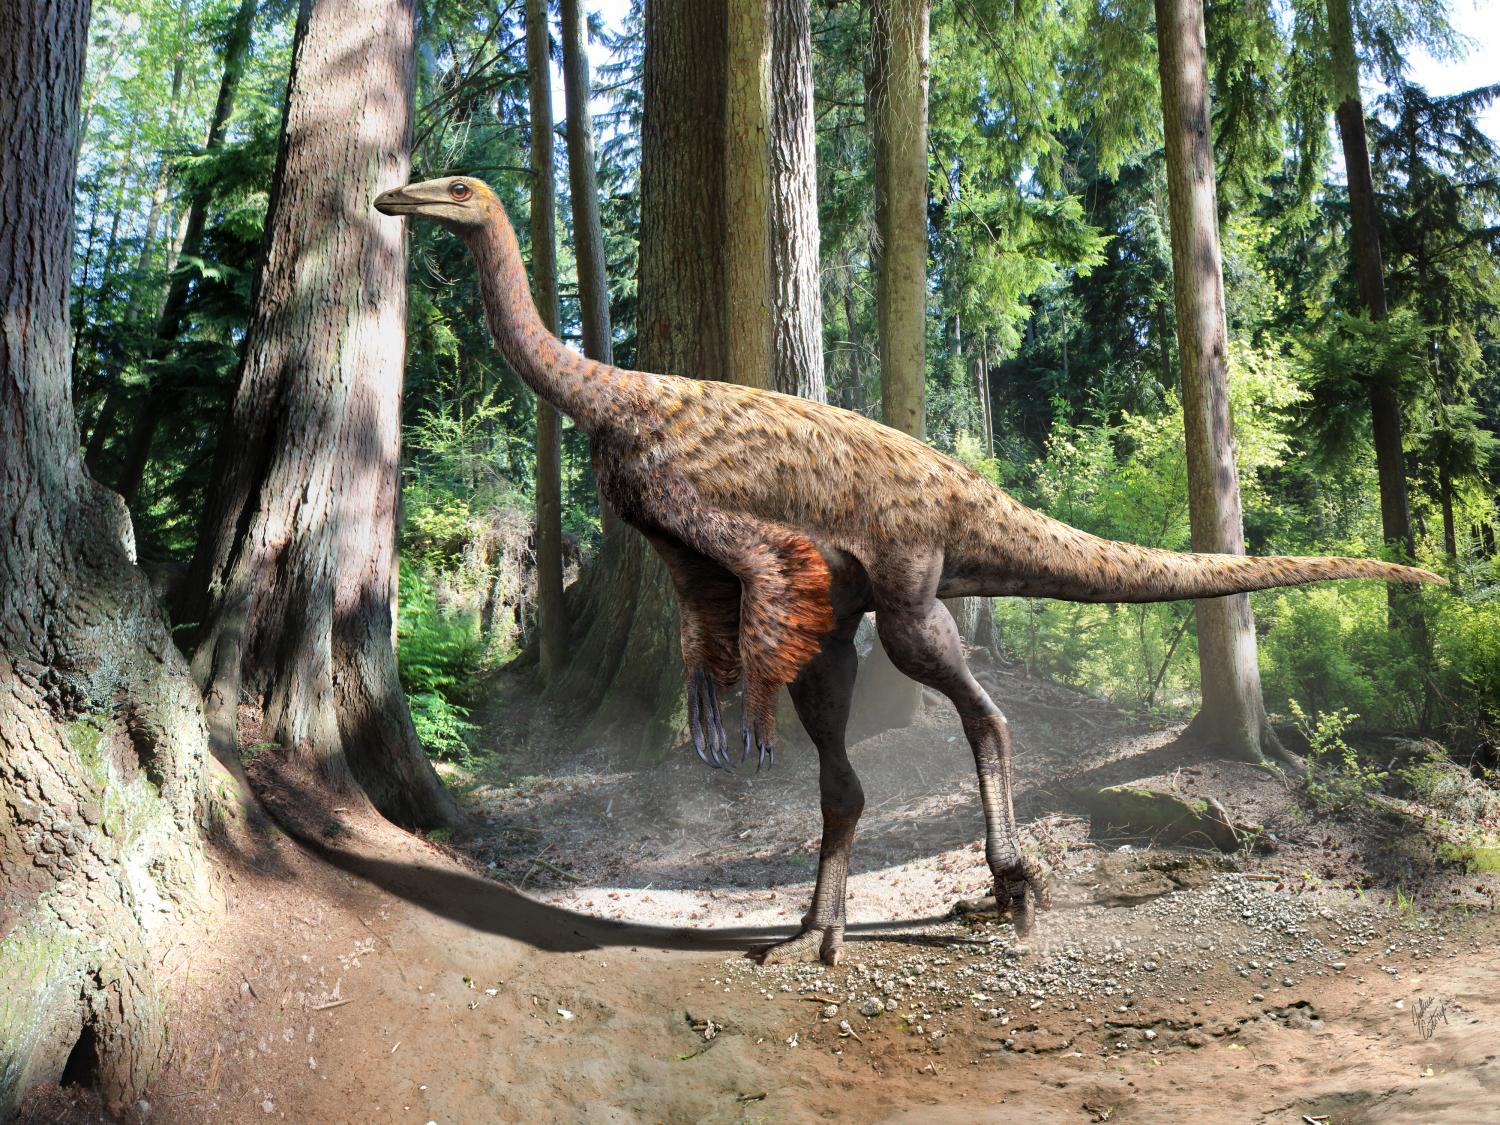
An illustration of Ornithomimus based on the findings of preserved tail feathers and soft tissue Credit: Julius Csotonyi
An undergraduate University of Alberta paleontology student has discovered an Ornithomimus dinosaur with preserved tail feathers and soft tissue. The discovery is shedding light on the convergent evolution of these dinosaurs with ostriches and emus relating to thermoregulation and is also tightening the linkages between dinosaurs and modern birds.
“We now know what the plumage looked like on the tail, and that from the mid-femur down, it had bare skin,” says Aaron van der Reest. This is the first report of such preserved skin forming a web from the femoral shaft to the abdomen, never before seen in non-avian dinosaurs. “Ostriches use bare skin to thermoregulate. Because the plumage on this specimen is virtually identical to that of an ostrich, we can infer that Ornithomimus was likely doing the same thing, using feathered regions on their body to maintain body temperature. It would’ve looked a lot like an ostrich.” In fact, this group of animals—referred to as ornithomimids—is commonly referred to as “ostrich mimics.”
Although the preserved feathers are extremely crushed due to sediment compaction, scanning electron microscopy reveals a three-dimensional keratin structure to the feathers on the tail and body. van der Reest made the initial discovery during his first year as an undergraduate student, supervised by Philip Currie, Canada’s leading palentologist.”It’s pretty remarkable. I don’t know if I’ve stopped smiling since.”
Predicting future adaptations to environmental changes
This new specimen—one of only three feathered Ornithomimus specimens in the world—is shedding light on the animal’s evolutionary adaptation to different environments. “We are getting the newest information on what these animals may have looked like, how they maintained body temperatures, and the stages of feather evolution.” van der Reest notes that the findings may be used to further understand why animals have adapted the way they have and to predict how animals will have to adapt in the future in order to survive environmental changes.
“This specimen also tightens the linkages between dinosaurs and birds, in particular with respect to theropods,” says Alex Wolfe, second author on the paper. “There are so many components of the morphology of this fossil as well as the chemistry of the feathers that are essentially indistinguishable from modern birds.”
The discovery may also alter future excavation techniques, explains van der Reest. “If we can better understand the processes behind the preservation of the feathers in this specimen, we can better predict whether other fossilized animals in the ground will have soft tissues, feathers, or skin impressions preserved.”
Reference:
A densely feathered ornithomimid (Dinosauria: Theropoda) from the Upper Cretaceous Dinosaur Park Formation, Alberta, Canada, DOI: 10.1016/j.cretres.2015.10.004
Reconstruction of the Iberian lynx that lived in the Iberian Peninsula 1.6 million years ago. Credit: José Antonio Peñas (Sinc)
The remains of an Iberian lynx specimen which lived 1.6 million years ago – the oldest ever discovered – were found resting in a cave in Barcelona (Spain). This discovery not only allows us to shed light on the origins of one of the world’s most endangered feline species, but it also means that the emergence of this species on the Iberian Peninsula dates back half a million years earlier than what was originally believed.
This newly discovered specimen was 10 to 20 centimetres larger and around 10 kilograms heavier than the Iberian lynx that currently inhabits Doñana National Park in Spain. Its coat was also longer than it is today in order to withstand continuous near-freezing temperatures. This description of the feline was formulated after a study was carried out on one of the first Iberian lynxes that ever lived in Spain.
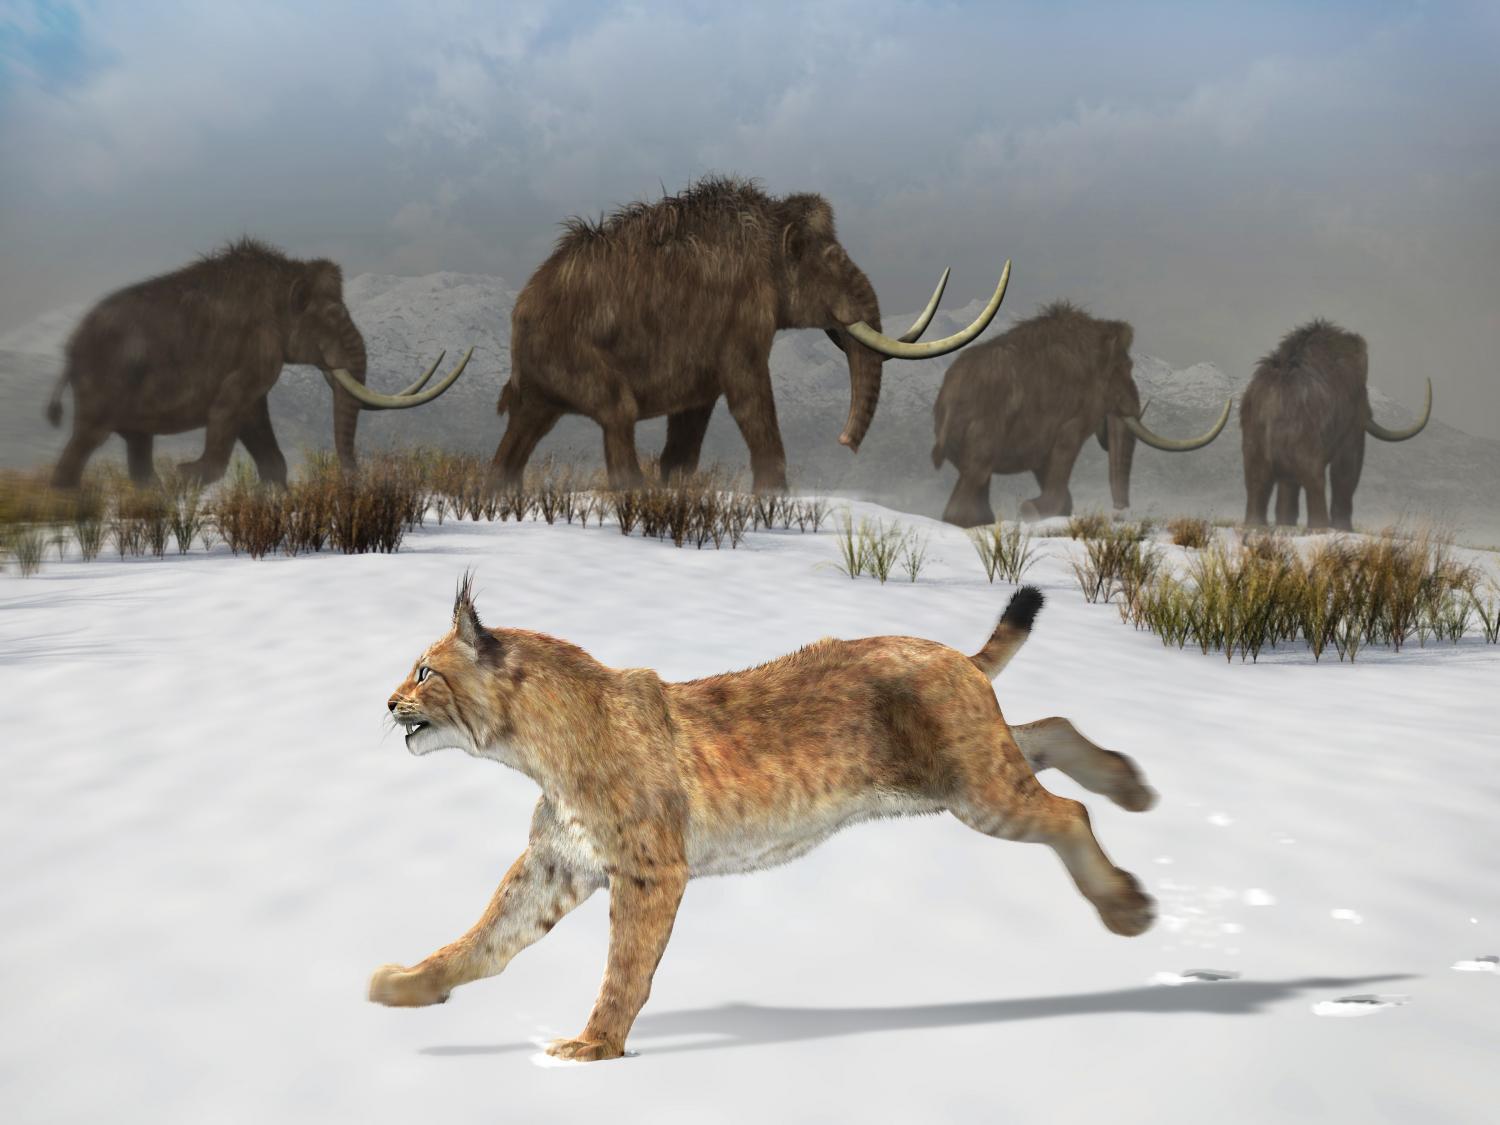
Part of a cranial fossil belonging to an Iberian lynx (Lynx pardinus) was uncovered among the horse, goat, deer, woolly mammoth, fox and wolf bones preserved in the Avenc Marcel Cave located in the Garraf massif of Barcelona. This is the oldest Iberian lynx that has been found on the Iberian Peninsula to date and it was discovered by the scientist Manel Llenas in 2003.
The fossil remains of this feline are proof of its presence on the Iberian Peninsula as early as 1.6 to 1.7 million years ago. Up until now scientists had dated the appearance of the Iberian lynx to between 1 and 1.1 million years ago. Thus, this discovery means that the emergence of this feline on the Iberian Peninsula actually dates back 500,000 years earlier than what scientists originally thought.
“We have confirmed this earlier appearance of the Iberian lynx based on initial molecular studies that estimate the emergence of this feline during the Early Pleistocene in the Iberian Peninsula,” asserts Alberto Boscaini to SINC, a researcher at the Miquel Crusafont Catalan Institute of Palaeontology (ICP) and the main author of this study published by Quaternary Science Reviews.
Timeline of the evolution of this species
In order to understand the origins of the Iberian Peninsula’s most emblematic species and one of the world’s most endangered felines according to the International Union for Conservation of Nature (UICN), we must first go back in time.
The common ancestor of all the species belonging to the Lynx genus, Lynx issiodorensis, first appeared in North America about four million years ago before spreading to the continents of Asia and Europe where it persisted throughout time. These species underwent few changes, with the most evident being a decrease in size.
The first species of lynx to evolve was Lynx rufus about 2.5 million years ago when it scattered across North America. In Asia Lynx lynx emerged, the species that would later spread across Europe. This feline also spread across North America about 200,000 years ago, thus giving rise to Lynx canadensis which displaced Lynx rufus towards the south.
The European population of L. issiodorensis led to the appearance of Lynx pardinus one and half million years ago. Since then, this species has endured few changes to its genetics and continues to inhabit the Iberian Peninsula today. According to scientists, this evolution may have taken place when the Iberian Peninsula became isolated due to one or several consecutive glacial periods.
The new date provided by the study -1.6 million years ago- lines up with the period of time when all of southern Europe, especially the Iberian Peninsula, became a refuge from the Quaternary glaciation.
Glacial periods alternated with interglacial periods that “greatly influenced wildlife, especially mammals, in that habitat,” the expert adds.
This refuge was also home to the European rabbit (Oryctolagus cunilus), the Iberian lynx’s primary prey more than 75% of the time. The morphological analyses carried out on the cranium found in Catalonia confirm the type of diet consumed by this feline.
“Other cranial features – such as those related to this carnivore’s diet – are proof that the Iberian lynx hunted small-sized prey such as lagomorphs and rodents which had a great presence during that time period,” the researcher states to SINC.
According to the study, speciation of the Iberian lynx could therefore be related to the special diet still followed by these specimens inhabiting our planet today, including the rabbit as their primary prey.
Video
Reference:
Alberto Boscaini et al. The origin of the critically endangered Iberian lynx: Speciation, diet and adaptive changes, Quaternary Science Reviews (2015). DOI: 10.1016/j.quascirev.2015.07.001
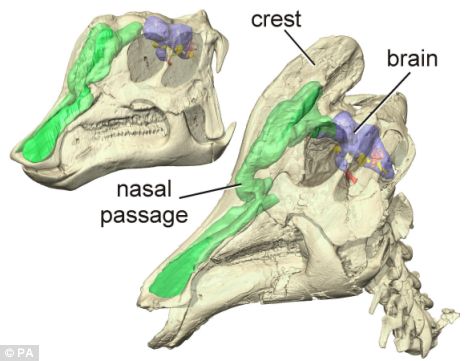
“My work represents the first test of the hypothesis that the elaborated nasal passages of large dinosaurs functioned as efficient heat exchangers,” explained Jason Bourke, doctoral student researcher at Ohio University and lead author of the study. Using a branch of engineering known as computational fluid dynamics, Bourke simulated the movement of air and heat through the nasal passages of various dinosaur species.
Nasal passages act as air conditioners, warming and humidifying air as it is breathed in, and cooling and drying it as air leaves the body. This process cools blood destined for the brain. Modern mammals, birds, lizards, and crocodiles use a variety of structures — some simple, and some complex — to accomplish heat exchange efficiently. However, detailed reconstruction of the 3-dimensional shape of the nasal passages in dinosaurs have shown that large dinosaurs, whose bodies would have held on to more heat than smaller-bodied animals, needed elaborate and specialized nasal passages to avoid overheating their brains.
“For most dinosaurs that I looked at, there would have been a substantial amount of physiologically active soft tissues in their noses,” continued Bourke. “This strongly suggests that dinosaur airways were more than capable of changing the attributes of respired air.” These findings provide an answer to the mystery of how dinosaurs avoided having their large bodies overheat their small brains, a question that has plagued paleontologists reconstructing dinosaur physiology.
” By having this blood detour through the nasal passages and dump some of that excess heat before reaching the brain, dinosaurs were able to keep their brains at an optimum temperature for their bodies,” said Bourke.
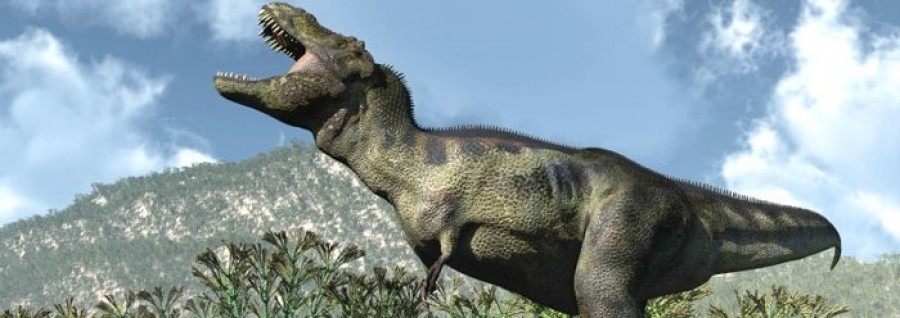
In 2001, a paleontology field crew from Burpee Museum of Natural History (Rockford, IL) were prospecting for dinosaur fossils near Ekalaka, Montana, when they discovered bones of a half-grown T. rex weathering out from exposures of the Hell Creek Formation. “Jane”, as she was later named, turned out to be the most complete adolescent T. rex ever discovered, filling a critical gap between juvenile and adult that had caused decades of scientific debate.
Prior to Jane’s discovery, a small lightly built tyrannosaur skull collected near Ekalaka in 1942 had been at the center of a controversy over how much T. rex changed during growth. The skull had spent an uneventful half century on display at Cleveland Museum of Natural History, Ohio, when in 1988, famed paleontologist Dr. Robert Bakker redescribed the fossil as a new species, Nanotyrannus lancensis, proposing that it represented a smaller, more sleek cousin of T. rex.
This interpretation has been controversial since 1999 when Dr. Thomas Carr showed that the differences between “Nanotyrannus” and those of adult T. rex are also seen during growth in other species of tyrannosaurids. This suggested that the Cleveland skull was from a juvenile T. rex rather than being a separate species in its own right. However, this hypothesis met with surprising resistance. Could a dinosaur really change that much during growth?
“The extreme changes from the sleek skull of juveniles to the robust skull of adults were too much for some people to believe; for example, they didn’t like to hear that T. rex lost tooth positions as it grew from a juvenile with many teeth, to an adult with fewer teeth. Regardless, the search was on for a transitional specimen that could test the hypothesis.”
Enter Jane. Her fine skull and skeleton was intermediate in size and shape between the Cleveland skull and fully adult T. rex. Carr’s research team presented a detailed study of Jane at the Society of Vertebrate Paleontology 2015 annual meeting in Dallas.
“Jane shows us that the gap is in fact bridgeable because many features seen in her are more similar to adult T. rex than to the Cleveland skull. The features are exactly what we’d predict are necessary to make the change to a full adult.” said Carr.
Another important dimension of the “Jane” story is that she was discovered on public lands, then collected and mounted for display by a public museum. “Dinosaur fossils such as this emphasize the importance of accredited institutions collecting on public lands, which makes the specimens on them available for scientific study”, asserts Dr Carr.
In a world where commercially collected dinosaurs demand ever upwardly spiralling prices, Jane is a world-class dinosaur that didn’t come with a million dollar price tag. Burpee Museum director of science and exhibits, Scott Williams, summed up:
“Jane is simply the best preserved and most complete example of a publicly accessible, subadult Tyrannosaurus rex in the world. For the last 10 years she has been available to qualified researchers as well as exhibited to the general public. The quality of the specimen and its availability will undoubtedly provide researchers decades of important data regarding the ontogeny of the most recognized dinosaur species in the world.”
Regardless of Jane’s completeness and growth stage, she doesn’t close the book on T. rex growth and evolution; there is still a gap for yet undiscovered fossils to fill between her sleek form and the deep, imposing skulls of adults.
Reconstruction of Protocinctus mansillaensis in life position. Credit: O. Sanisidro
Scientists have used computer simulations to reconstruct feeding in the common ancestor shared between humans and starfish, which lived over half a billion years ago.
The international team of researchers from the UK and Spain, led by Dr Imran Rahman from the University of Bristol, tested competing theories for feeding in a 510-million-year-old fossil using computational fluid dynamics, an engineering tool.
The fossil under study is a ‘primitive’ relative of starfish and sea urchins and belongs to a group of marine animals known as echinoderms. It is thought to lie close to the base of the echinoderm tree of life.
The results of the computer simulations show that the animal fed by actively drawing water into its mouth using internal gill slits, rather than passively waiting for food to come to it. Because the fossil represents one of the earliest ever echinoderms, this also suggests that the ancestor of echinoderms and vertebrates employed the same feeding strategy.
The fossil is named Protocinctus mansillaensis and it belongs to an extinct group of echinoderms called cinctans. It was discovered in rocks from northeast Spain.
Lead author, Dr Rahman, a palaeontologist in Bristol’s School of Earth Sciences said: “Humans and other vertebrates (animals with backbones) are part of a major group known as deuterostomes, which also includes invertebrates such as sea urchins, starfish and acorn worms. It has been very difficult to work out what the ancestor of all these groups looked like and how it fed because the modern forms are so different from one another. However, by studying one of the earliest fossil echinoderms with the aid of sophisticated methods we have been able to learn more about our ancient ancestry.”
Co-author Dr Samuel Zamora, a researcher at the Geological and Mining Institute of Spain, added: “The application of cutting-edge techniques, like CT scanning and computational fluid dynamics, allowed us to reconstruct the feeding mode of this long-extinct animal for the first time.”
Computational fluid dynamics is a method for simulating fluid flows that is commonly used in engineering, for example in aircraft design, but this is one of the first applications in palaeontology.
Dr Peter Falkingham, also a co-author on the study and a palaeontologist at Liverpool John Moores University, said: “The advantage of using simulation techniques like this is that you can control all of the variables and test things one by one. We could set up multiple experiments that were identical save for one variable, such as the animal’s orientation, to explore the effects on feeding performance.”
The study is published today in the journal Proceedings of the Royal Society B.
Reference:
Cambrian cinctan echinoderms shed light on feeding in the ancestral deuterostome. Proceedings of the Royal Society B DOI: 10.1098/rspb.2015.1964
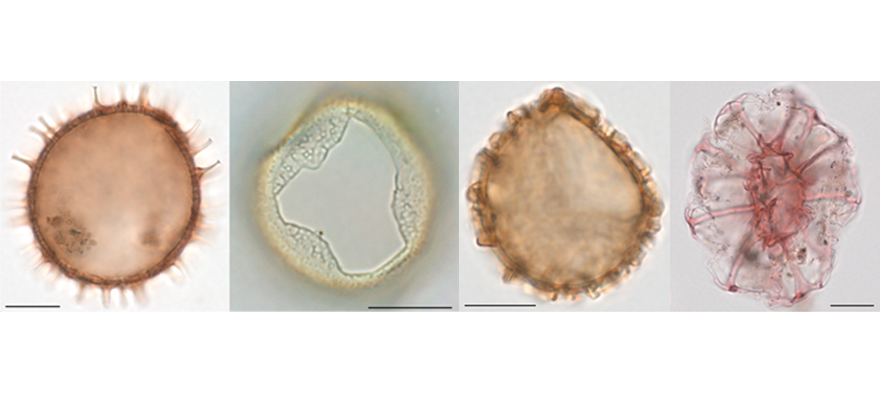
The cooling of the Nordic Seas towards modern temperatures started in the early Pliocene, half a million years before the global oceans cooled. A new study of fossil marine plankton published in Nature Communications today demonstrates this.
In the Pliocene, 5.3 to 2.6 million years ago, the world was generally warmer than today. The cooling of the oceans toward the modern situation started from 4 million years ago, but a new study now shows that the Nordic Seas cooled 500,000 year earlier.
Stijn De Schepper, researcher at Uni Research and the Bjerknes Centre for Climate research, has together with colleagues from the University of Bergen, the Alfred Wegener Institute in Germany and the Korea Polar Research Institute, investigated the fossil remains of microscopic marine plankton, especially dinoflagellate cysts, in two sediment cores from the Norwegian Sea and the Iceland Sea.
“We see that the dinoflagellate cyst assemblages underwent fundamental changes around 4.5 million years ago. Together with the simultaneous first occurrence of cool-water Pacific mollusks in Iceland, our results demonstrate that the Nordic Seas cooled significantly,” De Schepper says.
Major ocean current changes
This new study and the earlier work on migration of Pacific mollusks into the Nordic Seas suggest that the Bering Strait was open at this time, and that cool water from the Pacific flowed into the Arctic. This cool water flowed southwards along East Greenland and into the Nordic Seas, where we started to see the same temperature and circulation pattern as we have today.
Today, the Nordic Seas surface waters are characterised by an east-west temperature gradient. The southernmost part of Greenland is at the same latitude as Bergen and Oslo in Norway, but the climate in Greenland is much cooler. The warm water near Scandinavia is brought northwards via the Norwegian Atlantic Current, a continuation of the North Atlantic Current, and is today responsible for the mild winter climate along the coast of Norway. Along east Greenland a cold water current known as the East Greenland Current flows southward and transports the major part of all exported Arctic sea ice.
Thermal isolation of Greenland
“Our study shows that a surface water temperature gradient was only established since 4.5 million years ago, when warm waters continued to flow along the Scandinavian coast and cool water entered the Nordic Seas along Greenland’s east coast,” De Schepper says.
In the early Pliocene the icecap on Greenland was restricted to mountain glaciers. The cool surface water that arrives from 4.5 million years ago in the western Nordic Seas isolates Greenland from the warmer water in the eastern Nordic Seas. This cool water likely leads to cooler temperatures in Greenland and the expansion of the Greenland ice sheet in the late Pliocene.
Reference:
Stijn De Schepper, Michael Schreck, Kristina Marie Beck, Jens Matthiessen, Kirsten Fahl, Gunn Mangerud. Early Pliocene onset of modern Nordic Seas circulation related to ocean gateway changes. Nature Communications, 2015; 6: 8659 DOI: 10.1038/ncomms9659
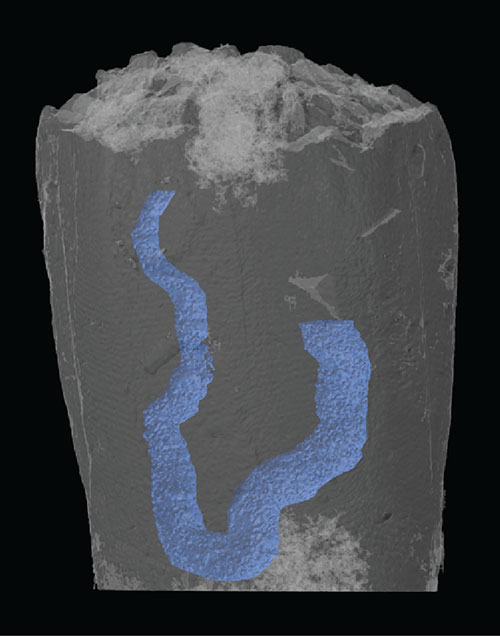
3-D reconstruction of the fossil with the gut shown in blue. The fossil is less than 3 mm in height. Credit: I. Rahman
The inner workings of a tiny fossil have been studied using X-ray microscopy, revealing evidence of the digestive system for the first time. Researchers from the University of Bristol, Appalachian State University, the University of Tennessee, Knoxville and the Paul Scherrer Institut analysed the unique fossil specimen using high-energy X-rays at the Swiss Light Source in Switzerland.
The fossil under study is a ‘primitive’ relative of modern sea urchins and starfish and is part of a major group of marine invertebrates called echinoderms.
The results of X-ray imaging prove that the fossil represents an early developmental stage of an extinct group known as blastoids. It can therefore shed light on the early evolutionary history of echinoderms.
Lead author, Dr Imran Rahman, a palaeontologist in Bristol’s School of Earth Sciences said: “We used a particle accelerator called a synchrotron to image the fossil in 3D. This allowed us to create a digital reconstruction of its internal anatomy.”
Co-author Dr Johnny Waters, Professor in Invertebrate Paleontology at Appalachian State University, added: “We were very surprised to find evidence of the gut. Nothing like this has ever been seen in fossils belonging to this group before.”
Dr Colin Sumrall, a co-author and Assistant Professor in Paleobiology at the University of Tennessee, Knoxville, said: “The results have highlighted a number of previously unknown differences between the fossil and its living relatives. This has forced us to rethink our ideas about how the digestive system evolved in echinoderms.”
Co-author Dr Alberto Astolfo, who helped perform the experiments at the Swiss Light Source, said: “Synchrotron radiation is the state-of-the-art in X-ray imaging. This study provides further confirmation that palaeontology is one of the most exciting applications for the technique.”
The work was supported by funds from the UK’s Royal Commission for the Exhibition of 1851 and the US National Science Foundation.
The study is published today in the journal Biology Letters.
Reference:
Imran A. Rahman, et al. Early post-metamorphic, Carboniferous blastoid reveals the evolution and development of the digestive system in echinoderms Biology Letters.DOI: 10.1098/rsbl.2015.0776
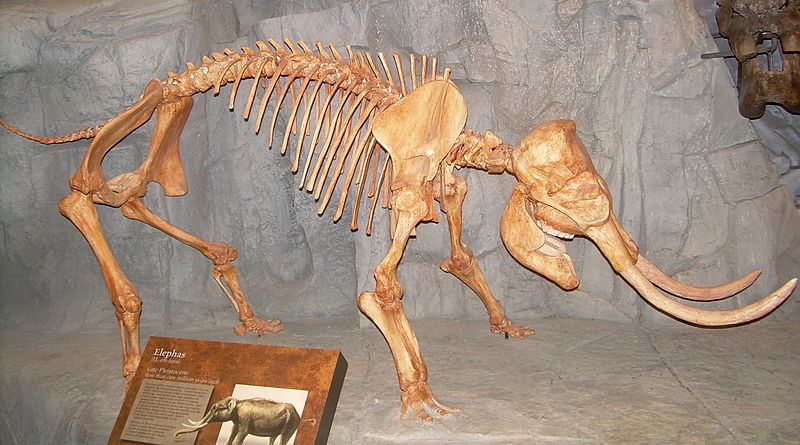
Photograph of a fossil cast of a pygmy species of Elephas/Palaeoloxodon falconeri skeleton taken at the North American Museum of Ancient Life. Credit: Ninjatacoshell
At the 2015 Society of Vertebrate Paleontology meetings, researcher Michael Cherney of the University of Michigan, presented findings about weaning age (i.e. when a calf stops nursing) in fossil mammoths. By studying modern African elephants at the Toledo Zoo, Cherney was able to characterize the isotopic effects of weaning in a close relative of mammoths. Decreased nursing causes predictable changes in the isotopic composition of elephant tail hairs sampled over time.
The key to Cherney’s research is that these same nitrogen isotopes are preserved in fossil mammoth tusks, which grew throughout life. Records of early life history in tusks from juvenile mammoths can be used to determine the age at which individuals were weaned. He combined this with the knowledge that climate stress has been associated with delayed weaning in modern elephants, while overhunting of can lead to accelerated maturation in populations. His results suggest that weaning age in Siberian woolly mammoths decreased leading up to extinction. This is inconsistent with climate change being the cause of extinction and provides evidence for overhunting shortly before they went extinct.
“I think analysis of life-history data from fossil proboscidean tusks is a tool that could resolve questions concerning the late Pleistocene extinctions of various fossil elephant species. These insights also give context for understanding other contemporaneous extinctions and the impact of past human populations on their environments,” said Cherney.