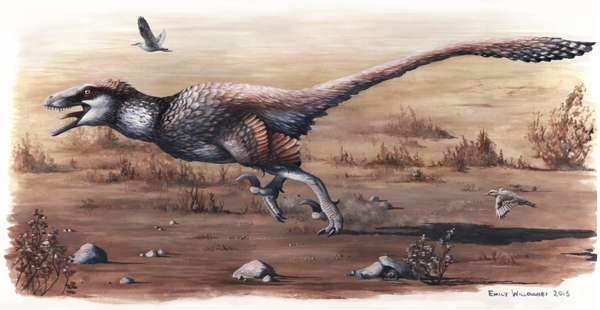
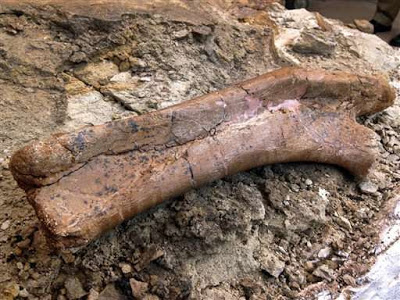
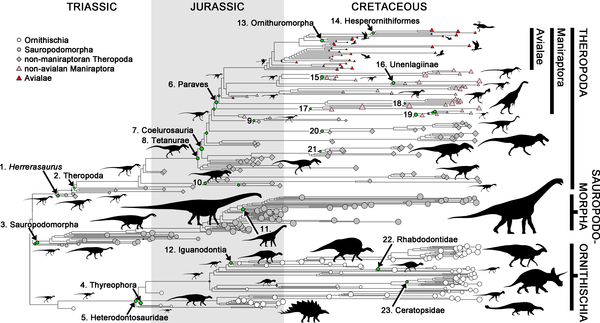
A research team led by a University of Kansas alumnus has identified a new giant raptor, the largest specimen ever found with wing feathers.
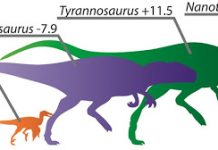
Named Dakotaraptor, the fossil from the Hell Creek Formation in South Dakota is thought to be about 17 feet long, making it among the largest raptors in the world.
“This new predatory dinosaur also fills the body size gap between smaller theropods and large tyrannosaurs that lived at this time,” KU Paleontologist and co-author David Burnham said.
Robert DePalma, curator of vertebrate paleontology at the Palm Beach Museum of Natural History and lead author of the research, led the expedition to South Dakota where the specimen was found. At the time, he was a graduate student studying with former KU paleontology professor and curator Larry Martin, who died in 2014.
“This Cretaceous period raptor would have been lightly built and probably just as agile as the vicious smaller theropods, such as the Velociraptor,” De Palma said. He added that the both fossils showed evidence of “quill knobs” where feathers would have been attached to the forearm of the dinosaur.
This also demonstrates that flightlessness evolved several times in this lineage leading to modern birds.
The peer-reviewed research was published Oct. 30 in Paleontological Contributions.
Reference:
Robert A. DePalma et al. The first giant raptor (Theropoda: Dromaeosauridae) from the Hell Creek Formation, Paleontological Contributions (2015). DOI: 10.17161/paleo.1808.18764
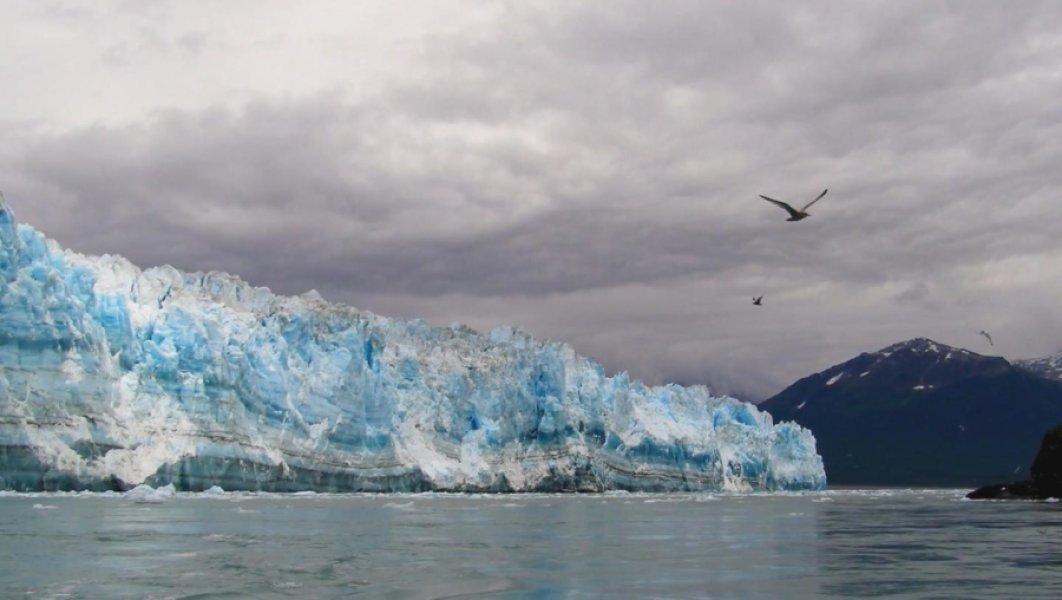
Terminus of the Hubbard Glacier at Resurrection Bay. The ice front is about 300 feet high. Credit: provided by UC’s Eva Enkelmann
For millions of years global climate change has altered the structure and internal movement of mountain ranges, but the resulting glacial development and erosion can in turn change a mountain’s local climate. The degree of this cause-and-effect relationship has never been clearly observed, until now.
Based on research led by University of Cincinnati geologist Eva Enkelmann in the St. Elias Mountain Range — located along the Pacific coastal region of North America — the way a mountain range moves and behaves topographically can also change and create its local climate by redirecting wind and precipitation. The repercussions of these changes can in turn, accelerate the erosion and tectonic seismic activity of that mountain range.
Based on her findings, Enkelmann shows clear evidence for a strong relationship between global and local climate change and a mountain’s internal tectonic plate shifts and topographic changes.
Enkelmann, an assistant professor in the University of Cincinnati Department of Geology, was among several UC researchers and thousands of geoscientists from around the globe presenting their findings at the 2015 Annual Geological Society of America Meeting, Nov.1-4, in Baltimore.
This research also was published in July in the journal Geophysical Research Letters.
Moving Mountains
“To understanding how mountain structures evolve through geologic time is no quick task because we are talking millions of years,” says Enkelmann. “There are two primary processes that result in the building and eroding of mountains and those processes are interacting.”
Looking at the St. Elias Mountains in particular, Enkelmann notes how dry it is in the northern part of the mountain range. But the precipitation is very high in the southern area, resulting in more erosion and material coming off the southern flanks. So as the climate change influences the erosion, that can produce a shift in the tectonics. This has been suggested in earlier studies based on numerical and analytical models, however, it had not yet been shown to have occurred over geologic times in the real world.
Enkelmann synthesized several different data sets to show how a rapid exhumation occurred in the central part of the mountain range over four to two million years ago. This feedback process between erosion and internal tectonic shifting resulted in a mass of material moving up toward the surface very rapidly.
Enkelmann’s model suggests that global climate shifts triggered a change in the rheology — the way material behaves.
While Earth was much warmer millions of years ago, glaciers still existed in the high altitudes. However, 2.6 million years ago Earth experienced a shift to a colder climate and glaciation intensified. Existing glaciers grew larger, froze solid, covered the area and did not move.
Enkelmann says the glaciers today are wet-based and are moving, very aggressively eroding material around and out, and in the case of her observation, into the Gulf of Alaska. The tectonic forces (internal plates moving toward one another) continue to move toward Alaska, get pushed underneath and the sediment on top is piling up above the Yakutat plate.
Shake, Rattle and Roll
Adding to the already complex effects of climate change, these processes essentially work against each other.
The movement of glaciers can compete with the internal buildup and develop a feedback process that is very rapid and ferocious. Scientists have suggested that the Himalayas, European Alps and mountains in Taiwan were caused by the same competing reactions as those Enkelmann has observed in southeastern Alaska.
In Enkelmann’s observation, the climate-driven erosion can influence the tectonics and change the motion of the rocks in that area. This makes studying the St. Elias Mountain Range particularly ideal because this area is very active tectonically, with strong glacial erosion. As an example, she cites the Great Alaskan Earthquake of 1964 — the world’s second largest earthquake recorded to date — that also resulted in a tsunami.
“In 1899, there were two big earthquakes in a row, an 8.1 and an 8.2 magnitude, says Enkelmann pointing to a photo of the resulting shoreline lift that still stands today. “These earthquakes resulted in up to 14 meters of co-seismic uplift on the shore, so the shoreline basically popped up 14 meters (45 feet) and it happened immediately.
“Our biggest concern today is the continued potential for earthquakes that can also result in tsunamis,” says Enkelmann.
Enkelmann appreciates the challenge of collecting samples here because this range has the highest peaks of any coastal mountain range and is only 20 kilometers from the Pacific Ocean, but she points out that it is a tough area to study because of the big ice sheets.
“So as geologists, we go to the area and take samples and do measurements in the field on the mountain ranges that stick out,” says Enkelmann. “One approach is to sample the material that comes out of the glaciers that has transported the eroded sediment and analyze that sediment.
“By going to all of these individual glaciers, we can get a much better understanding of what has happened and what was moved on the entire mountain range.”
Video
Published research by University of Cincinnati’s Eva Enkelmann, assistant professor of geology in McMicken College of Arts & Sciences shows clear relationship between climate-influenced erosion and long term exhumation and movement of rock, particularly in the southern portion of the North American Pacific coastal St. Elias Mountain Range.
Video created by Melanie Schefft/UC E-News. Photos by Eva Enkelmann.
Reference:
Eva Enkelmann, Peter O. Koons, Terry L. Pavlis, Bernard Hallet, Adam Barker, Julie Elliott, John I. Garver, Sean P. S. Gulick, Rachel M. Headley, Gary L. Pavlis, Kenneth D. Ridgway, Natalia Ruppert, Harm J. A. Van Avendonk. Cooperation among tectonic and surface processes in the St. Elias Range, Earth’s highest coastal mountains. Geophysical Research Letters, 2015; 42 (14): 5838 DOI: 10.1002/2015GL064727
Groundbreaking scientific work led by researchers at the University of St Andrews is redefining the trajectory of planetary evolution.
It is widely accepted that the juvenile Earth’s atmosphere was devoid of oxygen until around 2.4 billion years ago, when oxygen concentrations rose abruptly during what is known as the ‘Great Oxidation Event’ (GOE). This event fundamentally altered the chemistry and the ecological structure of our planet, ultimately paving the way for the emergence of complex life.
Researchers from the Department of Earth & Environmental Sciences at St Andrews, in collaboration with the University of Leeds (UK), the University of Maryland (USA), and NASA Goddard Space Flight Center (USA), have revolutionised this narrative of atmospheric history, based on chemical analysis of sedimentary rocks deposited immediately prior to the GOE.
These rocks – from South Africa and Western Australia – suggest that Earth’s early oxygen-free atmosphere was far more fascinating than previously thought. Namely, these new geochemical analyses reveal widespread periodic occurrences of a hydrocarbon-rich “haze”, similar to the atmosphere on Saturn’s Moon, Titan.
The findings are published in Earth and Planetary Science Letters, a leading journal for researchers across the Earth and planetary sciences community.
Dr Gareth Izon, who led the research, said: “These data are really exciting because we now see evidence for a hazy atmosphere in multiple spatially separated sedimentary successions spanning nearly 200 million years of Earth history.”
The researchers speculate that episodic bursts of methane production from specialised microorganisms (“methanogens”) could explain this phenomenon.
Dr Aubrey Zerkle, principal investigator of the project, said: “These events provide a spectacular example of the role of biology in modulating our planetary atmosphere, particularly on the early Earth when microbes ruled the planet.”
“Importantly, these new records emphasise the need to understand the mechanisms and feedbacks controlling both biogenic oxygen and methane fluxes in the prelude to the GOE,” Izon continued.
Dr Mark Claire, a co-author on the study, added: “This biologically-produced methane haze scatters sunlight, so could have had dramatic consequences on the climate. Examining the early Earth has once again revealed a complicated and fascinating interplay between Earth and the life it supports.”
Reference:
Gareth Izon et al. Multiple oscillations in Neoarchaean atmospheric chemistry, Earth and Planetary Science Letters (2015). DOI: 10.1016/j.epsl.2015.09.018
The arm bones belonging to a baby Pentaceratops is unveiled at the New Mexico Museum of Natural History and Science in Albuquerque, N.M., on Thursday, Nov. 5, 2015. Hundreds of people turned out for the unveiling of the baby dinosaur fossils. Credit: AP Photo/Susan Montoya Bryan
Paleontologists with the New Mexico Museum of Natural History and Science unveiled the first baby Pentaceratops skull ever discovered as hundreds of people lined up to get a look.
Scientists had cut open the giant plaster jacket that protected the skull as it was airlifted out of the desert badlands of northwestern New Mexico and trucked to the museum.
They revealed the shield-like part of the dinosaur’s skull, some teeth, an arm bone, a rib and what looked like a vertebrae, but museum curator Spencer Lucas said there’s still much work to be done.
Now, technicians will begin the painstaking work of digging out the fossils from the rock in which they have been encased for some 70 million years.
The process will take many months, but the public will be able to watch from windows that offer a view into the museum’s preparation room.
Hundreds of people, including parents with their children, lined up along the windows during a free public viewing Thursday evening. Some children were able to get an up-close look as museum staff showed off the find, while other visitors held up their smartphones on the other side of the glass.
Lucas said the fossils are significant and sure to provide new insight into the rhinoceros-like, plant-eating dinosaurs that roamed North America tens of millions of years ago.
Less than 10 adult Pentaceratops skulls have been unearthed over the past century, and this marks the first baby skull to ever be recovered, Lucas said.
“So here now we have the first glimpse at growth and the early stages of life of this dinosaur,” he said.
Experts say Pentaceratops was one of the largest, if not the largest horned dinosaur that ever lived. It could be up to 27 feet long and weigh 5 tons or more.
Paleontologists suspect Pentaceratops may have used its five horns for defense. Evidence also suggests the horns and the shield-like part of the skull could have been used to attract mates.
The remains of the young Pentaceratops appear to have been washed through a streambed, as some of the skeleton has fallen apart. But how the animal met its demise is up for investigation, scientists said.
Muddy conditions last week prevented the team from transporting the plaster jacket that contained the remainder of the baby’s skeleton. That will happen later.
The discovery was made in 2011 in the Bisti Wilderness by Amanda Cantrell, the museum’s geoscience collections manager. A few years of planning, permitting and excavation followed with the help of New Mexico National Guard Blackhawk helicopters.
Pilot Kevin Doo attended the unveiling with his wife and child. He said it was amazing to see the precious cargo unwrapped.
“What a terrific find,” he said, noting that a lot of hard work went into pulling off the unique recovery mission.
A crew of museum staff and volunteers also had to pack in tons of tools, water, plaster and other materials to prepare the fossils for removal because the find was made within a federally protected wilderness area.
Researchers have uncovered a fossil sea urchin that pushes back a fork in its family tree by 10 million years, according to a new study.
A team from USC found the Eotiaris guadalupensis in the collections of the Smithsonian Institution from the Glass Mountains of west Texas, where it had been buried in a rock formation that dates back to 268.8 million years at its youngest.
“This fossil pushes the evolution of this type of sea urchin from the Wuchiapingian age all the way back to the Roadian age,” said David Bottjer, professor at the USC Dornsife College of Letters, Arts and Sciences, and senior author of a paper announcing the find that appeared in Nature Scientific Reports on October 21.
This paper was a collaboration between Bottjer’s lab and Eric Davidson’s lab at Caltech. Jeffrey Thompson, a Ph.D. student at USC and was the lead author of the study, found the fossils of Eotiaris guadalupensis in the Smithsonian collections.
Eotiaris guadalupensis is a cidaroid, one of the two main types of sea urchins found in today’s oceans. The other group, the euechinoids, evolved wildly varying body types and accounts for almost all sea urchins alive today. Cidaroids, by contrast, look pretty much the same as they did millions of years ago. Both evolved from an ancestral group of echinoids known as the Archaeocidaridae, which are now extinct.
The divergence of the two groups marks a major — and relatively abrupt — shift in the genetic organization of sea urchins.
“It’s not just the color of a moth’s wing changing,” said Bottjer, referring to the classic example of the peppered moth in England that, in the post-Industrial Revolution’s sooty skies, began to appear in a darker color. “We’re looking at tightly intertwined networks of genes that change together to cause major morphological differences.”
Pinning down the time at which the two groups diverged allows evolutionary biologists to better understand the processes that occur during major evolutionary changes.
Bottjer and Thompson will also expand on these findings at the Geological Society of America meeting in Baltimore on November 3 and 4, when they will discuss in separate presentations the burgeoning field of paleogenomics — tracking morphological innovations from the fossil record which are produced by know genes in modern organisms, to date when these genes first evolved.
Reference:
Jeffrey R. Thompson, Elizabeth Petsios, Eric H. Davidson, Eric M. Erkenbrack, Feng Gao, David J. Bottjer. Reorganization of sea urchin gene regulatory networks at least 268 million years ago as revealed by oldest fossil cidaroid echinoid. Scientific Reports, 2015; 5: 15541 DOI: 10.1038/srep15541
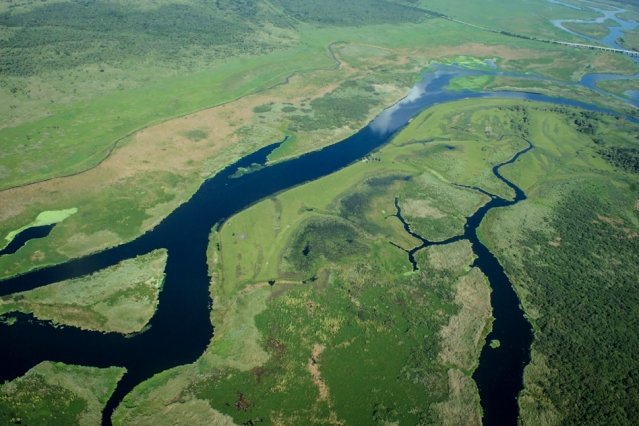
An aerial view of St. Johns River in Florida. Credit: Image courtesy of Massachusetts Institute of Technology
A general mathematical theory that predicts how cracks spread through materials like glass and ice can also predict the direction in which rivers will grow, according to a new MIT study.
In fracture mechanics, the theory of local symmetry predicts that, for example, a crack in a wall will grow in a direction in which the surrounding stress is symmetric around the crack’s tip.
Scientists at MIT have now applied this theory to the growth of river networks, finding that as a river fed by groundwater cuts through a landscape, it will flow in a direction that maintains symmetric pressure from groundwater around the river’s head.
The group tested the theory on 255 streams in the Florida Panhandle, and found that streams grow in a direction consistent with symmetry. The local groundwater flow — and specifically, the height of the underlying water table — therefore plays a large role in directing a river network’s evolution.
Daniel Rothman, a professor of geophysics in MIT’s Department of Earth, Atmospheric and Planetary Sciences, says that what typically drives a river’s growth is a complicated mix of physical processes that contributes to landscape erosion. The details of these processes are poorly understood.
“Really, what we’re trying to do is express the growth of a river in a way that is independent of the complicated mechanism of erosion,” Rothman says. “Symmetry is a basic physical idea that applies in a variety of settings. By hypothesizing its relevance to channel growth and showing that it works, we can identify the growth of river networks with the class of phenomena that can be described in this way.”
The researchers say the theory of local symmetry may also be used to predict the growth of other branching systems, such as geological faults, root systems, and even neural networks.
The study is published in the Proceedings of the National Academy of Sciences. The study’s authors are Rothman, postdoc and lead author Yossi Cohen, graduate student Robert Yi, former postdocs Olivier Devauchelle and Hansjorg Seybold, and Piotr Szymczak of Warsaw University in Poland.
“The problem of the growing stream”
In 2012, Rothman’s group developed a mathematical theory for river growth that identified a common angle at which river valleys branch. Cohen joined the group shortly after, having worked on problems of fracture mechanics while completing his PhD in theoretical physics. While studying the mathematical principles underlying river networks, Cohen recognized some similarities with theories of fracture mechanics.
“The physical processes are completely different, but there are commonalities in the mathematics,” Cohen says. “So we thought, ‘OK, maybe we can use some of the well-developed theories in fracture mechanics to solve the problem of the growing stream.'”
The researchers applied the fracture mechanics theory of local symmetry to river growth, and found that whether a river grew to the left or right, or straight ahead, depended on the pressure of the surrounding groundwater, or the underlying water table.
Groundwater saturates soil and can be stored in large underground aquifers, the top of which is called the water table. The height of a water table can dip and rise, much like the hills and valleys of a landscape. Higher parts of a water table create more groundwater pressure below, which can ultimately be released by flowing into a river, thereby growing the river incrementally.
By applying the theory of local symmetry to river growth, the researchers found that a river will grow straight when the pressure contour of the surrounding water table is symmetric around the river’s head. The theory also predicts the angle at which a river would turn.
Calculating the ‘growth exponent’
To test the theory, the group analyzed an intricately branching river network in Bristol, Florida, where Rothman’s group has previously studied river growth. The researchers calculated the position of the water table around 255 branching streams in the river network. From the contours of the water table, they established the degree of symmetry in every region around a stream tip. Then, they examined whether the streams grew in the direction predicted by the local symmetry theory.
They found that enough streams agreed with the predictions to confirm that the theory did apply, not just to fractures and cracks, but also to river growth.
Having validated the theory, the researchers then used it to calculate a ‘growth exponent’ — a number that relates the flow of groundwater to how fast a stream is growing. They then calculated the velocity of all 255 streams in the river network, and determined the optimal growth exponent that minimizes deviations from the predictions of local symmetry.
Rothman says the group’s method in applying the local symmetry method may have applications in other areas of network growth, such as geological fault networks.
“In any problem where there is growth in response to a field which can be characterized as diffusive, our ideas here should apply,” Rothman says.
Reference:
Yossi Cohen, Olivier Devauchelle, Hansjörg F. Seybold, Robert S. Yi, Piotr Szymczak, Daniel H. Rothman. Path selection in the growth of rivers. Proceedings of the National Academy of Sciences, 2015; 201413883 DOI: 10.1073/pnas.1413883112
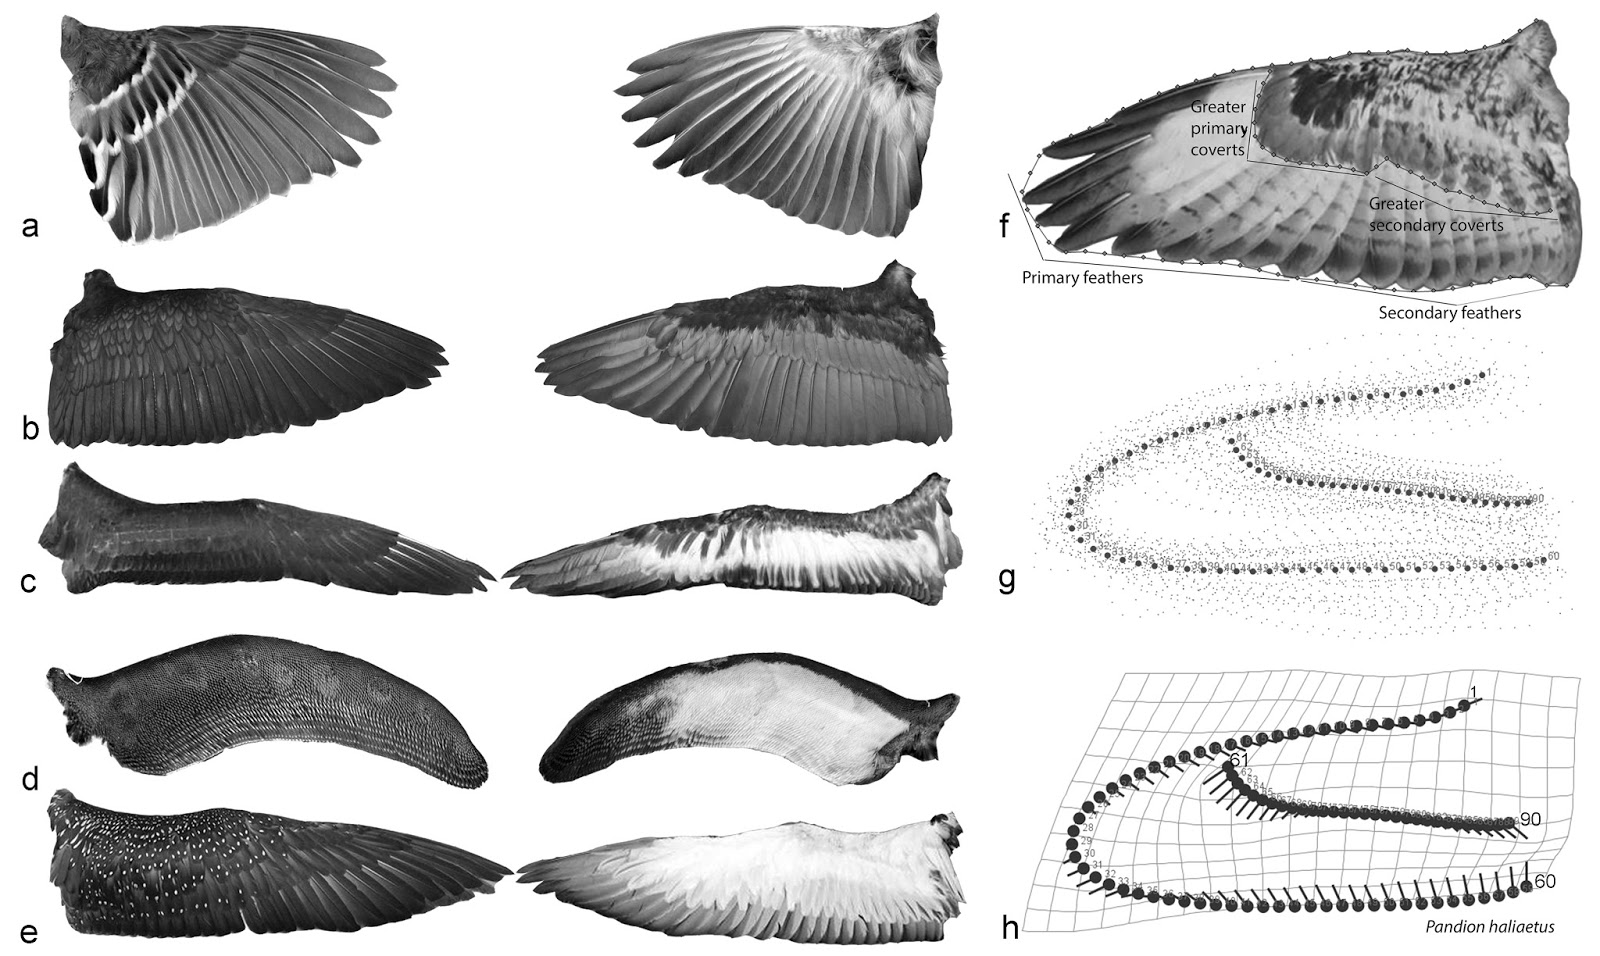
Samples of the dorsal (middle column) and ventral (left column) sides of wings from bird specimens analyzed by the researchers. The right column depicts a consensus wing shape generated by analyzing the wing shape of 105 bird taxon (figure f), a figure depicting how various wing shapes differed from the consensus wing (figure g), and the magnitude of variation across different parts of the consensus wing ( figure h). Credit: Xia Wang.
In a finding that could change the way scientists think about bird evolution, researchers have found that the shape of bird wings is influenced more by how closely related species are to one another than by flight style.
The research challenges scientific beliefs that assume the way a bird species flies—whether it primarily dives, glides or flaps, for instance—plays the primary role in the evolution of its wing shape. It also indicates that it may be more difficult than previously thought to infer flying behaviors of early birds and the first flying dinosaurs from fossils alone.
Julia Clarke, an associate professor in the Department of Geological Sciences at The University of Texas Jackson School of Geosciences, conducted the work with Xia Wang, a post-doctoral researcher who led the study. Their research was published in the journal Proceedings of the Royal Society B: Biological Sciences in October.
Bird wings, unlike stiff airplane wings, are flexible and change shape during flight. So, their geometry and wing outline may not tell the whole story of a particular flight style or environment, Clarke said.
“We’ve taken a lot for granted. Birds are not airplanes,” Clarke said.
By comparing geometry across species and clades – groups of organisms that evolved from a common ancestor – the researchers found that birds that are closely related evolutionarily have similar wing structures, even if the birds show very different flight styles. For example, albatrosses, penguins and loons, despite looking very different from one another, all belong to the clade Aequornithes and have a wing shape that is very similar.
The study is the first to analyze wing geometry across all major groups of birds. Researchers analyzed over 100 photographs of wings from different bird species.
In general, the analysis of species from across nine major avian clades showed that wing shape became more varied as different clades diverged from early ancestors, Clarke said. The researchers found an interesting exception to this trend in the wings of Passerines —a clade that includes songbirds. Instead of a wing shape that resembles more closely related relatives, their shape resembles that of Galliformes, a distantly related order that includes birds, such as chickens and turkeys, whose direct ancestors were among the first birds on the planet.
“Those little songbirds share aspects of wing geometry, especially the relative length of the covert feathers, with some of early bird species but have very different body sizes, ecologies and flight styles,” Clarke said.
Clarke and Wang also studied covert feathers in these birds. They found that across clades these feathers, which cover the base of the flight feathers, are about the same length whether they are on the top or underside of a wing. The similarity of covert feathers both on a single wing and across clades, brings into question their function, Clarke said.
It’s been proposed that some of the upper coverts may play a sensory role, and the lower or underwing coverts, a role in aerodynamics. But the similarity in the distribution and organization of covert feathers on both sides of the wings suggests that such distinct roles may not be the case, Clarke said.
“There’s no existing hypothesis to explain that pattern,” Clarke said. “So a question now is why the length of these feathers tends to be similar and why they show similar trends across birds. We could be looking for a developmental explanation or a functional one.”
Reference:
Xia Wang et al. The evolution of avian wing shape and previously unrecognized trends in covert feathering, Proceedings of the Royal Society B: Biological Sciences (2015). DOI: 10.1098/rspb.2015.1935
A technique for identifying the sources of diamonds without the use of clues such as the presence of specific inclusions will be reported on Wednesday, Nov. 4, in a presentation by Catherine McManus, Chief Scientist at Materialytics, LLC, at The Geological Society of America’s Annual Meeting in Baltimore, Maryland, USA. The new testing method produced results with average accuracy around 98%.
“The report is unique because all of the 330 test samples used are of gem quality, making this diamond provenance study relevant not only to geologists but also to consumers by providing a scientific verification in support of conflict-free trade,” said McManus.
Materialytics has extensively studied industrial ceramics, metal alloys, and electronic components to identify counterfeits and improve quality control. Materials such as tin, tungsten, tantalum, gold, as well as gemstones such as emeralds, have been studied for origins. However, studies on gem-quality diamonds have historically presented a challenge because of their chemical simplicity.
Co-author Nancy McMillan, of New Mexico State University, observed that “one of our major findings is that the high success rates are not due to inclusions in the diamonds, but rather to signals from the carbon itself. That is significant, because it means that this method of analysis is applicable to all diamonds.”
The implications of this research appear to be far reaching.
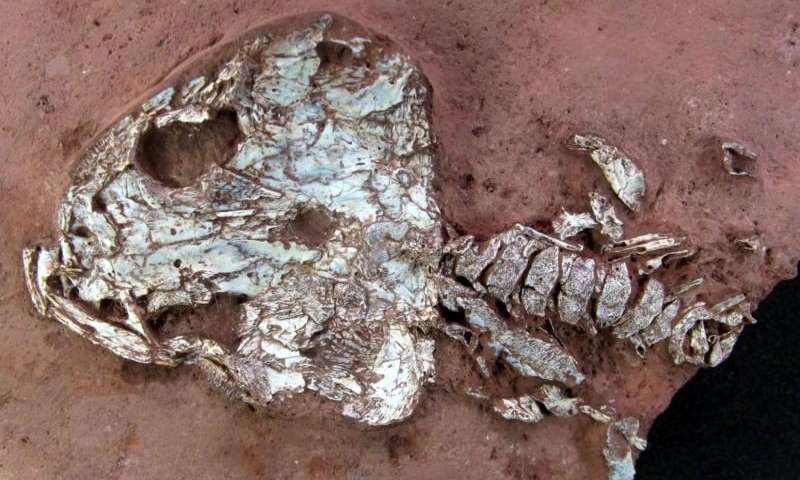
Partial skeleton of the archaic amphibian Timonya anneae. Timonya is an archaic amphibian that inhabited tropical lakes in northeastern Brazil during the Permian Period of Earth history (about 278 million years ago). The specimen in this photo is preserved laying on its back, so that the inside surfaces of the bones of the skull roof are visible. Also visible are part of the animal’s backbone and its small forelimbs. The specimen is UFPI PV004. Credit: Juan Cisneros.
Two hundred and seventy-eight million years ago, the world was a different place. Not only were the landmasses merged into the supercontinent of Pangaea, but the land was home to ancient animals unlike anything alive today. But until now, very little information was available about what animals were present in the southern tropics. In a study published in Nature Communications, scientists from The Field Museum and colleagues from around the world describe several new amphibian species and a reptile from northeastern Brazil that help fill this key geographic gap and reveal how animals moved among regions in the supercontinent.
“Almost all of our knowledge about land animals from this time, comes from a handful of regions in North America and western Europe, which were located near the equator,” said Field Museum scientist Ken Angielczyk, one of the paper’s authors. “Now we finally have information about what kinds of animals were present in areas farther to the south, and their similarities and differences to the animals living near the equator.”
The paper describes two new species, both archaic aquatic carnivorous amphibians. One, Timonya annae (tih-MOAN-yuh ann-AYE), was a small, fully aquatic amphibian with fangs and gills, looking something like a cross between a modern Mexican salamander and an eel. The other new species, Procuhy nazarienis (pro-KOO-ee naz-ar-ee-en-sis), an amphibian whose name in the Timbira language of its Brazilian homeland, means “fire frog.” Procuhy didn’t live in fire, though—it spent its whole life in water. Its name comes from the Pedra de Fogo (“Rock of Fire”) Formation where it’s from, so named for the presence of flint. Although both species are distant relatives of modern salamanders, they are not true frogs or salamanders, but members of an extinct group that was common during the Permian.
In addition to these two new species, the paper also describes a collie-sized amphibian whose closest relatives lived in later times in southern Africa, and an lizard-like reptile species that until now has only been found far away in North America. The fact that these species have also been found in modern-day Brazil helps scientists paint a picture of the ways that animals spread during the Permian and how they colonized new areas.
Above all, the research illuminates animal communities at a time and place that has received very little attention. “Fossils from classic areas in North America and Europe have been studied for over a century, but there are long-standing questions about how different animal groups dispersed to other areas that we can’t answer using just those fossils,” said Angielczyk. “Exploration in understudied areas, such as northeastern Brazil, gives us a snapshot of life elsewhere that we can use for comparisons. In turn, we can see which animals were dispersing into new areas, particularly as an ice age was ending in the southern continents and environmental conditions were becoming more favorable for reptiles and amphibians.”
Reference:
Juan C. Cisneros, Claudia Marsicano, Kenneth D. Angielczyk, Roger M. H. Smith, Martha Richter, Jörg Fröbisch, Christian F. Kammerer, Rudyard W. Sadleir. New Permian fauna from tropical Gondwana. DOI: 10.1038/NCOMMS9676
Note: The above post is reprinted from materials provided by Field Museum.
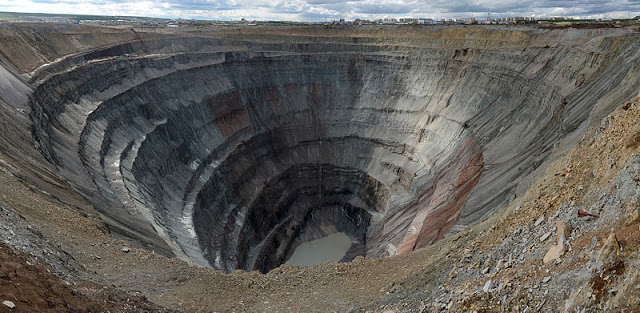
Mir mine. Mirny. The Republic of Sakha (Yakutia). Far Eastern Federal District. Russia. Credit: Staselnik/Wikipedia
Diamonds may not be as rare as once believed, but this finding in a new Johns Hopkins University research report won’t mean deep discounts at local jewelry stores.
“Diamond formation in the deep Earth, the very deep Earth, may be a more common process than we thought,” said Johns Hopkins geochemist Dimitri A. Sverjensky, whose article co-written with doctoral student Fang Huang appears today in the online journal Nature Communications. The report says the results ‘constitute a new quantitative theory of diamond formation,’ but that does not mean it will be easier to find gem-quality diamonds and bring them to market.
For one thing, the prevalence of diamonds near the Earth’s surface — where they can be mined — still depends on relatively rare volcanic magma eruptions that raise them from the depths where they form. For another, the diamonds being considered in these studies are not necessarily the stuff of engagement rings, unless the recipient is equipped with a microscope. Most are only a few microns across and are not visible to the unaided eye.
Using a chemical model, Sverjensky and Huang found that these precious stones could be born in a natural chemical reaction that is simpler than the two main processes that up to now have been understood to produce diamonds. Specifically, their model — yet to be tested with actual materials — shows that diamonds can form with an increase in acidity during interaction between water and rock.
The common understanding up to now has been that diamonds are formed in the movement of fluid by the oxidation of methane or the chemical reduction of carbon dioxide. Oxidation results in a higher oxidation state, or a gain of electrons. Reduction means a lower oxidation state, and collectively the two are known as ‘redox’ reactions.
“It was always hard to explain why the redox reactions took place,” said Sverjensky, a professor in the Morton K. Blaustein Department of Earth and Planetary Sciences in the university’s Krieger School of Arts and Sciences. The reactions require different types of fluids to be moving through the rocks encountering environments with different oxidation states.
The new research showed that water could produce diamonds as its pH falls naturally — that is, as it becomes more acidic — while moving from one type of rock to another, Sverjensky said.
The finding is one of many in about the last 25 years that expands scientists’ understanding of how pervasive diamonds may be, Sverjensky said.
“The more people look, the more they’re finding diamonds in different rock types now,” Sverjensky said. “I think everybody would agree there’s more and more environments of diamond formation being discovered.”
Nobody has yet put a number on the greater abundance of diamonds, but Sverjensky said scientists are working on that with chemical models. It’s impossible to physically explore the great depths at which diamonds are created: roughly 90 to 120 miles below the Earth’s surface at intense pressure and at temperatures about 1,650 to 2,000 degrees Fahrenheit.
The deepest drilling exploration ever made was about 8 or 9 miles below the surface, he said.
If the study doesn’t shake the diamond markets, it promises to help shed light on fluid movement in the deep Earth, which helps account for the carbon cycle on which all life on the planet depends.
“Fluids are the key link between the shallow and the deep Earth,” Sverjensky said. “That’s why it’s important.”
This research was supported by grants from the Sloan Foundation through the Deep Carbon Observatory (Reservoirs and Fluxes and Extreme Physics and Chemistry programs) and by a U.S. Energy Department grant, DE-FG-02-96ER-14616.
Reference:
Dimitri A. Sverjensky, Fang Huang. Diamond formation due to a pH drop during fluid–rock interactions. Nature Communications, 2015; 6: 8702 DOI: 10.1038/ncomms9702
Different rates of body size evolution across dinosaurs (including birds). Benson et al (2014)
Body mass is probably the most important physiological features for all animals. It corresponds strongly with a range of life features, including metabolic and growth rates, population density, diet and dietary strategy, locomotion style and mechanics, and mode of reproduction.
It comes as perhaps no surprise then that body mass is one of the most widely explored features of extinct organisms by palaeontologists. Last year, a slew of papers explored the evolution of body size in dinosaurs, including birds (e.g., this one in PLOS Biology). Most of these found that rapid changes in maniraptoran theropods, the dinosaurian lineage leading to modern birds, occurred from the Middle Jurassic (about 160 million years ago) and onwards.
Importantly, this means that, in terms of body size, birds were constantly and rapidly innovating and changing, which might have set the scene for the origins of the great bird radiation. It’s weird to think about, but with 10,000 living species of bird, we are still technically in the ‘reign of the dinosaurs”, and it might be due to an early ability to rapidly evolve body size and adapt to changing conditions.
In birds, body mass has one additional and unique factor in that it correlates with the amount of lift an animal can generate, and therefore influences whether or not they can fly! Therefore, being able to accurately estimate body mass in extinct birds has important implications for our understanding of the origins of flight.
Previous studies, including those mentioned above, have had to rely on proxies to estimate body mass. It’s ridiculously unlikely that we’ll ever find a complete dinosaur, and we only have their skeletons to go off. One way of estimating body mass has been to use the circumference of the femur, which correlates strongly with body mass in a range of living organisms – known as an ‘allometric’ relationship. Estimates of body mass in birds have also been applied to pterosaurs, a group of now extinct flying reptiles related to dinosaurs. But the question remains, how accurate are our estimations of body mass in the fossil record?
A new study, led by Liz Martin-Silverstone at the University of Southampton in the UK, set out to divine the relationships between skeletal mass and complete or total body mass in birds (i.e., involving all the fleshy parts).
What they found, using a range of analyses and datasets, was a strong positive association between body mass and skeletal mass, as we might expect – as the skeleton of an animal gets bigger, so does its overall mass. This is important, as it means that for living neornithine birds (at least), estimates of skeletal mass accurately reflect total body mass, and therefore skeletal mass can be used as a proxy to estimate the life traits mentioned at the beginning of this post.
Despite overall good correlations, the authors found quite a lot of natural variation within species, based on an extensive new dataset compiled from the collections at the Royal British Colombia Museum (Victoria, Canada). This is simply due to the fact that we have different animals of different sizes within species – take a look at humans, for just one obvious example of this. An example from birds is the rhinoceros auklet, which has a total body mass ranging from 258-616.2 grams!
The reason for such variation can also be due to age – it’s a pretty well established phenomena that animals get bigger as they grow up. This has drastically important implications for estimating skeletal mass across animals in the fossil record. For each animal, they would have to be shown to be the same growth stage, or ontogenetic age, so that their body masses could be directly comparable. There’s not really much point comparing the body mass of a juvenile of one species to that for a fully grown individual of another! Birds also grow ridiculously fast (when was the last time you saw a baby pigeon?), so it can be very difficult to accurately tell what their ages are without detailed examination.
The authors also identified a range of confounding factors that influence estimates of body mass. For example, when female birds are ready to lay eggs, they accumulate and deposit more calcium within their bones to save it for egg production. So we might expect the skeletal mass to vary between males and females of the same species, depending on sexual maturity. However, there were no significant differences between the sexes, despite this possible variation. As well as this, migratory birds have very different weights before and during migrations, although this is relatively slight at just a few percent difference, but whether or not this affected the results is unknown.
What about flight mode? Does this affect estimates of body mass, as we might expect flight capable birds to have bigger muscles for flapping their wings, or perhaps be lighter in order to generate more lift for flight. Martin-Silverstone and colleagues found, however, that there was again no statistical difference in the relationship between body mass and skeletal mass across different flight modes. This is great, as in fossil birds, it suggests that even if we don’t know their flight style, as it’s notoriously difficult to infer in extinct animals, we can still accurately estimate their body mass. The authors are careful to note though that their analyses did not cover all birds, and seems to have excluded a whole range including penguins, ratites (kiwis, emus, and ostriches), cormorants and a whole load of other avian weirdos.
Importantly, this scalar relationship between skeletal mass and body mass changes when evolutionary relationships are accounted for. When analysing the evolution of ‘traits’ such as body mass, a portion of similarity between species will simply be due to the fact that we expect more closely related organisms to adopt similar morphologies. This suggests that when estimating body mass, or using raw body mass estimates to make big macroevolutionary statements, that we should make sure that phylogeny (the evolutionary relationships of organisms) is well accounted for.
What does this mean overall for estimating body sizes in extinct organisms? Well, the raw scalar relationship between skeletal mass and body mass is clear for birds, that is, the clade known as Neornithes. However, in different but closely related groups, such as extinct birds like Enantiornithes, Hesperornithes, as well as pterosaurs and non-avian dinosaurs, it is likely that this scalar relationship will be invariably different. This is due to the simple fact that each of these groups of animals are distinct from modern birds – that’s what makes them different groups! The authors suggests that there might be better ways of estimating the body mass in organisms like dinosaurs, such as using allometric relationships (such as the femur circumference one mentioned above), or estimates of whole body volume by using scanning methods! Both of these have been widely used, but often produce quite different results.
For pterosaurs, the close cousins of dinosaurs, the scaling relationships between skeletal mass and body mass have been used before to predict the body masses of a range of species. However, this comparison might not have been appropriate, as pterosaurs are vastly different animals to birds, and have completely different wing anatomy, as well as individual bone masses. This means that previous estimates of body mass in pterosaurs might not have been too accurate, and probably need refining in light of the relationship between skeletal mass and body mass, as well as a deeper understanding of the morphology and pneumatisation (how much air a bone contains) of different pterosaur species.
So, the tl;dr version of this would be: body mass is really difficult to estimate in extinct organisms, should be cross-checked using extant organisms where possible, and confounding factors such as phylogeny, mode of life, sex, and ontogeny must be accounted for!
Reference:
Elizabeth Martin-Silverstone et al. Exploring the Relationship between Skeletal Mass and Total Body Mass in Birds, PLOS ONE (2015). DOI: 10.1371/journal.pone.0141794
Roger B. J. Benson et al. Rates of Dinosaur Body Mass Evolution Indicate 170 Million Years of Sustained Ecological Innovation on the Avian Stem Lineage, PLoS Biology (2014). DOI: 10.1371/journal.pbio.1001853
Note: The above post is reprinted from materials provided by PLOS Blogs. This story is republished courtesy of PLOS Blogs
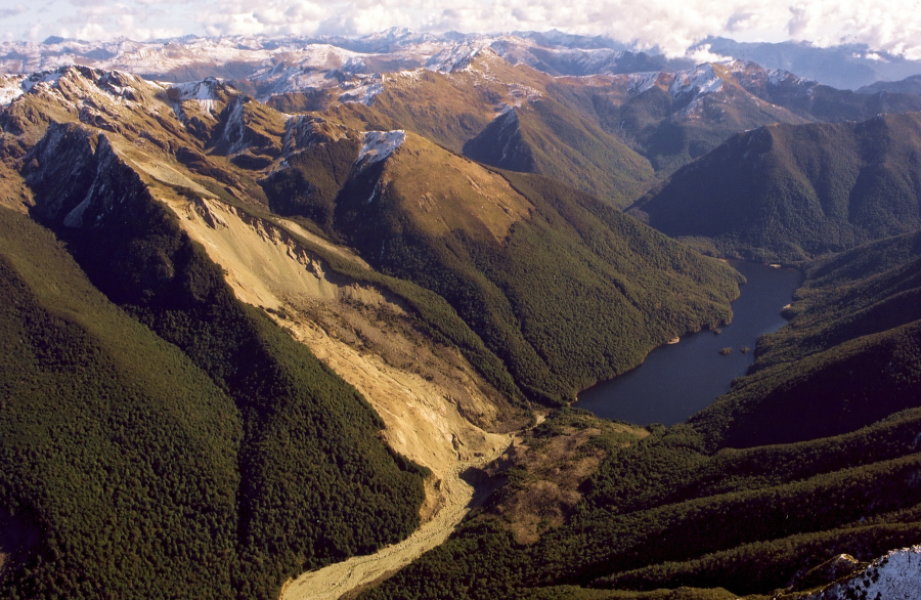
Lake Stanley rock avalanche. Credit: Image courtesy of Cardiff University
The likelihood of an area experiencing a potentially devastating landslide could be influenced by its previous exposure to earthquakes many decades earlier.
This is according to new research led by Cardiff University showing that areas which have experienced strong earthquakes in the past were more likely to produce landslides when a second earthquake hit later on.
Researchers speculate that this is because damage can reside in the side of mountains after an initial earthquake, and that the consequences of this damage may only be felt when a second earthquake hits.
These new insights could have important implications for disaster management and prevention by helping researchers better predict areas that may be susceptible to future landslides.
The consequences of the landslides that occurred after two large earthquakes hit Nepal earlier this year, killing more than 9,000 people and inflicting wide-spread damage, serves to show how valuable a prediction tool would be.
Predictive models that are currently used to assess the likelihood of landslides do not consider historical occurrences of previous earthquakes, and instead focus on the strength of the earthquake and the characteristics of the particular area, including the make-up of rock and the steepness of slopes.
“This could potentially be a significant gap in our understanding of the factors that lead to landsliding,” said Dr Robert Parker, lead author of the paper, from Cardiff University’ School of Earth and Ocean Sciences.
After the Nepal earthquakes, a program called ShakeSlide, developed by Dr Parker, was used to predict areas affected by landslides and assist in post-disaster efforts. These new findings may lead to improved predictions, through models that consider the legacy of past earthquakes.
To reach their conclusions, the research team analysed data from two individual earthquakes that occurred in close-proximity to each other, in 1929 and 1968, on the South Island of New Zealand.
The epicentres of the two earthquakes were around 21 km apart and both triggered landslides over a large area.
The researchers firstly analysed the influence that standard factors, such as the strength of the earthquake and the gradient of hillslopes, had on the distribution of landslides.
Where the results were unexplained by these standard factors, the researchers investigated whether the results could be attributed to the legacy of previous events.
Their results suggested that hillslopes in regions that experienced strong ground motions in the 1929 earthquake were more likely to fail during the 1968 earthquake than would be expected on the basis of the standard factors alone.
“Our results suggest that areas that experienced strong shaking in the first earthquake were more likely to produce landslides in the second earthquake than would be expected based on the strength of shaking and hillslope characteristics alone,” said Dr Parker.
Dr Parker and his team have speculated that the increased likelihood of occurrence may be down to the fact that damage persists in the landscape after an initial earthquake, making it sufficiently weaker and thus more prone to a landslide if another earthquake hits in the future.
Dr Parker continued: “Strong shaking in a past earthquake may actually cause mountains to be more hazardous, in terms of landslides, in a future earthquake many years or decades later. You could think of it as mountains remembering past earthquakes, which affects how they respond to future earthquakes.”
Dr Parker and his team are now investigating whether this ‘memory effect’ is seen in other areas, and have begun investigating the earthquakes that occurred in Nepal.
The new study has been published in the journal Earth Surface Dynamics.
Reference:
R. N. Parker, G. T. Hancox, D. N. Petley, C. I. Massey, A. L. Densmore, N. J. Rosser. Spatial distributions of earthquake-induced landslides and hillslope preconditioning in the northwest South Island, New Zealand. Earth Surface Dynamics, 2015; 3 (4): 501 DOI: 10.5194/esurf-3-501-2015
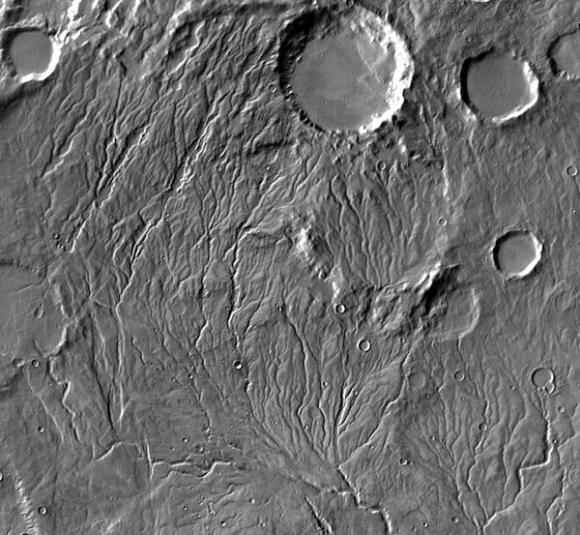
New calculations suggest that vast valley networks that spider across the southern highlands of Mars may have been carved by a surprisingly small volume of water.
The study, published in the November issue of Planetary and Space Science, finds that the minimum water volume required to carve the valleys could have flowed through in as little as a few hundred to 10,000 years. The findings are consistent with the idea that early Mars may have been cold and icy, with water flowing sporadically on the surface in response to short-term climate changes, say the Brown University researchers who led the study.
“The valley networks represent much of the evidence for why many scientists think ancient Mars was warm and wet, which implies that there was a lot of water flowing for a long period of time — perhaps millions of years,” said Jim Head, the Louis and Elizabeth Scherck Distinguished Professor of the Geological Sciences and co-author of the new paper. “But this analysis suggests that the valleys could have been carved by a smaller volume of water over a potentially shorter period of time. That gives us guidance about trying to understand what was really going on with the early Mars climate.”
The Martian valley networks were first discovered during the Mariner 9 mission in the 1970s. The branching channels, typically up to four kilometers wide, often stretch for thousands of kilometers across the southern highlands, some of the most ancient surfaces on the Red Planet.
The waters that carved the valleys are thought to have stopped running as much as 4 billion years ago. That makes figuring out just how much water flowed through the valleys “a very difficult calculation to do,” said Eliott Rosenberg, an undergraduate student at Brown who led the research.
For starters, Rosenberg needed to figure out exactly how much sediment had been excavated from the valleys. He used data from the Mars Orbiter Laser Altimeter (MOLA) to get an average cross-sectional area for the valleys. He multiplied that by previous measurements of the length of the valleys to get a sediment volume.
The harder part, however, was figuring out how much water it would take to move that volume of sediment. One way of doing that requires estimating the ratio of sediment and water that traveled through the valleys per unit of time. Since the rivers are long gone, previous researchers could only make guesses at the ratio. Rosenberg wanted to find something a bit more concrete.
In the course of his research, he came across a report by the Texas Department of Transportation assessing how well different types of drainage tunnels are able to handle sediment fluxes. Within that report was raw data on fluid and sediment transport for a large number of rivers and streams. Using those data, Rosenberg found that he could get a decent estimate of the fluid/sediment ratio if he could figure out the strength of the flow.
“The strength of the flow through the valleys turns out to be something we can estimate,” Rosenberg said. “It’s a function of the slope of the valleys — which we could get from the MOLA data — as well as the depth of the flow and the size of the grains on the riverbed, because that affects how fast the water can flow and how much sediment it can pick up,” Rosenberg said.
Using the morphology of the valleys and established hydrological equations, Rosenberg estimated the depth of the ancient Martian rivers to be between 1 meter and 16 meters deep and a minimum grain size to be between 1 mm and 6.2 mm. The grain size yielded by those theoretical calculations turns out to be a close match for the grain sizes the Curiosity rover found in Gale Crater, a nice confirmation of the theoretical approach.
Using those numbers, Rosenberg was able to estimate a flow strength for the Martian rivers. He could then use the raw data from rivers on Earth to estimate a total water volume.
The calculations yielded a volume of between three and 100 GEL (global equivalent layer). GEL is a commonly used term when scientists discuss water on Mars. It means that if one were to take all the water that flowed through the valleys over time and spread it evenly across the Martian surface, it would be between three and 100 meters deep. That might sound like a lot of water, but it’s actually quite a small amount, the researchers say. Mars is considered to be a very dry place at present, yet its current water inventory, most of which is trapped in frozen ice caps, is around 34 meters GEL.
“This means that the amount of water that we calculate may have flowed through the valleys is on the same order as the amount of water on the planet today,” Head said. “The implication here is that the valleys may well have been carved by a much smaller volume of water than many people previously thought.”
Rosenberg and Head estimate that the volume of water yielded by these calculations could have flowed through the valleys in a few hundred years to 10,000 years. That’s a much shorter period than the millions of years of flowing water often envisioned for early Mars.
The researchers point out that the assumptions they used were aimed at finding the minimum amount of water required to carve the valleys. It could indeed have been more, but it didn’t necessarily need to be. “What we’re saying is that you could still form these valleys even if ancient Mars wasn’t all beach balls and cabanas,” Head said. “The warm and wet model of ancient Mars is very hard to square with estimates of the ancient Martian climate. This work makes the case that these valley networks could still form if Mars was cold and icy with shorter periods flowing water.”
Reference:
Eliott N. Rosenberg, , James W. Head. Late Noachian fluvial erosion on Mars: Cumulative water volumes required to carve the valley networks and grain size of bed-sediment. DOI:10.1016/j.pss.2015.08.015
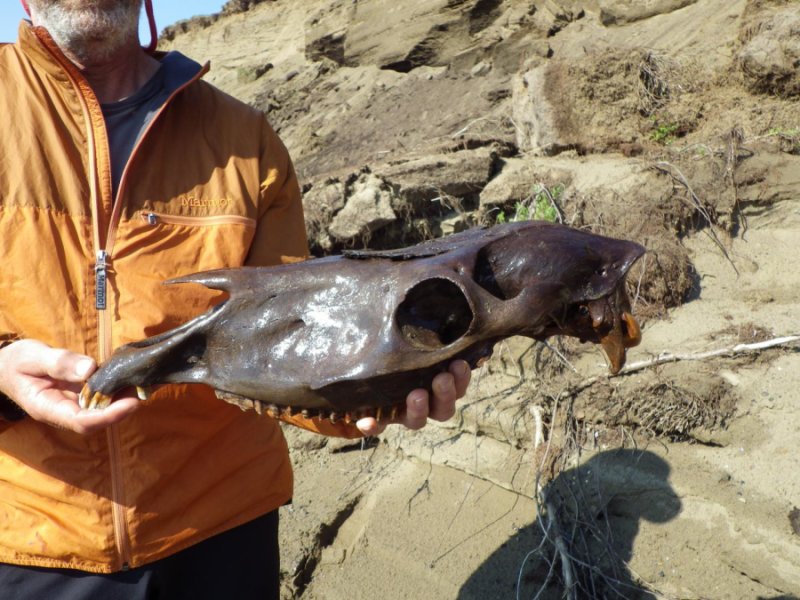
Daniel Mann, associate professor of Geosciences at the University of Alaska Fairbanks, holds the upper part of a skull belonging to a young stallion that roamed the North Slope about 22,000 years ago during the last ice age. Mann found the skull eroding from a river bluff. Interestingly, most ice-age horse skulls found on the North Slope belong to young stallions. Credit: Photo by Pamela Groves, University of Alaska Fairbanks.
A study of life and extinctions among woolly mammoths and other ice-age animals suggests that interconnected habitats can help Arctic mammal species survive environmental changes.
The study went online Nov. 2 in the Proceedings of the National Academy of Sciences “Early Edition.”
Short periods of warm climate in the midst of the last ice age triggered boom-and-bust cycles in the populations of large mammals in the Arctic, the researchers found. Many large mammals became extinct when these cycles and the ice age ended and spreading peatlands and rising sea levels restricted animals’ ability to move between continents.
Scientists from the University of Alaska Fairbanks and the University of California examined the age and abundance of the bones of megafauna, a term for mammals weighing more than 100 pounds, on Alaska’s North Slope, a tundra region between the Brooks Range and the Arctic Ocean.
By radiocarbon dating the fossils and comparing their ages and abundances to climate records spanning the past 40,000 years, the researchers reconstructed a picture of what happened woolly mammoths, steppe bison and other mammals in Alaska’s Arctic.
“We wanted to know how these large animals responded to the rapid climatic changes that characterized that period of Earth’s history,” said lead author Daniel Mann, an associate professor in the UAF Department of Geosciences. “To do this, we tested a hypothesis suggested by (retired) UAF paleontologist Dale Guthrie that megafaunal populations experienced boom-and-bust cycles during the ice age as the vegetation tracked climate change.”
The last ice age, about 80,000 to 12,000 years ago, was a time of diverse climates, said Mann. The results of this 20-year study show that animal and plant communities were much more changeable during the ice age than they have been during the last 12,000 years of interglacial climate in which we live today.
“This has been a long-term effort, and it has resulted in a much larger data set of bones from one given area than anybody else has ever compiled,” said co-author Pamela Groves, a wildlife biologist at the UAF Institute of Arctic Biology.
During the last ice age, lowered sea level drained the Bering Strait, the narrow seaway now separating Alaska and Asia. Being able to move back and forth across Bering Strait is probably what kept the large Arctic mammals thriving for so long, Mann said. This travel corridor allowed mammals to come to Alaska when their favored foods — grasses, sedges, and rushes — thrived during warm periods.
The strait also allowed mammals to leave Alaska for greener pastures when prolonged periods of warmer, wetter climate allowed peat to spread, which cooled the ground and discouraged the grass, sedges and rushes from growing.
“Counterintuitively, rapid climate changes during the ice age were, at times, highly beneficial for megafauna when rapid warming allowed grasses and forbs to briefly spread before peatlands had a chance to take over the landscape and degrade forage quality,” said Groves.
When the planet’s big ice sheets collapsed at the end of the last ice age, their melting caused global sea levels to rise as much as 100 meters in roughly 10,000 years, which is fast in geological time, Mann noted.
“In the case of northern Alaska, the rising seas flooded the Bering Strait, which changed the climate of the North Slope,” Mann said. “Summers became wetter and cooler because the sea was much closer. This encouraged the spread of organic soils and peat at the same time that it cut off access between Asia and Alaska.”
The animals couldn’t migrate elsewhere because ice sheets were still blocking their way to the east.
“We’ve known for some time that the population sizes of these animals fluctuated throughout the last ice age,” said evolutionary biologist Beth Shapiro of the University of California Santa Cruz, who was also a part of this study. “What this study provides is a possible explanation for these changes.”
Mann became interested in the study when he and other researchers went to archaeological sites on the North Slope in 1994 to see what ice-age humans were eating. He said they didn’t find much evidence of humans on the North Slope, which suggested they weren’t a driving factor in the mass extinction of the large mammals. The researchers did find more than 4,000 bones of ancient ice-age animals during the last two decades. The bones are now archived in the University of Alaska Museum of the North.
It took two decades to collect enough bones for the study and then several more years to figure out the statistical methods needed to analyze the radiocarbon data, Mann said.
“One of the contributions of research like this is helping humans understand the challenges large animals face today from climate change,” Groves said. “It’s a testimony to the value of doing long-term research.”
The study’s conclusions have implications for present day extinctions. “As human populations grow, patches of suitable habitat for many species are becoming increasingly isolated from each other,” said Shapiro. “If we are to preserve these species, we will need to devise strategies that allow these populations to remain somehow connected.”
The project was supported by the National Science Foundation and the U.S. Bureau of Land Management.
“Arctic climates are particularly unstable and are changing rapidly today,” Mann said, “This means the Arctic is an interesting place to study how climate changes cause extinctions, and the past gives us many interesting examples of extinction there. Plus, bones are exceptionally well-preserved because of the frozen ground.”
Reference:
Daniel H. Mann, Pamela Groves, Richard E. Reanier, Benjamin V. Gaglioti, Michael L. Kunz, Beth Shapiro. Life and extinction of megafauna in the ice-age Arctic. Proceedings of the National Academy of Sciences, 2015; 201516573 DOI: 10.1073/pnas.1516573112
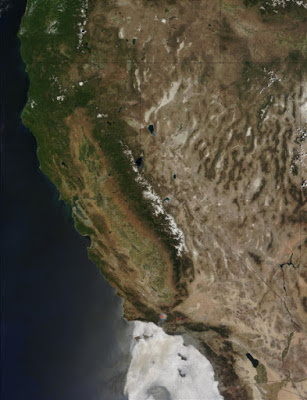
Northern California, USA. Credit: Image courtesy NASA
The Cascadia subduction zone (CSZ) has captured major attention from paleoseismologists due to evidence from several large (magnitude 8-9) earthquakes preserved in coastal salt marshes. Stratigraphic records are proving to be useful for learning about the CSZ’s past, and microfossils may provide more answers about large ancient earthquakes. They may also allow modelers to learn more about potential major hazards related to earthquakes in the area, which would contribute to public preparedness for such events.
Over the past three decades, researchers have found stratigraphic evidence of subsidence occurring during earthquakes beneath the salt marshes of Humboldt Bay, California, USA, at the southern end of the CSZ. J. Scott Padgett of the University of Rhode Island uses analysis of fossil foraminifera to estimate this subsidence at Arcata Bay, just north of Humboldt Bay. He will report on his research on 2 November at the Geological Society of America’s Annual Meeting in Baltimore, Maryland, USA.
Padgett notes, “Previous investigations were able to provide estimates of subsidence with large errors, which are only so helpful to the modelers.” More recently, researchers started using an improved analysis on the microfossil data in Oregon, and were able to generate subsidence estimates with smaller errors. Their refined results enabled modelers to produce earthquake models that are more consistent with observed subsidence measurements seen in today’s instrumented earthquakes.
Similar work is being done at Jacoby Creek, a small coastal drainage that flows into northern Arcata Bay. There, researchers have found three sharp contacts between salt marsh peat and intertidal mud dating back over the past 2,000 years. Radiocarbon ages of plant macrofossils at the top of the buried peats are 195, 1280, and 1710 years old. These new ages provide tighter constraints on the timing of past earthquakes and subsidence at the southern end of the CSZ.
Padgett says there are several lines of evidence that support their results and interpretation at Jacoby Creek. “These include the sharp mud-over-peat contacts that are laterally continuous over 5 kilometers, changes in fossil foraminifera assemblages across the buried peat contacts, long-lasting submergence also derived from fossil foraminifera records, and radiocarbon ages of plant macrofossils taken from buried peat deposits that are consistent with other southern Cascadia earthquake chronologies derived from buried peat and tsunami deposits.”
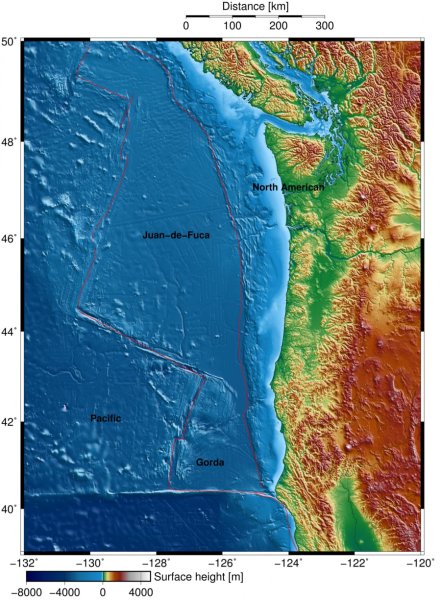
The Juan de Fuca and Gorda plates offshore of the Pacific Northwest. The plate moves eastward from the midocean ridge and spreading center on the plate’s western edge to the trench on the eastern margin where the plate subducts under the North American plate. The Cascadia subduction zone is capable of generating magnitude 9 quakes, which can also produce deadly tsunamis. Credit: UC Berkeley
A large team of scientists has nearly completed the first map of the mantle under the tectonic plate that is colliding with the Pacific Northwest and putting Seattle, Portland and Vancouver at risk of the largest earthquakes and tsunamis in the world.
A new report from five members of the mapping team describes how the movement of the ocean-bottom Juan de Fuca plate is connected to the flow of the mantle 150 kilometers (100 miles) underground, which could help seismologists understand the forces generating quakes as large as the destructive Tohoku quake that struck Japan in 2011.
“This is the first time we’ve been able to map out the flow of mantle across an entire plate, so as to understand plate tectonics on a grand scale,” said Richard Allen, a professor and chair of earth and planetary science at the University of California, Berkeley, and the senior author of a paper published online Nov. 2 in the journal Nature Geoscience. “Our goal is to understand large-scale plate tectonic processes and start to link them all the way down to the smallest scale, to specific earthquakes in the Pacific Northwest.”
The major surprise, Allen said, is that the mantle beneath a small piece of the Juan de Fuca plate is moving differently from the rest of the plate, resulting in segmentation of the subduction zone. Similar segmentation is seen in Pacific Northwest megaquakes, which don’t always break along the entire 1,000-kilometer (600-mile) length, producing magnitude 9 or greater events. Instead, it often breaks along shorter segments, generating quakes of magnitude 7 or 8.
Plate tectonics
The Juan de Fuca plate offshore of Oregon, Washington and British Columbia is small — about the size of California and 50-70 kilometers thick — but “big enough to generate magnitude 9 earthquakes” as it’s shoved under the continental North American plate, Allen said. Because of the hazard from this so-called Cascadia Subduction Zone, a recent New Yorker article portrayed the area as a disaster waiting to happen, predicting that “an earthquake will destroy a sizable portion of the coastal Northwest.”
But little is known about the tectonic plates submerged under the oceans, how they are linked to processes inside Earth, such as the melted mantle rock underlying them, or how the crust and mantle interact to cause megathrust earthquakes at subductions zones.
The Juan de Fuca plate is one of seven major and dozens of minor plates that cover Earth like a jigsaw puzzle, pushed around by molten rock rising at mid-ocean ridges and, at their margins, diving under other plates or ramming into them to generate mountain ranges like the Himalayas. The largest of Earth’s tectonic plates, the Pacific Plate, is moving eastward and plunging under the entire western edge of the Americas, creating a “ring of fire” dotted with volcanoes and mountain ranges and imperiled by earthquakes.
Until now, however, scientists have deployed only a handful of seismometers on the seabed worldwide to explore the mantle underlying these plates, said Allen, who also is director of the Berkeley Seismological Laboratory and one of the co-principal investigators for the $20 million Cascadia Initiative. Led by the University of Oregon, the initiative is funded by the National Science Foundation to develop new underwater and on-shore seismic instruments to measure the plate’s interaction with the mantle or asthenosphere, and monitor quake and volcanic activity at the trench off the coast where the Juan de Fuca plate subducts under the North American plate.
“The experiment was unprecedented in that there were 70 seismometers deployed at a time, sitting there for 10 months, which is much bigger than any other ocean-bottom experiment ever done before,” said Robert Martin-Short, a UC Berkeley graduate student and first author of the paper. “We’ve learned a lot from the deployment of these new instruments, and now have a giant array that we know works well on the seafloor and which we can move somewhere else in the future for a similar experiment.”
While the deployment of seismometers at 120 sites on the ocean floor was a technical challenge, Allen said, “the offshore environment is much simpler, the plates are thinner and more uniform than continental plates and we can see through them to get a better sense of what is going on beneath.”
Since 2012, the team has made 24 two-week ocean voyages to place and retrieve the seabed seismometers, providing dozens of students — undergraduates and graduate students from UC Berkeley, Columbia University, the universities of Oregon and Washington, and Imperial College in the UK — an opportunity to participate in field research. The last of the seabed seismometers were pulled up this month and the data is being prepared for analysis.
Based on the first three years of data, Allen and his team confirmed what geophysicists suspected. At the mid-ocean Juan de Fuca ridge about 500 kilometers (300 miles) offshore of Seattle — the western edge of the Juan de Fuca plate — the flow of the mantle below the plate is perpendicular to the ridge, presumably because the newly formed plate drags the underlying mantle eastward with it.
As the plate moves away from the ridge, the mantle flow rotates slightly northward toward the trench. At its eastern margin, the plate and underlying mantle move in alignment, perpendicular to the subduction zone, as expected. Presumably, the subducted portion of the plate deep under the trench is pulling the massive plate downward at the same time that the emerging lava at the mid-ocean spreading ridge is elevating the plate and pushing it eastward.
Gorda plate adrift
Allen and his colleagues found, however, that a part of the Juan de Fuca plate called the Gorda Plate, located off the northern California coast, is not coupled to the mantle, leaving the mantle beneath Gorda to move independently of the plate above. Instead, the Gorda mantle seems to be aligned with the mantle moving under the Pacific plate.
“The Juan de Fuca plate is clearly influencing the flow of the mantle beneath it, but the Gorda Plate is apparently too small to affect the underlying mantle,” he said.
This change in mantle flow produces a break or discontinuity in the forces on the plate, possibly explaining segmentation along the subduction zone.
“When you look at earthquakes in Cascadia, they sometimes break just along the southern segment, sometimes on the southern two-thirds, and sometimes along the entire length of the plate,” Allen said. “The change in the mantle flow could be linked to that segmentation.”
The Cascadia Initiative is a community experiment designed by the research community with all data immediately available to the public. NSF funded the project with money it received through the 2009 stimulus or American Recovery and Reinvestment Act (ARRA). Eleven scientists, including Allen, from across the U.S. formed the Cascadia Initiative Expedition Team responsible for the offshore seismic deployment.
Allen and Martin-Short’s co-authors on the Nature Geosciences paper are Ian Bastow and Eoghan Totten of Imperial College and UC Berkeley geophysicist Mark Richards, a professor of earth and planetary science. Richards helped develop the geodynamic model of the interaction between the plate and the mantle that explains how the faster moving Pacific Plate could override the influence that the Gorda Plate has on the mantle below.
Video
Overview map of the Cascadia Subduction Zone and the Cascadia Initiative seismic deployment. The ocean floor Cascadia Initiative stations are shown in orange and red; the onshore USArray station are purple. Moderate earthquakes around the Juan de Fuca oceanic plate are shown grey; the purple swath illustrates the Cascadia megathrust fault that has and will generate magnitude 9 earthquakes. The Cascadia Initiative will study plate tectonic processes across the entire Jan de Fuca plate including the creation and destruction of the plate, and earthquake processes along the megathrust.
Student Video blog: Finale. As the R/V Thompson plows though the seas on our way back to Newport, Oregon and the end of our cruise, we review the last 11 days at sea. We recovered 12 deep water ocean bottom seismometers including rescuing two that were lost on the bottom. We also winched up 19 of the 20 shallow water instruments. We lost one to an uncharted ship wreck.
A special thanks goes to Danny who edited all of these video blogs. Also, to the rest of the undergraduate and graduate students aboard the R/V Thomas G Thompson from UC Berkeley, Columbia and the University of Washington. This NSF sponsored cruise (TN312) was just one of 6 cruises supporting the Cascadia Initiative in 2014.
Reference:
Robert Martin-Short, Richard M. Allen, Ian D. Bastow, Eoghan Totten, Mark A. Richards. Mantle flow geometry from ridge to trench beneath the Gorda–Juan de Fuca plate system. Nature Geoscience, 2015; DOI: 10.1038/ngeo2569
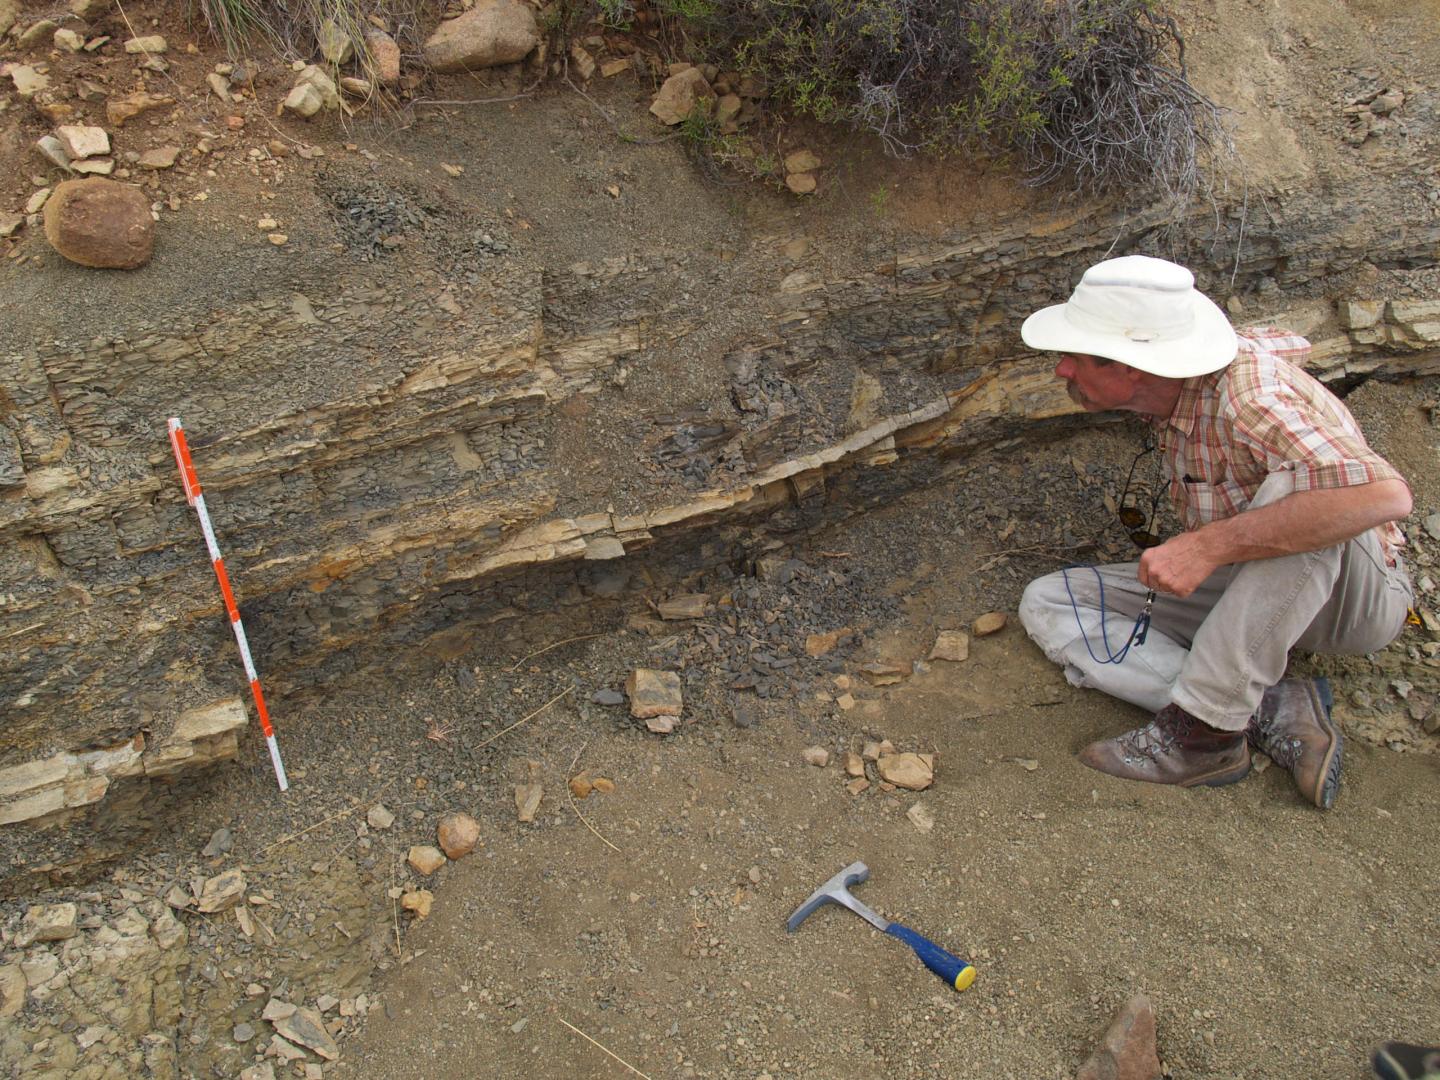
Dr. John Geissman, professor and head of the Department of Geosciences at UT Dallas, examines a fossilized volcanic ash deposit in the Karoo Basin South Africa. He is part of an international research team studying geological evidence related to the largest mass extinction on Earth 250 million years ago. Credit: Photo courtesy Robert Gastaldo, Colby College
New evidence gathered from the Karoo Basin in South Africa sheds light on a catastrophic extinction event that occurred more than 250 million years ago and wiped out more than 90 percent of life in Earth’s oceans and about 70 percent of animal species on land.
In research to be presented Nov. 4 at the annual meeting of the Geological Society of America and published in the October issue of the journal Geology, a University of Texas at Dallas geologist and his colleagues describe new findings that challenge the currently accepted model of the “Great Dying” and how it affected land animals. That event occurred at the end of the Permian geologic period.
The new evidence derives from a key volcanic ash deposit that the team discovered in rock layers, or strata, that were reported to chronicle the mass extinction. By dating the volcanic ash-bearing deposit, researchers concluded that two phases of this extinction — one on land, the other in the oceans — occurred at least 1 million years apart, as opposed to roughly at the same time, as the geoscience community has assumed for decades.
Based on previous dating of shelly fossils and ash beds in marine strata, the die-off among marine species has been well-determined and is generally agreed upon by scientists to have occurred about 251.9 million years ago.
However, the timing of the extinction on land has been more challenging to date definitively. This is due, in part, to a dearth of datable volcanic deposits below and above plant and animal fossils in rocks surrounding the boundary where the Permian period ends and the Triassic begins, said Dr. John Geissman, professor and head of the Department of Geosciences and one of the authors of the study.
“There has been some concern in the scientific community about whether the extinction among vertebrates on land was actually coincident with that in the marine realm in terms of their timing,” Geissman said. “Nonetheless, many researchers have just tacitly assumed that the land event occurred roughly concurrently with the marine extinction.”
Geissman is part of an international research team led by Dr. Robert Gastaldo, lead author of the Geology study and the Whipple-Coddington Professor of Geology at Colby College in Maine. Gastaldo and his colleagues have spent more than a decade conducting intensive study of exposed rocks in the Karoo Basin in southern South Africa. These regions preserve fossils that chronicle what has long been interpreted as the disappearance of key reptile and amphibian species at the end of the Permian period and the reemergence of completely different species in the Triassic period. The rock layers straddle the space in between where scientists infer the global extinction occurred.
Geissman joined Gastaldo’s Karoo Basin team about four years ago. As an expert in paleomagnetism, he uses magnetic polarity stratigraphy to help determine the age of ancient rock layers. The process involves examining variations in Earth’s magnetic field polarity over time that are preserved in the layers. Two years ago, during a hike with a colleague through an arroyo in the Old Lootsberg Pass area in the Karoo Basin, Geissman noticed a feature in the rocks that looked familiar.
“Typically in this area, if there is a gulley, everything exposed will be preserved, which is ideal,” Geissman said. “As we were walking up this arroyo I saw something that I knew I’d seen before in the Western U.S. where I teach a field geology class for UT Dallas students, but I hadn’t seen it here before.
“I knew exactly what it was — it was a fossilized volcanic ash bed.”
The find was significant for two reasons. One, zircon crystals found in ash beds can be dated geologically by examining the decay rate of uranium isotopes contained in the zircon. And secondly, according to the researchers, this ash bed was the first datable evidence found in close proximity to the position in the layers of rock where the extinction of land species was thought to have taken place.
The petrified ash bed lies about 60 meters below the inferred extinction event, which means it resulted from a volcanic eruption that occurred earlier than the extinction. In the world of geology, stratigraphic thickness equates to time — over the eons, layers of sediments are laid down at a rate of so many meters per thousand years, and in this region of the globe, the sedimentation rates translate those 60 meters into, roughly, between 200,000 and 300,000 years, Geissman said.
The team dated the volcanic ash bed at about 253.5 million years old, so moving forward in time 200,000 years — or 60 meters — would indicate the terrestrial phase of the extinction took place about 253.3 million years ago, according to the study.
“This study places the terrestrial vertebrate turnover about 1.5 million years earlier than the accepted estimated age of the marine end Permian-extinction,” Geissman said. “Even if we conservatively say they were a million years apart, that still challenges long-held assumptions about the largest extinction event in Earth’s history.”
Geissman’s examination of the distribution of magnetic polarity in rock samples from the Karoo Basin backed up the team’s conclusions. In January, Geissman will join his colleagues again for further research in the region.
“It’s been a lot of fun working with a great group of stimulating colleagues willing to challenge things,” Geissman said. “It was very gratifying to walk out along an arroyo, see something that I had seen in much younger rocks in the Western U.S., and just know that the dating should work, and indeed it did.
“Part of the satisfaction in this type of research is the serendipity in terms of finding things. It’s all about tromping over as much real estate as you can.”
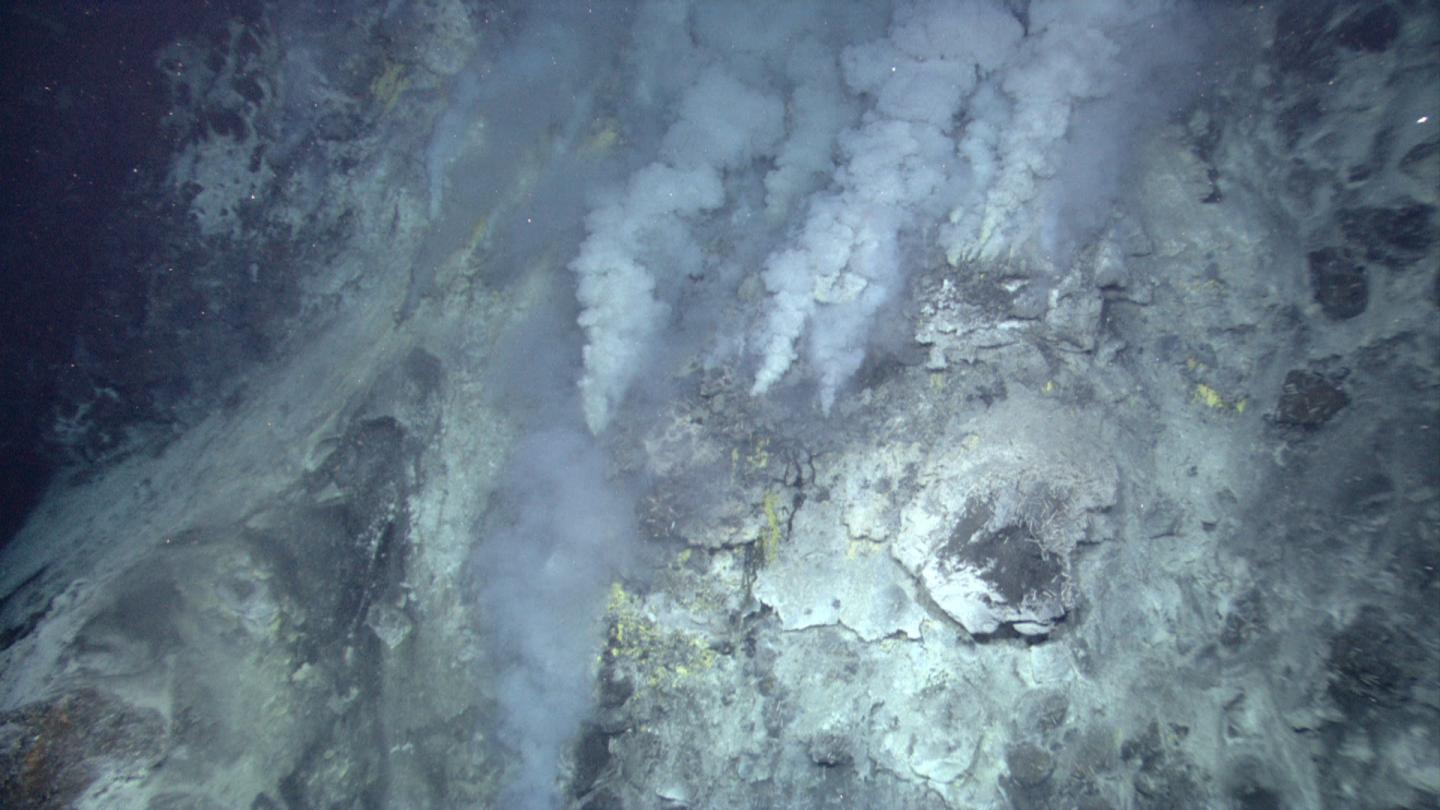
This NOAA image shows a deep ocean hydrothermal vent. Credit: NOAA Okeanos Explorer Program, INDEX-SATAL 2010
Savannah, Ga. – University of Georgia Skidaway Institute of Oceanography scientist Aron Stubbins joined a team of researchers to determine how hydrothermal vents influence ocean carbon storage. The results of their study were recently published in the journal Nature Geoscience.
Hydrothermal vents are hotspots of activity on the otherwise dark, cold ocean floor. Since their discovery, scientists have been intrigued by these deep ocean ecosystems, studying their potential role in the evolution of life and their influence upon today’s ocean.
Stubbins and his colleagues were most interested in the way the vents’ extremely high temperatures and pressure affect dissolved organic carbon. Oceanic dissolved organic carbon is a massive carbon store that helps regulate the level of carbon dioxide in the atmosphere–and the global climate.
Originally, the researchers thought the vents might be a source of the dissolved organic carbon. Their research showed just the opposite.
Lead scientist Jeffrey Hawkes, currently a postdoctoral fellow at Uppsala University in Sweden, directed an experiment in which the researchers heated water in a laboratory to 380 degrees Celsius (716 degrees Fahrenheit) in a scientific pressure cooker to mimic the effect of ocean water passing through hydrothermal vents.
The results revealed that dissolved organic carbon is efficiently removed from ocean water when heated. The organic molecules are broken down and the carbon converted to carbon dioxide.
The entire ocean volume circulates through hydrothermal vents about every 40 million years. This is a very long time, much longer than the timeframes over which current climate change is occurring, Stubbins explained. It is also much longer than the average lifetime of dissolved organic molecules in the ocean, which generally circulate for thousands of years, not millions.
“However, there may be extreme survivor molecules that persist and store carbon in the oceans for millions of years,” Stubbins said. “Eventually, even these hardiest of survivor molecules will meet a fiery end as they circulate through vent systems.”
Reference:
Jeffrey A. Hawkes, Pamela E. Rossel, Aron Stubbins, David Butterfield, Douglas P. Connelly, Eric P. Achterberg, Andrea Koschinsky, Valérie Chavagnac, Christian T. Hansen, Wolfgang Bach & Thorsten Dittmar. Efficient removal of recalcitrant deep-ocean dissolved organic matter during hydrothermal circulation. DOI:10.1038/ngeo2543
Nitrogen-doped carbon nanotubes proved to be efficient, and potentially inexpensive, catalysts for reducing carbon dioxide. Credit: Adapted from Angewandte Chemie
Using solar or wind power to produce carbon-based fuels, which are commonly called fossil fuels, might seem like a self-defeating approach to making a greener world. But when the starting material is carbon dioxide, which can be dragged out of the air, the approach is as green as it gets. The technology that makes it economically feasible isn’t available yet, but a recently published paper presents nice step forward in the effort to not just sequester CO2, but turn it into a useful fuel that is part of a carbon-neutral future.
Xiao-Dong Zhou, an associate professor of chemical engineering at the University of South Carolina, is part of a team that is working on a sustainable approach to harnessing renewable energy. Solar panels and wind turbines are most typically used to produce electricity, but on a large scale, electricity from sources like these pose problems. Utilities need to meet demand at all times, so if a power company is relying solely on wind or solar, what happens when the sun goes behind the clouds or the wind takes a breather?
An alternative that has been long talked about is to use that green electricity to kick CO2 up the energy ladder. Carbon dioxide, the combustion by-product that comes out of power plant smokestacks and is getting too plentiful in the Earth’s atmosphere, is at the bottom of the hill when it comes to carbon-based fuels. As energy goes, it’s spent.
If you could add some energy to it, though, you could convert CO2 into carbon compounds that are fuels, not a waste product. In chemical parlance, it’s called reducing CO2 when you convert it to less-oxidized forms of carbon, all of which have actual fuel value. Some single-carbon molecules to aim for would include (in increasing energy content) carbon monoxide (CO), methanol, and methane.
Any of these could be stored for a cloudy or windless stretch of time, and in most situations a lot more readily than electricity. Methane is the primary component of natural gas, for which there is already plenty of existing infrastructure. Methanol, or wood alcohol, is a close relative of ethanol, or grain alcohol, and is routinely used as a liquid fuel. Carbon monoxide might seem unusual in this context, but it has chemical value as a fuel, both in and of itself and as a precursor to other fuels.
The trick, of course, is to be able to do the CO2 reduction economically. That means not just efficiently converting the electrical energy into chemical energy, but also making the device that does the job a cost-effective one.
Zhou and his research team recently published a paper in Angewandte Chemie that shows progress on both fronts. They have developed potentially inexpensive catalysts that efficiently convert CO2 to CO in an electrochemical cell.
As a starting point for making the catalysts, they used as a model carbon nanotubes, which are made purely of carbon atoms. But in making their catalysts for CO2 reduction, they departed from the carbon-only motif by sprinkling in a few nitrogen atoms to create a different kind of geometric and electronic structure.
The resulting “nitrogen-doped carbon nanotubes” proved to be adept at reducing CO2 to CO, and the team reports that the catalysts are more stable than metal-based catalysts reported in the literature for the same reaction.
What’s more, the researchers went even further, defining how the microstructure on the nitrogen-doped carbon nanotubes can affect the catalysis. When a nitrogen atom is substituted into a position where a carbon atom belongs in a carbon nanotube, it turns out that several distinct chemical bonding patterns can result. The team showed that one of them, termed the pyridinic structure, was the most effective as an electrocatalyst, and was competitive even with much more expensive precious metal catalysts that have been reported for CO2 reduction.
Zhou and his colleagues are pleased with their success so far, but the research team has their sights set even higher.
“We are working in conjunction with other institutions, and they are developing the other side, the water side, using photovoltaics to split water, and eventually we want to couple those two reactions together,” Zhou says. “So one side will be water splitting, generating protons from the anode that travel through the electrolyte to reach the cathode side and then react with carbon dioxide and with incoming electrons to convert carbon dioxide to fuels. Carbon monoxide is one kind of fuel you can produce, and methane and methanol are other fuels that can be produced.
“There’s still a long way to go, but it’s a start.”
Reference:
The research article the team published in Angewandte Chemie, by co-authors Pranav P. Sharma, Jingjie Wu, Ram Manohar Yadav, Mingjie Liu, Christopher J. Wright, Chandra Sekhar Tiwary, Boris I. Yakobson, Jun Lou, Pulickel M. Ajayan and Xiao-Dong Zhou. DOI: 10.1002/anie.201506062
This colorized microscopy image hints at the complexity of microbial life. It shows two bacterial cells in soil. The bacteria glue clay particles together and protect themselves from predators. This also stabilizes soil and stores carbon that could otherwise enter the atmosphere. Credit: Manfred Auer, Berkeley Lab
Microbes are essential to life on Earth. They’re found in soil and water and inside the human gut. In fact, nearly every habitat and organism hosts a community of microbes, called a microbiome. What’s more, microbes hold tremendous promise for innovations in medicine, energy, agriculture, and understanding climate change.
Scientists have made great strides learning the functions of many microbes and microbiomes, but this research also highlights how much more there is to know about the connections between Earth’s microorganisms and a vast number of processes. Deciphering how microbes interact with each other, their hosts, and their environment could transform our understanding of the planet. It could also lead to new antibiotics, ways to fight obesity, drought-resistant crops, or next-gen biofuels, to name a few possibilities.
To understand and harness the capabilities of Earth’s microbial ecosystems, nearly fifty scientists from Department of Energy national laboratories, universities, and research institutions have proposed a national effort called the Unified Microbiome Initiative. The scientists call for the initiative in a policy forum entitled “A unified initiative to harness Earth’s microbiomes” published Oct. 30, 2015, in the journal Science.
The Unified Microbiome Initiative would involve many disciplines, including engineering, physical, life, and biomedical sciences; and collaborations between government institutions, private foundations, and industry. It would also entail the development of new tools that enable a mechanistic and predictive understanding of Earth’s microbial processes.
Among the authors of the Science article are several scientists from the Department of Energy’s Lawrence Berkeley National Laboratory (Berkeley Lab). These are Berkeley Lab Director Paul Alivisatos; Eoin Brodie, Deputy Director of the Climate and Ecosystem Sciences Division; Mary Maxon, the Biosciences Area Principal Deputy; Eddy Rubin, Director of the Joint Genome Institute; and Peidong Yang, a Faculty Scientist in the Materials Sciences Division. Alivisatos is also the Director of the Kavli Energy Nanoscience Institute, and Yang is the Co-Director.
Berkeley Lab has a long history of microbial research, from its pioneering work in metagenomics at the Joint Genome Institute, to the more recent Microbes to Biomes initiative, which is designed to harness microbes in ways that protect fuel and food supplies, environmental security, and health.
The call for the Unified Microbiome Initiative comes at a critical time in microbial research. DNA sequencing has enabled scientists to detect microbes in every biological system, thriving deep underground and inside insects for example, and in mind-boggling numbers: Earth’s microbes outnumber the stars in the universe. But to benefit from this knowledge, this descriptive phase must transition to a new phase that explores how microbial communities function, how to predict their actions, and how to make use of them.
“Technology has gotten us to the point where we realize that microbes are like dark matter in the universe. We know microbes are everywhere, and are far more complex than we previously thought, but we really need to understand how they communicate and relate to the environment,” says Brodie.
“And just like physicists are trying to understand dark matter, we need to understand the functions of microbes and their genes. We need to study what life is like at the scale of microbes, and how they relate to the planet,” Brodie adds.
This next phase of microbiome research will require strong ties between disciplines and institutions, and new technologies that accelerate discovery. The scientists map out several opportunities in the Science article. These include:
Tools to understand the biochemical functions of gene products, a large portion of which are unknown.
Technologies that quickly generate complete genomes from individual cells found in complex microbiomes.
Imaging capabilities that visualize individual microbes, along with their interactions and chemical products, in complex microbial networks.
Adaptive models that capture the complexity of interactions from molecules to microbes, and from microbial communities to ecosystems.
Many of these new technologies would be flexible platforms, designed initially for microbial research, but likely to find uses in other fields.
Ten years after the launch of the Unified Microbiome Initiative, the authors of the Science article envision an era in which a predictive understanding of microbial processes enables scientists to manage and design microbiomes in a responsible way–a key step toward harnessing their capabilities for beneficial applications.
“This is an incredibly exciting time to be involved in microbial research,” says Brodie. “It has the potential to contribute to so many advances, such as in medicine, energy, agriculture, biomanufacturing, and the environment.”
Video
Microbes are the Earth’s most abundant and diverse form of life. Berkeley Lab’s Microbes to Biomes initiative is designed to explore and reveal the interactions of microbes with one another and with their environment.
Microbes power our planet’s biogeochemical cycles, provide nutrients to our plants, purify our water and are integral components in keeping the human body free of disease and may hold to the Earth’s future.
Reference:
A. P. Alivisatos, M. J. Blaser, E. L. Brodie, M. Chun, J. L. Dangl, T. J. Donohue, P. C. Dorrestein, J. A. Gilbert, J. L. Green, J. K. Jansson, R. Knight, M. E. Maxon, M. J. McFall-Ngai, J. F. Miller, K. S. Pollard, E. G. Ruby, S. A. Taha. A unified initiative to harness Earth’s microbiomes. Science, 2015; 350 (6260): 507 DOI: 10.1126/science.aac8480