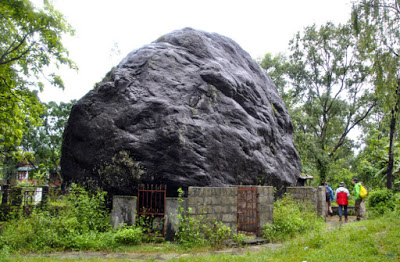
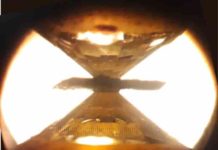
Bhim Kali boulder on top of the sediment deposits near Pokhara in Nepal. The boulder is approx. 10m in diameter and weighs around 300kg. The timing of deposition of this boulder has been dated in this study and coincides with the timing of a large earthquake in 1681 in Nepal. Credit: C. Andermann, GFZ
Pokhara, the second largest town of Nepal, has been built on massive debris deposits, which are associated with strong medieval earthquakes. Three quakes, in 1100, 1255 and 1344, with magnitudes of around Mw 8 triggered large-scale collapses, mass wasting and initiated the redistribution of material by catastrophic debris flows on the mountain range. An international team of scientists led by the University of Potsdam has discovered that these flows of gravel, rocks and sand have poured over a distance of more than 60 kilometers from the high mountain peaks of the Annapurna massif downstream.
Christoff Andermann from the GFZ German Research Centre for Geosciences in Potsdam participated in the study, published now in the Science magazine. “We have dated the lake sediments in the dammed tributary valleys using 14C radiocarbon. The measured ages of the sediment depositions coincide with the timing of documented large earthquakes in the region.”
One big boulder, situated on top of the sediment depositions, has raised the interest of the scientists: “The boulder has a diameter of almost ten meters and weighs around 300 tons. At the top of the boulder we measured the concentration of a Beryllium isotope which is produced by cosmogenic radiation.” This 10Be chemical extraction was carried out in the isotope laboratory at the GFZ in Potsdam and was measured with the accelerator mass spectrometer at the Helmholtz-Zentrum Dresden-Rossendorf, Germany. The results show that the deposition of the big boulder matches the timing of another large earthquake from 1681. Pokhara lies at the foot of the more than 8000 meters high Annapurna massif; whether the big boulder was transported during the last dated earthquake with the debris, or was just toppled by the strong shaking needs to be further investigated. Nevertheless, the movement of the big boulder can be connected to this strong earthquake.
This research has several important implications reaching beyond fundamental earth sciences. The study provides new insights into the mobilization and volumes of transported material associated with strong earthquakes. Dating of such sediment bodies provides information about the reoccurrence intervals of earthquakes in the Himalayas, and ultimately demonstrates the role of earthquakes in shaping high mountain landscapes. This knowledge is crucial to better evaluate the risks in tectonically active mountain belts.
Reference:
Wolfgang Schwanghart, Anne Bernhardt, Amelie Stolle, Philipp Hoelzmann, Basanta R. Adhikari, Christoff Andermann, Stefanie Tofelde, Silke Merchel, Georg Rugel, Monique Fort, Oliver Korup. Repeated catastrophic valley infill following medieval earthquakes in the Nepal Himalaya. Science, 2015; DOI: 10.1126/science.aac9865
A new study by Stanford researchers suggests that earthquakes triggered by human activity follow several indicative patterns that could help scientists distinguish them from naturally occurring temblors.
The findings were presented this week at the American Geophysical Union’s fall meeting in San Francisco.
Jenny Suckale, an assistant professor of geophysics at Stanford’s School of Earth, Energy & Environmental Sciences, and her postdoctoral researcher David Dempsey analyzed a sequence of earthquakes on an unmapped basement fault near the town of Guy, Arkansas, from 2010 to 2011.
In geology, “basement” refers to rock located beneath a sedimentary cover that may contain oil and other gas reserves that can be exploited through drilling or hydraulic fracturing, also known as “fracking.” Scientists suspected that the Arkansas quakes were triggered by the injection of roughly 94.5 million gallons of wastewater into two nearby wells that extend into the basement layer during a nine-month span. The injected water increases the pore pressure in the basement layer, adding more stress to already stressed faults until one slips and releases seismic waves, triggering an earthquake.
One of the study’s main conclusions is that the likelihood of large-magnitude humanmade, or “induced,” earthquakes increases over time, independent of the previous seismicity rate. A reservoir simulation model that Suckale and Dempsey developed found a linear relationship between frequency and magnitude for induced quakes, with magnitude increasing the longer wastewater is pumped into a well.
“It’s an indication that even if the number of earthquakes you experience each month is not changing, as you go further along in time you should expect to see larger magnitude events,” said Dempsey, who is now at the University of Auckland in New Zealand.
This trend doesn’t continue indefinitely, however. The research shows that induced quakes begin to fall off after reaching some maximum magnitude as the triggered faults release more of their stress as seismic waves.
While energy companies might welcome the notion that there are upper limits to how strong an induced quake on a particular fault can be, it’s difficult to know what that ceiling will be.
“The question becomes, Does it taper off at magnitude 3 or a more dangerous magnitude 6.5?” Suckale said.
Other studies have found that the rate of wastewater injection into a well is more important than the total volume injected for triggering earthquakes. But the Stanford study found that, given similar rates of wastewater injection, there is a direct correlation between the volume injected and the incidence of earthquakes. Of the two wells studied near Guy, Well 1 received four times the wastewater volume as Well 5, and induced four times as many earthquakes.
“There’s a scaling there in terms of the volume injected,” Dempsey said.
The study’s findings could have implications for both the oil and natural gas industry and for government regulators. Under current practices, extraction activities typically shut down in an area if a high-magnitude earthquake occurs. But according to Suckale, a better approach might be to limit production before a large quake occurs.
“Very often with these faults, once you have a big earthquake, you might not have one for a while because you just released all the stress,” Suckale said.
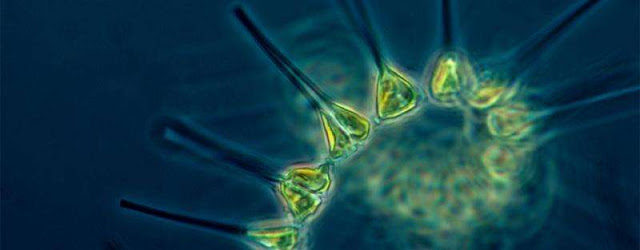
Phytoplankton, the single-celled plants that perform half of the world’s photosynthetic activity, are sensitive to climate change. New research is shedding light on how their populations will rise, fall and shift as the Earth warms. Credit: NOAA
As nations across the globe negotiate how to reduce their contributions to climate change, researchers at Penn are investigating just how the coming changes will impact the planet. What’s clear is that the effect extends beyond simple warming. Indeed, the very physics and chemistry of the oceans are also shifting, and are forecast to change even more in the coming decades.
These changes have implications for, among other things, the single-celled organisms that comprise the base of the ocean’s food web and are responsible for half of the world’s photosynthetic activity: phytoplankton. Not only are phytoplankton sensitive to changes in climate, they also contribute to those changes, as they can remove carbon from the atmosphere and store it deep in the ocean when they die.
A micrograph of phytoplankton. Like plants on land, phytoplankton growth is controlled by environmental factors such as light, nutrients, and temperature.
Irina Marinov, an assistant professor in the University of Pennsylvania’s Department of Earth & Environmental Science in the School of Arts & Sciences, and her lab members have published two studies this fall that concern themselves with what climate models have to say about how phytoplankton and ocean ecosystems will respond to the profound changes the Earth is undergoing.
“The goal is to understand model projections of ocean ecology, productivity, and biogeochemistry for the year 2100, and check the consistency of those predictions across the current generation of climate models,” says Marinov.
The latest Assessment Report by the Intergovernmental Panel on Climate Change (IPCC), released in 2013, included 16 different models, each produced by different groups working around the globe. Marinov and colleagues, including recent graduate Shirley Leung and postdoc Anna Cabré, investigated how phytoplankton would be predicted to respond to such changing variables as nutrients, light, and ocean stratification under each of the models.
Their analyses reveal complex patterns of phytoplankton response. In a paper in Biogeosciences, they show that, in the Southern Ocean, future climate change will bring increases or decreases in phytoplankton abundance and production in distinct latitudinal bands—a pattern the researchers had not anticipated.
“Because with climate change you have less mixing of the water column, we thought that the phytoplankton would have more access to light and they would simply expand, but instead we saw these bands of high and low abundance,” Cabré says.
Phytoplankton are very sensitive to mineral availability, including nitrate and iron, and also to light. The team found that the latitudinal bands correspond to increased iron, which increased phytoplankton productivity from 40 to 50 degrees South, decreased light driven by changes in winds and clouds, which decreased productivity from 50 to 65 degrees South; and increased light due to more sea-ice melting in the summer, which increased productivity along the Antarctic shores.
“Intriguingly, the trends in phytoplankton productivity predicted by the models are in line with what has already been observed over the past 20 or 30 years,” says Marinov, “suggesting that the climate change signal might have already become apparent in parts of the Southern Ocean.”
Another of the group’s studies, published in Climate Dynamics, looked beyond the Southern Ocean to include trends in phytoplankton production across all of the Earth’s biomes. They found that, while high latitudes are predicted to have increases in phytoplankton production on average, the overall global trend is toward decreased production—meaning that an important climate sink of carbon dioxide will slowly shrink.
The researchers plan to continue probing the IPCC climate models, but also hope that new data will allow them to refine their predictions about the oceans’ role in climate change.
“We need more observations,” Cabré says. “There are a lot of new missions going to the Southern Ocean. Our analyses can help them figure out what they need to look for, and their findings will push our analyses forward.”
Reference:
S. Leung et al. A latitudinally banded phytoplankton response to 21st century climate change in the Southern Ocean across the CMIP5 model suite, Biogeosciences (2015). DOI: 10.5194/bg-12-5715-2015
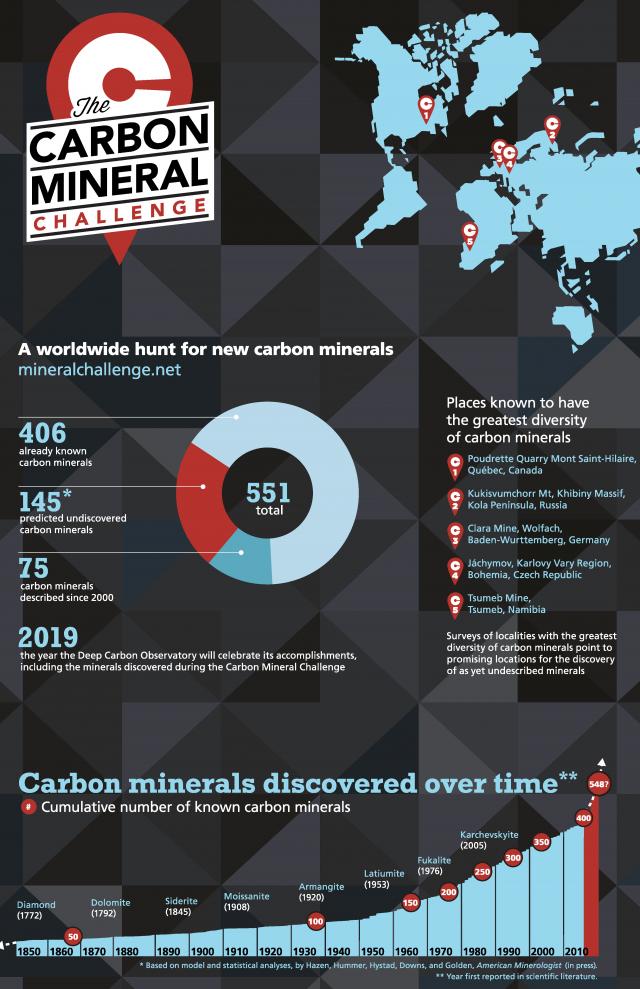
The hunt is on for Earth’s undiscovered carbon minerals. Scientists, using statistical calculations, now know how many are out there. They even have some ideas about where to look. But to find them, they need the help of the world’s mineral collecting community.
The Carbon Mineral Challenge sets the stage for both professional and amateur mineral collectors to make their mark by discovering never-before described minerals.
Why carbon minerals?
Carbon is one of the most chemically diverse elements, and occurs in compounds with almost every element of the periodic table. Some carbon-containing minerals form ores, which are mined for metals such as iron, nickel, and copper. Carbon-bearing minerals can contain rare Earth elements, critical components of smart phones and tablets. Carbon also becomes coal and diamond. And, most importantly, without carbon, there is no life.
Given the scientific value of potential new carbon-bearing mineral discoveries, the Deep Carbon Observatory (DCO) is challenging both amateur collectors and professional mineralogists around the world to find these rare specimens.
DCO is a global community of multi-disciplinary scientists unlocking the inner secrets of Earth through investigations into life, energy, and the fundamentally unique chemistry of carbon. A key goal of DCO is to identify the forms of carbon in Earth. Any new carbon minerals discovered as part of the Carbon Mineral Challenge will address this important scientific question, and add to our growing understanding of Earth’s unique chemical makeup.
Earth is the only known planet that supports life. Life on Earth has interacted with rocks over billions of years, generating a telltale geobiological footprint. Such a footprint should be visible on other life-supporting planetary bodies.
“Figuring out the mineral signature of a life-suppoting planet is a really exciting prospect,” says Robert Hazen, Senior Staff Scientist at the Carnegie Institution of Washington, USA and Executive Director of the Deep Carbon Observatory. “Without life, fewer than a third of the different kinds of minerals we see on Earth would exist. Our new projections will inform planetary investigations, with probes tuned to detect mineralogical signs of life.”
How many are out there?
Today, mineralogists recognize 406 carbon minerals out of more than 5000 known mineral species on Earth. Since 2010, the International Mineralogical Association has reported the discovery of an average of about four new carbon minerals every year for the past five years. However, DCO researchers now estimate there are at least 145 more carbon minerals still awaiting discovery.
Hazen and his colleagues, including mathematician Grethe Hystad of Purdue University Calumet, used a type of analysis called Large Number of Rare Events (LNRE) modeling to formulate this prediction, and will share the work in American Mineralogist in early 2016 (a preprint is available here) as well as during the Friday morning poster session at the 2015 AGU Fall Meeting (V51C-3039) and -3040.
“Imagine reading a book,” says DCO’s Hazen. “Some words you read over and over throughout, such as ‘and’ and ‘the.’ These common words are everywhere and easy to spot. On the other hand, there are words that may appear only one or two times in an entire book. Earth’s missing minerals are like these rare words; we haven’t found them yet because they formed only in very few places and in very small quantities.”
The LNRE model also predicts that the majority of the carbon-bearing minerals awaiting discovery are hydrous carbonates, a potentially challenging fact for collectors.
Where are these undiscovered minerals and what do they look like?
Hazen’s team predicts finding missing carbon minerals will challenge even the most dedicated mineral collectors. To have remained hidden for so long, these minerals must reside in remote localities and in small quantities. In some cases the minerals are likely ephemeral in nature. Many of the carbon species on Hazen’s list, including hydrous carbonates, are potentially colorless, poorly crystalized, or easily dissolved in water.
While Hazen and colleagues have not identified a treasure map for finding the missing carbon minerals, there are some potentially rewarding localities to consider. These include the Poudrette Quarry in Canada, Kukisvumchorr Mountain in Russia, and Clara Mine in Germany, where collectors have already found a diverse array of carbon minerals.
“There’s something magical about mineral collecting that’s hard to put into words,” said Hazen’s colleague and DCO early career scientist Daniel Hummer. “You’re collecting fundamental constituents of the natural world that only exist because life has interacted with rocks over millions, or even billions, of years.”
“One of the most exciting prospects,” Hummer continues, “is we might even stumble upon minerals we didn’t predict in our analyses. We could be in for a surprise!”
In fact, some of the missing carbon minerals might be hiding in plain sight, sitting in a museum drawer.
“As a PhD student at the University of Arizona, I work on the development of the RRUFF mineral database in (co-author) Professor Robert Downs’ lab,” said Barbara Lafuente. “It’s quite possible we’ll find one or two new carbon minerals in our university’s mineral collection, now that we know what we’re looking for.”
How does the Carbon Mineral Challenge work?
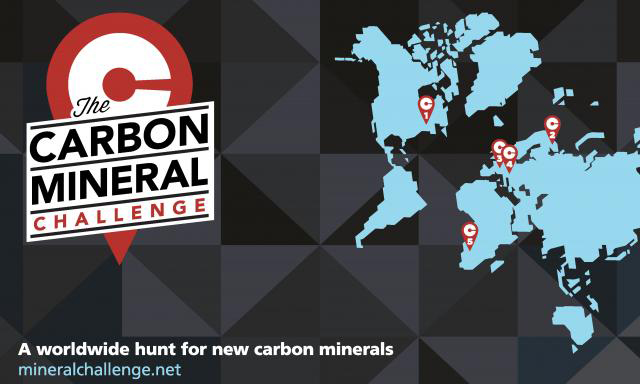
An infographic describing the Deep Carbon Observatory’s Carbon Mineral Challenge: A worldwide hunt for new carbon minerals. Credit: DCO/Josh Wood
Amateur and professional mineral collectors should follow the procedures outlined by the International Mineralogical Association Commission on New Minerals Nomenclature and Classification. Once the commission has approved the new mineral, the team responsible for its discovery and verification should submit their entry to the Carbon Mineral Challenge via mineralchallenge.net.
Interested collectors may contact Carbon Mineral Challenge International Advisory Board members in their region with questions about mineral analysis and verification. Mineralchallenge.net also contains comprehensive guidelines, useful links, a photo gallery of known carbon minerals, and a list of FAQs for potential participants.
The Carbon Mineral Challenge will continue until September 2019. DCO will publicly recognize each discovery as it happens and celebrate the final suite of newly discovered carbon minerals at the culmination of its decadal program in late 2019.
The Carbon Mineral Challenge shines a light on a very specific, but important, subset of minerals. Over the next four years, and with each new discovery, a new piece of Earth’s mineralogical puzzle will fall into place.
Video
Reference:
Hazen, R.M., Hummer, D.R., Hystad, G., Downs, R.T., Golden, J.J. (2015) Carbon mineral ecology: Predicting the undiscovered minerals of carbon. American Mineralogist, in press. DOI: 10.2138/am-2015-5546
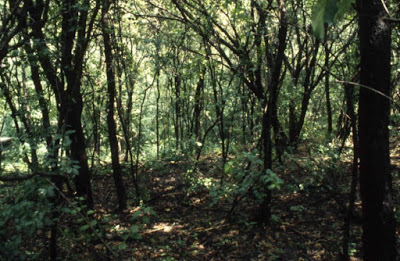
A Southern Wisconsin woods being strangled by buckthorn, a tree that was sold in nurseries and started to invade the region over the past half-century. As buckthorn excludes all other vegetation, this site that was formerly dominated by oak shows some of the ways that human activity has changed the relationship among species, as described by UW-Madison botany professor Donald Waller and co-authors in a new study in the journal Nature. Credit: David J Tenenbaum, University of Wisconsin-Madison
A study published today finds a surprising and very recent shift away from the steady relationship among species that prevailed for more than 300 million years.
The study, published in the journal Nature, offers the first long-term view of how species associated with each other for half of the existence of multicellular life on Earth, says co-author Donald Waller, a professor of botany at the University of Wisconsin-Madison. “We did not expect, or predict, that we would see continuity in the fossil record for such a long time. The fraction of plant and animal species that were positively associated with each other was mostly unchanged for 300 million years. Then that fraction sharply declined over the last 6,000 years,” says Waller, a plant ecologist.
Species are ‘positively associated’ if they are found in the same place and time.
Starting about 6,000 years ago, negatively associated species were preponderant, meaning plants and animals are seldom found in the same place and time, a sign that longstanding relationships have been disturbed.
In assessing the cause of the dramatic change they found, the researchers first eliminated five possible sources of error. “Senior author Nicholas Gotelli, of the University of Vermont, developed careful methods to guard against false positive results,” Waller says. “With a result as unexpected as this, we wanted to be very careful to make sure that the pattern was real and not an artifact of the methods we were using, or the particular datasets we looked at.”
The most likely cause for the shift, the researchers state, was rapid human population growth, with ensuing effects from plant and animal agriculture. “The conclusion we reluctantly came to is that there have been systematic changes around the world in ecological conditions, prompting changes in the pattern of species coexistence,” Waller says. “This is an aspect of global change that has never been noticed, or documented before.”
Although the researchers do not have direct evidence for the cause of any particular species assemblage, patterns of species living together form an intricate ecological web involving predation, symbiosis, disease, nutrition, habitat and evolution, Waller points out.
The situation on continents, often recognized as having more stable species assemblages, is now starting to resemble the situation on islands, Waller says. “In general, island habitats are fragmented, and species are vulnerable and declining. Islands are models for conservation biology because they indicate what happens in the end game” as species go extinct and biodiversity declines.
The study, supported by the National Science Foundation, is more evidence that humans have substantially changed the planet, Waller adds. “The Paris accord on climate signed last week reflects a global recognition that humans have fundamentally changed our planet’s climate. Now we present evidence that humans are changing the Earth in another fundamental way: how species are associated with one another. It’s fossil evidence that we have entered the ‘anthropocene,’ a geologic era marked by human dominance of the planet. In fact, the study even provides a way to date the start of the anthropocene.”
Reference:
S. Kathleen Lyons, Kathryn L. Amatangelo, Anna K. Behrensmeyer, Antoine Bercovici, Jessica L. Blois, Matt Davis, William A. DiMichele, Andrew Du, Jussi T. Eronen, J. Tyler Faith, Gary R. Graves, Nathan Jud, Conrad Labandeira, Cindy V. Looy, Brian McGill, Joshua H. Miller, David Patterson, Silvia Pineda-Munoz, Richard Potts, Brett Riddle, Rebecca Terry, Anikó Tóth, Werner Ulrich, Amelia Villaseñor, Scott Wing, Heidi Anderson, John Anderson, Donald Waller, Nicholas J. Gotelli. Holocene shifts in the assembly of plant and animal communities implicate human impacts. Nature, 2015; DOI: 10.1038/nature16447
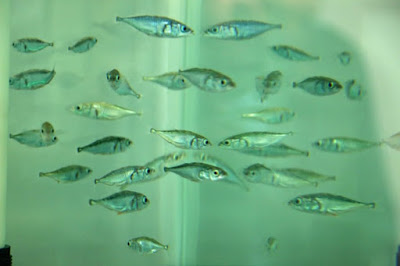
Stickleback fish. Evolution can happen quickly, even in decades, says UO biologist Bill Cresko. Credit: Image courtesy of University of Oregon
Evolution is usually thought of as occurring over long time periods, but it also can happen quickly. Consider a tiny fish whose transformation after the 1964 Alaskan earthquake was uncovered by University of Oregon scientists and their University of Alaska collaborators.
The fish, seawater-native threespine stickleback, in just decades experienced changes in both their genes and visible external traits such as eyes, shape, color, bone size and body armor when they adapted to survive in fresh water. The earthquake — 9.2 on the Richter scale and second highest ever recorded — caused geological uplift that captured marine fish in newly formed freshwater ponds on islands in Prince William Sound and the Gulf of Alaska south of Anchorage.
The findings — detailed in a paper available online in the Proceedings of the National Academy of Sciences — are important for understanding the impacts of sudden environmental change on organisms in nature, says UO biologist William Cresko, whose lab led the National Science Foundation-funded research.
“We’ve now moved the timescale of the evolution of stickleback fish to decades, and it may even be sooner than that,” said Cresko, who also is the UO’s associate vice president for research and a member of the UO Institute of Ecology and Evolution. “In some of the populations that we studied we found evidence of changes in fewer than even 10 years. For the field, it indicates that evolutionary change can happen quickly, and this likely has been happening with other organisms as well.”
Survival in a new environment is not new for stickleback, a small silver-colored fish found throughout the Northern Hemisphere. A Cresko-led team, using a rapid genome-sequencing technology (RAD-seq) created at the UO with collaborator Eric Johnson, showed in 2010 how stickleback had evolved genetically to survive in fresh water after glaciers receded 13,000 years ago. For the new study, researchers asked how rapidly such adaptation could happen.
The newly published research involved stickleback collected by University of Alaska researchers from freshwater ponds on hard-to-reach marine islands that were seismically thrust up several meters in the 1964 quake.
RAD-seq technology again was used to study the new samples. Genetic changes were similar to those found in the earlier study, but they had occurred in less than 50 years in multiple, separate stickleback populations. Stickleback, the researchers concluded, have evolved as a species over the long haul with regions of their genomes alternatively honed for either freshwater or marine life.
“This research perhaps opens a window on how climate change could affect all kinds of species,” said Susan L. Bassham, a Cresko lab senior research associate who also was co-author of the 2010 paper. “What we’ve shown here is that organisms — even vertebrates, with long generation times — can respond very fast to environmental change.
“And this is not just a plastic change, like becoming tan in the sun; the genome itself is being rapidly reshaped,” she said. “Stickleback fish can adapt on this time scale because the species as a whole has evolved, over millions of years, a genetic bag of tricks for invading and surviving in new freshwater habitats. This hidden genetic diversity is always waiting for its chance, in the sea.”
Co-authors with Bassham and Cresko on the PNAS paper were Emily A. Lescak of UA-Anchorage and Fairbanks; Julian Catchen of the University of Illinois at Urbana-Champaign; and Ofer Gelmond, Frank A. von Hippel and Mary L. Sherbick of UA-Anchorage.
NSF grants DEB0949053 and IOS102728 to Cresko and DEB 0919234 to von Hippel provided the primary funding for the project. National Institutes of Health grant 1R24GM079486-01A1 and the M. J. Murdock Charitable Trust also supported Cresko.
The 2010 study appeared in the PLOS Genetics.
Video
University of Oregon biologist Bill Cresko discusses his lab’s discovery that threespine stickleback, a small fish native to seawater, were able to quickly evolve, both genetically and phenotypically (external traits), to survive their being isolated in small freshwater ponds following the 1964 Alaskan earthquake. Cresko’s team suggests other organisms may have this ability to survive sudden environmental change.
Reference:
Emily A. Lescak, Susan L. Bassham, Julian Catchen, Ofer Gelmond, Mary L. Sherbick, Frank A. Von Hippel, and William A. Cresko. Evolution of stickleback in 50 years on earthquake-uplifted islands. PNAS, December 14, 2015 DOI: 10.1073/pnas.1512020112
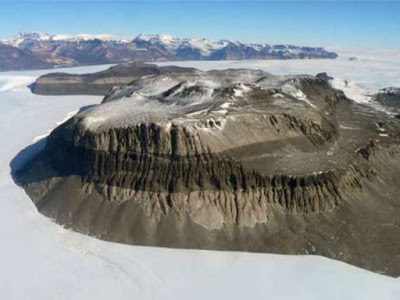
The field site in East Antarctica, which has been frozen for more than 14 million years.
Antarctica was once a balmier place, lush with plants and lakes. Figuring out just how long the continent has been a barren, cold desert of ice can give clues as to how Antarctica responded to the effects of past climates and can perhaps also indicate what to expect there in the future as Earth’s atmospheric concentration of carbon dioxide grows.
In a new study in Scientific Reports, University of Pennsylvania researchers use an innovative technique to date one of Antarctica’s ancient lake deposits. They found that the deposits have remained frozen for at least the last 14 million years, suggesting that the surrounding region, the East Antarctic Ice Sheet, or EAIS, has likewise remained intact.
The work adds new support for the idea that the EAIS did not experience significant melting even during the Pliocene, a period from 3 to 5 million years ago, when carbon dioxide concentrations rivaled what they are today.
“The Pliocene is sometimes thought to be an analog to what Earth will be like if global warming continues,” said Jane K. Willenbring, an assistant professor in the Department of Earth and Environmental Science in Penn’s School of Arts & Sciences. “This gives us some hope that the East Antarctic Ice Sheet could be stable in today’s and future climate conditions.”
Willenbring collaborated on the study with lead author and Penn graduate student Rachel D. Valletta, as well as Adam R. Lewis and Allan C. Ashworth from the University of North Dakota and Marc Caffee from Purdue University.
Current climate change projections indicate that the marine portion of the West Antarctic Ice Sheet is “a goner,” Willenbring said. Studies from the past few years suggest that sea level will likely rise a few meters as that ice melts. But the East Antarctic Ice Sheet is 20 times more massive. If it melted, the ensuing sea level rise would be even more catastrophic than the western peninsula’s dissolution.
To shed light on what could happen in the future to the EAIS, geologists often look to the past. But there is not a scientific consensus about how the EAIS has behaved in different climates throughout history. Some scientists believe the ice sheet experienced significant melting during the relatively warmer conditions of the Pliocene, while others think it has remained almost entirely frozen for the last 14 million years.
Willenbring and colleagues hoped to help clarify the history of the EAIS. They traveled to Antarctica’s Friis Hills in the central Dry Valleys of the eastern portion of the continent. About a foot beneath the surface are sediment deposits from an ancient lake which is known from animal fossils to have been freshwater. Earlier dating established that the volcanic ash deposits at the bottom of the ancient lake are 20 million years old.
To see if any melting had occurred in the interim, they analyzed radioactive isotopes of beryllium known as beryllium-10, which form in the atmosphere when cosmic rays collide with oxygen and nitrogen atoms.
“Beryllium-10 sticks on to particles quite easily and is associated with lake deposits,” Willenbring said. “We wanted to see if we could use this isotope to figure out how long the sediment was in place and isolated from liquid water.”
Beryllium-10 has a known half-life of 1.4 million years. After estimating an initial level of initial concentration of beryllium-10 in their lake samples, the researchers were able to estimate the age of the sediments to be between 14 and 17.5 million years ago.
“We found that the beryllium-10 was almost completely gone, within the resolution of our technique,” Willenbring said.
Willenbring said the team was confident that the area had remained frozen since then because if there had been melting, the water would have penetrated the sediments and “reset” the beryllium-10 measurements.
“This means that the sediment is definitely older than the time when a lot of people think that Antarctica might have been quite deglaciated,” she said.
By offering support for the idea that the EAIS has been largely stable during the last 14 million years, the research offers some hope that a massive collapse of the ice sheet, and associated sea level rise of tens of meters, may not be imminent.
Willenbring, however, cautions that even though carbon dioxide levels in the Pliocene may be analogous to today’s levels, the two situations are not equivalent and thus any conclusions can only be taken so far.
“Even though the Pliocene conditions could be an analog for CO2 concentrations today, we’ve probably never experienced such a fast transition to warm temperatures as we’re seeing right now,” she said.
Reference:
Rachel D. Valletta et al. Extreme decay of meteoric beryllium-10 as a proxy for persistent aridity, Scientific Reports (2015). DOI: 10.1038/srep17813
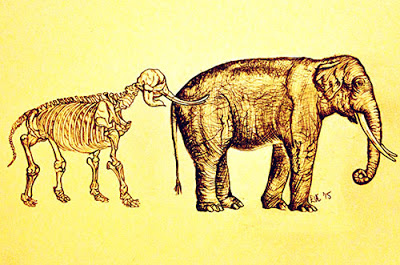
Fossil evidence can enrich our understanding of evolution, as shown by this recent study of elephants and related species Credit: Emma V Earl
Our understanding of evolution can be enriched by adding fossil species to analyses of living animals, as shown by scientists from the University of Bristol.
Their paper, published today in Proceedings of the Royal Society B, investigates patterns of evolutionary change in a group of mammals known as Afrotheria. This charismatic group of mainly African mammals includes elephants, manatees, and elephant shrews. The team were interested in how body mass has evolved in Afrotheria, and how our interpretations differ when we take their extinct fossil relatives into account.
Lead author Mark Puttick, a PhD student in the School of Earth Sciences, said: “Most of life is extinct, so if we analyse evolutionary change without considering fossils we are not using all the available evidence. Most evolutionary studies use data from living species only, but recent investigations have shown that fossils can change the picture. For example, a fossil elephant can help us understand evolutionary body mass change more accurately. Afrotheria are an excellent case to study evolutionary changes in size through time as they vary so much in body mass: from the five ton elephant to a few grams in some tenrecs.
“Surprisingly, we found that if we include or ignore the fossil evidence we see similar patterns. High rates of evolution lead to the larger taxa, such as elephants, manatees, and hyraxes. This is probably a ‘goldilocks’ case in which the fossil record is just right to fit into patterns of evolution we see from living taxa. It might not always be the case, when fossils might provide a very different picture of evolution.”
The research also highlights that different methods can be crucial in analysing evolutionary change.
Co-author Dr Gavin Thomas, of the University of Sheffield, added: “A really important result here is that large differences in our understanding can come from the models we use to analyse past changes, just as much as from the data; this is something we need to consider more in the future.”
Mark Puttick said: “Although our results show agreement between fossils and extant taxa, we feel it is vital to include fossils in future analyses, to better understand the evolution of life.”
Reference:
Fossils and living taxa agree on patterns of body mass evolution: a case study with Afrotheria, by Mark Puttick and Gavin Thomas, Proceedings of the Royal Society B, DOI: 10.1098/rspb.2015.2023
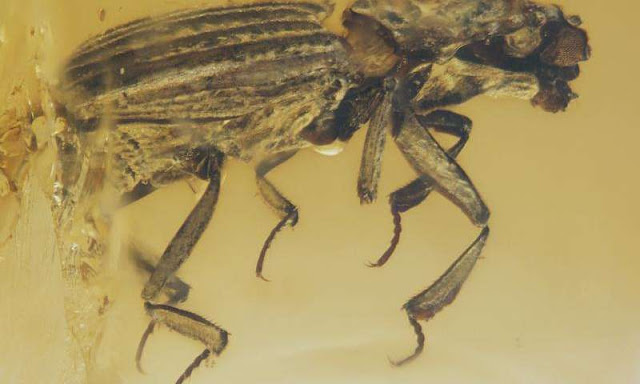
This 99-million-year-old fossil of an ancient beetle is spectacularly preserved. Credit: Stuttgart State Museum of Natural History
About 100 million years ago, a tiny beetle flew into a coniferous tree and became engulfed in its resin.
Though the tree fell to ruin in a time long forgotten, a drop of its resin fossilized into amber — with the beetle fully encased — and then survived the relentless ravages of time, resulting in one of the most spectacularly preserved ancient beetle specimens yet described.
First discovered in Myanmar, the rare fossil is now in the hands of international experts who are thrilled that it has managed to remain so exquisitely intact after almost a million centuries of existence.
“For a beetle taxonomist and for the entomological community as a whole, this is an exciting discovery,” said Michael Caterino, the director of the Clemson University Arthropod Collection. “This is an extraordinary 99 million-year-old fossil in Burmese amber. We can see all the details of the external sculpturing of the wing covers and the head. We can see the mouth parts, which enable us to predict that this was a predator much like it’s modern relatives. And it has a lot of tantalizing characteristics that we hypothesized early members of this family had. But we no longer have to guess. Now we can confirm.”
The ancient insect is a member of a family of beetles called Histeridae, which still thrive today with more than 4,000 species. The specimen is only about two millimeters long, which is about the width of the tip of a new crayon.
“Insects are such a vast group that most people who work on them tend to specialize in very small subsets,” said Caterino, who is Morse Chair of Arthropod Biodiversity at Clemson. “So even within beetles, I specialize on this one family: Histeridae. Mostly I study living members, doing fieldwork throughout North and South America in pursuit of new species. But I also try to put together evolutionary trees and see how they have evolved over time. That’s why the discovery of this fossil was so exciting to me. It provides tangible evidence to back up some previous inferences, but it also reveals some surprises.”
To ensure that it remains undamaged, the beetle fossil is now housed in Stuttgart State Museum of Natural History in Germany. Caterino has not seen the fossil in person, but his museum partners have provided him with high-resolution images that have enabled him to intensively study of the insect’s visible features. Caterino has co-authored a research article about the discovery with Karin Wolf-Schwenninger and Günter Bechly titled “Cretonthophilus tuberculatus, a remarkable new genus and species of hister beetle (Coleoptera: Histeridae) from Cretaceous Burmese amber.”
“In most cases, I wouldn’t consider photography adequate for my research,” said Caterino, who has been studying the Histeridae for nearly 20 years. “But at my direction, Karin and Günter were able to take fantastic photographs of the fossil that provided every angle I needed. This is a new fossil genus species that we’ve called Cretonthophilus tuberculatus. Cretonthophilus indicates that it’s a Cretaceous relative of the modern-day genus Onthophilus, while tuberculatus refers to the large bumps on the sides of its thorax.”
Several aspects of the anatomy of the new species suggest that the fossil species may have been associated with early ants. This is a common habit in beetles, and this would be one of the earliest associations. However, at this point this can only be hypothesized.
“Unfortunately, ancient ecology is not so easily observed, even in excellent fossils,” Caterino said.
Fossils provide windows into the past, and with today’s high-tech visualization and DNA technologies, along with a form of X-ray imaging called micro computed tomography that can peek internally into tiny structures, scientists are able to obtain more detailed data from fossil specimens than ever before. Caterino is currently discussing the possibility of CT-scanning the unique specimen of Cretonthophilus to see if its internal anatomy is as well-preserved as its exterior structure.
“In determining evolutionary relationships by looking only at modern species, scientists are essentially guessing what the ancestors must have looked like,” Caterino said. “But in this case, we are able to see the ancestor. This gives us a lot of incentive to go into more fossil collections and search for more evidence of what creatures looked like — and even how they behaved — millions of years ago.”
Video
Reference:
MICHAEL S. CATERINO, KARIN WOLF-SCHWENNINGER, GÜNTER BECHLY. Cretonthophilus tuberculatus, a remarkable new genus and species of hister beetle (Coleoptera: Histeridae) from Cretaceous Burmese amber. Zootaxa, 2015; 4052 (2): 241 DOI: 10.11646/zootaxa.4052.2.10
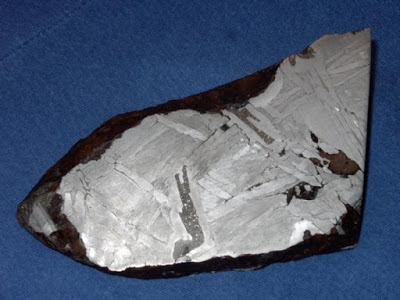
This is a fragment of the Seymchan meteorite from Russia. The majority of this 6 inch meteorite consists of iron-nickel metal, and the darker-colored structure in the center is schreibersite. Credit: University of South Florida
On the early Earth, light came not only from the sun but also from the incessant bombardment of fireball meteorites continually striking the planet. Now, the recent work of University of South Florida (USF) associate professor of geology Matthew Pasek, USF researcher Maheen Gull, and colleagues at Georgia Institute of Technology, has demonstrated that these meteorites may have carried within them an extraterrestrial mineral that, as it corroded in water on Earth, could have provided the essential chemical spark leading to the birth of biological life on the planet.
In previous work, Pasek and colleagues suggested that the ancient meteorites contained the iron-nickel phosphide mineral “schreibersite,” and that when schreibersite came into contact with Earth’s watery environment a phosphate, a salt, was released that scientists believe could have played a role in the development of “prebiotic” molecules.
In a recent study appearing in Nature Publishing Group’s Scientific Reports, the researchers focused on the properties of schreibersite and conducted experiments with the mineral to better understand how – in a chemical reaction with the corrosive effects of water called “phosphorylation” – schreibersite could have provided the phosphate important to the emergence of early biological life.
“Up to ten percent of the Earth’s crustal phosphate may have originated from schreibersite, so the mineral was abundant and readily available to engage in early chemical reactions,” said Pasek. “This ready and abundant source of reactive phosphorous may have been an important part of the prebiotic Earth and possibly the planet Mars,” said Pasek.
What needed to be determined, however, was just how schreibersite reacted chemically with the early Earth’s watery environment and what resulted from the chemical reaction.
To test their hypothesis, they built an early Earth model environment, an organic-rich aqueous solution in which schreibersite might react and corrode in a way similar to how events may have unfolded in prebiotic chemistry. The model they constructed provided an opportunity to observe the thermodynamics of phosphorylation reactions of a phosphorus-containing synthetic schreibersite, which they created to be structurally identical to its meteorite counterpart.
“A thorough exploration of the extent of phosphorylation of nucleosides (made of a base and a five carbon sugar) by schreibersite was necessary to evaluate its potential prebiotic importance,” explained Gull, a post-doctoral fellow and visiting researcher at USF. “All of our experiments indicated that a basic pH, rather than acidic pH, was required for the production of phosphorylated products. Although phosphorylation can take place using a variety of phosphate minerals in non-aqueous solution, prebiotic oxidation in water is more likely given the dominance of water across the solar system.”
The prebiotic reaction they duplicated in the laboratory may have been similar to the reactions that ultimately led to the emergence of metabolic molecules, such as adenosine triphosphate (ATP), which is called the ‘molecule of life’ because it is central to energy metabolism in all life.
Pasek and Gull also explained that even life today builds from activated nucleotides and that phosphates are still an important part of metabolic processes in biological life, so it is likely that a phosphorylated biomolecule played an important part in creating the prebiotic chemical context from which biological life emerged. Prior work on nucleoside phosphorylation has shown that inorganic phosphate can serve as both a catalyst and a reactant in nucleoside synthesis, they said.
“The reactions we observed in our experiments have shown that the necessary prebiotic molecules were likely present on the early Earth and that the Earth was predisposed to phosphorylated biomolecules,” the researchers concluded. “Our results suggest a potential role for meteoritic phosphorus in the development and origin of early life.”
The researchers also concluded that the mechanism of phosphorylation was still unknown and actively being investigated. “It is possible that the process occurs in solution or on the surface of the schreibersite,” they explained.
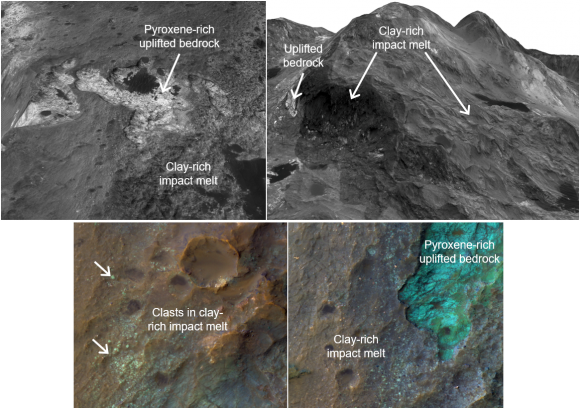
Clay minerals in Martian impact craters have often been assumed to have been formed the planet’s earliest epoch, then uncovered by the impact. New research finds numerous clay deposits that appear to have formed after an impact event, suggesting that clay formation on Mars was not confined to the planet’s most ancient period. Credit: NASA/JPL/University of Arizona/Brown University
Recent orbital and rover missions to Mars have turned up ample evidence of clays and other hydrated minerals formed when rocks are altered by the presence of water. Most of that alteration is thought to have happened during the earliest part of Martian history, more than 3.7 billion years ago. But a new study shows that later alteration — within the last 2 billion years or so — may be more common than many scientists had thought.
The research, by Brown University geologists Ralph Milliken and Vivian Sun, is in press in the Journal of Geophysical Research: Planets.
The lion’s share of the clay deposits found on Mars thus far have turned up in terrains that date back to the earliest Martian epoch, known as the Noachian period. Clays also tend to be found in and around large impact craters, where material from deep below the surface has been excavated. Scientists have generally assumed that the clays found at impact sites probably formed in the ancient Noachian, became buried over time, and then were brought back to the surface by the impact.
That assumption is particularly true of clay deposits found in crater central peaks. Central peaks are formed when, in the aftermath of an impact, rocks from within the crust rebound upward, bringing layers to the surface that had been buried many kilometers deep.
“Because central peaks contain rocks uplifted from depth, some previous studies have assumed the clays found within central peak regions are uplifted too,” said Milliken, assistant professor of Earth, environmental and planetary sciences. “What we wanted to do was look at lots of these craters in detail to see if that’s actually correct.”
Milliken and Sun performed a survey of 633 crater central peaks distributed across the Martian surface. They looked at detailed mineralogy data collected by NASA’s Compact Reconnaissance Imaging Spectrometer for Mars (CRISM), combined with high-resolution stereo images taken by NASA’s HiRISE camera. Both instruments fly aboard NASA’s Mars Reconnaissance Orbiter.
Of those 633 peaks, Milliken and Sun found 265 that have evidence of hydrated minerals, the majority of which were consistent with clays. The researchers then used HiRISE images to establish a detailed geologic context for each of those craters to help determine if the clays were in rocks that had indeed been excavated from depth. They found that in about 65 percent of cases the clay minerals were indeed associated with uplifted bedrock.
“That’s a majority,” Milliken said, “but it still leaves a substantial number of craters — 35 percent — where these minerals are present and not clearly associated with uplift.”
Within those 35 percent, Milliken and Sun found examples where clays exist in dunes, unconsolidated soil, or other formations not associated with bedrock. In other cases, clays were found in impact melt — deposits of rock that had been melted by the heat of the impact and then re-solidified as it cooled. Both of these scenarios suggest that the clay minerals at these sites are likely “authigenic,” meaning they formed in place sometime after impact occurred, rather than being excavated from underground.
In a number of cases, these authigenic clays were found in fairly young craters, ones formed in the last 2 billion years or so.
“What this tells us is that the formation of clays isn’t restricted to the most ancient time period on Mars,” Milliken said. “You do apparently have a lot of local environments in these crater settings where you can still form clays, and it may have occurred more often than many people had thought.”
One mechanism for forming these clays could be related to the impact process itself, the researchers say. Impacts generate heat, which could melt any ice or pre-existing hydrated minerals that may have been present within the nearby crust. Any liberated water could then percolate through surrounding rock to form clays. Some impact simulations suggest that these hydrothermal conditions could persist for perhaps thousands of years, making for potentially habitable conditions.
And that could have implications for the search for evidence of past life on Mars.
“So far, much of our surface exploration by rovers has focused on ancient terrains and whether or not the environments they record were habitable,” said Sun, lead author on the study and a graduate student working with Milliken. “But if we wanted to look at an environment that was more recent, we’ve identified craters that might be possible candidates.”
Reference:
Vivian Z. Sun, Ralph E. Milliken. Ancient and recent clay formation on Mars as revealed from a global survey of hydrous minerals in crater central peaks. DOI: 10.1002/2015JE004918
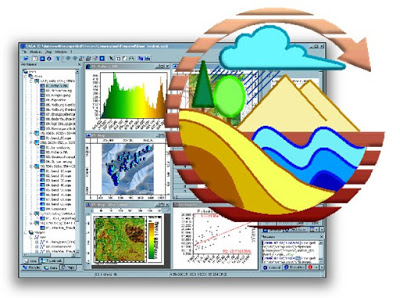
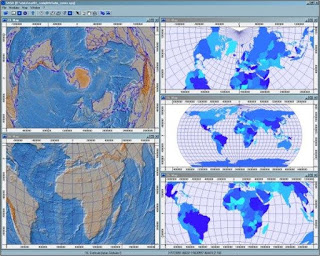
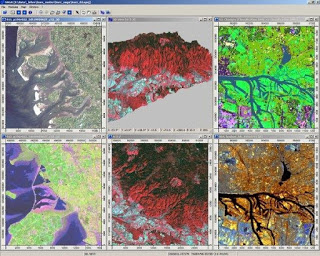
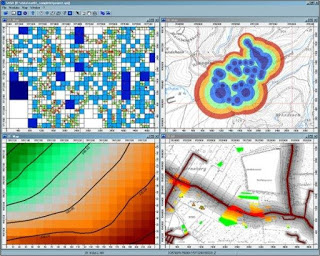
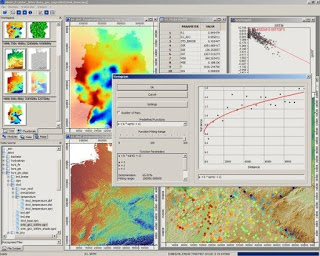
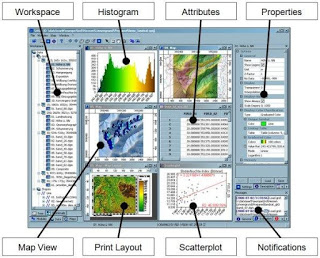
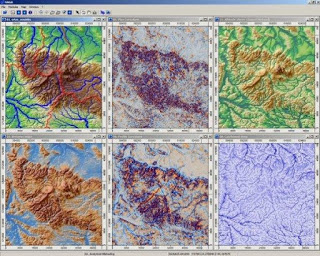
SAGA – System for Automated Geoscientific Analyses – is a Geographic Information System (GIS) software with immense capabilities for geodata processing and analysis. SAGA is programmed in the object oriented C++ language and supports the implementation of new functions with a very effective Application Programming Interface (API). Functions are organised as modules in framework independent Module Libraries and can be accessed via SAGA’s Graphical User Interface (GUI) or various scripting environments (shell scripts, Python, R, …).
What is SAGA ?
SAGA is the abbreviation for System for Automated Geoscientific Analyses
SAGA is a Geographic Information System (GIS) software
SAGA has been designed for an easy and effective implementation of spatial algorithms
SAGA offers a comprehensive, growing set of geoscientific methods
SAGA provides an easily approachable user interface with many visualisation options
SAGA runs under Windows and Linux operating systems
SAGA is a Free Open Source Software (FOSS)
Features
Object oriented system design (C++)
Modular structure allows framework independent function development
SAGA API with immense support for geodata handling
GUI for intuitive data management, analysis and visualization
Runs on Linux as well as on Windows operating systems
Portable software running without installation even from memory sticks (MSW)
Free and Open Source Software (FOSS)
Scripting via command line, Python, Java, R
Far more than 450 freely available functions for geodata analysis
Georeferencing and cartographic projections
Grid interpolation of scattered point data, triangulation, IDW, splines, …
Vector tools: clipping, buffer zones, raster to vector conversion, …
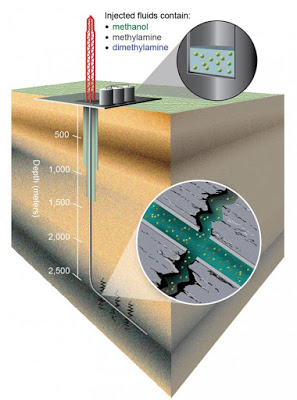
This is a cross-section of the hydraulic fracturing process. Credit: Image by Michael Wilkins, courtesy of The Ohio State University.
San Francisco–Some of the natural gas harvested by hydraulic fracturing operations may be of biological origin–made by microorganisms inadvertently injected into shale by oil and gas companies during the hydraulic fracturing process, a new study has found.
The study suggests that microorganisms including bacteria and archaea might one day be used to enhance methane production–perhaps by sustaining the energy a site can produce after fracturing ends.
The discovery is a result of the first detailed genomic analysis of bacteria and archaea living in deep fractured shales, and was made possible through a collaboration among universities and industry. The project is also yielding new techniques for tracing the movement of bacteria and methane within wells.
Researchers described the project’s early results on Monday, Dec. 14, at the American Geophysical Union meeting in San Francisco.
“A lot is happening underground during the hydraulic fracturing process that we’re just beginning to learn about,” said principal investigator Paula Mouser, assistant professor of civil, environmental and geodetic engineering at The Ohio State University.
“The interactions of microorganisms and chemicals introduced into the wells create a fascinating new ecosystem. Some of what we learn could make the wells more productive.”
Oil and gas companies inject fluid–mostly water drawn from surface reservoirs–underground to break up shale and release the oil and gas–mostly methane–that is trapped inside. Though they’ve long known about the microbes living inside fracturing wells–and even inject biocides to keep them from clogging the equipment–nobody has known for sure where the bacteria came from until now.
“Our results indicate that most of the organisms are coming from the input fluid,” said Kelly Wrighton, assistant professor of microbiology and biophysics at Ohio State. “So this means that we’re creating a whole new ecosystem a mile below the surface. Not only are we fracturing the rock, we’re giving these organisms a new place to live and food to eat. And in fact, the biocides that we add to inhibit their growth may actually be fueling the production of methane.”
That is, the biocides kill some types of bacteria, thus enabling other bacteria and archaea to prosper–species that somehow find a way to survive in water that is typically four times saltier than the ocean, and under pressures that are typically hundreds of times higher than on the surface of the earth. Deprived of light for photosynthesis, these hardy microorganisms adapt in part by eating chemicals found in the fracturing fluid and producing methane.
Next, the researchers want to pinpoint exactly how the bacteria enter the fracturing fluid. It’s likely that they normally live in the surface water that makes up the bulk of the fluid. But there’s at least one other possibility, Wrighton explained.
Oil and gas companies start the fracturing process by putting fresh water into giant blenders, where chemicals are added. The blenders are routinely swapped between sites, and sometimes companies re-use some of the well’s production fluid. So it’s possible that the bacteria live inside the equipment and propagate from well to well. In the next phase of the study, the team will sample site equipment to find out.
The clues emerged when the researchers began using genomic tools to construct a kind of metabolic blueprint for life living inside wells, Wrighton explained.
“We look at the fluid that comes out of the well,” she said. “We take all the genes and enzymes in that fluid and create a picture of what the whole microbial community is doing. We can see whether they survive, what they eat and how they interact with each other.”
The Ohio State researchers are working with partners at West Virginia University to test the fluids taken from a well operated by Northeast Natural Energy in West Virginia. For more than a year, they’ve regularly measured the genes, enzymes and chemical isotopes in used fracturing fluid drawn from the well.
Within around 80 days after injection, the researchers found, the organisms inside the well settle into a kind of food chain that Wrighton described this way: Some bacteria eat the fracturing fluid and produce new chemicals, which other bacteria eat. Those bacteria then produce other chemicals, and so on. The last metabolic step ends with certain species of archaea producing methane.
Tests also showed that initially small bacterial populations sometimes bloom into prominence underground. In one case, a particular species that made up only 4 percent of the microbial life going into the well emerged in the used fracturing fluid at levels of 60 percent.
“In terms of the resilience of life, it’s new insight for me into the capabilities of microorganisms.”
The researchers are working to describe the nature of pathways along which fluids migrate in shale, develop tracers to track fluid migration and biological processes, and identify habitable zones where life might thrive in the deep, hot terrestrial subsurface.
For example, Michael Wilkins, assistant professor of earth sciences and microbiology at Ohio State, leads a part of the project that grows bacteria under high pressure and high temperature conditions.
“Our aim is to understand how the microorganisms operate under such conditions, given that it’s likely they’ve been injected from surface sources, and are accustomed to living at much lower temperatures and normal atmospheric pressure. We’re also hoping to see how geochemical signatures of microbial activity, such as methane isotopes, change in these environments,” Wilkins said.
Other aspects of the project involve studying how liquid, gas and rock interact underground. In Ohio State’s Subsurface Materials Characterization and Analysis Laboratory, Director David Cole models the geochemical reactions taking place inside shale wells. The professor of earth sciences and Ohio Research Scholar is uncovering reaction rates for the migration of chemicals inside shale.
Using tools such as advanced electron microscopy, micro-X-ray computed tomography and neutron scattering, Cole’s group studies the pores that form inside shale. The pores range in size from the diameter of a human hair to many times smaller, and early results suggest that connections between these pores may enable microorganisms to access food and room to grow.
Yet another part of the project involves developing new ways to track the methane produced by the bacteria, as well as the methane released from shale fracturing. Thomas Darrah, assistant professor of earth sciences, is developing computer models that trace the pathways fluids follow within the shale and within fracturing equipment.
Though oil and gas companies may not be able to take full advantage of this newly discovered methane source for some time, Wrighton pointed out that there are already examples of bio-assisted methane production in industry, particularly in coal bed methane operations.
“Hydraulic fracturing is a young industry,” she said. “It may take decades, but it’s possible that biogenesis will play a role in its future.
Other researchers on the project hail from Pacific Northwest National Laboratory and the University of Maine.
One of the big mysteries in the history of the Earth is the development of plate tectonics. When exactly did these processes begin? Scientific opinion varies widely.
The dominant view is that oceanic plates have been pushing under other plates and sinking into the Earth’s mantle—a process known as subduction—since the beginning of the Hadean eon, more than four billion years ago. Others date the onset of plate tectonic movements to the Neoproterozoic era of 500 to 1,000 million years ago. This hypothesis is based on the fact that the mineral blueschist began to appear 700 to 800 million years ago. Geoscientists at Johannes Gutenberg University Mainz (JGU) in Germany have now shown that the appearance of blueschist is connected to long-term changes in the composition of the oceanic crust and therefore does not date plate tectonics. The study has been published in the eminent journal Nature Geoscience.
Blueschist is a blue-violet-colored rock that is relatively rare and is found in the Alps, in Japan, on the west coast of the USA and other places. The oldest blueschist found originated in the Neoproterozoic era and is 700 to 800 million years old. This metavolcanic rock is created during the subduction of oceanic crust. High pressure and relatively low temperatures of 200 to 500 degrees Celsius are required for its formation. As such conditions have only prevailed in subduction zones in the recent past, blueschist provides evidence of when subduction-driven plate tectonics occurred. The reason why there was no blueschist present on Earth during its first 3.8 billion years is a hotly contested topic among geologists.
“We know that the formation of blueschist is definitely linked to subduction,” explained Professor Richard White of the Institute of Geosciences at Mainz University. “The fact that the oldest blueschist is only 700 to 800 million years old does not mean, however, that there were no subduction processes before then, as is sometimes claimed,” added Dr. Richard Palin. In their study, the two researchers have now managed to demonstrate for the first time that the absence of blueschist in the earliest geological periods is due to a change in the chemical composition of the ocean’s crust in the course of the Earth’s history, which in turn is a result of the gradual cooling of the Earth’s mantle since the Archean eon.
The oceanic crust that formed on the early, hot Earth was rich in magnesium oxide. Using computer models, Palin and White have been able to show that it was not possible for blueschist to form from this magnesium oxide-rich rock during subduction. Instead, the subduction of the magnesium oxide-rich oceanic crust led to the formation of rock similar to greenschist, which is a metamorphic rock that is formed today at low temperatures and low pressure. Since these greenschist rocks can hold more water than most blueschist, more fluid was able to enter the early Earth’s mantle than today, a factor that has an effect on the formation of magmas, which is one of the topics being studied by the Volcanoes and Atmosphere in Magmatic Open Systems (VAMOS) research unit at Johannes Gutenberg University Mainz.
Reference:
Richard M. Palin et al. Emergence of blueschists on Earth linked to secular changes in oceanic crust composition, Nature Geoscience (2015). DOI: 10.1038/NGEO2605
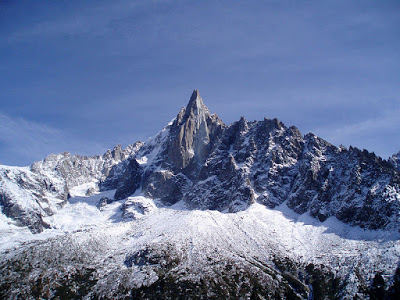
Aiguille du Dru in the French Alps Credit: Mt.Blanc/Wikipedi
The growth of mountain ranges on New Zealand’s South Island directly influenced the evolution of different freshwater fish species in the region, according to new University of Otago-led research.
The findings are published online this week in Nature Geoscience.
The study provides an example of how natural changes in the Earth’s landscape and topography can help shape and increase local biodiversity.
Mountain ranges form when tectonic plates collide, and the uplift of a new range can separate biological populations and eventually lead to the creation of new species. However, clear examples of the links between the changing topographic landscape and biodiversity are rare.
Department of Geology Professor Dave Craw and colleagues at Otago, GNS Science and the University of Tasmania used a numerical model to reconstruct the topographic evolution of the South Island over the past 25 million years.
The researchers show that the island’s landscape developed in six main tectonic zones, each with distinct river drainage catchments.
The team then used new and existing analyses of the evolutionary tree of freshwater fish populations from these drainage catchments, based on over 1,000 specimens from more than 400 localities, to show that the fish DNA sequences diverge over time, in tandem with the growth of the mountains.
Professor Craw says the South Island is a great place to study how geology can shape biology–as both the landscape and its native species show such rapid rates of change.
“By modelling the mountain-building processes, we can really start to understand how the changing landscape has shaped biological processes. New Zealand’s geographic isolation and dynamic geology make it the perfect place for understanding evolution,” he says.
Co-author Professor Jon Waters of the Department of Zoology says he and Professor Craw have been working together on geology and genetics for about 15 years. “We come from different perspectives, but are finding a lot of common ground,” he says.
“This study takes a pretty broad view, looking at the evolution of several different groups of freshwater fish across South Island. One particularly interesting thing about the study, from a biological point of view, is that we find such similar evolutionary patterns in unrelated groups of fish species, which really highlights the important role of geology,” Professor Waters says.
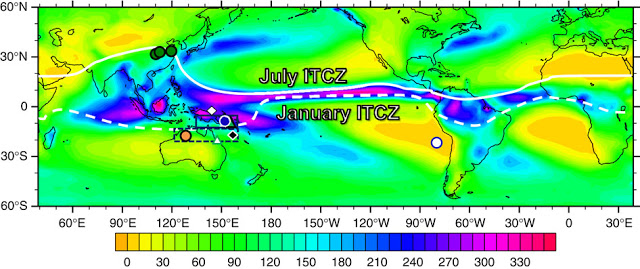
LSU paleoclimatologist Kristine DeLong contributed to an international research breakthrough that sheds new light on how the tilt of the Earth affects the world’s heaviest rainbelt. DeLong analyzed data from the past 282,000 years that shows, for the first time, a connection between the Earth’s tilt called obliquity that shifts every 41,000 years, and the movement of a low pressure band of clouds that is the Earth’s largest source of heat and moisture — the Intertropical Convergence Zone, or ITCZ.”I took the data and put it through a mathematical prism so I could look at the patterns and that’s where we see the obliquity cycle, that 41,000-year cycle. From that, we can go in and look at how it compares to other records,” said DeLong, who is an associate professor in the LSU Department Geography & Anthropology.
With research collaborators at the University of Science and Technology of China and National Taiwan University, DeLong looked at sediment cores from off the coast of Papua New Guinea and stalagtite samples from ancient caves in China. DeLong’s data analysis revealed obliquity in both the paleontological record and computer model data. This research was published in Nature Communications on Nov. 25.
The standard assumptions about how the variations in the Earth’s orbit influences changes in climate are called Milankovitch cycles. According to these principles, the Earth’s tilt influenced ice sheet formation during the Ice Ages, the slow wobble that occurs on a 23,000-year cycle as the Earth rotates around the sun called precession affects the Tropics and the shape of the Earth’s orbit that occurs on a 100,000-year cycle controls how much energy the Earth receives.
“This study was interesting in that when we started doing the spectral analysis, the 41,000-year tilt cycle started showing up in the Tropics. That’s not supposed to be there. That’s not what the textbooks tell us,” DeLong said.
This finding shows that the tilt of the Earth plays a much larger part in ITCZ migration than previously thought, which will enable climate scientists to better predict extreme weather events. Historically, the collapse of the Mayan civilization and several Chinese dynasties have been linked to persistent droughts associated with the ITCZ. This new information is critical to understanding global climate and sustainable human socioeconomic development, the researchers said.
Additionally, climate scientists have begun to recognize that rather than shifting north and south, the ITCZ expands and contracts, based on this information.
Reference:
“Obliquity pacing of the western Pacific Intertropical Convergence Zone over the past 282,000 years,” Nature Communications. DOI:10.1038/ncomms10018
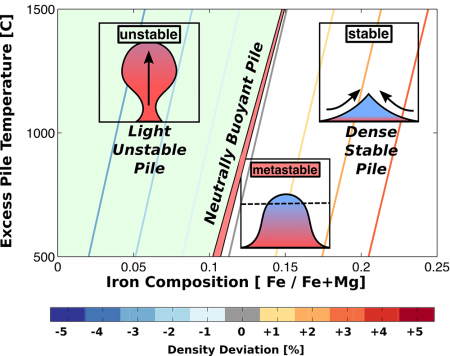
This schematic shows different scenarios of bridgmanite provinces that Jennifer Jackson and colleagues explored in their research. Their results found that the scenario at right aligns most closely with geophysical constraints of the lower mantle. Credit: Aaron Wolf and Jennifer Jackson, Caltec
Deep inside the earth, seismic observations reveal that three distinct structures make up the boundary between the earth’s metallic core and overlying silicate mantle at a depth of about 2,900 kilometers—an area whose composition is key to understanding the evolution and dynamics of our planet. These structures include remnants of subducted plates that originated near the earth’s surface, ultralow-velocity zones believed to be enriched in iron, and large dense provinces of unknown composition and mineralogy. A team led by Caltech’s Jennifer Jackson, professor of mineral physics has new evidence for the origin of these features that occur at the core-mantle boundary.
“We have discovered that bridgmanite, the most abundant mineral on our planet, is a reasonable candidate for the material that makes up these dense provinces that occupy about 20 percent of the core-mantle boundary surface, and rise up to a depth of about 1,500 kilometers. Integrated by volume that’s about the size of our moon!” says Jackson, coauthor of a study that outlines these findings and appears online in the Journal of Geophysical Research: Solid Earth. “This finding represents a breakthrough because although bridgmanite is the earth’s most abundant mineral, we only recently have had the ability to precisely measure samples of it in an environment similar to what we think the materials are experiencing inside the earth.”
Previously, says Jackson, it was not clear whether bridgmanite, a perovskite structured form of (Mg,Fe)SiO3, could explain seismic observations and geodynamic modeling efforts of these large dense provinces. She and her team show that indeed they do, but these structures need to be propped up by external forces, such as the pinching action provided by cold and dense subducted slabs at the base of the mantle.
Jackson, along with then Caltech graduate student Aaron Wolf (PhD ’13), now a research scientist at the University of Michigan at Ann Arbor, and researchers from Argonne National Laboratory, came to these conclusions by taking precise X-ray measurements of synthetic bridgmanite samples compressed by diamond anvil cells to over 1 million times the earth’s atmospheric pressure and heated to thousands of degrees Celsius.
The measurements were done utilizing two different beamlines at the Advanced Photon Source of Argonne National Laboratory in Illinois, where the team used powerful X-rays to measure the state of bridgmanite under the physical conditions of the earth’s lower mantle to learn more about its stiffness and density under such conditions. The density controls the buoyancy—whether or not these bridgmanite provinces will lie flat on the core-mantle boundary or rise up. This information allowed the researchers to compare the results to seismic observations of the core-mantle boundary region.
“With these new measurements of bridgmanite at deep-mantle conditions, we show that these provinces are very likely to be dense and iron-rich, helping them to remain stable over geologic time,” says Wolf.
Using a technique known as synchrotron Mössbauer spectroscopy, the team also measured the behavior of iron in the crystal structure of bridgmanite, and found that iron-bearing bridgmanite remained stable at extreme temperatures (more than 2,000 degrees Celsius) and pressure (up to 130 gigapascals). There had been some reports that iron-bearing bridgmanite breaks down under extreme conditions, but the team found no evidence for any breakdown or reactions.
“This is the first study to combine high-accuracy density and stiffness measurements with Mössbauer spectroscopy, allowing us to pinpoint iron’s behavior within bridgmanite,” says Wolf. “Our results also show that these provinces cannot possibly contain a large complement of radiogenic elements, placing strong constraints on their origin. If present, these radiogenic elements would have rapidly heated and destabilized the piles, contradicting many previous simulations that indicate that they are likely hundreds of millions of years old.”
In addition, the experiments suggest that the rest of the lower mantle is not 100 percent bridgmanite as had been previously suggested. “We’ve shown that other phases, or minerals, must be present in the mantle to satisfy average geophysical observations,” says Jackson. “Until we made these measurements, the thermal properties were not known with enough precision and accuracy to uniquely constrain the mineralogy.”
“There is still a lot of work to be done, such as identifying the dynamics of subducting slabs, which we believe plays a role in providing an external force to shape these large bridgmanite provinces,” she says. “We know that the earth did not start out this way. The provinces had to evolve within the global system, and we think these findings may help large-scale geodynamic modeling that involves tectonic plate reconstructions.”
The results of the study were published in a paper titled “The thermal equation of state of (Mg,Fe)SiO3bridgmanite (perovskite) and implications for lower mantle structures.” In addition to Jackson and Wolf, other authors on the study are Przemeslaw Dera and Vitali B. Prakapenka from the Center for Advanced Radiation Sources at Argonne National Laboratory. Support for this research was provided by the National Science Foundation, the Turner Postdoctoral Fellowship at the University of Michigan, and the California Institute of Technology.
Reference:
Aaron S. Wolf et al. The Thermal Equation of State of (Mg, Fe)SiO3 Bridgmanite (Perovskite) and Implications for Lower Mantle Structures , Journal of Geophysical Research: Solid Earth (2015). DOI: 10.1002/2015JB012108
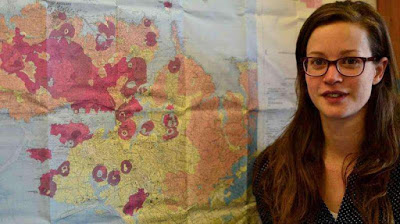
Jenni Hopkins with a map showing Auckland’s volcanic field.
Rangitoto, Mt Albert, Lake Pupuke, Orakei Basin, Mt Eden and One Tree Hill are some of Auckland’s most familiar landmarks. But they are also reminders of the city’s fiery history and the looming threat of future disasters.
A clearer understanding of the risk posed by a new volcanic eruption in Auckland has emerged from doctoral research undertaken by a student at Victoria University of Wellington.
Jenni Hopkins, in collaboration with GNS Science and the University of Auckland, has reconstructed the eruptive history of Auckland’s volcanic field, which comprises more than 50 craters dating back around 200,000 years. While currently dormant, the field is expected to erupt again from a new site within potentially as little as a few hundred years.
“The 53 volcanoes in Auckland are almost entirely monogenetic, which means they generally only erupt once,” says Jenni. “But what was previously unknown was the order in which they erupted—I wanted to find that out so that we could establish the characteristics of the field and get an idea of what a future eruption might be like.”
To reconstruct the eruptive history, Jenni examined the ash deposits taken from a number of lake sediment cores to see the thickness of the layers and the order in which they’d been deposited. She also helped develop ground-breaking new geochemical techniques which have allowed, for the first time, the ash deposits to be accurately linked to their source volcanoes.
Using core samples that were drilled by GNS Science and The Auckland Council’s research programme DEVORA (DEtermining VOlcanic Risk in Auckland), Jenni analysed the elemental make-up of ash deposits with an electron microprobe and laser ablation techniques. Each layer was shown to have a unique geochemical ‘fingerprint’ of trace elements which could then be matched to lava from the source volcanoes.
“Being able to pinpoint the volcano from which each layer of ash was derived means we can see how far ash was dispersed in each eruption. We can use this geological evidence to make estimates about the areas that will be affected by eruptions in the future.”
Her research has been funded by the Earthquake Commission (EQC) and Auckland Council through DEVORA, and GNS Science. “The whole point of my work is to provide an improved understanding of the threat posed by Auckland’s volcanoes to both people and critical infrastructure. It’s designed to assist in the development of better management practices for evacuations, and to help local authorities work out how best to mitigate the damage to assets like roads, power lines and buildings.”
Jenni is currently working for GNS Science and will conduct further research on Auckland’s volcanic field. She then would like to apply the skills developed during her PhD research to the ancient super-eruption of Taupo by examining its far-flung ash deposits to unravel some if its long-held secrets.
“I’ve been so lucky to study at Victoria,” says Jenni. “The geochemistry facilities here are excellent—I had everything I needed to do all my work right on campus, which is amazing.”
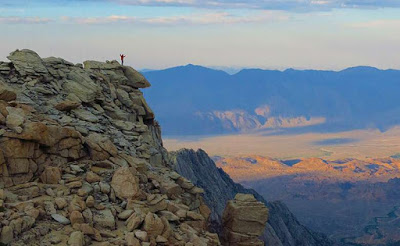
Stanford Earth alum Hari Mix stands high in the Sierra Nevada. New evidence shows the California mountain range is 40 million years old, much older than previously thought. Credit: Hari Mix
In science, the simplest questions often prove themselves the most difficult to answer. Questions such as what killed the dinosaurs, or how many fish are there in the oceans took decades to solve or remain unanswered.
One of the biggest questions in the geological history of the western United States is: How old is California’s Sierra Nevada? Recent work by a team including Stanford scientists goes a long way to providing an answer, as well as a view into climate history that could assist future climate change projects.
The research, available online at GSA Bulletin, used advanced geochemical techniques to investigate three key aspects of the Sierra Nevada history: age, elevation and climate.
“Understanding surface elevation is extraordinarily important because it is the physical representation of the balance between deep-Earth processes, such as mantle convection and plate tectonics, and surface processes, such as erosion, the water cycle and climate,” said Hari Mix, who began the research as a graduate student at Stanford School of Earth, Energy & Environmental Sciences.
“The age of the Sierras is a fundamental question in geology,” said Page Chamberlain, a professor of Earth system science at Stanford and co-author on the study. “It’s one of the largest mountain belts in the world, and it influences all western climate, so understanding the elevation history couples to all these different fields of research.”
Older than previously thought
The debate surrounding the age of the Sierra Nevada goes back decades. For much of that time, scientists believed that the mountains were relatively young, experiencing the majority of their uplift as recently as 3 million to 5 million years ago. A number of recent studies have called that age into question, however, specifically an influential study by Stanford researchers published in 2006 in Science that suggested that the Sierra Nevada reached their current elevation roughly 40 million years ago.
The team, including Page, fellow Stanford Professor Stephan Graham and postdoctoral student Andreas Mulch, analyzed different forms of hydrogen trapped in clay minerals that were exhumed and mined during the California Gold Rush. That work involved a technique called hydrogen isotope paleoaltimetry, which quantifies the types of hydrogen atoms in a rock sample to interpret its age and elevation. Since that 2006 report, some scientists have suggested that some of the hydrogen isotopes had exchanged with modern water, obscuring the true age of the range’s uplift.
To confirm the previous work, and to expand on its results, Mix and his colleagues used the same samples as those used by Mulch, but analyzed oxygen instead of hydrogen.
“Oxygen isotopes are more resistant to exchange and alteration than hydrogen isotopes, so our record of the Sierra Nevada uplift is more robust than previous studies,” said Mix, who is now an assistant professor at Santa Clara University.
“The preponderance of evidence that the Northern Sierras were high since 40 million years ago is just crushingly definitive,” said Chamberlain.
Mountain evolution through rainfall
To accurately determine the age of the Sierra Nevada, the team needed to understand how high the mountains stood 40 million years ago. Previous attempts to directly measure historical surface elevation have provided only aspects of the range’s history, but the Stanford team’s approach made it possible.
By analyzing the oxygen fingerprint within the clay minerals, Mix and his colleagues were able to uncover long-term historical rainfall patterns and determine if they matched those expected from high mountain ranges. They found that the signal was consistent with the high Sierra tens of millions of years ago, indicating that the range was already uplifted at this time.
By coupling the Sierra’s elevation history with knowledge of the climate system and deep-Earth processes, this team’s work can help scientists determine which processes might have been most important in shaping the world into what we see today.
Implications for today
According to Mix’s study, the Sierra Nevada formed roughly 40 million years ago, a time geologists refer to as the Eocene. The Eocene was the most recent time in Earth’s history when carbon dioxide levels were higher than they are today, and many scientists view this as the worst-case scenario analog for today’s anthropogenic climate change.
By combining the hydrogen isotope record with the oxygen isotope record, Mix and his colleagues were able to effectively create a thermometer, and their findings suggest that the Sierra formed under very different climate conditions than today.
“The temperatures that we determined by combining the hydrogen and oxygen records are 18 to 27 degrees Fahrenheit [10-15 C] hotter than the modern Northern Sierra,” Mix said.
The high temperatures inferred from the hydrogen and oxygen fingerprints are consistent with other estimates of Eocene climate based on analysis of leaf fossils, other minerals, and climate models. This new analysis has the added benefit of aiding climate scientists who investigate today’s planet. Scientists test their models against ancient climates, for which a lot of data are available.
“Climate modelers use the elevation and temperature reconstructions like those we investigated as boundary conditions for their models,” Mix said. “Hopefully, these new and improved constraints will help modelers test the many ways in which different components of the Earth system interact with one another, and give us better information about today’s planet as well.”
Reference:
Hari T. Mix et al. A hot and high Eocene Sierra Nevada, Geological Society of America Bulletin (2015). DOI: 10.1130/B31294.1
Santiaguito volcano, seen from the summit of Santamaria. Credit: Worldtraveller/Wikipedia
Pioneering new research has shed new light on the causes behind an ‘ice-age’ that took place on Earth around 170 million years ago.
An international team of experts, including researchers from the Camborne School of Mines, have found evidence of a large and abrupt cooling of the Earth’s temperature during the Jurassic Period, which lasted millions of years.
The scientists found that the cooling coincided with a large-scale volcanic event – called the North Sea Dome – which restricted the flow of ocean water and the associated heat that it carried from the equator towards the North Pole region.
The team suggest that it is this volcanic event, preventing the ocean flow, rather than a change in CO2 in the atmosphere (which causes today’s climate change), that led to an extended Ice age in a period more synonymous with very warm conditions.
The research appears in respected scientific journal, Nature Communications, on Friday, December 11 2015.
Geology experts Professor Stephen Hesselbo and Dr Clemens Ullmann, both from the Camborne School of Mines, based at Exeter’s Penryn Campus in Cornwall, took part in the study.
Professor Hesselbo said: “We tend to think of the Jurassic as a warm ‘greenhouse’ world where high temperatures were governed by high atmospheric carbon dioxide contents. This new study suggests that re-organization of oceanic current patterns may also have triggered large scale climate changes.”
Rather than the seven continents that cover Earth’s surface today, during the Jurassic Period there was one single ‘supercontinent’, called Pangaea. This supercontinent had a broad seaway across it that connected a north polar sea to a warm equatorial ocean, called Tethys.
The team of scientists spent 10 years constructing a record of seawater temperature change using fossil mollusc shells. They found that during the same period that the North Sea Dome event occurred, the Earth experienced a significant and fast cooling in temperature.
The team have hypothesized that this volcanic event restricted the poleward flow of ocean water and associated heat, flipping the northern hemisphere from a very warm climate to a cold climate state. The evidence indicates that this cold period lasted many millions of years, until the North Sea Dome subsided.
Professor Hesselbo added: “Although we have known about the occurrence of cold periods during greenhouse times for a while, their origins have remained mysterious. This work suggests a mechanism at play that may also have been important for driving other climate change events in the Jurassic and at other times in Earth history.”
Reference:
Christoph Korte et al. Jurassic climate mode governed by ocean gateway, Nature Communications (2015). DOI: 10.1038/ncomms10015