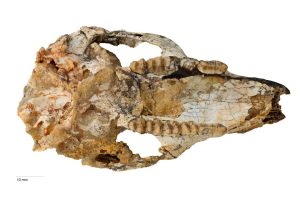
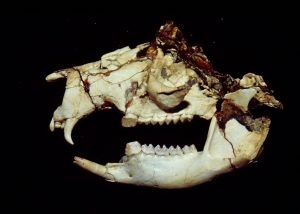
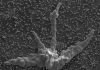
Fossil skull of the ancient kangaroo, Cookeroo hortusensis. Credit: Kaylene Butler
A University of Queensland (UQ)-led study has discovered a new genus and two new species of extinct kangaroos which couldn’t hop, but may have been ancestral to all kangaroos and wallabies living today.
Lead author Kaylene Butler of UQ’s School of Earth Sciences said the new kangaroo species were discovered in ancient fossil deposits at the Riversleigh World Heritage Area in north-western Queensland, Australia.
“They lived around 15-23 million years ago and were the size of very small wallabies or pademelons,” she said.
“They moved on all fours, scurrying across a densely forested landscape quite different from the dry outback we see in western Queensland today.
“It also appears that our new species were direct competitors with a second group of kangaroos at Riversleigh, the even weirder ‘balbarid’ or fanged kangaroos.
“It seems likely that the fanged cousins were out-competed by our new species and their descendants.”
The new species may have been better adapted than their fanged cousins to the environmental change from rainforest to more open forest and woodland environments. They are described in the Journal of Vertebrate Paleontology.
Ms Butler worked on fossil material as part of her PhD research supervised by study co-authors former UQ Robert Day Fellow, Dr Kenny Travouillon, now of Western Australian Museum, and Dr Gilbert Price of UQ.
Riversleigh research leaders Professors Michael Archer and Suzanne Hand, of the University of New South Wales, are also study authors.
She said that by taking measurements and comparing skulls and teeth with known species, it was discovered that they were looking at both a new genus (taxonomic rank) and two new species within the genus.
She said the new genus was named Cookeroo, in honour of Dr Bernard Cooke, a distinguished Queensland Museum researcher who led much of the research program focused on the evolution of Riversleigh’s ancient kangaroos.
The two new species within the genus are Cookeroo bulwidarri, which lived about 23 million years ago, and Cookeroo hortusensis which lived 20 million to 18 million years ago.
Bulwidarri means “white” in the Aboriginal Waanyi language, and is named for White Hunter Site at the Riversleigh World Heritage Area where specimens of this species were obtained. Hortusensis is Latin for “belonging to the garden,” in reference to Neville’s Garden Site at Riversleigh where specimens of this species were found.
Reference:
Kaylene Butler, Kenny J. Travouillon, Gilbert J. Price, Michael Archer, Suzanne J. Hand. Cookeroo, a new genus of fossil kangaroo (Marsupialia, Macropodidae) from the Oligo-Miocene of Riversleigh, northwestern Queensland, Australia. Journal of Vertebrate Paleontology, 2016; e1083029 DOI: 10.1080/02724634.2016.1083029
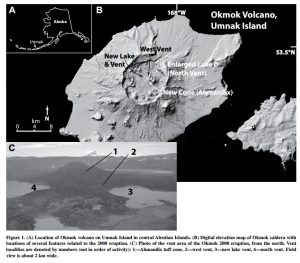
From Unema et al., including the location of Okmok volcano on Umnak Island in central Aleutian Islands.
When water interacts with magma, it can dramatically increase the explosivity of the eruption. However, water in the eruption cloud can also increase the rate at which the particles aggregate into larger clumps, allowing them to settle out faster.
The five-week-long 2008 Okmok eruption in the Aleutian Islands of Alaska was explosive due to the interaction of the magma with the abundant water inside the caldera, producing billowing clouds that deposited most of the tephra as fine-grained ash within 10 km of the vent area. The first four hours of the eruption produced coarse tephra that extended well offshore of Umnak Island, but the remainder deposited ash as ash pellets and as muddy rain and mist. This plume scrubbing likely reduced any aviation hazards.
This paper by Joel A. Unema and colleagues describes the stratigraphy, distribution, and grain size, shape, and composition characteristics of the medial to distal deposits of the 2008 Okmok eruption.
These are used to interpret water-magma interactions in the conduit and eruption column, eruption parameters (e.g., volume, column height, mass flux), and fragmentation style. Unema and colleagues then compare the Okmok eruption with the Eyjafjallajökull eruption of 2010.
Reference:
Water-magma interaction and plume processes in the 2008 Okmok eruption, Alaska
J.A. Unema et al., SESES, Box 4099, Northern Arizona University, Flagstaff, Arizona 86011, USA. DOI: 10.1130/B31360.1 Note: The above post is reprinted from materials provided by The Geological Society of America.
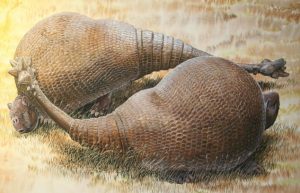
This is an illustrated rendition of two glyptodonts. Credit: Peter Schouten
If you could travel back in time to South America thousands of years ago, you might have caught a glimpse of an animal known as a glyptodont living alongside giant ground sloths and saber-toothed cats. Glyptodonts looked like gigantic and fearsome armadillos; one of the largest species, Doedicurus, weighed as much as a ton and had a powerful club-shaped and spiky tail.
There’s a good reason for the resemblance to armadillos, according to researchers who have reconstructed the family tree of these ancient beasts based on their mitochondrial genome, reconstructed from small fragments of DNA extracted from bits of a protective, bony carapace. The molecular evidence reported in the Cell Press journal Current Biology on February 22 confirms that gigantic armadillos are exactly what glyptodonts were.
“Glyptodonts in fact represent an extinct lineage that likely originated about 35 million years ago within the armadillo radiation,” says Hendrik Poinar of McMaster University in Canada.
“Glyptodonts should probably be considered a subfamily of gigantic armadillos,” adds Frédéric Delsuc of CNRS in France. “We speculate that the peculiar structure of their unarticulated carapace might have evolved as a response to the functional constraint imposed by the size increase they experienced over time.”
Poinar and Delsuc have had a long interest in living and extinct xenarthrans (a group including armadillos, anteaters, and sloths) and in their evolutionary relationships to each other. Recent advances in DNA capture and genome sequencing technology are now making it possible to fish DNA fragments out of fossil remains to help put those evolutionary family trees together.
In the new study, the researchers used a technical trick allowing them to specifically fish Doedicurus mitochondrial DNA out of an extract containing plenty of DNA from other sources. They used RNA baits designed from computationally reconstructed ancestral DNA sequences based on known modern sequences of glyptodonts’ living relatives.
Their phylogenetic analysis establishes that glyptodonts are in fact deeply nested within the armadillo crown group, representing a distinct subfamily (Glyptodontinae) within the family known as the Chlamyphoridae, represented today by the dwarf pink fairy armadillo and the giant armadillo, for instance. Molecular dating suggests that glyptodonts diverged no earlier than about 35 million years ago, the researchers report, in good agreement with their known fossil record.
Their findings also highlight the impressive increase in glyptodonts’ size over evolutionary time. The researchers estimate that the last common ancestor of glyptodonts and their living armadillo relatives weighed in at a mere 6 kilograms, suggesting a “spectacular increase in glyptodont body mass.” That’s consistent with the fossil record, which shows glyptodonts evolved from medium-sized forms (about 80 kilograms) to become true megafauna in the Pleistocene (reaching 2,000 kilograms) before their disappearance at the end of the last ice age.
Poinar and Delsuc say they’ll continue to explore ancient DNA lifted from numerous other fossil xenarthrans, including giant ground sloths.
Reference:
Frédéric Delsuc, Gillian C. Gibb, Melanie Kuch, Guillaume Billet, Lionel Hautier, John Southon, Jean-Marie Rouillard, Juan Carlos Fernicola, Sergio F. Vizcaíno, Ross D.E. MacPhee, Hendrik N. Poinar. The phylogenetic affinities of the extinct glyptodonts. Current Biology, 2016; 26 (4): R155 DOI: 10.1016/j.cub.2016.01.039
Note: The above post is reprinted from materials provided by Cell Press.
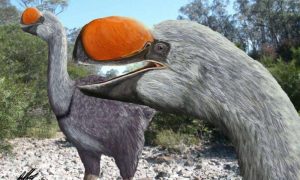
A reconstruction of what ‘Dromornis murrayi’ would have looked like. Credit: Brian Choo
A newly discovered distant relative of the duck has just been hailed as an ancestor of the biggest bird the world has ever known by a group of Australian palaeontologists.
They say Dromornis murrayi, which at 250kg was originally the ‘baby’ of the ancient ‘Mihirung’ family of Dromornis giant birds, eventually evolved into the world’s biggest bird, D. stirtoni, before going extinct.
“It lived in the late Oligocene – early Miocene, and was the first member of the lineage of Dromornis species,” says Dr Trevor Worthy, from Flinders University in South Australia, who led the study.
“Originally, it was the smallest, at a pretty hefty 250 kg, but by eight million years ago it had evolved into D. stirtoni, which averaged a whopping 450 kg – with some individuals reaching 650 kg – the largest birds the world has known.”
Dr Worthy’s team of palaeontologists, from Finders University and University of New South Wales, revealed the news in a study just published in the Journal of Vertebrate Paleontology.
“Mihirungs were giant flightless birds only found in Australia and are known only from fossils,” said Dr Worthy. “The largest stood two metres high at its back and reached well over three metres at the head.
“They survived until the Pleistocene period when Genyornis newtoni, the last species, died out, probably about 50,000 years ago.”
Seven species in four genera of the bird are generally recognised, with the last five named in 1979 by Patricia Vickers Rich, now a Professor at Monash University.
Now, some 37 years later, the naming of the new, and largest, species, Dromornis murrayi, after Peter Murray, former Northern Territory Museum curator and co-author of the book Magnificent Mihirungs, brings the total number of mihirungs known to eight.
“This is one monstrous chook that would have had no trouble kicking anyone’s dunny door down,” said Professor Mike Archer from the University of New South Wales, whose expeditions over many years revealed the new mihirung.
“The very large and distinctive bones of this new ‘Big Bird’ are quite common in the Riversleigh fossil deposits, and are easily spotted by scientists and visitors to the site,” said Professor Suzanne Hand, also from University of New South Wales.
The authors of the study drew their conclusions after examining skull bones, a sternum or breastbone, and bones from the leg and foot.
“We even had some tiny bones of the wing, which showed this gigantic bird had already, by 26 million years ago, essentially lost its wings,” said Dr Worthy.
To assess further how the various mihirungs differed, the team of palaeontologists also looked in detail at their skulls.
“These birds take the prize for those with the weirdest skull. It is like they had run into a brick wall and compressed everything from front to back, so that the bill joined on half way through the eye,” he said.
The skull of the Balbaroo fangaroo also found at Riversleigh World Heritage Area.
Researchers believe the discovery of a new genus and two new species of extinct non-hopping kangaroos could shed light on the ancestry of all kangaroos and wallabies living today.
University of Queensland researcher Kaylene Butler, of the School of Earth Sciences, said the new kangaroo species were discovered in ancient fossil deposits at the Riversleigh World Heritage Area in north-western Queensland.
“They lived around 15 to 23 million years ago and were the size of very small wallabies or pademelons,” she said.
“They moved on all fours, scurrying across a densely forested landscape quite different from the dry outback we see in western Queensland today.
“It appears that our new species were direct competitors with a second group of kangaroos at Riversleigh, the even weirder balbarid or fanged kangaroos.
“It seems likely that the fanged cousins were out-competed by our new species and their descendants.”
The newly discovered species may have been better adapted to the environmental change from rainforest to more open forest and woodland.
Ms Butler said the new genus (taxonomic rank), and two new species within the genus were identified when skulls and teeth were compared with those of known species.
The new genus is named Cookeroo, in honour of Queensland Museum researcher Dr Bernard Cooke, who led much of the research program focused on the evolution of Riversleigh’s ancient kangaroos.
The two new species within the genus are Cookeroo bulwidarri, which lived about 23 million years ago, and Cookeroo hortusensis, which lived 18 to 20 million years ago.
Bulwidarri means “white” in the Aboriginal Waanyi language, and is named for the Riversleigh White Hunter Site where specimens were found.
Hortusensis is Latin for “belonging to the garden”, in reference to Neville’s Garden Site at Riversleigh.
Ms Butler worked on fossil material as part of her PhD research supervised by former UQ Robert Day Fellow Dr Kenny Travouillon, now of the Western Australian Museum, and UQ’s Dr Gilbert Price.
Riversleigh research leaders Professors Michael Archer and Suzanne Hand, of the University of New South Wales, contributed to the work.
The research is published in the Journal of Vertebrate Paleontology.
Reference:
Kaylene Butler et al. , a new genus of fossil kangaroo (Marsupialia, Macropodidae) from the Oligo-Miocene of Riversleigh, northwestern Queensland, Australia , Journal of Vertebrate Paleontology (2016). DOI: 10.1080/02724634.2016.1083029
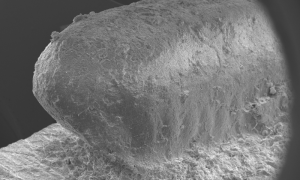
Scanning electron microscope (SEM) image of a cockroach egg case silicone replica. Credit: Prof. Hiroki Obata
Impressions of cockroach egg cases from 4,300 year old Japanese potsherds (broken pottery fragments) have been found in southern Japan. X-ray, computed tomography (CT) and scanning electron microscopy were used to image the impressions and reveal aspects about ancient Japanese life in this latest archeological survey from Kumamoto University.
To archeologists, ancient earthenware is almost always packed full of treasure. This may seem logical since the pots may have held water, food or other historically valuable items. This time, however, the “treasure” was found not in the pot, but inside the pottery itself.
“Countless vacant holes on the surface of potsherds had been all but ignored until about 25 years ago,” said Professor Hiroki Obata, researcher of archeology from Kumamoto University, Japan. “Since then, however, the meaning and importance of these holes has become well understood. They can be the impression of seeds, nuts, insects or shells.”
From the cavities left by soybeans or adzuki beans which were mixed in the pottery during creation, it is possible to more correctly estimate the beginning of cultivation in the district. Impressions are an important key to understanding the lifestyle of those who lived in a particular area during a particular period. Furthermore, with a quantitative survey of the impressions, it is possible to extrapolate the range of the propagation and cultivation of the plants.
Professor Obata’s group examined impressions on the surface and from the inside of the potsherds from the Odake shell mound site in Toyama Prefecture, which contains artifacts from the early Jomon Period of Japan (5,300 – 3,500 BC). Using X-ray, CT and scanning electron microscopy they found more than 500 impressions, even though only 66 could be visually confirmed, of Egoma—Perilla frutescens var. frutescens—seed related imprints on the surface. The impressions within the potsherds were unique to the period making them easily distinguishable from potsherds that had been created at another time.
That’s no seed. That’s a cockroach impression
In their latest survey the research group employed an “impression replica” method of investigation, where a silicon replica cast is made of an item’s surface and then scanned with a scanning electron microscope producing a detailed examination of the original surface. Cockroach egg case impressions found during the examinations were about 11 mm (0.43 in) long, and it was determined that the egg cases were from the smokybrown cockroach (Periplaneta fuliginosa) native to the southern area of China. In Japan, smokybrown cockroaches have been portrayed in 18 century (Edo Period) literature and art work, with literary and artistic appearances by cockroaches previous to that period considered to be a domestic species.
The two of the potsherds which contained the egg case impressions were unearthed from the Motonobaru archeological site which dates back to the late Jomon Period of Japan (2,500 – 1,300 BC). The impressions were found from fragments that were about 4,000 and 4,300 years old respectively. This shows that smokybrown cockroaches have existed in Japan nearly 3,700 to 4,000 years longer than had ever been considered from literary and artistic works.
Maize weevils be with you
One year previously, Professor Obata and colleagues presented results of their research from the same site in which they found 173 impressions of an insect called the maize weevil. At that time, it was about half of all ancient maize weevils that had ever been discovered in Japan.
“The maize weevil is a type of harmful insect that eats stored starch food materials such as acorns or chestnuts, which are known to be typical stored food for that period in Japan. The existence of many maize weevils and cockroaches shows that these ancient humans lived settled lifestyles,” said Professor Obata. “With this latest research, we have revealed that there were cockroaches in human living areas from a period older than was previously believed. More and more information about ancient human life is being found from potsherds. Soft and small items have some difficulty remaining in the soil for a significant amount of time, but they can be kept safe within these pottery fragments. Like little time capsules, potsherds are packed full of treasures which help to reveal the story about the living conditions of ancient humans.”
Further investigations are currently being performed on ancient potsherds and more discoveries are expected in the future.
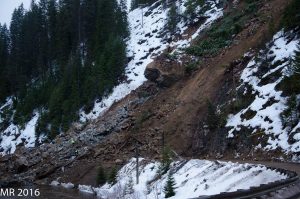
On Thursday, the Idaho Transportation Department said debris slid onto a section of Highway 14, about 10 miles west of Elk City.
About 500 feet of the highway is blocked off with rock, trees, debris and is about 40 feet deep. It’s unclear when the highway will reopen.
“One of the problems, besides assessing stability, is what to do with the slide material,” ITD wrote on its Facebook page. “ITD has no nearby materials pit that could hold such a massive quantity.”
The Idaho County Sheriff’s Office told KBOI 2News that officials aren’t sure when the highway could open up. There’s a lot of earth on the road.
“They are truly blocked in,” an official said.
Bret Edwards has worked with ITD for a little over a year. He was the one to catch the landslide on tape. We spoke with KBOI 2News on the phone to describe the scene.
“The trees started cracking and a lot more material started coming down than what we normally see,” Edwards said. “And the whole mountainside just gave way. Didn’t know what to think but I knew there were power lines near so I just started running. Did the best we could to get out of the way of things.”
Edwards says the landslide is probably because of the extensive rain in the area.
“We’ve all been expecting something big to happen. And we obviously didn’t expect something to happen yesterday but with the moisture that we’ve been having… I don’t think anyone was actually shocked that it happened. But it’s a known problem and everybody has just been waiting for the day for it to come down.”
Crews will be working to grade Forest Road 1199 to open it up for emergency services. The road, which is typically not open during this part of the season, will be for emergency use only.
The sheriff’s office said no one in the remote town has reached out in need of help as of Friday afternoon.
“They’re a pretty hardy bunch,” the official said.
Edwards says he’s happy his crew is safe.
“No one was injured. Just basically the worst thing is the road blockage for the residents in the small community of Elk City. That’s the only way in and the only way out.”
Note: The above post is reprinted from materials provided by KBOI.
The infamous ‘Sue’ specimen of T. rex Credit: Chicago museum. CC BY-SA
T. rex is probably the most notorious and infamous dinosaur of all time, and somewhat of an icon in both the scientific and public spheres. After all, it was a pretty fearsome and impressive carnivore, and arguably worthy of such admiration. But there were actually a lot of other dinosaurs similar to T. rex, together forming a group known as tyrannosauroids.
Recently, a whole series of new findings is helping us to unlock the secrets of these fascinating beasts, and we can now begin to answer questions about their evolutionary relationships, biogeography, and how decent their fossil record is. In fact, half of all known tyrannosauroid species have been discovered in the last decade alone!
Tyrannosauroid species were actually around way before T. rex, which only occupied the top of the food chain right at the end of the Cretaceous reign of the non-avian dinosaurs. Actually, the largest tyrannosauroids only seemed to appear around 20 million years before this. Before they achieved such terrifyingly gigantic sizes, most were actually quite small-bodied (for a dinosaur), and quite ecologically diverse.
Steve Brusatte, Thomas Carr and their colleagues visited the question of the inter-relationships of tyrannosauroids back in 2010. Forming hypotheses of relationships like this forms the basis for assessing important evolutionary factors, such as the origins and evolution of particular anatomical features, rates of evolution, diversity, anatomical disparity, and biogeography. So when another study produced alternative results to their earlier study, Brusatte and Carr decided to go back to the Mesozoic and reanalyse tyrannosauroids, but incorporating all of the recent bits of knowledge we have gained about them over the last few years.
In addition to this, Brusatte and Carr decided to approach this with a dual method. Typically, when palaeontologists create trees that form the basis of assessing evolutionary relationships, we use a method called parsimony. This looks at how many different anatomical changes have occurred between different species, and tries to provide the minimum number of changes in order to build a tree. They also decided to go Bayesian on their dataset though, something which hasn’t really taken off in palaeontology yet, and has been more widely applied to molecular analyses. This works slightly differently by analysing anatomical data (in the form of a character matrix) in a probabilistic framework, and by using more complicated models that treat characters in different ways. By using this combination of techniques, it is possible to see which results are congruent, and therefore which conclusions can be best supported.
Fortunately for Brusatte and Carr, the results of both analyses were quite similar overall, lending support to their conclusions. There are slight differences, which you can see by comparing the two trees figured here. The overall structure reveals that tyrannosauroids can be sub-divided into a basal clade of proceratosauroids, which includes taxa such as the feathered Yutyrannus and Guanlong; an intermediate grouping or grade of small- to medium-sized beasties; and the gigantic apex predators such as T. rex and Tarbosaurus that we all know thanks to the best scientific minds in Hollywood.
The authors do a great job of trying to work out why their results differ slightly, but as always, the devil is in the details and it can be quite difficult to figure out. Part of the reason for some of the discrepancies might be to do with missing data – we can never fully sample every organism that has lived, and palaeontologists accept that limit of the fossil record. In the case of tyrannosauroids, there is a 20 million year gap in their fossil record from just before the time when the Western Interior Seaway covered much of North America. What this means is that animals simply weren’t preserved in the right time in the right place to be preserved as fossils. Yet, at least. Discovering new tyrannosauroids from this gap might be critical in working out how more derived tyrannosauroids evolved during a clearly important time in their history.
But what does all of this mean then for the evolution of tyrannosauroids? Well, for starters, it shows that the evolution of their large body size appeared to happen more gradually, rather than a rapid burst. Accompanying this, it shows that bite forces increased incrementally too, and that their elaborate facial ornamentations gradually became more complicated along with increasing body size. The first truly gigantic tyrannosauroids, coming in at more than 1.5 tonnes in mass and 10 metres in body length, didn’t appear in the fossil record until around 80 million years ago.
In terms of their biogeography, some interesting patterns emerge. It seems like there was episodic interchange between Asia and North America during the Late Cretaceous. What this means, and I’m sure Donald Trump will love this, is that T. rex actually appears to have been an Asian immigrant that colonised North America. However, this understanding might change as we recover ever more tyrannosauroid fossils from the latest Cretaceous of Asia and North America.
So, that’s a quick update on what we know about tyrannosauroids. Despite them clearly winning a cross-dinosaur popularity contest, there is still much we can learn about these creatures, and only time and future exploration can tell what we’ll discover!
Reference:
Mark A. Loewen et al. Tyrant Dinosaur Evolution Tracks the Rise and Fall of Late Cretaceous Oceans, PLoS ONE (2013). DOI: 10.1371/journal.pone.0079420
S. L. Brusatte et al. Tyrannosaur Paleobiology: New Research on Ancient Exemplar Organisms, Science (2010). DOI: 10.1126/science.1193304
Stephen L. Brusatte et al. The phylogeny and evolutionary history of tyrannosauroid dinosaurs, Scientific Reports (2016). DOI: 10.1038/srep20252
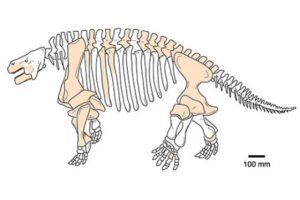
The skeleton of Shihtienfenia, a large pareiasaur from the latest Permian of Shanxi Province, China. The skeleton outline is based on close relatives from Russia, and known bones are shaded. Credit: Image courtesy of University of Bristol
Long before the dinosaurs, hefty herbivores called pareiasaurs ruled Earth. Now, for the first time, a detailed investigation of all Chinese specimens of these creatures — often described as the ‘ugliest fossil reptiles’ — has been published by a University of Bristol, UK palaeontologist.
Pareiasaurs have been reported from South Africa, Europe (Russia, Scotland, Germany), Asia (China), and South America, but it is not known whether there were distinct groups on each of these continents.
In a new study published in the Zoological Journal of the Linnean Society, Professor Mike Benton of Bristol’s School of Earth Sciences shows there are close similarities between Chinese fossils and those found in Russia and South Africa, indicating that the huge herbivores were able to travel around the world despite their lumbering movement.
Professor Benton said: “Up to now, six species of pareiasaurs had been described from China, mainly from Permian rocks along the banks of the Yellow River between Shaanxi and Shanxi provinces. I was able to study all of these specimens in museums in Beijing, and then visit the original localities. It seems clear there were three species and these lived over a span of one to two million years.”
Pareiasaurs were hefty animals, two to three metres long, with massive, barrel-shaped bodies, short, stocky arms and legs, and tiny head with small teeth. Their faces and bodies were covered with bony knobs.
It is likely the pareiasaurs lived in damp, lowland areas, feeding on huge amounts of low-nutrition vegetation. No stomach contents or fossilized faeces from pareiasaurs are known to exist, but in Russia, pareiasaurs have been found with evidence they had made wallows in the soft mud probably to cool off or coat themselves in mud to ward off parasites.
The new study confirms that the three Chinese pareiasaur species differed from each other in body size and in the shapes of their teeth.
Professor Benton added: “My study of the evolution of pareiasaurs shows that the Chinese species are closely related to relatives from Russia and South Africa. Despite their size and probably slow-moving habits, they could walk all over the world. We see the same sequence of two or three forms worldwide, and there is no evidence that China, or any other region, was isolated at that time.”
Pareiasaurs were the first truly large herbivores on Earth, and yet their tenure was short.
As in other parts of the world, the species in China were wiped out as part of the devastation of the end-Permian mass extinction 252 million years ago, when 90 per cent of species were killed by the acid rain and global warming caused by massive volcanic eruptions in Russia.
Without forests, landscapes were denuded of soils which washed into the seas. Shock heating of the atmosphere and oceans as a result of the massive release of carbon dioxide and methane also killed much of life. The end-Permian mass extinction killed off the pareiasaurs after they had been on Earth for only 10 million years.
Reference:
Michael J. Benton. The Chinese pareiasaurs. Zoological Journal of the Linnean Society, February 2016 DOI: 10.1111/zoj.12389
An international team including scientists at the University of St Andrews has unlocked the secret of one of the great events of Earth’s evolution – the Cambrian explosion.
Around 520 million years ago, a wide variety of animals burst onto the evolutionary scene in an event known as the Cambrian explosion. In perhaps as few as 10 million years, marine animals evolved most of the basic body forms that we observe in modern groups.
The event has sparked fierce debate all the way back to Darwin. Some paleontologists see the Cambrian explosion as a real, astonishing episode of unprecedented, fast evolution. Others suggest it is a false artifact of an unreliable fossil record.
Now work published in the American Journal of Science shows that these competing theories can be unified by the geography of Cambrian Earth, as it underwent a wholesale lurch that clustered most of Earth’s continents around the equator.
Co-author Dr Timothy Raub of the Department of Earth and Environmental Sciences at the University of St Andrews said: “In a nutshell both camps were right. The particular locations of Cambrian continents relative to each other was special in a way that supercharged animal speciation while preserving an unusually good record of those early fossils.”
The key event, proposed long ago by co-author Joseph Kirschvink from Caltech and Japan’s Earth-Life Science Institute (ELSI), was a massive episode of what is known as ‘true polar wander’. Raub, Kirschvink, and lead author Ross Mitchell of Caltech and Yale University are among scientists who have bolstered the evidence for true polar wander and developed predictions of its consequences in recent years.
Earth’s continental and oceanic plates are in constant motion relative to one another, but in rare episodes of true polar wander, the entire solid Earth slips about its liquid outer core over the course of five to ten millions years, causing the geographic locations of Earth’s plates to shift altogether in the same sense.
The paper suggests that about 520 million years ago a lurch of more than 60 degrees moved most continents from polar to tropical latitudes. For reasons that are still debated, biological diversity reaches a global peak around the equator and tapers off closer to the poles. This early Cambrian rotation therefore would have dramatically increased shallow coastal area in Earth’s biodiversity hotspot.
As another consequence of true polar wander, continents moving towards the equator are flooded by hundreds of metres of sea level rise, as they encounter the great bulge of water caused by Earth’s daily spin. This flooding would have increased fossil preservation, but it also would have opened up new habitats for rapid diversification, in particular vast continental seaways rife with previously unexplored ecological niches.
Cambrian true polar wander happened at a time when Earth was already seeded with many of the traits that subsequently radiated throughout the Tree of Life.
Dr Raub (pictured) said: “A bunch of wonderful ideas have been published emphasising one or another aspect of the Cambrian biosphere as the crucial link in the explosion of animal life. An appealing aspect of our study is that a geographic contingency – the shape and arrangement of the Cambrian continents and the direction of the remarkable true polar wander shift – can support almost all those ideas simultaneously. At the same time, it turns out that preservation of Cambrian fossils really was enhanced over that of other ages.
“This new geographic framework answers a debate going back over a hundred years. It should encourage scientists to review all sorts of old and new hypotheses, which no longer must fit into the evolution or preservation camp exclusively.”
Reference:
‘Was the Cambrian explosion both an effect and an artifact of true polar wander?’ Ross N. Mitchell, Timothy D. Raub, Samuel C. Silva, Joseph L. Kirschvink is published in the American Journal of Science. DOI: 10.2475/10.2015.02
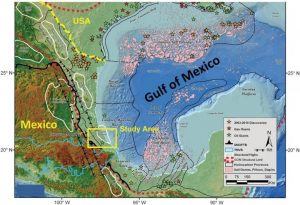
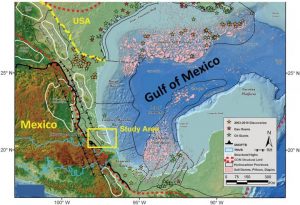
Map shows the study area along eastern Mexico and the Gulf. Credit: Stephen Cossey
Geologists studying a region in the Mexican state of Veracruz have discovered evidence to explain the origin of the Wilcox Formation, one of Mexico’s most productive oil plays, as well as support for the theory that water levels in the Gulf of Mexico dropped dramatically as it was separated from the rest of the world’s oceans and Earth entered a period of extreme warming.
The drop in water levels and the warming, known as the Paleocene-Eocene thermal maximum (PETM), occurred around 55.8 million years ago. The Gulf refilled about 850,000 years later.
Geologist Don Van Nieuwenhuise said the study, published in the February edition of Interpretation, explains the distribution of the Wilcox Formation from onshore Texas and Mexico into the deep waters of the Gulf and offers insight into the episode of extreme warming more than 55 million years ago, with potential implications for climate change today.
Van Nieuwenhuise, director of professional geoscience programs at the University of Houston, is an author of the study, along with lead author Stephen P.J. Cossey, Joseph Davis, Joshua H. Rosenfeld and James Pindell. Cossey, Davis, Rosenfeld and Pindell are independent geologists.
The findings support the theory that the Gulf of Mexico was landlocked as the Paleocene Epoch morphed into the warmer Eocene, punctuated by a massive loss of water due to evaporation and, millennia later, was inundated again.
Van Nieuwenhuise said oil producers long have been puzzled about the Wilcox Formation’s appearance in the Gulf’s deeper waters, hundreds of miles from where it appears onshore. This new information could mean there are still-undiscovered sections of the formation, also known as the Paleocene/Eocene Chicontepec Formation, he said.
But while the research offers a better understanding of where additional oil reservoirs might be located, Cossey said it also expands what is known about the history of the Gulf.
“There have been geologists working in the Gulf of Mexico for decades,” said Cossey, who is based in Durango, Colo. “After all these years, we’re still finding out things we didn’t know. This is important for oil and gas exploration, but it’s also important in the history of the Gulf of Mexico and our knowledge of climate change.”
The researchers said waters in the Gulf dropped at least 650 feet, leaving an exposed area that refilled less than a million years later — the blink of an eye in geologic time.
“Proving the existence of the Paleocene-Eocene drawdown would profoundly alter the interpretation of the Gulf’s geologic history with academic and economic ramifications,” the researchers wrote. “The theory, if further validated, would provide a revised context and would enhance predictability for petroleum exploration. … We can add another line of evidence that the (Gulf of Mexico) drawdown occurred and that it likely happened near the Paleocene-Eocene boundary,” or in the era between the Paleocene and Eocene epochs.
Several members of the team had previously worked near the village of Chicontepec, in Veracruz. Cossey, in fact, has written a book about the region, “Chicontepec: A Mexican National Treasure.”
He returned in February 2015 to an outcrop previously documented as a coal bed, convinced that the existence of turbidites, a type of sedimentary rock associated with deep ocean currents, next to the coal deserved more investigation.
Analysis of samples from the outcrop convinced the researchers that the “coal” was in fact a fossilized oil seep dating to the late Paleocene/early Eocene. Samples from above and below the oil contained fossilized sea life, additional evidence that the area was once submerged.
The researchers report that the oil seep developed after a dramatic drop in water levels in the Gulf, triggered by evaporation and coinciding with the PETM, the previously reported surge in temperatures. They conclude the dropping sea levels reduced pressure on hydrate-rich sediments, resulting in a massive methane release. Although there is not yet proof the warming was triggered by the methane release, Cossey said the timing fits.
“We know there was an increase in temperatures about 56 million years ago,” he said. “If we know the drawdown in the Gulf of Mexico caused that, we can better understand how natural events on earth can affect the climate.”
Van Nieuwenhuise noted that today’s warming oceans could also cause hydrates on the ocean floor to release methane, which may exacerbate climate change.
The region where the outcroppings were found was re-submerged as the Gulf waters rose but are now above sea level and about 100 miles from the Gulf coast, due to later geologic movement known as Tectonic activity, which would have reopened the passage between the Gulf and the world’s oceans.
Reference:
Stephen P. J. Cossey, Don Van Nieuwenhuise, Joseph Davis, Joshua H. Rosenfeld, James Pindell. Compelling evidence from eastern Mexico for a Late Paleocene/Early Eocene isolation, drawdown, and refill of the Gulf of Mexico. Interpretation, 2016; 4 (1): SC63 DOI: 10.1190/INT-2015-0107.1
Note: The above post is reprinted from materials provided by University of Houston. The original item was written by Jeannie Kever.
Professor Robert Frei preparing for isotope analyses in the laboratory at the Department of Geosciences and Natural Resource Management, University of Copenhagen. Credit: Kent Pørksen
Reconstructing the emergence and evolution of life on our planet is tightly linked to the questions as to when and to what extent Earth’s atmosphere became oxygenated. New geological studies based on data from Western Greenland indicate that small levels of atmospheric oxygen developed already 3.8 billion years ago, some 0.7-0.8 billion years earlier than previously thought.
Today, most researchers agree that the oxygenation of Earth’s atmosphere happened in two major steps: the first during the so-called Great Oxidation Event about 2.5-2.4 billion years ago, and the second during the Late Neoproterozoic Era around 750 to 540 million years ago. The latter is thought to have been the cause for the emergence of animals during the so-called ‘Cambrian explosion’ around 540 to 520 million years ago.
An international team of researchers led by Professor Robert Frei from the Department of Geoscience and Natural Resource Management at the University of Copenhagen has just released a study indicating evidence for the presence of small concentrations of oxygen on Earth already 3.8 billion years ago. The researchers analysed Earth’s oldest Banded Iron Formations (BIFs) from Western Greenland. BIFs are marine chemical sediments originally composed of alternating layers of silica and Fe-hydroxides and are widely used as geochemical archives. The reason for this is that they retain information on the composition and presence of oxygenation/reduction processes in ambient seawater and on the interaction of the atmosphere with Earth’s surface.
The research team used concentrations and isotope compositions, i.e. variations of the same elements with different atomic weight, of the elements chromium (Cr) and uranium (U) present in the BIFs. Chromium and uranium were used as these elements weather rapidly when continental landmasses are exposed to reactive oxygen species (ROS) such as oxygen (O2). After weathering, they are transported to the oceans by rivers, where they are deposited with chemical sediments and serve as geochemical signals of weathering by ROS.
The fact that the analyses of the BIF layers from Western Greenland show elements that require presence of oxygen in the atmosphere opens up for the possibility of evolution of the earliest primitive photosynthetic life forms as early as 3.8 billion years ago. As Robert Frei explains: “It is generally believed that the Early Earth was a completely anoxic, but our study shows that the surface of the Earth was exposed to a low oxygen atmosphere already this time. This has far reaching implications for how we investigate the pace of evolution of life and its biodiversity on our planet.”
Reference:
Robert Frei, Sean A. Crowe, Michael Bau, Ali Polat, David A. Fowle, Lasse N. Døssing. Oxidative elemental cycling under the low O2 Eoarchean atmosphere. Scientific Reports, 2016; 6: 21058 DOI: 10.1038/srep21058
This new study of fossil trackways from Gansu Province in northern China has provided evidence that some feet-only tracks were produced by walking, not swimming animals Credit: Lida Xing
An international team of scientists, led by the China University of Geosciences in Beijing and including palaeontologists from the University of Bristol, has shed new light on some unusual dinosaur tracks from northern China. The tracks appear to have been made by four-legged sauropod dinosaurs yet only two of their feet have left prints behind.
Previous studies of such trackways have suggested that the dinosaurs, which were far too big to walk on their hind legs, might have been swimming. Scientists agree that dinosaurs could swim – nearly all animals can – but evidence for swimming has been disputed. It has been suggest that trackways in which only the front or hind feet are imprinted into the sediment could have been made by swimming dinosaurs, their bodies buoyant in deep water while they paddled along with their arms or legs.
Now, a new study of fossil trackways from Gansu Province in northern China has provided evidence that some feet-only tracks were produced by walking, not swimming animals.
The tracks, dating from the Lower Cretaceous, over 120 million years ago, are roughly circular and with a clear set of four or five claw marks at the front. These prints are matched perfectly by the feet of medium-sized sauropod dinosaurs, massive long-necked, plant-eating dinosaurs such as Brontosaurus and Titanosaurus.
But how could only the prints of the hind feet be preserved?
Lead author Lida Xing said: “Nobody would say these huge dinosaurs could stagger along on their hind legs alone – they would fall over. However, we can prove they were walking because the prints are the same as in more usual tracks consisting of all four feet, it’s just that here, we don’t see the hand prints. If they had been swimming, with the hind legs dangling down, some of the foot prints would be scratch marks, as the foot scrabbled backwards.”
The tracks are well preserved, but there is evidence the animals were walking on soft sand. They pressed down because of their weight, and the claws dug deeper so they could gain purchase in the sediment. Most of the animal’s weight was towards the rear, and so the hind-feet pressed deeper. The front feet, on the other hand, did not apply enough pressure to make a lasting mark.
Co-author Professor Mike Benton of the University of Bristol’s School of Earth Sciences said: “This is not to say that sauropods did not swim. We are simply suggesting that a closer study of the details of fossil footprints and the sediments can suggest a rather less romantic idea. The loss of hand prints is down to sedimentology, not dinosaur behaviour.”
Reference:
‘Digit-only sauropod pes trackways from China – evidence of swimming or a preservational phenomenon?’ by Xing, L., Li, D.Q., Falkingham, P.L., Lockley, M.G., Benton, M.J., Klein, H., Zhang, J.P., Ran, H., Persons, W.S., Jr., and Dai, H. in Scientific Reports 6, 21138. DOI: 10.1038/srep21138
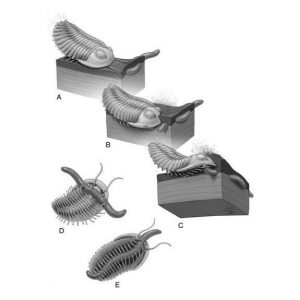
A trilobite detects a lumpy worm burrow by sight and perhaps smell, then burrows down and grasps its prey with its many legs. Credit: Stacy Turpin Cheavens of the Department of Orthopaedic Surgery, University of Missouri
The Cambrian Period, which occurred between 541 million and 485 million years ago, is an important point in evolutionary history where most of the major groups of animals first appear in the fossil record. Often called the “Cambrian explosion,” fossils from this time provide glimpses into evolutionary history as the world’s ecosystems were rapidly diversifying. Most fossils preserve the physical remains of organisms and their structure; however, geologists and paleobiologists at the University of Missouri recently collaborated to study fossils that reveal the behaviors of predators preserved as traces in ancient sediments. Thus, fossils from southeast Missouri are helping scientists unlock clues about the behaviors of these predators and their interactions with their prey. Evidence shows that these ancient organisms were behaviorally sophisticated, tailoring their attacks for effectiveness.
Trilobites are a fossil group of extinct marine invertebrate animals with external skeletons (see photo). As predators and scavengers, they flourished in the Cambrian period and were very prominent in the oceans that once were located in Missouri.
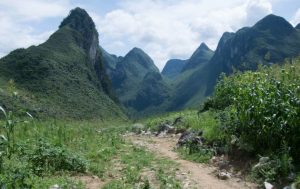
“The Saint Francois Mountains in southeastern Missouri have been the focus of geological research for decades and were once islands in the Cambrian ocean,” said Kevin Shelton, professor of geological sciences in the MU College of Arts and Science. “I’ve worked as a geologist studying ore deposits in the area for more than 30 years. In that time, I’ve run across thousands of fossilized trilobite burrows. It is rare that we get to study the activities of 500 million-year-old organisms, yet the fossils in this locality are helping us determine how these organisms behaved.”
The field area near the mountains is home to an abundance of trilobite trace and body fossils. James Schiffbauer and John Huntley, both assistant professors of geological sciences in the MU College of Arts and Science, worked with Shelton and Tara Selly, a graduate student in Schiffbauer’s research group, to collect slabs of rocks from the site. Selly, then analyzed them in the lab at MU.
Using sophisticated three-dimensional laser scanning and digital photograph analyses, sections of the rocks revealed burrows or trails left behind by trilobites and their prey — often worm-like creatures — in ocean sediments. To the scientists, these intersecting trails show how the predators caught their prey. Additionally, previous studies by former MU geology professor, James Stitt, revealed that the trilobites had very large eyes, so the researchers were looking for clues as to how their anatomy played into their feeding habits.
Tracks from the site showed that the predators attacked from above, moving alongside to use their many legs for more effective grappling of their prey. Further, predators preferentially selected smaller prey, indicating that they attacked their food rather than randomly bumping into it.
“Predation, or the action of attacking one’s prey, is a significant factor in evolution; this discovery is extremely important in the study of how organisms evolved in the Cambrian Period,” Schiffbauer said. “In this study, we provide evidence that these trilobites were likely visual predators, displaying selectivity in seeking and hunting their food.”
“Because we had an abundance of samples from the site, we were able to conduct more rigorous statistical analyses” Huntley said. “Our findings are important not only because of the large sample size, but because these early arthropods displayed such sophisticated predatory behavior.”
Video
References:
Tara Selly, John Warren Huntley, Kevin L. Shelton, James D. Schiffbauer. Ichnofossil record of selective predation by Cambrian trilobites. Palaeogeography, Palaeoclimatology, Palaeoecology, 2016; 444: 28 DOI: 10.1016/j.palaeo.2015.11.033 Note: The above post is reprinted from materials provided by University of Missouri-Columbia.
Karst topography in the Great Bank of Guizhou, south China. Credit: Kimberly Lau
Stanford scientists have found that chronically low levels of oxygen throughout the oceans hampered the recovery of life after the Permian-Triassic extinction, the most catastrophic die-off in our planet’s history. Also known as the “Great Dying,” global ecosystems collapsed as some 90 percent of species perished in this extinction event 250 million years ago.
The new findings, published this week in the journal for the Proceedings of the National Academy of Sciences, for the first time convincingly show that ocean anoxia, or oxygen deficiency, was a global rather than an isolated phenomenon. The study paints a dire portrait of how anoxic conditions reduced seawater oxygen levels by 100-fold at the onset of the mass extinction. Oxygen levels then slowly rose, only returning to pre-extinction levels after 5 million years, corresponding to when the climate became more stable and life regained its former diversity.
“Explaining the 5 million year delay in the Earth system’s recovery to pre-extinction conditions after the Permian extinction has been a challenge,” said Kimberly Lau, a PhD candidate in Geological Sciences at Stanford’s School of Earth, Energy & Environmental Sciences. “Our results suggest a unified explanation for biological and biogeochemical observations stemming from the most severe biotic crisis in Earth’s history.”
A devastating confluence of geological events is thought to have triggered the Great Dying a quarter billion years ago, including a massive eruption of climate-changing carbon dioxide from volcanoes associated with the Siberian Traps. Numerous studies have pointed to ocean anoxia playing a role both in the actual extinction event as well as its prolonged recovery phase. But until now these studies could not reliably testify beyond local conditions to the world’s waters as a whole.
Key to the new study was identifying an anoxic signal that could be traced independently of regional circumstances. For that, Stanford researchers turned to a new technique using uranium, preserved in limestone, that had once been dissolved and mixed evenly throughout the oceans. “Because uranium is slowly cycled through the ocean, these records are thought to represent global changes in oxygenation,” Lau said.
The dissolved uranium became trapped in seabed rocks when microbes chemically modified it into an insoluble form. Some microbes also utilize iron and sulfur to generate energy, creating minerals that further pull uranium out of the water. Uranium atoms naturally occur in two isotopes, or versions with differing numbers of neutrons, and these isotopes behave differently in chemical reactions. Conveniently for the sake of gauging anoxia, the rates of these various reactions involving uranium change are based on available oxygen.
“As you start to draw down the oxygen, you really start to change the chemistry of the water,” said geochemist Kate Maher, study co-author and an associate professor in Stanford’s School of Earth, Energy & Environmental Sciences. “I think it’s amazing that we can use these very subtle chemical clues to tell us about conditions in the ocean 250 million years ago that dramatically affected life.”
Different sites, same story
With this technique in hand, Lau and colleagues obtained rock samples from two widely separated sites, now located in modern-day China and Turkey. The samples of ancient marine sediments covered a wide time interval of the Permian-Triassic boundary, and given geographical separations of thousands of miles, attest to global, rather than local seawater characteristics. “We have examined limestones that cover about 17 million years that really allow us to see patterns in oxygenation before the extinction, during the extinction, and throughout the recovery,” Lau said.
With the observed pattern of ebbing anoxia dovetailing so well with evidence of life getting back on its feet over five million years post-Permian extinction, the Stanford researchers are eager to apply their methodology in better understanding the recoveries from Earth’s other four major die-offs, with the most famous being the Cretaceous-Paleogene event 65 million years ago that killed the dinosaurs.
“The technique we used in this study is absolutely something we want to use for studying other mass extinction events, many of which have been linked to ocean anoxia,” said study co-author Jonathan Payne, an associate professor and chair of geological sciences at Stanford’s School of Earth, Energy & Environmental Sciences.
Many researchers are now taking a greater interest in the resurrection of flora and fauna worldwide following calamities, and not just how life was sent reeling in the first place.
“We tend to focus so much on the extinction event, not so much the recovery,” Maher said, “but the recovery is also a really important piece that sets the stage for what happens in the next interval of life.”
The new findings also have implications for our modern world, Payne said.
“These findings highlight the fact that ocean deoxygenation during the 21st century and beyond may lead not only to the loss of marine animal populations and species but also to unexpected feedbacks in the Earth system,” he added. “The timescales of these feedbacks are long, meaning that the consequences of profound and extensive deoxygenation today could reverberate for many centuries, millennia, or longer.”
Reference:
Kimberly V. Lau, Kate Maher, Demir Altiner, Brian M. Kelley, Lee R. Kump, Daniel J. Lehrmann, Juan Carlos Silva-Tamayo, Karrie L. Weaver, Meiyi Yu, Jonathan L. Payne. Marine anoxia and delayed Earth system recovery after the end-Permian extinction. Proceedings of the National Academy of Sciences, 2016; 201515080 DOI: 10.1073/pnas.1515080113
Map shows the study area along eastern Mexico and the Gulf. Credit: Stephen Cossey
Geologists studying a region in the Mexican state of Veracruz have discovered evidence to explain the origin of the Wilcox Formation, one of Mexico’s most productive oil plays, as well as support for the theory that water levels in the Gulf of Mexico dropped dramatically as it was separated from the rest of the world’s oceans and the earth entered a period of extreme warming.
The drop in water levels and the warming, known as the Paleocene-Eocene thermal maximum (PETM), occurred around 55.8 million years ago. The Gulf refilled about 850,000 years later.
Geologist Don Van Nieuwenhuise said the study, published in the February edition of Interpretation, explains the distribution of the Wilcox Formation from onshore Texas and Mexico into the deep waters of the Gulf and offers insight into the episode of extreme warming more than 55 million years ago, with potential implications for climate change today.
Van Nieuwenhuise, director of professional geoscience programs at the University of Houston, is an author of the study, along with lead author Stephen P.J. Cossey, Joseph Davis, Joshua H. Rosenfeld and James Pindell. Cossey, Davis, Rosenfeld and Pindell are independent geologists.
The findings support the theory that the Gulf of Mexico was landlocked as the Paleocene Epoch morphed into the warmer Eocene, punctuated by a massive loss of water due to evaporation and, millennia later, was inundated again.
Van Nieuwenhuise said oil producers long have been puzzled about the Wilcox Formation’s appearance in the Gulf’s deeper waters, hundreds of miles from where it appears onshore. This new information could mean there are still-undiscovered sections of the formation, also known as the Paleocene/Eocene Chicontepec Formation, he said.
But while the research offers a better understanding of where additional oil reservoirs might be located, Cossey said it also expands what is known about the history of the Gulf.
“There have been geologists working in the Gulf of Mexico for decades,” said Cossey, who is based in Durango, Colo. “After all these years, we’re still finding out things we didn’t know. This is important for oil and gas exploration, but it’s also important in the history of the Gulf of Mexico and our knowledge of climate change.”
The researchers said waters in the Gulf dropped at least 650 feet, leaving an exposed area that refilled less than a million years later – the blink of an eye in geologic time.
“Proving the existence of the Paleocene-Eocene drawdown would profoundly alter the interpretation of the Gulf’s geologic history with academic and economic ramifications,” the researchers wrote. “The theory, if further validated, would provide a revised context and would enhance predictability for petroleum exploration. … We can add another line of evidence that the (Gulf of Mexico) drawdown occurred and that it likely happened near the Paleocene-Eocene boundary,” or in the era between the Paleocene and Eocene epochs.
Several members of the team had previously worked near the village of Chicontepec, in Veracruz. Cossey, in fact, has written a book about the region, “Chicontepec: A Mexican National Treasure.”
He returned in February 2015 to an outcrop previously documented as a coal bed, convinced that the existence of turbidites, a type of sedimentary rock associated with deep ocean currents, next to the coal deserved more investigation.
Analysis of samples from the outcrop convinced the researchers that the “coal” was in fact a fossilized oil seep dating to the late Paleocene/early Eocene. Samples from above and below the oil contained fossilized sea life, additional evidence that the area was once submerged.
The researchers report that the oil seep developed after a dramatic drop in water levels in the Gulf, triggered by evaporation and coinciding with the PETM, the previously reported surge in temperatures. They conclude the dropping sea levels reduced pressure on hydrate-rich sediments, resulting in a massive methane release. Although there is not yet proof the warming was triggered by the methane release, Cossey said the timing fits.
“We know there was an increase in temperatures about 56 million years ago,” he said. “If we know the drawdown in the Gulf of Mexico caused that, we can better understand how natural events on earth can affect the climate.”
Van Nieuwenhuise noted that today’s warming oceans could also cause hydrates on the ocean floor to release methane, which may exacerbate climate change.
The region where the outcroppings were found was re-submerged as the Gulf waters rose but are now above sea level and about 100 miles from the Gulf coast, due to later geologic movement known as Tectonic activity, which would have reopened the passage between the Gulf and the world’s oceans.
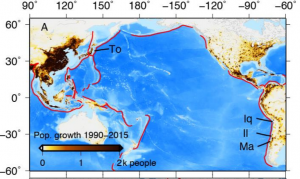
The red lines indicate subduction zones. The four earthquakes analyzed in this study are labeled: the 2010 Maule, Chile (Ma), 2011 Tohoku-oki, Japan (To), 2014 Iquique, Chile (Iq) and 2015 Illapel, Chile (Il) quakes. Population density in tsunami-prone areas has steadily increased over the last 25 years – making it more difficult to quickly evacuate these communities. Credit: Melgar et al
Existing GPS instruments at monitoring stations worldwide could be used to increase the speed and accuracy of tsunami warnings, according to new study accepted for publication in Geophysical Research Letters, a journal of the American Geophysical Union. Real-time Global Positioning System (GPS) measurements can be used to show how major earthquakes displace the ocean floor, cutting tsunami warning times by nearly 20 minutes and potentially reducing harm to coastal communities, according to the study’s authors.
Tsunamis that originate from earthquakes near the shore are relatively rare. But these tsunamis are especially dangerous because they can arrive at the coastline within minutes. For coastal communities, quick and accurate warnings are essential for saving as many lives as possible, according to previous research.
Current systems use seismic instruments to detect the earthquake’s vibrations and issue tsunami warnings within five to 10 minutes after the quake ends. But these warnings cannot give specific information about the size and reach of the wave. It can take more than 20 minutes to obtain information about the exact strength and reach of the resulting tsunami.
The new study finds that real-time GPS data gathered at hundreds of geophysical monitoring stations around the world can be used to estimate how an earthquake deforms the sea floor. Warning agencies can use that information to determine the resulting tsunami strength for vulnerable coastal areas within two to three minutes. Earlier warnings for coastal communities could potentially save lives, said the study’s authors.
“This isn’t a deployment of new instruments, just a change in thinking and using these instruments,” said Diego Melgar, a research scientist at Berkeley Seismological Laboratory in Berkeley, California, and lead author of the new study. “Our results show that with what people have now, at geophysical monitoring agencies everywhere in the world, people can do this.”
Traditional tsunami warning systems
Current tsunami warning systems use seismometers, instruments that measure how the earth shakes during an earthquake, to pinpoint the epicenter, magnitude, and depth of an earthquake. Since the strength of a tsunami is not always directly related to the magnitude of the quake producing it, the additional information that real-time GPS data can quickly and accurately provide on the earthquake’s source is important.
As an earthquake increases in size, above 7.5 to 8 MW, its recorded magnitude becomes less reliable: seismometers closest to high-magnitude quakes often inaccurately record their size. Generating an accurate tsunami warning requires that warning agencies wait for the earthquake’s energy waves to reach earthquake monitoring stations farther away to generate an accurate model of the earthquake and resulting tsunami: a delay of up to 20 to 30 minutes after the first record of the earthquake, Melgar said.
The tsunami warnings generated after the Tohuku, Japan, earthquake in 2011 were generated using this method. The resulting tsunami, infamous for causing the Fukushima power plant meltdown, caused more than 15,000 deaths. Although the Japanese Meteorological Agency issued a tsunami warning three minutes after the quake, their initial estimate of the quake’s magnitude at 7.9 was too low and the tsunami warning it generated was too conservative. The quake was actually 30 times stronger with a magnitude of 9.0, according to previous research. Tsunami wave heights reached up to 128 feet (30 meters) above sea level, and swept inland as far as 6 miles (10 kilometers) in some areas.
A newer, better method
Seismic monitoring stations around the world already use GPS to precisely monitor tectonic plate movements and determine how earthquakes change the landscape. The new study suggests existing GPS instruments can also be used to more quickly and accurately predict the size of an incoming tsunami.
During an earthquake, coastal GPS stations can collect real-time information about how the land they sit on deforms. This information can then be plugged into a numerical model to estimate the displacement of the ocean floor and create an accurate prediction of the potential tsunami threat and scale within minutes, according to the new research.
To determine the accuracy of these GPS warnings, the researchers examined four recent tsunami-generating earthquakes. They examined records of the earthquake source, tsunami propagation, and tsunami inundation for each event. The researchers found that their system could generate more accurate tsunami warnings faster than existing warning systems.
Using this system, tsunami warning maps could be generated within one to two minutes after the beginning of the earthquake.
Information about the estimated height of tsunami waves took less than two additional minutes of time to compute.
NOAA is in the process of incorporating this real-time GPS data into their existing tsunami and earthquake warning system, according to Barry Hirshorn, a senior geophysicist at NOAA’s Pacific Tsunami Warning Center (PTWC) at the Inouye Regional Center (IRC), on Ford Island, Hawaii, who was not involved in the new study.
Currently, the PTWC can accurately estimate an earthquake’s magnitude up to 7.5 – 8. This magnitude estimate can usually be issued within two to four minutes after the beginning of the earthquake. Currently, the PTWC can accurately estimate an earthquake’s magnitude up to 7.5 – 8. This magnitude estimate can usually be issued within two to four minutes after the beginning of the earthquake. According to Hirschhorn, GPS would enable more accurate magnitude estimates for earthquakes of a magnitude 8 and larger and provide additional information about the deformation of the seafloor within the same time frame. As over 90% of a tsunami’s casualties occur at the local or regional level, tsunami warning centers could save many lives by incorporating real-time GPS into their analysis, Hirshorn said.
The goal is to create a local tsunami warning system incorporating this technology for the entire West Coast of the U.S., Melgar said.
Hirshorn said the new paper provides a template for how to incorporate GPS data into tsunami operations. “We’ll be able to issue faster and more accurate tsunami warnings – and have a better idea of the true magnitude of M8 plus earthquakes much more rapidly – in some cases even before the earthquake is over,” he said.
Reference:
Diego Melgar,Richard M. Allen,Sebastian Riquelme,Jianghui Geng,Francisco Bravo,Juan Carlos Baez,Hector Parra,Sergio Barrientos,Peng Fang,Yehuda Bock,Michael Bevis,Dana J. Caccamise II,Christophe Vigny,Marcos Moreno,Robert Smalley Jr., Local tsunami warnings: Perspectives from recent large events. DOI: 10.1002/2015GL067100
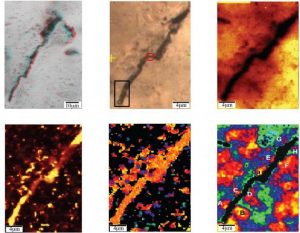
Different types of imaging show the microstructure that was originally designated as the fossil Eoleptonema apex. Credit: Dina Bower and Andrew Steele
A team of scientists including Carnegie’s Dina Bower and Andrew Steele weigh in on whether microstructures found in 3.46 billion-year-old samples of a silica-rich rock called chert found in Western Australia are the planet’s oldest fossils. The purported fossils have been a heated scientific controversy for many years. The team asserts that at least a portion of the microstructures are actually pseudo-fossils. Their findings are published in Astrobiology.
More than two decades ago, microscopic filamentary structures, less than two dozen micrometers in length, found in Australia’s Apex chert formation were declared to be fossils of photosynthetic bacteria from the Archean eon. These alleged microfossils were obviously of great interest to scientists interested in the origins of life on Earth as well as those trying to determine the best way to look for life on other planets.
But since then, subsequent research involving Owen Green at Oxford University (who is also a co-author on this study) has called these claims into question, putting forward the idea that the structures are fossil-like mineral formations, but not actually the remains of life. Debate about the authenticity of the Apex chert microfossils has raged over the last several years.
The research team–which also included Marc Fries of the NASA Johnson Space Center and John Lindsay (now deceased) of the Lunar and Planetary Science Institute–analyzed the orientation of the quartz crystals (quartz is a form of silica, which makes up chert) surrounding the alleged microfossils in order to determine whether the crystals and microstructures were both formed as part of the same geological processes.
“Based on our findings, we think that the Apex fossil that was designated as Eoleptonema apex in the originally described samples that we re-studied here was actually formed when a series of quartz grains cracked and was filled in with carbon-rich material to create a sheet-shaped structure within the larger crystal,” Steele explains.
The source of the carbon could have been biological, or abiotic, but this structure itself is not a fossil, the team asserts.
“Studies have shown that 60 percent of the originally described alleged microfossils were found in material that is younger than its host rock, E. apex being one such example. This study further develops a new technique in order to study the indigeneity of the microfossils in the rock and shows without a doubt that this particular example is a pseudo-fossil. The other microstructures in the primary rock (i.e. the oldest part of the rock) should now be analyzed critically in order to prove that similar processes have not been responsible for the formation of those features,” said Bower.
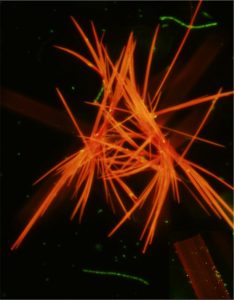
Crystals of a synthetic dye called neutral red can dramatically increase the amount of methane gas emitted by naturally occurring microbes living in coal seams and on food waste. Credit: UNSW
UNSW Australia-led researchers have discovered a way to produce a tenfold increase in the amount of methane gas emitted by naturally occurring microbes living in coal seams and on food waste.
The innovation could benefit the environment by extending the lifespan of coal seam gas wells, as well as improving the economics of using woody crops and left-over food as commercial sources of biogas.
The technique involves the addition of small amounts of a synthetic dye that forms previously unobserved needle-like crystals to help the methane-producing microbes grow faster.
“It’s simple. If the microbes grow faster, they fart more methane,” says study senior author UNSW Associate Professor Mike Manefield.
Biogas emitted by microbes will be vital for meeting the world’s future energy needs and helping reduce greenhouse gas emissions from the burning of other fossil fuels, Associate Professor Manefield says.
“Our research in the lab and in coal boreholes near Lithgow has shown that the crystals can lead to a massive leap in methane production – a tenfold increase from coal, and an 18-fold increase from food waste.
“This is very exciting and likely to be a game changer. We also expect our approach will work with renewable feedstocks for methane-producing microbes, such as woody plant material and the by-products of municipal wastewater treatment.”
The study, by an international team spear-headed by UNSW’s Dr Sabrina Beckmann, is published in the journal Energy and Environmental Science. The five-year-long research project was supported by the Australian Research Council and industry partner Biogas Energy.
The researchers studied a small synthetic molecule called neutral red that has been used for more than 150 years as a textile dye, or for staining cells under a microscope.
“We knew it was able to shuttle electrons about and we wondered if it could deliver them directly to the microbes that produce methane. Usually these ancient critters get electrons from hydrogen gas,” says Associate Professor Manefield.
“When we added neutral red in the laboratory to a mixture of coal and naturally occurring groundwater microbes, in the absence of oxygen, we discovered it formed crystals that had never been seen before.
“The crystals act as electron sponges, harvesting electrons from minerals and bacteria in the mixture and then transferring them with a lot of power to the methane-producing microbes, boosting their growth.”
The patented technology was also tested in a real-life environment in coal boreholes near Lithgow.
Small amounts of neutral red were injected 80 metres underground at three sites into the water-saturated coal seam. A fivefold to tenfold increase in methane production was observed during a 12-month period.
“Coal seam gas wells usually have a short lifespan and spent ones litter the countryside. Enhancing their methane production could reduce the need to build new ones,” Associate Professor Manefield says.
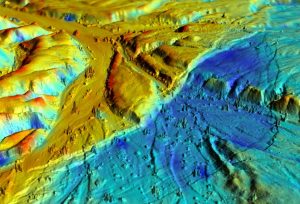
This 3-D LiDAR imaging of the Borrego Fault, ruptured during the 2010 El Mayor-Cucapah earthquake in Baja California, Mexico shows numerous small faults. The various colors represent elevation changes during the earthquake. Credit: UC Davis
A spate of major earthquakes on small faults could overturn traditional views about how earthquakes start, according to a study from researchers at the Centro de Investigación Científica y de Educación Superior in Ensenada, Mexico, and the University of California, Davis.
The study, published Feb. 15 in the journal Nature Geoscience, highlights the role of smaller faults in forecasting California’s risk of large earthquakes.
In the past 25 years, many of California’s biggest earthquakes struck on small faults, away from the San Andreas Fault plate boundary. These events include the Landers, Hector Mine and Napa earthquakes. Several of the quakes were unexpected, rattling areas thought seismically quiet.
A closer look at one of the surprise events, the magnitude-7.2 El Mayor-Cucapah earthquake, showed that small faults may often link together along a “keystone” fault. A keystone is the central stone that holds a masonry structure together. During the El Mayor-Cucapah earthquake, the keystone fault broke first, unlocking seven smaller faults, the study found.
However, the research team discovered that of all the faults unzipped during the El Mayor-Cucapah earthquake, the keystone fault was not the one closest to breaking.
“One of the important outcomes of this study is you can have a whole network of faults activated together by one underpinning fault, and that’s an important concern,” said study co-author Michael Oskin, a UC Davis professor of geology. “An earthquake involving a system of small faults can be more damaging than a single event because it increases the amount of seismic energy released.”
House of cards
The April 4, 2010, El Mayor-Cucapah earthquake leapfrogged across seven faults and jumped a 5-mile wide gap. The researchers used a wealth of recorded seismic data and detailed mapping of surface changes to reconstruct the complex earthquake sequence.
The study reveals the underlying reason for this unusual pattern: a hidden fault buried at a shallow angle to the surface. Each of the seven faults steeply dips toward this hidden fault, linking up deep underground.
Lead author John Fletcher, a professor at CICESE, likened the system to a house of cards—remove one key piece and the entire structure tumbles.
“The trick here is the cards can bend, but it isn’t until one particular fault goes that the whole set ruptures,” Fletcher said.
Earthquake risk
The El Mayor-Cucapah earthquake occurred in a transition zone, between faults spreading open to form the Gulf of California and faults where the Pacific and North America tectonic plates slip sideways past one another. The earthquake was centered about 30 miles south-southeast of Mexicali in northern Baja California, Mexico.
The results suggest similar processes are at work in other areas where the Earth’s crust accommodates major changes in shape.
“This gives us insight into how those messy things between the main faults work,” Oskin said. “This might be pretty common.”
In past events, the signal of a low-angle fault could have been masked because it activated a lot of high-angle faults in the same earthquake, the researchers said.
The idea could also explain a longstanding mystery: why the central San Andreas fault is almost perpendicular to its stress field. Oskin said the central San Andreas fault may also behave like a keystone fault.
Background
The El Mayor-Cucapah earthquake caused extensive damage to the city of Mexicali, displacing more than 35,000 people and causing two deaths. The shaking demolished roads and irrigation channels in surrounding agricultural areas. Reports documented widespread liquefaction, road ruptures, cracked infrastructure, tilting power line towers and partial or total collapse of many buildings. Damage topped $440 million in the Mexicali Valley and $90 million in California’s Imperial Valley.
Reference:
John M. Fletcher et al. The role of a keystone fault in triggering the complex El Mayor–Cucapah earthquake rupture, Nature Geoscience (2016). DOI: 10.1038/ngeo2660
Note: The above post is reprinted from materials provided by UC Davis.