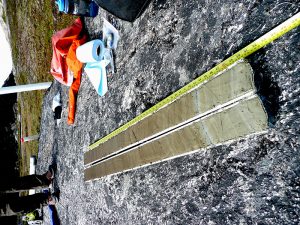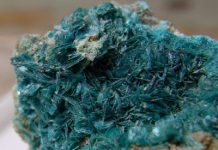
A freshly drilled section of the 2.1-mile West Antarctic Ice Sheet Divide ice core. Credit: Mark Twickler/University of New Hampshire
Many factors related to warming will conspire to raise the planet’s oceans over coming decades — thermal expansion of the world’s oceans, melting of snow and ice worldwide, and the collapse of massive ice sheets.
But there are a few potential brakes. One was supposed to be heavier snowfall over the vast continent of Antarctica. Warmer air will hold more moisture and thus generate more snow to fall inland and slightly rebuild the glacier, according to climate model projections.
Not so fast, says a University of Washington study published in Geophysical Research Letters, a journal of the American Geophysical Union. The authors looked at evidence from the West Antarctic Ice Sheet Divide ice core to get a first clear look at how the continent’s snowfall has varied over 31,000 years.
“It’s allowed us to look at the snow accumulation back in time in much more detail than we’ve been able to do with any other deep ice core in Antarctica,” said lead author T.J. Fudge, a UW postdoctoral researcher in Earth and space sciences. “We show that warmer temperatures and snowfall sometimes go together, but often they don’t.”
For example, the record includes periods before 8,000 years ago, as Earth was coming out of its last ice age, when the air temperature went up by several degrees without any boost in the amount of snowfall.
“Our results make it clear that we cannot have confidence in projections of future snowfall over Antarctica under global warming,” said co-author Eric Steig, a UW professor of Earth and space sciences.
The plateau of East Antarctica, the site of most previous ice cores, is relatively high and dry. About 80 percent of the continent’s precipitation falls on the lower, stormier edges, like where this core was drilled in 2006-2011. (To prepare scientists for conditions during a West Antarctic snowstorm, Fudge notes, researchers had to practice navigating outside with a bucket over their heads.) The 2.1-mile, or 3.5-kilometer, ice core preserves climate history in enough detail to show individual snow years.
Many climate models predict that warming temperatures will mean more snow in Antarctica in the future. When more snow falls inland at the upper edge of the flowing ice sheet, it counteracts mass lost to melting or calving at the edges. This extra snowfall would reverse 2 to 4 centimeters, or about 1 inch, of global sea-level rise by 2100, researchers said.
“It’s not a huge component,” Fudge acknowledges, “but if you live close to sea level, centimeters certainly matter.”
The new study, however, shows that temperature is an unreliable predictor of Antarctic snowfall.
“Depending on what part of the record you look at, you can draw different conclusions,” Fudge said. “During some of the more abrupt climate changes, from when we had ice sheets to our current climate state, there’s actually no relationship between temperature and snowfall.”
The large variation seen in the historical record probably reflects shifts in atmospheric patterns and how storm tracks reach Antarctica, Fudge said. Research is increasingly showing that winds play a big role in Antarctic temperature, sea ice and weather patterns, especially on shorter timescales, and that the gale-force winds that whip around the continent are connected to weather patterns in the tropics.
“For sea-level rise, we’re not really interested in what happens over thousands of years,” Fudge said. “We’re interested in what happens over the next few hundred years. At that shorter timescale, the variability in how the storms reach the continent matters much more than a few degrees of warming.”
The snowfall record may help to understand how winds affect Antarctic weather, and how atmospheric connections with the tropics influence the amount of relatively warm ocean water that laps at the frozen continent’s edge.
“By getting models to better capture the variability in our snowfall record, we actually will get a better idea of how the warm ocean is going to interact with the ice sheets at the edge, and those will have an even bigger impact on sea level, eventually,” Fudge said.
Reference:
T.J. Fudge et al. Variable relationship between accumulation and temperature in West Antarctica for the past 31,000 years Authors. Geophysical Research Letters, May 2016 DOI: 10.1002/2016GL068356/
Note: The above post is reprinted from materials provided by University of Washington. The original item was written by Hannah Hickey.
The Valles Marineris region on Mars, where Alberto Fairén and other astronomers examined tsunami-affected shorelines from meteor impacts. Credit: NASA/JPL-CalTech
The geologic shape of what were once shorelines through Mars’ northern plains convinces scientists that two large meteorites — hitting the planet millions of years apart — triggered a pair of mega-tsunamis. These gigantic waves forever scarred the Martian landscape and yielded evidence of cold, salty oceans conducive to sustaining life.
“About 3.4 billion years ago, a big meteorite impact triggered the first tsunami wave. This wave was composed of liquid water. It formed widespread backwash channels to carry the water back to the ocean,” said Alberto Fairén, Cornell visiting scientist in astronomy and principal investigator at the Center of Astrobiology, Madrid.
Fairén, who with lead author Alexis Rodriguez of the Planetary Science Institute and 12 others, published their work in Scientific Reports (May 19), a publication of the journal Nature.
The scientists found evidence for another big meteorite impact, which triggered a second tsunami wave. In the millions of years between the two meteorite impacts and their associated mega-tsunamis, Mars went through frigid climate change, where water turned to ice, Fairén said: “The ocean level receded from its original shoreline to form a secondary shoreline, because the climate had become significantly colder.”
The second tsunami formed rounded lobes of ice. “These lobes froze on the land as they reached their maximum extent and the ice never went back to the ocean — which implies the ocean was at least partially frozen at that time,” he said. “Our paper provides very solid evidence for the existence of very cold oceans on early Mars. It is difficult to imagine Californian beaches on ancient Mars, but try to picture the Great Lakes on a particularly cold and long winter, and that could be a more accurate image of water forming seas and oceans on ancient Mars.”
These icy lobes retained their well-defined boundaries and their flow-related shapes, Fairén said, suggesting the frozen ancient ocean was briny. “Cold, salty waters may offer a refuge for life in extreme environments, as the salts could help keep the water liquid. … If life existed on Mars, these icy tsunami lobes are very good candidates to search for biosignatures,” he said.
“We have already identified some areas inundated by the tsunamis where the ponded water appears to have emplaced lacustrine sediments, including evaporites,” Rodriguez said. “As a follow-up investigation we plan to characterize these terrains and assess their potential for future robotic or human in-situ exploration.”
The research, “Tsunami Waves Extensively Resurfaced the Shorelines of an Early Martian Ocean,” was funded by NASA. Fairén was supported by the European Research Council.
Reference:
J. Alexis P. Rodriguez, Alberto G. Fairén, Kenneth L. Tanaka, Mario Zarroca, Rogelio Linares, Thomas Platz, Goro Komatsu, Hideaki Miyamoto, Jeffrey S. Kargel, Jianguo Yan, Virginia Gulick, Kana Higuchi, Victor R. Baker & Natalie Glines. Tsunami Waves Extensively Resurfaced the Shorelines of an Early Martian Ocean. Scientific Reports, 2016 DOI: 10.1038/srep25106
Geologists have long known that New Orleans is slowly sinking—but now, scientists using radar technology say groundwater sucked up by industrial facilities such as a power plant, oil refineries and chemical complexes may be contributing to the problem and could even be undermining levees.
This new study is the latest attempt to explain a perplexing problem threatening the survival of a low-lying region at risk of being swallowed by the Gulf of Mexico: gradual sinking, or subsidence.
The study, published this week in the Journal of Geophysical Research, mapped subsidence across the New Orleans region using radar images for three years between June 2009 and July 2012.
Something popped out: Two spots with industrial complexes saw very high subsidence rates, where sinking was measured between about an inch and 2 inches a year. By comparison, sinking in other places in the metropolitan area ranged from about 1/10th of an inch to ¼ of an inch a year, the study found.
Both of the hot spots for subsidence are next to critical flood-protection infrastructure.
The study concluded “groundwater withdrawal is the primary subsidence driver in areas with major industry around the New Orleans (area).”
“It’s a correlation, quite a strong correlation,” said Cathleen Jones, the lead researcher on the study from NASA’s Jet Propulsion Laboratory in Pasadena, California.
The researchers found severe subsidence around a 1960s-era Entergy New Orleans electric power plant in Michoud, a swampy area about 9 miles east of the French Quarter. Sinking has been a problem for years there and poses problems for levee builders because it’s a frontline in defenses against hurricanes.
Radar imagery revealed sections of levees, rebuilt higher after Hurricane Katrina, were subsiding by as much as 2 inches a year. Nearby lies a massive $1.1 billion barrier built after Katrina. It’s nearly 2 miles long and designed to stop hurricane surges. The study did not say whether that structure had subsided.
Some subsidence is expected on newly built levees. Rene Poche, an Army Corps of Engineers spokesman, said the agency was not familiar with the study. But he said the agency has accounted for projected subsidence in its post-Katrina work.
Since the 1960s, the power plant has been sucking up groundwater for cooling purposes.
Charlotte Cavell, an Entergy spokeswoman, said the old plant is scheduled to be deactivated June 1 although the company is looking at building a smaller power plant on the site “in the near future.” Entergy has not decided whether to use groundwater in the new facility, she said.
She said the company was “not aware of any link between the Michoud plant’s use of groundwater and subsidence in New Orleans.”
On the western side of New Orleans, researchers found high rates of subsidence in a cluster of chemical and oil refinery plants in an area called Norco, Louisiana.
The facilities are near the Bonnet Carre Spillway, a 1930s-era structure that protects New Orleans from Mississippi River flooding. The study called the spillway “the last line of protection” from river flooding and said an “investigation of possible subsidence impacting the spillway directly is needed.”
However, scientists not affiliated with the study said it’s also far from clear if a link between industry’s water use and subsidence can be made.
For example, USGS data shows industrial use of groundwater around the Bonnet Carre Spillway facilities is not huge, which would seem to undercut the idea groundwater use is causing sinking there.
“There’s so much subsidence going on in New Orleans and the coastal area it’s hard to pin it on anything,” said John Lovelace, a USGS scientist in Baton Rouge.
Life restoration of Meemannia eos. Credit: Brian Choo
Osteichthyans, or bony fishes, comprise two categories, each containing over 32,000 living species: Sarcopterygii (lobe-finned fishes and tetrapods) and Actinopterygii (ray-finned fishes). Nevertheless, actinopterygians have an obscure early evolutionary history. The earliest definitive actinopterygian is the Middle Devonian (Eifelian) Cheirolepis, with earlier candidates generally represented by fragments subject to differing phylogenetic interpretations. By contrast, earliest Devonian deposits yield a diversity of lobe-finned fishes and recent discoveries from China extend their origin into the late Silurian.
The Early Devonian (Lochkovian) Xitun Formation of Yunnan, China, provides remarkable fossils to illustrate the evolutionary origins of individual sarcopterygian lineages, but apparently lacks any actinopterygians. Meemannia is the newest—and least understood—member of this fauna. Represented by four isolated skull roofs and a referred jaw, Meemannia presents an intriguing mosaic of characteristics: histology interpreted as a precursor to the “cosmine” of rhipidistian sarcopterygians (lungfishes plus tetrapods); an undivided braincase and skull roof resembling that of actinopterygians. Previous phylogenetic analyses placed Meemannia as the earliest-diverging sarcopterygian, based on histological features.
In a study published May 19 in Current Biology, Drs. Lu Jing and Zhu Min, of the Chinese Academy of Sciences and their collaborators used high-resolution computed tomography to re-examine the most complete remains of Meemannia, and presented new details of the internal skeleton and one of the earliest osteichthyan endocasts. Researchers revised hypotheses of bone histology in the ancestor of bony fishes, and found that “cosmine”-like tissues, previously thought to unite Meemannia with lobe-fins, are widely distributed among early bony fishes, including the ray-fin Cheirolepis. This finding revealed that Meemannia, once considered a lobe-fin, is the oldest ray-finned fish, providing new evidence for the origin of ray-finned fishes.
“The enigmatic osteichthyan Meemannia from the Early Devonian of China, about 415 million years ago, was previously identified as an exceptionally primitive lobe-finned fish. It combines ‘cosmine’-like tissues taken as evidence of sarcopterygian affinity with actinopterygian-like skull roof and braincase geometry, including endoskeletal enclosure of the spiracle and a lateral cranial canal,” said Dr. Lu Jing. “Our comparable study on histological structures in undoubted ray-finned fishes indicates that they are general osteichthyan features.”
“Phylogenetic analysis places Meemannia as an early-diverging ray-finned fish, resolving it as the sister lineage of Cheirolepis plus all younger actinopterygians,” said study co-author Dr. Sam Giles, of the University of Oxford. “This brings the first appearance of ray-fins more in line with that of lobe-fins and fills a conspicuous faunal gap in the otherwise diverse late Silurian-earliest Devonian vertebrate faunas of the South China Block.”
“The rarity of early ray-fins supports a ‘long-fuse’ model for actinopterygian diversification,” said Dr. Zhu. “Actinopterygians persisted at low levels of numerical abundance, taxonomic richness, and morphological disparity for millions of years before undergoing apparently explosive diversification in the early Carboniferous after the end-Devonian Hangenberg Event. Meemannia provides an anatomical snapshot of the earliest stages of ray-finned fish evolution, at a time when their rarity and limited ecological variety gave no indication of the dominant role they would play in aquatic vertebrate ecosystems of the future.”
Ellison’s Cave, Georgia Photo Credit: Michael Nichols
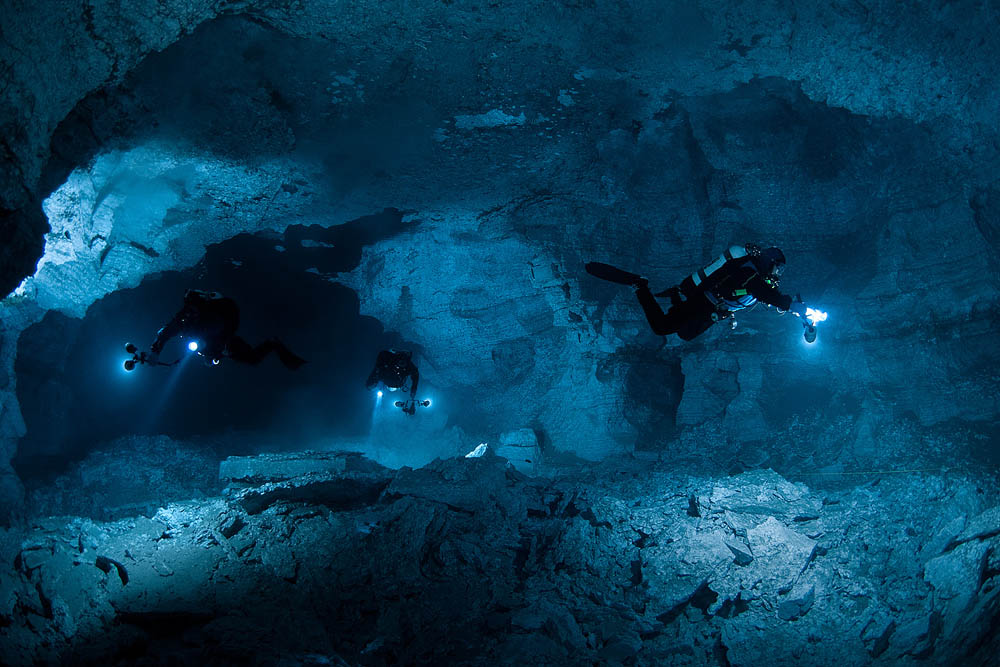
Ellison’s Cave is a pit cave located in Walker County, on Pigeon Mountain in the Appalachian Plateaus of Northwest Georgia. It is the 12th deepest cave in the United States and features the deepest, unobstructed underground pitch in the continental US named Fantastic Pit. The cave is over 12 miles long and extends 1063 feet vertically.
Pits
Ellison’s features a number of underground vertical pitches including the two deepest pits in the continental United States: Fantastic (586 feet) and Incredible (440 feet). These two pits lie on opposite sides of the cave. Nearby and parallel to Fantastic are Smokey I (500 feet), Smokey II (262 feet), and other extremely deep pitches. There are over 7 routes to reach the bottom level of the cave from the Fantastic side. Fantastic and Smokey I both extend to TAG Hall, a passage at the bottom of the cave. To reach Fantastic, or the large pits on the Fantastic side, cavers must also descend the Warm Up pit (125 feet).
Geology
Ellison’s is a solution cave in the Ridge and Valley geologic region of northwest Georgia and lies within a bedrock fault in Pigeon Mountain. During the Ordovician Period, tectonic subduction responsible for forming the Appalachians left a number of seismically active fault lines stretching from northern Alabama to eastern Tennessee. Continued orogeny created a large fault zone in the bedrock throughout the southern Appalachians and northern Georgia. This fracturing along with the proliferation of gypsum and limestone contributes to the exceptional depth of Ellison’s.
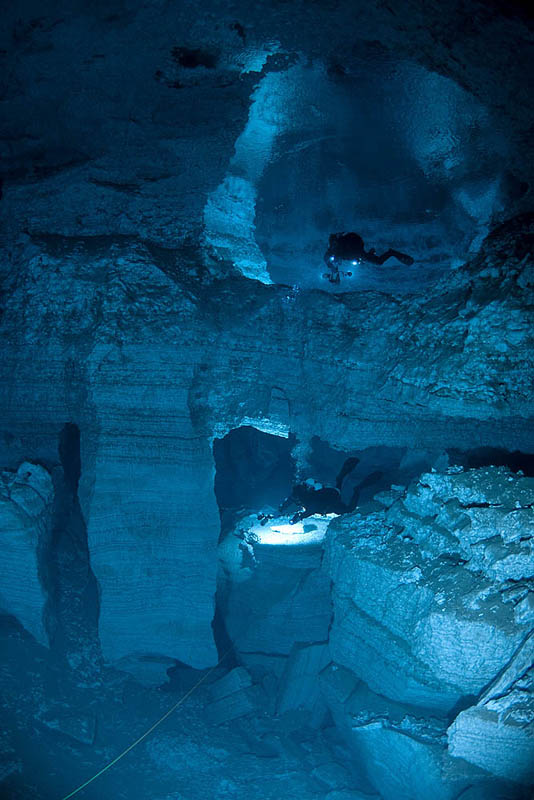
A natural arch produced by erosion of differentially weathered rock in Jebel Kharaz (Jordan) Photo Credit: Etan J. Tal
What Does Weathering Mean?
Weathering is breaking down rocks, soil, and minerals as well as wood and artificial materials by contacting the atmosphere, water, and biological organisms of the Earth. Weathering takes place in situ, i.e. in the same place, with little or no movement. It should therefore not be confused with erosion involving the movement of rocks and minerals by agents such as water, ice, snow, wind, waves and gravity, and then transported and deposited elsewhere.
There are two important weathering process classifications–physical and chemical weathering; each involves a biological component at times. Mechanical or physical weathering involves rock and soil breakdown by direct contact with atmospheric conditions such as heat, water, ice and pressure.
The second classification, chemical weathering, involves the direct effect in the breakdown of rocks, soils and minerals of atmospheric chemicals or biologically produced chemicals also known as biological weathering. While physical weathering is emphasized in very cold or very dry environments, where the climate is wet and hot, chemical reactions are most intense. Both types of weathering, however, take place together, and each tends to speed up the other.
How Rocks Are Weathered?
Once a rock is broken down, the bits of rock and mineral are carried away by a process called erosion. No rock on Earth is hard enough to resist weathering and erosion forces.
What are the 3 types of weathering?
Weathering is often divided into mechanical weathering and weathering processes. Biological weathering may be part of both processes, in which living or once – living organisms contribute to weathering.
Physical Weathering
Physical weathering, also known as mechanical weathering or disaggregation, is the process class that causes rocks to disintegrate without chemical change. Abrasion (the process by which clasts and other particles are reduced in size) is the primary process in physical weathering.
Due to temperature, pressure, frost etc., physical weather may occur. For instance, cracks exploited by physical weathering will increase the surface area that is exposed to chemical action, thereby increasing the rate of disintegration.
Where does Physical Weathering occur?
In places where there is little soil and few plants grow, such as mountain regions and hot deserts, physical weathering occurs especially.
How does Physical Weathering occur?
Either by repeated melting and freezing of water (mountains and tundra) or by expanding and shrinking the surface layer of rocks baked by the sun (hot deserts).
Chemical Weathering
Chemical weathering changes rock composition, often transforming them into different chemical reactions when water interacts with minerals. Chemical weathering is a gradual and ongoing process as the rock mineralogy adjusts to the environment near the surface.
The rock’s original minerals develop new or secondary minerals. The oxidation and hydrolysis processes are most important in this. Chemical weathering is enhanced by geological agents such as water and oxygen, as well as biological agents such as microbial and plant-root metabolism acids.
Where does Chemical Weathering occur?
These chemical processes require water and occur faster at higher temperatures, so it is best to have warm, humid climates. The first stage in soil production is chemical weathering (especially hydrolysis and oxidation).
How does Chemical Weathering occur?
There are various types of chemical weathering, the most important of which is:
Solution
Removal of rock by acidic rainwater in solution. In particular, dissolved CO2-containing rainwater (this process is sometimes referred to as carbonation) weathers calestone.
Hydrolysis
Acidic water breakdown of rock producing clay and soluble salts.
Oxidation
Rock breakdown by oxygen and water, often giving a rusty – colored weathered surface to iron – rich rocks.
Biological Weathering
Biological weathering is the weakening and subsequent breakdown by plants, animals and microbes of rock.
Growing roots of plants can put stress or pressure on rock. Even though the process is physical, a biological process (i.e. growing roots) exerts the pressure. Biological processes can also produce chemical weathering, such as when organic acids are produced by plant roots or microorganisms that help dissolve minerals.
Microbial activity breaks down rock minerals by altering the chemical composition of the rock, making it more weather sensitive. One example of microbial activity is lichen ; lichen is a symbiotic relationship between fungi and algae. Fungi release chemical substances that break down rock minerals ; the algae consume the minerals thus released from rock. Holes and gaps continue to develop on the rock as this process continues, exposing the rock to physical and chemical weathering.
Burrowing animals can move fragments of rock to the surface, exposing the rock to more intense chemical, physical, and biological processes, thereby indirectly enhancing the weathering process.
How Weathering Is Different From Erosion?
The main difference between weathering and erosion is that there is weathering whereas erosion involves moving to a new location. Both are caused by wind, water, ice, temperature, and even biological action similar factors. They can also take place together.
A chance fossil discovery in Montana a decade ago has led to the identification of an audacious new species of horned dinosaur. The international research team that described the plant-eating dinosaur was led by a scientist at the Canadian Museum of Nature. The results are published today in the online science journal PLOS ONE.
The museum now houses the specimen in its national fossil collection, which includes some of the best examples of horned dinosaurs in the world. Museum palaeontologist Dr. Jordan Mallon completed the scientific analysis that pinned down the dinosaur as a new species. It is one among a growing number of newly discovered ceratopsids (four-legged dinosaurs generally characterized by horns on the face and elaborate head frills).
Mallon has bestowed the scientific name Spiclypeus shipporum (spi-CLIP-ee-us ship-OR-um) on the dinosaur, which lived about 76 million year ago. Spiclypeus is a combination of two Latin words meaning “spiked shield,” referring to the impressive head frill and triangular spikes that adorn its margins. The name shipporum honours the Shipp family, on whose land the fossil was found near Winifred, Montana.
About half of the skull, as well as parts of the dinosaur’s legs, hips and backbone had been preserved in the silty hillside that once formed part of an ancient floodplain.
“This is a spectacular new addition to the family of horned dinosaurs that roamed western North America between 85 and 66 million years ago,” explains Mallon, who collaborated with researchers in Canada and the United States. “It provides new evidence of dinosaur diversity during the Late Cretaceous period from an area that is likely to yield even more discoveries.”
What sets Spiclypeus shipporum apart from other horned dinosaurs such as the well-known Triceratops is the orientation of the horns over the eyes, which stick out sideways from the skull. There is also a unique arrangement to the bony “spikes” that emanate from the margin of the frill–some of the spikes curl forward while others project outward.
“In this sense, Spiclypeus is transitional between more primitive forms in which all the spikes at the back of the frill radiate outward, and those such as Kosmoceratops in which they all curl forward,” says Mallon.
While the fossil now has a scientific moniker, it is more commonly known by its nickname “Judith,” after the Judith River geological formation where it was found. Until it was purchased by the museum in 2015, the fossil had remained in the official possession of Dr. Bill Shipp, who found it while exploring his newly acquired property in 2005.
Shipp invested time and money to excavate and prepare the bones, aided by volunteers and palaeontologists including the PLOS ONE study co-authors Chris Ott and Peter Larson. “Little did I know that the first time I went fossil hunting I would stumble on a new species,” explains Shipp, a retired nuclear physicist who became a fossil enthusiast after moving to his dinosaur rich area of Montana. “As a scientist, I’m really pleased that the Canadian Museum of Nature has recognized the dinosaur’s value, and that it can now be accessed by researchers around the world.”
Apart from the horns and frill bones that helped define Judith as a new species, close examination of some of its other bones reveal a story of a life lived with pain. Judith’s upper arm bone (humerus) shows distinct signs of arthritis and osteomyelitis (bone infection)–determined following analysis by Dr. Edward Iuliano, a radiologist at the Kadlec Regional Medical Cener, in Richland, Washington.
“If you look near the elbow, you can see great openings that developed to drain an infection. We don’t know how the bone became infected, but we can be sure that it caused the animal great pain for years and probably made its left forelimb useless for walking,” explains Mallon. Despite this trauma, analysis of the annual growth rings inside the dinosaur’s bones by the Royal Ontario Museum’s Dr. David Evans suggest it lived to maturity. The dinosaur would have been at least 10 years old when it died.
Mallon and his team note that there are now nine well-known dinosaur species (including Spiclypeus shipporum), from Montana’s Judith River Formation. Some are also found in Alberta, which has a much richer fossil record, but others such as Spiclypeus are unique to Montana. Significantly, Mallon says that none of the species are shared with more southerly states, suggesting that dinosaur faunas in western North America were highly localized about 76 million years ago. Mallon’s prior research has shown that such species-rich communities may have been enabled by dietary specializations among the herbivores, a phenomenon more commonly known as niche partitioning.
A public exhibit about Spiclypeus shipporum, will open May 24 at the Canadian Museum of Nature in Ottawa. It will include a reconstruction of the dinosaur’s skull, the diseased humerus, and other bones from this amazing fossil find.
Video
Reference:
Spiclypeus shipporum gen. et sp. nov., a boldly audacious new chasmosaurine ceratopsid (Dinosauria: Ornithischia) from the Judith River Formation (Upper Cretaceous: Campanian) of Montana, USA. By Jordan Mallon, C.J. Ott, P.L. Larson, E.M. Iuliano and D.C. Evans. DOI:10.1371/journal.pone.0154218
Credit: Washington State Dept of Transportation, Flickr
UEA research into the hazard risks of landslides could help save lives thanks to a new digital resource which launches today.
ThinkHazard! is a free open source tool to identify and reduce the impact of natural hazards around the world.
It analyses global, national and local data on hazards such as flooding, drought, earthquakes, landslides and Tsunamis.
The new digital platform has been created by the World Bank in collaboration with an international group of experts.
Prof David Petley from UEA’s School of Environmental Sciences collaborated closely on the landslides component of the resource.
He said: “ThinkHazard! is intended to provide guidance and advice for natural hazards in poor countries.
“It is a simple tool that enables people to discover the level of hazard in any location around the world.
“It draws on multiple data sources to provide the level of hazard, and is set up to become increasingly comprehensive over time as users contribute new data and information.”
Prof Petley’s research data on worldwide landslide fatalities was used to benchmark hazard assessment on maps within the tool. He also created advice sections for landslide hazard management.
“On average around 14,000 people are killed by landslides each year – particularly in parts of Central America, South Asia and South-East Asia.
“Assessing the potential disaster risk is critical for development experts, project developers, planners, officials and other decision makers,” he said.
“The main aim of this tool is to make understanding of hazard risk more accessible and increase the resilience of projects around the world.
“It also provides vital recommendations and resources to help address those risks.
“ThinkHazard! will be used by agencies around the world and I hope it will have a big impact, possibly even saving lives in future,” he added.
An international team of scientists, including a graduate student lead author from Ohio University, have identified a new species of centrosaurine, a member of the large-bodied ceratopsians (horned dinosaurs) that diversified in North America and Asia during the final stages of the age of dinosaurs.
Although many fossils of this group have been discovered in North America, particularly from the northern portion of the Cretaceous landmass Laramidia (Alaska, Alberta, Montana, and Saskatchewan), relatively few have been recovered from the southern portion (Utah, Colorado, New Mexico, Texas, and Mexico) of this ancient continent.
The new species, named Machairoceratops cronusi (UMNH VP 20550), was discovered by scientists conducting paleontological and geological surveys in Grand Staircase-Escalante National Monument, southern Utah. With the help of professional excavators and volunteers from Ohio University and the Natural History Museum of Utah (NHMU), the team unearthed the characteristic horncores and other skull elements over the course of three field seasons.
Comparisons with other horned dinosaurs revealed unique features, indicating the animal was different from other horned dinosaurs—including those from elsewhere in Utah, according to a study the team published today in PLOS ONE. Lead author and Ohio University graduate student Eric Lund stated “The discovery of Machairoceratops not only increases the known diversity of ceratopsians from southern Laramidia, it also narrows an evolutionary information gap that spans nearly 4 million years between Diabloceratops eatoni from the lower middle Wahweap Formation and Nasutoceratops titusi from the overlying Kaiparowits Formation “.
Machairoceratops lived approximately 77 million years ago during the end of the Cretaceous Period, a time when North America was subdivided by an epicontinental sea (one within a continent) into western (Laramidia) and eastern (Appalachia) landmasses. Centrosaurine ceratopsids, the group that includes Machairoceratops, were herbivorous dinosaurs known for their iconic, parrot-like beaks, enlarged noses, facial horns, and ornamented frills (neck shields). Machairoceratops is estimated to have been 6–8 meters long and may have weighed as much as 1–2 tons.
The skull of the new species exhibits similarities with the only other centrosaurine (Diabloceratops) yet named from southern Laramidia. But the two southern dinosaurs are distinctly different from one another, and, most notably, quite distinct from centrosaurines known from northern Laramidia. “Machairoceratops is unique in possessing two large, forward curving spikes off of the back of the neck shield, each of which is marked by a peculiar groove extending from the base of the spike to the tip, the function of which is currently unknown,” remarked Eric Lund.
In addition to expanding the diversity of centrosaurine ceratopsid frill ornamentation, this study also provides important insights into the early evolutionary history of ceratopsids on Laramidia. The discovery of Machairoceratops bolsters the idea that ceratopsians occupied two distinct regions that were latitudinally separated within Laramidia, and suggests that different evolutionary pressures acted upon the groups during the late Cretaceous.
“An effort like this underscores both the necessity and excitement of basic, exploratory science in order to better understand the history of the world around us,” noted study co-author Patrick O’Connor, professor of anatomical sciences at the Heritage College of Osteopathic Medicine. “Even in a place like western North America, where intense work has been conducted over the past 150 years, we are still finding species new to science,” he added.
Others authors on the study include paleontologist Mark Loewen, a research associate at the Natural History Museum of Utah, and geologist Zubair Jinnah, a senior lecturer at University of the Witwatersrand in Johannesburg, South Africa.
The study was funded by the Bureau of Land Management (Grand Staircase-Escalante National Monument), the Ohio University Heritage College of Osteopathic Medicine, the Ohio University Office of the Vice President for Research and Creative Activity, and the US National Science Foundation. Eric Lund has previously co-authored another study describing another new ceratopsid dinosaur Nasutoceratops titusi, also from the Late Cretaceous of Utah.
Reference:
Lund EK, O’Connor PM, Loewen MA, Jinnah ZA (2016) A New Centrosaurine Ceratopsid, Machairoceratops cronusi gen et sp. nov., from the Upper Sand Member of the Wahweap Formation (Middle Campanian), Southern Utah. PLoS ONE 11(5): e0154403. DOI: 10.1371/journal.pone.0154403
Representative Image: A replica of a Pelagornis skeleton at the National Museum of Natural History. Credit: Ryan Somma/wiki
Scientists on Wednesday said they have found the remains of a giant prehistoric bird that lived 50 million years ago in Antarctica and had the largest wingspan ever recorded.
Paleontologists at a natural history museum in Argentina said they had identified the pelagornithid, or bony-toothed bird, nearly three years after its fossilized bones were first found at an Argentine research base on the Antarctic island of Marambio.
“Almost three years ago, remains began to appear of what we believed could be this bird. Then we found a bone that confirmed that it was a pelagornithid,” an extinct family of enormous seabirds, said Carolina Acosta Hospitaleche, a researcher on the project.
The bird’s wings, fully extended, spanned more than 6.4 meters (21 feet), she said.
Her colleague Marcos Cenizo, the director of the Natural Sciences Museum of La Pampa, said the bird was the largest pelagornithid specimen ever found.
“The shape of their wings allowed them to glide and cross large distances across the oceans,” he said.
Antarctica specialists say there were two kinds of pelagornithid on the continent, one that reached up to five meters tall, with a similar wingspan, and another that stood more than seven meters.
The birds likely developed to their monstrous size some 50 million years ago, when warming ocean temperatures would have given them an abundance of food to thrive, the researchers said.
But the recently identified specimen would have been quite light despite its stature—30 to 35 kilograms (66 to 77 pounds), Cenizo said.
“Almost like a feather.”
The researchers published the find in the Journal of Paleontology.
Note: The above post is reprinted from materials provided by AFP.
This is a picture of the Totten Glacier front. Credit: Esmee van Wijk/Australian Antarctic Division
Current rates of climate change could trigger instability in a major Antarctic glacier, ultimately leading to more than 2m of sea-level rise.
This is the conclusion of a new study looking at the future of Totten Glacier, a significant glacier in Antarctica. Totten Glacier drains one of the world’s largest areas of ice, on the East Antarctic Ice Sheet (EAIS).
By studying the history of Totten’s advances and retreats, researchers have discovered that if climate change continues unabated, the glacier could cross a critical threshold within the next century, entering an irreversible period of very rapid retreat.
This would cause it to withdraw up to 300 kilometres inland in the following centuries and release vast quantities of water, contributing up to 2.9 metres to global sea-level rise.
The EAIS is currently thought to be relatively stable in the face of global warming compared with the much smaller ice sheet in West Antarctica, but Totten Glacier is bucking the trend by losing substantial amounts of ice. The new research reveals that Totten Glacier may be even more vulnerable than previously thought.
The study, by scientists from Imperial College London and institutions in Australia, the US, and New Zealand is published today in Nature. Last year, the team discovered that there is currently warm water circulating underneath a floating portion of the glacier that is causing more melting than might have been expected.
Their new research looks at the underlying geology of the glacier and reveals that if it retreats another 100-150 km, its front will be sitting on an unstable bed and this could trigger a period of rapid retreat for the glacier. This would cause it to withdraw nearly 300 km inland from its current front at the coast.
Retreating the full 300 km inland may take several hundred years, according to co-author Professor Martin Siegert, Co-Director of the Grantham Institute at Imperial College London. However, once the glacier crosses the threshold into the unstable region, the melting will be unstoppable — at least until it has retreated to the point where the geology becomes more stable again.
“The evidence coming together is painting a picture of East Antarctica being much more vulnerable to a warming environment than we thought,” he said. “This is something we should worry about. Totten Glacier is losing ice now, and the warm ocean water that is causing this loss has the potential to also push the glacier back to an unstable place.”
“Totten Glacier is only one outlet for the ice of the East Antarctic Ice Sheet, but it could have a huge impact. The East Antarctic Ice Sheet is by far the largest mass of ice on Earth, so any small changes have a big influence globally.”
To uncover the history of Totten Glacier’s movements, the team looked at the sedimentary rocks below the glacier using airborne geophysical surveys. From the geological record, influenced by the erosion by ice above, they were able to understand the history of the glacier stretching back millions of years.
They found that the glacier has retreated more quickly over certain ‘unstable’ regions in the past. Based on this evidence, the scientists believe that when the glacier hits these regions again we will see the same pattern of rapid retreat.
Reference:
A. R. A. Aitken, J. L. Roberts, T. D. van Ommen, D. A. Young, N. R. Golledge, J. S. Greenbaum, D. D. Blankenship, M. J. Siegert. Repeated large-scale retreat and advance of Totten Glacier indicated by inland bed erosion. Nature, 2016; 533 (7603): 385 DOI: 10.1038/nature17447
Note: The above post is reprinted from materials provided by Imperial College London. The original item was written by Hayley Dunning.
Second chamber of the Smoo Cave, Durness in Sutherland, Highland, Scotland Credit: Florian Fuchs/Wikipedia
Smoo Cave is a large combined sea cave and freshwater cave in Durness in Sutherland, Highland, Scotland.
Smoo Cave is located at the eastern edge of the village of Durness, on Scotland’s most northerly coastline. It is a dramatic location and on the only primary road in the area, the A838 Durness to Tongue. A trip to Smoo Cave has to be included in any stay in Durness. Set into limestone cliffs, Smoo Cave is quite large – 200 feet long, 130 feet wide, and 50 feet high at the entrance.
Geology
Smoo Cave is a very large sea cave, but the rear part is a karst cave which formed inside limestones of the Durness Group. The Durness Group are layers of limestones and dolomites. The rocks were formed during Odovician and Lower Cambrian as shelf sediments. They are found in a narrow belt running north to south, from the area of the Smoo Cave to Ardarroch at Loch Kishorn. The karst features of Smoo cave are typical for such a small limestone area with impermeable and insoluble rocks surrounding it. Waters flowing on impermeable rock, disappear in swallow holes as soon as they reach the border to the limestone. They drain underground and reappear in karst springs and caves. Such a cave river is to be found inside Smoo cave, water from a burn which disappeared only a few meters away.
The cave is formed in a band of Durness limestone which in turn is surrounded by quartzite, gneiss and grits. Originally a small swallet cave, the entrance has been much enlarged by the action of the sea. The first chamber is the large opening from the sea inlet and has been formed by the action of the sea. The second chamber has been formed by the action of fresh water. The roof holes show the difference in the forces that formed the caverns.
The presence of caves in the vicinity of the Geodha Smoo, and indeed the presence of the Geodha itself, is a reflection of the character of the local geology, which is dominated by Cambrian Dumess Limestone.
Physical description
The cave is unique within the UK in that the first chamber has been formed by the action of the sea, whereas the inner chambers are freshwater passages, formed from rainwater dissolving the carbonate dolostones. Partway through the cave the waters of Allt Smoo also drop in as a 20m high waterfall. This is mainly due to the nearby dolostone – quartzite geological boundary where the Allt Smoo stream crosses the impermeable quartzites and sinks on meeting the permeable dolostones. Essentially the cave can be thought of as two caves formed by different mechanisms which have joined together over time. The cave is composed of three main sections; a large sea cave entrance chamber, a waterfall chamber and a short freshwater passage which leads to a terminal sump chamber with some interesting flowstone formations at the rear.
The cave entrance and main chamber have been considerably enlarged by sea action to approximately 40m wide and 15m high, the largest sea cave entrance in Britain. The entrance is located at the end of a 600m long tidal gorge (Geodha Smoo) which was once part of the cave, now collapsed. Several remnant pillars can be seen along the eastern side of the Geodh along with a large section of the previous roof which has been partly buried by the grassy slope (normally covered by rocks spelling out the names of visitors to the cave). Interestingly, the sea rarely enters the sea cave nowadays (only during spring tides) as the area has undergone isostatic uplift.
The present-day cave is 83m long up to the terminal sump at the rear of the third chamber / passage. The cave travels further however as an active stream of notable size resurges here at all times. Previous dye-testing has linked an underwater passage to an initial sink point in the Allt Smoo stream about 100m upstream from the main waterfall, implying that the cave system is at least twice as long as once thought. Cave divers belonging to the Grampian Speleological Group have dived this sump to a distance of c. 40m, although large volumes of silt and peat in the water have prevented further exploration. It is worth noting that the main waterfall is often dry and will only become active once this upstream sink overflows.
Archaeological investigations have turned up Neolithic, Norse and Iron Age artifacts, and it is thought that usage may extend back to the Mesolithic age. The cave name is thought to originate from the Norse ‘smjugg’ or ‘smuga’ meaning a hole or hiding-place.
Figure showing the location and cumulative number of natural (tectonic) and induced earthquakes in Texas between 1980 and 2010. Credit: Cliff Frohlich/ University of Texas at Austin
Earthquakes triggered by human activity have been happening in Texas since at least 1925, and they have been widespread throughout the state ever since, according to a new historical review of the evidence published online May 18 in Seismological Research Letters.
The earthquakes are caused by oil and gas operations, but the specific production techniques behind these quakes have differed over the decades, according to Cliff Frohlich, the study’s lead author and senior research scientist and associate director at the Institute for Geophysics at the University of Texas at Austin.
Frohlich said the evidence presented in the SRL paper should lay to rest the idea that there is no substantial proof for human-caused earthquakes in Texas, as some state officials have claimed as recently as 2015.
At the same time, Frohlich said, the study doesn’t single out any one or two industry practices that could be managed or avoided to stop these kinds of earthquakes from occurring. “I think we were all looking for what I call the silver bullet, supposing we can find out what kinds of practices were causing the induced earthquakes, to advise companies or regulators,” he notes. “But that silver bullet isn’t here.”
The researchers write that since 2008, the rate of Texas earthquakes greater than magnitude 3 has increased from about two per year to 12 per year. This change appears to stem from an increase in earthquakes occurring within 1-3 kilometers of petroleum production wastewater disposal wells where water is injected at a high monthly rate, they note.
Some of these more recent earthquakes include the Dallas-Fort Worth International Airport sequence between 2008 and 2013; the May 2012 Timpson earthquake; and the earthquake sequence near Azle that began in 2013.
Frohlich and his colleagues suspected that induced seismicity might have a lengthy and geographically widespread history in Texas. “But for me, the surprise was that oil field practices have changed so much over the years, and that probably affects the kinds of earthquakes that were happening at each time,” Frohlich said.
In the 1920s and 1930s, for instance, “they’d find an oilfield, and hundreds of wells would be drilled, and they’d suck oil out of the ground as fast as they could, and there would be slumps” that shook the earth as the volume of oil underground was rapidly extracted, he said.
When those fields were mostly depleted, in the 1940s through the 1970s, petroleum operations “started being more aggressive about trying to drive oil by water flooding” and the huge amounts of water pumped into the ground contributed to seismic activity, said Frohlich.
In the past decade, enhanced oil and gas recovery methods have produced considerable amounts of wastewater that is disposed by injection back into the ground through special wells, triggering nearby earthquakes. Most earthquakes linked to this type of wastewater disposal in Texas are smaller (less than magnitude 3) than those in Oklahoma, the study concludes.
The difference may lie in the types of oil operations in each state, Frohlich said. The northeast Texas injection earthquakes occur near high-injection rate wells that dispose of water produced in hydrofracturing operations, while much of the Oklahoma wastewater is produced during conventional oil production and injected deep into the underlying sedimentary rock.
For the moment, there have been no magnitude 3 or larger Texas earthquakes that can be linked directly to the specific process of hydrofracturing or fracking itself, such as have been felt in Canada, the scientists concluded.
Frohlich and colleagues used a five-question test to identify induced earthquakes in the Texas historical records. The questions cover how close in time and space earthquakes and petroleum operations are, whether the earthquake center is at a relatively shallow depth (indicating a human rather than natural trigger); whether there are known or suspected faults nearby that might support an earthquake or ease the way for fluid movement, and whether published scientific reports support a human cause for the earthquake.
In 2015, the Texas legislature funded a program that would install 22 additional seismic monitoring stations to add to the state’s existing 17 permanent stations, with the hopes of building out a statewide monitoring network that could provide more consistent and objective data on induced earthquakes.
Reference:
Cliff Frohlich, Heather DeShon, Brian Stump, Chris Hayward, Matt Hornbach, and Jacob I. Walter. A Historical Review of Induced Earthquakes in Texas. Seismological Research Letters, 2016 DOI: 10.1785/0220160016
Bubbly syrup reveals how earthquakes shake up volcanoes – Snapshots of the same box, filled with a green syrup as well as bubbles and plastic flakes (grey color), used to study magma in volcanoes. Researchers place the box on top of a specialized shaking table where it first rests (left) and then shakes side-to-side (right). Credit: Image by Atsuko Namiki, Hiroshima University
A new study on the connection between earthquakes and volcanoes took its inspiration from old engineering basics. Future applications of these results may enable better predictions of the likelihood of a volcanic eruption for communities affected by an earthquake.
If you swirl wine in a glass too strongly, the wine crashes against the sides and spills over the top. The same swirling and crashing, technically termed “sloshing,” happens when transporting liquids on trucks or ships. Large liquid containers must be specially designed to avoid damage as the vehicle shakes and the liquid sloshes. Strong earthquakes can even damage large petroleum tanks.
When earthquakes shake the ground, the hot, molten rock beneath Earth’s surface can slosh and cause the magma to erupt from volcanoes.
“I wondered how earthquakes shake magma underground. It is well known that some earthquakes can trigger volcanic eruptions, but exactly how earthquakes and volcanoes are connected is still controversial. Our work adds a new event — earthquake induced sloshing — to the list of possible triggers of volcanic eruptions,” said Atsuko Namiki, Ph.D., associate professor at Hiroshima University and first author of the paper.
Boxes filled with simple syrup represented a volcano’s molten insides and a precision shake table represented an earthquake.
“It might be surprising that ordinary syrup can represent a volcano’s magma, but the way syrup moves is quite similar to magma,” said Namiki.
Namiki visited the GFZ German Research Centre for Geosciences to use the specialized equipment available there and collaborate with co-authors of the research paper, Dr. Eleonora Rivalta, Dr. Heiko Woith, and Dr. Thomas R. Walter.
“The side-to-side shaking we used represented earthquakes of different severities and intensities,” said Namiki.
A super-fast camera and advanced mathematical calculations were used to analyze video recordings of the model volcanoes.
Air bubbles and small plastic flakes added to the syrup represented the bubbles of gas and solid crystals floating in magma.
During “earthquakes” of certain strength and speed, sloshing popped bubbles inside the syrup. In an actual volcano, popped bubbles release volcanic gas into the atmosphere. This decrease in pressure within the volcano can then trigger an eruption.
“In sealed containers, sloshing only occurs when there is empty air space where the liquid has room to move. Most magma reservoirs in volcanoes are full and sealed, but sloshing still can occur if there are layers of magma of different densities, similar to oil floating on water,” said Namiki.
Sloshing mixes the layers, which can trigger the growth of new bubbles that eventually pop and create more violent eruptions.
The research team analyzed the syrup’s motion and created a model to describe the conditions under which bubbles in real magma could pop and potentially cause actual volcanic eruptions.
Buildings suffer greater damage when the building’s resonant frequency matches the rate of shaking by the earthquake. Similarly, volcanoes have resonant frequencies and certain earthquakes will more significantly slosh magma inside a volcano.
The shape of the inside of the volcano and the location, size, and number of bubbles all influence how a volcano might behave after an earthquake. Depending on the volcano, some earthquakes could trigger volcanic eruptions within weeks, others might take years.
The results indicate that the historically documented increase in the number of volcanic eruptions after an earthquake has an explanation and is not just coincidence.
Reference:
Atsuko Namiki, Eleonora Rivalta, Heiko Woith, Thomas R. Walter. Sloshing of a bubbly magma reservoir as a mechanism of triggered eruptions. Journal of Volcanology and Geothermal Research, 2016; DOI: 10.1016/j.jvolgeores.2016.03.010
In a 1932 explosion, Quizapu (not visible here) blanketed a huge mountain region with whitish pumice. A small part of the area is seen here, along with prehistoric explosion craters and volcanic peaks. All the features are probably connected somewhere underground. Credit: Kevin Krajick
On a ledge just inside the lip of Chile’s Quizapu volcanic crater, Philipp Ruprecht was furiously digging a trench. Here at an elevation of 10,000 feet, a 1,000-foot plunge loomed just yards away, and wind was whipping dust off his shovel. But the volcanologist was excited. Ruprecht had just found this spot, topped with undisturbed wedding-cake layers of fine, black material that the crater had vomited from the deep earth some 84 years ago. Samples from the currently inactive site might shed light on its exceedingly violent behavior.
In 1846-47, Quizapu (kee-SAH-poo) sent out one of South America’s largest historically recorded lava flows, covering some 20 square miles in giant heaps of rock. Then in 1932, it produced one of the continent’s largest recorded volcanic explosions—a cloud of ash- to boulder-size material that instantly turned some 400 square miles to desert. Today, the roadless, arid region around Quizapu is a volcanic wonder park, looking as if the eruptions happened yesterday. The main visitors are the occasional geologist and a few arrieros—horse-mounted livestock herders—on their way to somewhere else.
Ruprecht, based at Columbia University’s Lamont-Doherty Earth Observatory, has worked in this region for more than a decade. This time, he had brought along six other American and Chilean scientists, and a dozen students. Their eight-day, 40-mile foot trek in February 2016 was aimed at better understanding the forces that drive Quizapu. Ruprecht was also hoping to increase Chile-U.S. scientific collaboration, as well as instruct the students.
Volcanoes are central to life in Chile. Thirty-six have erupted in the last few hundred years, and many more could start up at any time. All are fueled by tectonic plates under the Pacific Ocean floor thrusting deep under the Andes. One spot or another is almost always sputtering to life; in early 2016, it was the Nevados de Chillan complex, south of Quizapu. The capital city of Santiago is built completely on the products of a long-ago super eruption. Chile’s vast copper deposits, which form a third of the world supply, were created by volcanic processes.
Ruprecht’s main question: Why does Quizapu (along with some other volcanoes) erupt in dramatically different ways at different times? In the 19th century, it effused slow-moving lava, but in the 20th, it simply exploded. How can we forecast the difference? Lava flows are threatening—but contrary to popular assumption, almost all volcanic death and destruction comes during explosions like the 1932 event. Chilean scientists monitor Quizapu and other volcanoes for signs of movement, yet they do not completely understand how to interpret the results.
The Quizapu crater lies between two even more gigantic volcanoes: the 12,428-foot Cerro Azul, and 12,970-foot Descabezado Grande. Before the 1840s Quizapu eruption, a major trans-Andean livestock trail passed between these two cone-shaped peaks. Neither has erupted in historical time, but historical time here is relatively short, beginning with the Spanish occupation of the 1500s. The area all around is pocked with huge, young-looking explosion craters and lava flows, all thought to be manifestations of the same active underground complex.
On Nov. 26, 1846, an arriero traversed the pass without noticing anything unusual. But later in the day, a comrade who had stayed behind heard a great noise. This soon evolved into a continuous roar punctuated by cannon-shot explosions, thunder, lighting and blue flames. He was partly enveloped in noxious gases. The noise and fumes soon reached the lowland city of Talca, some 50 miles off. Quizapu had been born. Ten days later, when the arrieros tried to get through the pass, they found it no longer existed. Eventually, it and neighboring valleys were inundated by towering, hardened lava rivers up to 10 miles wide. No one was killed, but the immediate area was now an impassable desert of sharp-edged rock.
In 1907, Quizapu revived, and started kicking out explosions of airborne ash. This continued off and on for years. In 1928, a big earthquake knocked down many of Talca’s old buildings. It may or may not have had any connection to the subsequent eruption of Quizapu.
On April 10, 1932, an unusual grey-green cloud spread out from Quizapu, and the volcano began to bellow like a bull, according to observers. Over the next 24 hours, an umbrella of debris nearly 20 miles high mounted into the skies. Explosions rattled Santiago, 150 miles north. As the cloud collapsed, incandescent pumice rained down—near the crater, boulders the size of pickup trucks, with progressively finer material falling further out. Fine ash reached Rio de Janiero; Cape Town, South Africa, saw strangely colored sunsets, reflected off floating dust. Farms and cities in the lowlands were spared, but all around Quizapu, mountain pastures once grazed by arrieros’ livestock were mantled with pumice, instantly converted to deserts that form an excellent analog to the surface of Mars.
The recent expedition included scientists from Lamont and the universities of Hawaii and Michigan, along with a dozen students from Lamont, the University of Chile (Santiago) and the University of Concepción. Before setting out, the group met in Santiago for a half-day briefing. (Space was provided by the Columbia Global Centers office there; the trip was funded by the Columbia University President’s Global Innovation Fund, which seeks to expand the centers’ work.) The group traveled by bus to Talca, and from there, a couple of hours by paved roads into the mountains.
The bus then turned onto a dirt track and ascended beyond treeline. Soon, we were bumping along the road through a barren landscape of volcanic rocks and cinders. The road dead-ended at Laguna Invernada, a mile-high lake created by a government-owned hydropower dam. Behind it towered the giant mass of Cerro Azul, capped with clouds and a lightning-rod spire of sheer rock. Quizapu itself lay hidden behind the peak. The remote dam, relatively new, is an example of how expanding human infrastructure can run up against natural hazards; when (almost certainly not if) any nearby volcano revives, landslides, lava or ejecta could wreck the whole place in minutes.
From here, the team started its foot journey, hiking several hours up a steep horse track that wound up through surrounding slopes. It was tough walking, through loose, pebbly debris, and it would be repeated every day in this up-and-down landscape. In the steepest parts—which was most parts—it was often two steps forward, one slide back. Finally we emerged through a pass into a hidden valley occupied by another, higher lake, at around 6,200 feet. This lake had been made naturally, when falling volcanic cinders had blocked a creek bed, maybe just a few hundred years ago. Such dead-end drainages are characteristic here—in this arid region, the only places where water collects, and provides a rare oasis.
At the lake, we met a small group of horse-mounted arrieros with strings of pack animals in tow. Ruprecht had hired them to carry our food, water, tents, tools and other heavy stuff that would be impossible for us to lug on foot. They were led by Don Carmelo Adasme, a garrulous man of about 40, whose family has lived in the region for over a century. We ourselves remained on foot, but the journey would have been impossible without the knowledgeable arrieros and their incredibly strong, surefooted horses.
Next day we climbed out of the lake basin along a zigzag route to a higher pass, elevation 8,400 feet. This took much of the day. At the top was a small snowfield and a perfectly barren ridge of dark cinders, swept by a staggering wind. By this time, many of us were struggling to keep climbing, but at the very top, the world changed completely, and it all seemed worth it. Before us lay the world of Quizapu—a precipitous panorama of high peaks, explosion craters and dark lava flows. Much of it seemed covered by snow. Actually, it was not snow, Ruprecht informed us; it was the vast mantle of whitish pumice that Quizapu had spit out. The crater itself still lay out of sight, hidden within the complex topography. We half-slid-half walked down into a deep valley below, and camped for the night.
In the morning, we split into teams, each with a different mission. One was led by Lamont volcanologists Einat Lev and Elise Rumpf. They lugged along a small camera-equipped drone, with which they intended to make high-resolution topographic surveys of the 1846 lava flow. After a long hike, they mounted part of the flow itself, set up the helicopter-like drone, and sent it up. Despite strong winds, they managed to keep the craft aloft during several launches, and it flew a series of preprogrammed grids. That is, until it veered into a mountainside and crashed on a seemingly impossible-to-reach scree slope. The scientists did not flinch. “OK, let’s go get it,” said Rumpf. They half-walked, half-crawled up the slope and a while later returned with the machine. They later repaired it, and it flew without incident on subsequent days.
The following day, the whole group crossed the lava flow’s main arm. Here, you could see the upside to the later pumice eruption: It had conveniently covered much of the lava, making it more or less passable. Craggy masses of volcanic rock still stuck out like islands, but in between was plenty of light, pebbly stuff that people and animals could walk on. A few tufts of alpine grass had even taken root, and lizards darted here and there. “If there was more rainfall around here, this probably would all be revegetated by now, and the geology wouldn’t be visible,” said Ruprecht. “That’s why this is so great.”
On following days, the scientists and students would fan out over the flow to bang off dozens of lava samples with sledge hammers. Chemical analyses would later be combined with drone footage and other data to create a picture of how both the lava flow developed, and why the later, more explosive eruption followed.
Ruprecht favors the idea that just before the 1846 eruption, extremely hot material from the deep earth suddenly flowed up into a chamber of shallow, cooler magma. This addition—it might have only taken days or weeks, he said—may have propelled the whole mass to the surface. But at the same time, it also would have heated the shallower magma and made it less viscous. Less viscosity would mean that pent-up gases could bubble out more easily, so that when the eruption did surface, it was as a relatively benign liquid. Intact crystals of rare deep-earth minerals in the lava samples we took reinforce this idea. So do earlier chemical analyses showing that the 1846 material was much hotter than the 1932 stuff. The 1932 eruption appears not to have gotten any heating from below; it just built up on its own, until trapped gases and everything else finally escaped in one stupendous blowout.
“You would not want to be here when that happened,” said Ruprecht. “You would either be burned or buried alive, but you wouldn’t have much choice about which came first.”
After crossing the lave flow, we descended into a rare green valley where gurgling warm springs emerged from the rocks—probably a product of ongoing magmatic activity below. It was also the trip’s only chance to bathe. On a far ridge stood the area’s only permanent human infrastructure—a transmitter for a seismometer used by government scientists to detect rumblings that might signal renewed trouble.
The following day, we hiked back up the lava flow and made a waterless camp at 7,500 feet—staging point for the final climb to the mouth of Quizapu. Next morning, we trekked upward through an increasingly blasted landscape. All signs of life disappeared, but for a couple of giant condors wafting on winds high above. The pebbly pumice gave way to ever-larger chunks—head-size, body-size and, near the still-invisible crater’s foot, pickup-truck-size. The final steep rubble slope around the rim was almost impossible to mount: rocks sliding underfoot, constant wind driving dust in our faces, and ever-thinner air. One scientist later admitted to crying on the way up. Ruprecht was exultant.
Instantly upon reaching the rim, we were looking into the volcano’s half-mile wide eye. It pierced innumerable jumbled layers of rock, twisted into crazy angles by the force of its last eruption. Wind was gusting hard enough to hurl a person into the abyss. Cautiously, people crept to the edge and lay down flat to inspect the depths. Presently Ruprecht and Julia Hammer, a geologist at the University of Hawaii, walked to a spot where they could safely climb inside the crater a few dozen feet along a sloped ledge covered with fine, black material. This, they said, was the terminal scoria—the very last huffs from the volcano before it stopped. For them, scientific gold. They shoveled samples of the stuff into a couple of sturdy plastic bags. We all descended for lunch and a long rest in a more sheltered spot. Then, the long hike back to camp. The round trip had taken nine hours.
The next day, we walked down the great lava flow to lower ground, taking rock samples all the way. At a rushing river, we met the arrieros, who had brought a welcome addition: strings of fresh horses, one for each person to ride. Never mind that many of us had rarely or never ridden a horse; the animals and the arrieros knew what they were doing. After a spectacular climb toward another pass, we were borne to a meadow hidden in a high canyon. As night came, the horsemen butchered a lamb and roasted it on a fire. To go along with it, wine and shots of pisco were passed around. Don Carmelo kept everyone laughing with a long stream of stories and jokes.
In the morning, the horses took us over a sawtooth series of passes, to a long downward dip in the landscape. From here, we could see the green of trees looming ahead. The nearest town was still miles off, but Quizapu already seemed far behind, still holding its breath.
Panoramic photograph looking west of the Riasi fault system. For scale, an elevation of 300 m separates an older river terrace, the Bidda terrace, to the modern Chenab River. Credit: Yann Gavillot, OSU
New geologic mapping in the Himalayan mountains of Kashmir between Pakistan and India suggests that the region is ripe for a major earthquake that could endanger the lives of as many as a million people.
Scientists have known about the Riasi fault in Indian Kashmir, but it wasn’t thought to be as much as a threat as other, more active fault systems. However, following a magnitude 7.6 earthquake in 2005 on the nearby Balakot-Bagh fault in the Pakistan side of Kashmir – which was not considered particularly dangerous because it wasn’t on the plate boundary – researchers began scrutinizing other fault systems in the region.
What they found is that the Riasi fault has been building up pressure for some time, suggesting that when it does release or “slip,” the resulting earthquake may be large – as much as magnitude 8.0 or greater.
Results of the new study, which was funded by the National Science Foundation, have been accepted for publication by the Geological Society of America Bulletin, and published online.
“What we set out to learn was how much the fault has moved in the last tens of thousands of years, when it moved, and how different segments of the fault move,” said Yann Gavillot, lead author on the study who did much of the work as a doctoral student at Oregon State University. “What we found was that the Riasi fault is one of the main active faults in Kashmir, but there is a lack of earthquakes in the more recent geologic record.
“The fault hasn’t slipped for a long time, which means the potential for a large earthquake is strong. It’s not a question of if it’s going to happen. It’s a matter of when.”
There is direct evidence of some seismic activity on the fault, where the researchers could see displacement of the Earth where an earthquake lifted one section of the fault five or more meters – possibly about 4,000 years ago. Written records from local monasteries refer to strong ground-shaking over the past several thousand years.
But the researchers don’t have much evidence as to how frequent major earthquakes occur on the fault, or when it may happen again.
“The Riasi fault isn’t prominent on hazard maps for earthquake activity, but those maps are usually based more on the history of seismic activity rather than the potential for future events,” said Andrew Meigs, a geology professor in OSU’s College of Earth, Ocean, and Atmospheric Sciences and co-author on the study. “In actuality, the lack of major earthquakes heightens the likelihood that seismic risk is high.”
The researchers say 50 percent of the seismic “budget” for the fault can be accounted for with the new information. The budget is determined over geologic time by the movement of the tectonic plates. In that region, the India tectonic plate is being subducted beneath the Asia plate at a rate of 14 millimeters a year; the Riasi fault accounts for half of that but has no records of major earthquakes since about 4,000 years ago, indicating a major slip, and earthquake, is due.
“In the last 4,000 years, there has only been one major event on the Riasi fault, so there is considerable slip deficit,” Meigs said. “When there is a long gap in earthquakes, they have the potential to be bigger unless earthquakes on other faults release the pressure valve. We haven’t seen that. By comparison, there have been about 16 earthquakes in the past 4,000 years in the Cascadia Subduction Zone off the Northwest coast of the United States.”
Gavillot said a major earthquake at the Riasi fault could have a major impact on Jammu, the Indian capital of the Indian state of Jammu and Kashmir, which has a population of about 1.5 million people. Another 700,000 people live in towns located right on the fault.
“There are also several dams on the Chenab River near the fault, and a major railroad that goes through or over dozens of tunnels, overpasses and bridges,” Gavillot said. “The potential for destruction is much greater than the 2005 earthquake.”
The 2005 Kashmir earthquake killed about 80,000 people in Pakistan and India.
Reference:
Y. Gavillot et al. Shortening rate and Holocene surface rupture on the Riasi fault system in the Kashmir Himalaya: Active thrusting within the Northwest Himalayan orogenic wedge, Geological Society of America Bulletin (2016). DOI: 10.1130/B31281.1
There are currently three salt mines Realmonte in the province of Agrigento and Racalmuto and Petralia, in the province of Palermo, managed by the company Italkali . The Realmonte field, overlooking the southern coast of Sicily, about four kilometers from Agrigento and a kilometer from Porto Empedocle, Italy.
It consists of a vast saline lens, aligned according to the coast, which runs between Porto Empedocle and Siculiana. The layers of rock salt and kainite dive on a regular basis from the mountain to the sea, with rock salt stratificamente roof of kainite and with an output of up to 40 meters and a title in sodium chloride between 97 and 98%. reserves have been established for about 100 million tonnes of rock salt and confirmed the presence of significant amounts of potassium minerals that have been developed programs for industrial exploitation.
Realmonte is able to produce about 500 thousand tons per year of salt. Racalmuto, in the last century became an important mining center and had some increase also the salt industry. Important role in the local economy is provided by the salt mines. The mine is located about 2 km from Racalmuto, located almost at the limit between the provinces of Agrigento and Caltanissetta.
The field
The mine is accessible through camionabili tunnels and ramps and reaches approximately 100 m deep. A well, placed in a central position with respect to the cultivation area, ensures the exchange of air in the subsoil at a rate of 1140 m³ / second. The mineral production lines are two: – the salt intended for direct food and the food industry and animal consumption; – The industrial salt destined mainly to tanneries and dyeing. The food is grown rock salt with a continuous miner, which automatically transfers it to the edge of Perlini trucks (big trucks) and transfer it to a place silos outside of the mine.
The extraction
The industrial rock salt is shot down with sprints of mines. Crushing plants, comminution and screening, packaging of cartons containing 1 kg bags of 25 kg and 50 are located outside of the mine. The production of salt is carried out in three shifts: from 7:00 to 3:00 p.m. to 3:00 p.m. 11:00 p.m. to 23:00 – 7:00 pm. Today, compared to the past, the salt mines are safer, as in the galleries “at risk” is introduced a remotely controlled electric shovel.
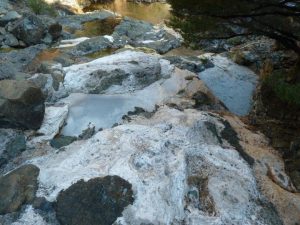
Marble Bar sediments, a microcrystalline silicone-rich chert. Credit: A. Glikson
Scientists have found evidence of a huge asteroid that struck the Earth early in its life with an impact larger than anything humans have experienced.
Tiny glass beads called spherules, found in north-western Australia were formed from vaporised material from the asteroid impact, said Dr Andrew Glikson from The Australian National University (ANU).
“The impact would have triggered earthquakes orders of magnitude greater than terrestrial earthquakes, it would have caused huge tsunamis and would have made cliffs crumble,” said Dr Glikson, from the ANU Planetary Institute.
“Material from the impact would have spread worldwide. These spherules were found in sea floor sediments that date from 3.46 billion years ago.”
The asteroid is the second oldest known to have hit the Earth and one of the largest.
Dr Glikson said the asteroid would have been 20 to 30 kilometres across and would have created a crater hundreds of kilometres wide.
About 3.8 to 3.9 billion years ago the moon was struck by numerous asteroids, which formed the craters, called mare, that are still visible from Earth
“Exactly where this asteroid struck the earth remains a mystery,” Dr Glikson said.
“Any craters from this time on Earth’s surface have been obliterated by volcanic activity and tectonic movements.”
Dr Glikson and Dr Arthur Hickman from Geological Survey of Western Australia found the glass beads in a drill core from Marble Bar, in north-western Australia, in some of the oldest known sediments on Earth.
The sediment layer, which was originally on the ocean floor, was preserved between two volcanic layers, which enabled very precise dating of its origin.
Dr Glikson has been searching for evidence of ancient impacts for more than 20 years and immediately suspected the glass beads originated from an asteroid strike.
Subsequent testing found the levels of elements such as platinum, nickel and chromium matched those in asteroids.
There may have been many more similar impacts, for which the evidence has not been found, said Dr Glikson.
“This is just the tip of the iceberg. We’ve only found evidence for 17 impacts older than 2.5 billion years, but there could have been hundreds”
“Asteroid strikes this big result in major tectonic shifts and extensive magma flows. They could have significantly affected the way the Earth evolved.”
The research is published in the journal Precambrian Research.
Reference:
Andrew Glikson, Arthur Hickman, Noreen J. Evans, Christopher L. Kirkland, Jung-Woo Park, Robert Rapp, Sandra Romano. A new ∼3.46Ga asteroid impact ejecta unit at Marble Bar, Pilbara Craton, Western Australia: A petrological, microprobe and laser ablation ICPMS study. Precambrian Research, 2016; 279: 103 DOI: 10.1016/j.precamres.2016.04.003
This is a view of Earth’s atmosphere taken from the International Space Station in 2003. Credit: Photo courtesy of ISS Expedition 7 Crew, EOL, NASA
Earth scientists from Rice University, Yale University and the University of Tokyo are offering a new answer to the long-standing question of how our planet acquired its oxygenated atmosphere.
Based on a new model that draws from research in diverse fields including petrology, geodynamics, volcanology and geochemistry, the team’s findings were published online this week in Nature Geoscience. They suggest that the rise of oxygen in Earth’s atmosphere was an inevitable consequence of the formation of continents in the presence of life and plate tectonics.
“It’s really a very simple idea, but fully understanding it requires a good bit of background about how Earth works,” said study lead author Cin-Ty Lee, professor of Earth science at Rice. “The analogy I most often use is the leaky bathtub. The level of water in a bathtub is controlled by the rate of water flowing in through the faucet and the efficiency by which water leaks out through the drain. Plants and certain types of bacteria produce oxygen as a byproduct of photosynthesis. This oxygen production is balanced by the sink: reaction of oxygen with iron and sulfur in Earth’s crust and by back-reaction with organic carbon. For example, we breathe in oxygen and exhale carbon dioxide, essentially removing oxygen from the atmosphere. In short, the story of oxygen in our atmosphere comes down to understanding the sources and sinks, but the 3-billion-year narrative of how this actually unfolded is more complex.”
Lee co-authored the study with Laurence Yeung and Adrian Lenardic, both of Rice, and with Yale’s Ryan McKenzie and the University of Tokyo’s Yusuke Yokoyama. The authors’ explanations are based on a new model that suggests how atmospheric oxygen was added to Earth’s atmosphere at two key times: one about 2 billion years ago and another about 600 million years ago.
Today, some 20 percent of Earth’s atmosphere is free molecular oxygen, or O2. Free oxygen is not bound to another element, as are the oxygen atoms in other atmospheric gases like carbon dioxide and sulfur dioxide. For much of Earth’s 4.5-billion-year history, free oxygen was all but nonexistent in the atmosphere.
“It was not missing because it is rare,” Lee said. “Oxygen is actually one of the most abundant elements on rocky planets like Mars, Venus and Earth. However, it is one of the most chemically reactive elements. It forms strong chemical bonds with many other elements, and as a result, it tends to remain locked away in oxides that are forever entombed in the bowels of the planet — in the form of rocks. In this sense, Earth is no exception to the other planets; almost all of Earth’s oxygen still remains locked away in its deep rocky interior.”
Lee and colleagues showed that around 2.5 billion years ago, the composition of Earth’s continental crust changed fundamentally. Lee said the period, which coincided with the first rise in atmospheric oxygen, was also marked by the appearance of abundant mineral grains known as zircons.
“The presence of zircons is telling,” he said. “Zircons crystallize out of molten rocks with special compositions, and their appearance signifies a profound change from silica-poor to silica-rich volcanism. The relevance to atmospheric composition is that silica-rich rocks have far less iron and sulfur than silica-poor rocks, and iron and sulfur react with oxygen and form a sink for oxygen.
“Based on this, we believe the first rise in oxygen may have been due to a substantial reduction in the efficiency of the oxygen sink,” Lee said. “In the bathtub analogy, this is equivalent to partially plugging the drain.”
Lee said the study suggests that the second rise in atmospheric oxygen was related to a change in production — analogous to turning up the flow from the faucet.
“The bathtub analogy is simple and elegant, but there’s an added complication that must be taken into account,” he said. “That is because oxygen production is ultimately tied to the global carbon cycle — the cycling of carbon between Earth, the biosphere, the atmosphere and oceans.”
Lee said the model showed that Earth’s carbon cycle has never been at a steady state because carbon slowly leaks out as carbon dioxide from Earth’s deep interior to the surface through volcanic activity. Carbon dioxide is one of the key ingredients for photosynthesis.
“On long, geologic timescales, carbon is removed from the atmosphere by the production of condensed forms of carbon, such as organic carbon and minerals called carbonate,” he said. “For most of Earth’s history, most of this carbon has been deposited not in the deep ocean but rather on the margins of continents. The implications are profound because carbon deposited on continents does not return to Earth’s deep interior. Instead, it amplifies carbon inputs into the atmosphere when the continents are subsequently perturbed by volcanism.”
Lee said the team’s model showed that volcanic activity and other geologic inputs of carbon into the atmosphere may have increased with time, and because oxygen production is tied to carbon production, oxygen production also must increase. The model showed that the second rise in atmospheric oxygen had to occur late in Earth’s history.
“Exactly when is model-dependent, but what is clear is that the formation of continental crust naturally leads to two rises in atmospheric oxygen, just as we see in the fossil record,” Lee said.
Exactly what caused the composition of the crust to change during the first oxygenation event remains a mystery, but Lee said the team believes it may have been related to the onset of plate tectonics, where Earth’s surface, for the first time, became mobile enough to sink back down into Earth’s deep interior.
Lee said the team’s new model is not without controversy. For example, the model predicts that production of carbon dioxide must increase with time, a finding that goes against the conventional wisdom that carbon fluxes and atmospheric carbon dioxide levels have steadily decreased over the last 4 billion years.
“The change in flux described by our model happens over extremely long time periods, and it would be a mistake to think that these processes that are bringing about any of the atmospheric changes are occurring due to anthropomorphic climate change,” he said. “However, our work does suggest that Earth scientists and astrobiologists may need to revisit what we think we know about Earth’s early history.”
Reference:
Cin-Ty A. Lee, Laurence Y. Yeung, N. Ryan McKenzie, Yusuke Yokoyama, Kazumi Ozaki, Adrian Lenardic. Two-step rise of atmospheric oxygen linked to the growth of continents. Nature Geoscience, 2016; DOI: 10.1038/ngeo2707
With the right mix of nutrients, phytoplankton grow quickly, creating blooms visible from space. This image, created from MODIS data, shows a phytoplankton bloom off New Zealand. Credit: Robert Simmon and Jesse Allen/NASA
Over the past half-million years, the equatorial Pacific Ocean has seen five spikes in the amount of iron-laden dust blown in from the continents. In theory, those bursts should have turbo-charged the growth of the ocean’s carbon-capturing algae – algae need iron to grow – but a new study shows that the excess iron had little to no effect.
The results are important today, because as groups search for ways to combat climate change, some are exploring fertilizing the oceans with iron as a solution.
Algae absorb carbon dioxide (CO2), a greenhouse gas that contributes to global warming. Proponents of iron fertilization argue that adding iron to the oceans would fuel the growth of algae, which would absorb more CO2 and sink it to the ocean floor. The most promising ocean regions are those high in nutrients but low in chlorophyll, a sign that algae aren’t as productive as they could be; the Southern Ocean, the North Pacific, and the equatorial Pacific all fit that description. What’s missing, proponents say, is enough iron.
The new study, published this week in the Proceedings of the National Academy of Sciences, adds to growing evidence, however, that iron fertilization might not work in the equatorial Pacific as suggested.
Essentially, earth has already run its own large-scale iron fertilization experiments. During the ice ages, nearly three times more airborne iron blew into the equatorial Pacific than during non-glacial periods, but the new study shows that that increase didn’t affect biological productivity. At some points, as levels of iron-bearing dust increased, productivity actually decreased.
What matters instead in the equatorial Pacific is how iron and other nutrients are stirred up from below by upwelling fueled by ocean circulation, said lead author Gisela Winckler, a geochemist at Columbia University’s Lamont-Doherty Earth Observatory. The study found seven to 100 times more iron was supplied from the equatorial undercurrent than from airborne dust at sites spread across the equatorial Pacific. The authors write that, although all of the nutrients might not be used immediately, those nutrients are used up over time, so the biological pump is already operating at full efficiency.
“Capturing carbon dioxide is what it’s all about: does iron raining in with airborne dust drive the capture of atmospheric CO2? We found that it doesn’t, at least not in the equatorial Pacific,” Winckler said.
The new findings don’t rule out iron fertilization elsewhere. Winckler and coauthor Robert Anderson of Lamont-Doherty Earth Observatory are involved in ongoing research that is exploring the effects of iron from dust on the Southern Ocean, where airborne dust supplies a larger share of the iron reaching the surface.
Iron fertilization experiments and risks
Past experiments with iron fertilization have had mixed results. The European Iron Fertilization Experiment (EIFEX) in 2004, for example, added iron in the Southern Ocean and was able to produce a burst of diatoms, which captured CO2 in their organic tissue and sank to the ocean floor. However, the German-Indian LOHAFEX project in 2009 experimented in a nearby location in the South Atlantic and found few diatoms. Instead, most of its algae were eaten up by tiny marine creatures, passing CO2 into the food chain rather than sinking it. In the LOHAFEX case, the scientists determined that another nutrient that diatoms need – silicic acid – was lacking.
The Intergovernmental Panel on Climate Change (IPCC) cautiously discusses iron fertilization in its latest report on climate change mitigation options. It also warns of potential risks, including the impact that higher productivity in one area may have in sapping nutrients needed by marine life downstream, and the potential for expanding low-oxygen dead zones, increasing acidification of the deep ocean, and increasing nitrous oxide, a greenhouse gas more potent than CO2.
Measuring algae growth 500,000 years ago
The PNAS paper follows another paper Winckler and Anderson coauthored earlier this year in Nature with Lamont graduate student Kassandra Costa looking at the biological response to iron in the equatorial Pacific during just the last glacial maximum, some 20,000 years ago. The new paper expands that study from a snapshot in time to a time series across the past 500,000 years. It confirms that Costa’s finding, that iron fertilization had no effect then, fit a pattern that extends across the past five glacial periods.
To gauge how productive algae were in the past, the scientists in the new PNAS paper used deep-sea sediment cores from three locations in the equatorial Pacific that captured 500,000 years of ocean history. They tested along those cores for barium, a measure of how much organic matter is exported to the sea floor at each point in time, and for opal, a silicate mineral that comes from diatoms. Measures of thorium-232 reflected the amount of dust that blew in from land at each point in time.
“Neither natural variability of iron sources in the past nor purposeful addition of iron to equatorial Pacific surface water today, proposed as a mechanism for mitigating the anthropogenic increase in atmospheric CO2 inventory, would have a significant impact,” the authors concluded. The other co-authors are of the paper are Samuel Jaccard of the University of Bern, Switzerland, and Franco Marcantonio of Texas A&M University.
“While it is well recognized that atmospheric dust plays a significant role in the climate system by changing planetary albedo, the study by Winckler et al. convincingly shows that dust and its associated iron content is not a key player in regulating the oceanic sequestration of CO2 in the equatorial Pacific on large spatial and temporal scales,” said Stephanie Kienast, a marine geologist and paleoceanographer at Dalhousie University who was not involved in the study. “The classic paradigm of ocean fertilization by iron during dustier glacials can thus be rejected for the equatorial Pacific, similar to the Northwest Pacific.”
Reference:
Gisela Winckler, Robert F. Anderson, Samuel L. Jaccard, and Franco Marcantonio. Ocean dynamics, not dust, have controlled equatorial Pacific productivity over the past 500,000 years. PNAS, May 16, 2016 DOI: 10.1073/pnas.1600616113