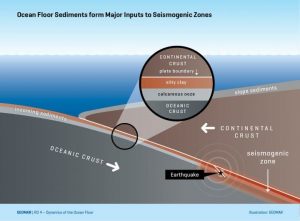
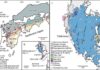
Schematic diagram of a subduction zone with sediments structure Credit: C. Kersten GEOMAR
Where a tectonic plate dives under another, in the so-called subduction zones at ocean margins, many strong earthquakes occur. Especially the earthquakes at shallow depths often cause tsunamis. How exactly are such earthquakes initiated? Which rock composition favours a break in the earth’s interior that can lead to such natural disasters? Scientists at GEOMAR Helmholtz Centre for Ocean Research Kiel and the University of Utrecht (NL) published a study in the scientific journal Nature Geoscience which points to earthquake nucleation in calcareous sediments.
The effects of earthquakes are often severe and highly visible. They can destroy homes, induce slope failures and trigger tsunamis. The main cause for earthquakes are the stresses that occur in the Earth’s interior, when two tectonic plates pass each other and interlock during this process. But even the worst earthquake starts with a very small first crack in the rock from which a large fracture can develop. So far it was assumed that initial cracks for earthquakes mainly occur in clay-rich sediments. Scientists at GEOMAR Helmholtz Centre for Ocean Research Kiel and the University of Utrecht (NL) were now able to prove that under certain conditions calcareous sediments are the most likely candidates for the first breakage of an earthquake. The study is published today in the international journal Nature Geoscience.
For their investigations the scientists used samples obtained during two expeditions in 2011 and 2012 with the US drillship JOIDES RESOLUTION off the coast of Costa Rica. There the Pacific Cocos plate is subducted beneath the Caribbean plate. In the past this has repeatedly led to severe earthquakes in this region. “The aim of the Costa Rica Seismogenesis Project (CRISP) was to obtain information about the structure of the subducting and the overriding plate using drill cores” Dr. Michael Stipp from GEOMAR, initiator and second author of the current research study, explains.
During subduction the Cocos Plate carries its overlying sediments downwards, which are thus sandwiched between the plates. “Off the coast of Costa Rica, the seismogenic zone that is the zone where earthquakes are generated along the plate boundary, starts already in an exceptionally shallow depth of about five to six kilometres. This is right in these subducted sediments,” Robert Kurzawski states, PhD student at GEOMAR and first author of the study.
However, the sediments usually show variable compositions. Off the coast of Costa Rica and in most subduction zones in the tropical and subtropical area both clayey and calcareous sediment layers are found. Due to the drill cores obtained from JOIDES RESOLUTION the scientist could investigate samples exactly from these sediment layers. In the “Rock Mechanics Laboratory” of the University of Utrecht they brought the samples to conditions that prevail at depth, where shallow earthquakes occur. “These conditions include an increased pressure, temperatures of about 100 degrees Celsius and finally shear movements,” Dr. Stipp explains.
Since the clay sediments are considered mechanically weak, it was assumed that the first cracks would be formed in these when the subsurface stresses are large enough. In the experiments, it became clear that the clay-rich sediments from Costa Rica in contrast to the calcareous sediments react less sensitive to changes in stress, temperature and especially pore pressure. The calcareous sediments, however, change their frictional properties significantly during the increase in temperature and pore pressure. “Exactly at the conditions which are expected for shallow earthquakes the chalks suddenly got unstable and weaker than the clayey material. With these properties the calcareous sediments form the predetermined breaking point in the rock sequence, ” Robert Kurzawski explains.
These results are particular interesting, because calcareous sediments are typical and widespread especially for tropical and subtropical oceans and thus occur at many subduction zones around the Pacific, but also in the Caribbean and Mediterranean Sea. “Of course we still do not know all the processes that can trigger earthquakes. But we have demonstrated by this study that material properties cannot simply be extrapolated from surface conditions to those at greater depth. Therefore, further drilling, especially in the framework of the International Ocean Discovery Program (IODP), is required to learn more about the earthquake processes at depth, ” Michael Stipp concludes.
Reference:
Kurzawski, R. M., M. Stipp, A. R. Niemeijer, C. J. Spiers, J. H. Behrmann. Earthquake nu-cleation in weak subducted carbonates. Nature Geoscience, 2016 DOI: 10.1038/ngeo2774
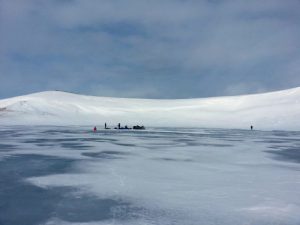
A research team sets up on a frozen lake on St. Paul Island. Credit: Photo courtesy Matthew Wooller
A remnant population of woolly mammoths on a remote Alaska island was likely pushed to extinction by rising sea levels and a lack of access to fresh water, according to a newly published study.
By analyzing layers of a dated sediment core from a lake on St. Paul Island, researchers determined that mammoths went extinct on the island roughly 5,600 years ago, thousands of years after remnant mainland populations died off. The study also indicated that the Bering Sea island experienced a phase of dry conditions and declining water quality at about the same time the mammoths vanished.
The results were published today in the Proceedings of the National Academy of Sciences.
Matthew Wooller, director of the Alaska Stable Isotope Facility at the University of Alaska Fairbanks and a co-author of the study, said past events on St. Paul Island provided a unique opportunity for research. Mammoths were trapped there when rising sea levels submerged the Bering Sea land bridge, and survived about 5,000 years longer than isolated mainland populations. There is no evidence of people having lived on the island during the era.
In 2013, a team of researchers collected a sediment core from the bed of one of the few freshwater lakes on St. Paul Island. Wooller and fellow UAF researcher Kyungcheol Choy measured the stable oxygen isotope ratios of the prehistoric remains of aquatic insects preserved in the sediment from before, during and after the extinction of mammoths from the island.
The remains of aquatic organisms living in lakes retain water isotope signatures within their bodies, which allowed researchers studying their exoskeletons to determine that lake levels had diminished. The remains of diatoms and aquatic invertebrates from the core also changed over time, indicating decreasing lake levels and water quality leading up to the mammoth extinction.
Nitrogen isotope analyses of dated mammoth bones and teeth also signaled progressively drier conditions leading up to the extinction event. Wooller said these “multiple lines of evidence” of decreasing lake levels provide a strong case for what led to the animals’ extinction.
“It paints a dire picture of the situation for these mammoths,” Wooller said. “Freshwater resources look like the smoking gun for what pushed them into this untenable situation.”
The study not only determined one of the best-dated prehistoric extinctions, using state-of-the-art techniques on ancient mammoth DNA preserved in the lake core from St. Paul Island, it also showed the vulnerability of small island populations to environmental change.
St. Paul Island gradually shrank to its current size of 110 square kilometers as sea levels rose, reducing the opportunities for mammoths to find new areas with water. Conditions incrementally changed for about 2,000 years before mammoths went extinct.
Modern climate change could shift conditions more rapidly, which could make the story of prehistoric St. Paul Island relevant today, Wooller said.
The project included a collaborative group of researchers from across the U.S. and Canada, led by Russ Graham from Pennsylvania State University. It included contributions from a UAF team that included Wooller, Choy, Ruth Rawcliffe and Emilie Saulnier-Talbot. Beth Shapiro and Peter Heintzman of the University of California, Santa Cruz, analyzed mammoth DNA from the St. Paul Island lake core.
The work was supported by a grant from the National Science Foundation.
Reference:
Russell W. Graham, Soumaya Belmecheri, Kyungcheol Choy, Brendan J. Culleton, Lauren J. Davies, Duane Froese, Peter D. Heintzman, Carrie Hritz, Joshua D. Kapp, Lee A. Newsom, Ruth Rawcliffe, Émilie Saulnier-Talbot, Beth Shapiro, Yue Wang, John W. Williams, and Matthew J. Wooller. Timing and causes of mid-Holocene mammoth extinction on St. Paul Island, Alaska. Proceedings of the National Academy of Sciences, 2016; DOI: 10.1073/pnas.1604903113
The images show a 600-million-year old phosphatized animal embryo undergoing discoidal cell division. The size of the embryo is about 510 micron in diameter. The images are three-dimensional reconstructions based on volume data collected by high-resolution phase contrast synchrotron radiation X-ray microtomography (voxel size is 0.56 micron). The images were produced by Dr. Zongjun Yin, Nanjing Institute of Geology and Palaeontology, Chinese Academy of Sciences. Higher resolution versions are available. Credit: Geology and Dr. Zongjun Yin, Nanjing Institute of Geology and Palaeontology, Chinese Academy of Sciences.
The origin and early evolution of animals have been a fascinating topic since Charles Darwin. Definite early animal fossils largely appear from early Cambrian, so the fossil records are often interpreted as documenting a “Cambrian explosion” of animals. The phosphatized embryo-like fossils displaying cellular and subcellular structures from Ediacaran Doushantuo Formation, South China, provide an unparalleled snapshot of life before the Cambrian.
Because the fossils are from the interval in which animal clades were diversifying, according to molecular estimates, they were thought to have great potential to reveal the evolution of animals 600 million years ago. However, the affinities of these fossils are contentious.
In their article for Geology, Zongjun Yin and colleagues report new Doushantuo embryo-like fossils. They used high-resolution synchrotron radiation X-ray microtomography to reconstruct three-dimensional structures of the fossils, and the results demonstrate that these fossils preserve unique features directly comparable to living animal embryos that utilize a special kind of cell division pattern known as discoidal cleavage. Given that discoidal cleavage only occurs in animal embryos, the biological affinities of these fossils are probably animals.
This result substantiates the conclusion derived from molecular estimates that animal lineages had evolved by the mid-Ediacaran after the termination of the Marinoan Glaciation, if not earlier.
Reference:
Meroblastic cleavage identifies some Ediacaran Doushantuo (China) embryo-like fossils as metazoans, Zongjun Yin et al.DOI: 10.1130/G38262.1
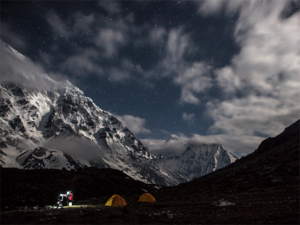
Research base camp in the Langtang region at the foot of high mountains.
Different mountain ranges are bound to experience climate change differently. Researchers from ETH Zurich and Utrecht University have shown this to be the case in a recent study, which was funded by the Swiss National Science Foundation and published in the specialist journal PNAS. In the course of their study, the researchers examined the full water balance of two comparable mountainous regions – one in Nepal, the other in Chile – in the context of climate change.
To calculate and compare each region’s water balance, the researchers created a new and very extensive model of the upper Langtang valley in Nepal and the Juncal region of the central Andes in Chile. Both are important water catchment areas for the millions of people who live in the surrounding lowlands. The areas being studied feature peaks that ascend to over 6,000 metres and also glaciers. Climate models for the remainder of the century indicate that both regions will experience similar increases in annual mean temperatures – the milder scenarios predict a rise of one to three degrees, the more extreme as much as four to six degrees.
Drier, and less river discharge
Using their model, the researchers can now show that despite these similarities, the water balance in the two regions is likely to develop differently.
The Juncal region is set to become even drier in the future. During the dry season, which is already quite long, river water will become scarce. According to their calculations, the researchers still expect water discharge to remain at current levels in the period from 2010 to 2030. However, after that, there will be a steady decline in the amount of water available. So in an extreme scenario, water discharge from the entire catchment area in the Juncal region could shrink to a third of the current level by the year 2100.
Over in the upper Langtang valley, the picture looks quite different. Using data from 2001 to 2010 as a comparison, all climate scenarios indicate that in the first half of this century, water discharge will increase; in the extreme scenario, by as much as 70 percent. Maximum discharge could be reached by around 2050 to 2060, after which discharge is expected to remain the same or drop steadily as we move towards the year 2100.
Glaciers are key for discharge levels
Just how much water is carried by streams and rivers ultimately depends on the fates of the local glaciers. Glaciers in both test areas are going to shrink. Depending on the climate scenario, those in the Juncal region could diminish by up to 70 percent; in Langtang, the more extreme predictions indicate a loss of “only” 55 percent.
In turn, the different degrees of glacial melt will also lead to differing scenarios in terms of water discharge: in Langtang, the proportion of glacial melt in the discharge will increase and peak by 2050 before receding. In Juncal, glacial melt already peaked before 2010, and now the proportion of discharge from glacial melt is dropping steadily – a trend that is set to continue until the end of the century.
The researchers put this down to the fact that the two glaciers are not at the same distance above sea level. In Langtang, many glaciers are situated at very high altitudes. Once they melt at some point in the future, this meltwater will then replace that which today comes from glaciers lower down. What’s more, the tongues of many glaciers in Langtang are covered in massive layers of rock debris; these insulate the glaciers, which then recede less quickly. In Juncal, however, the highest glaciers are already melting, as they are situated lower than those in the Himalayas.
Increased rain and less snow are leading to floods and seasonal dry spells
The new model also indicates that Langtang could be in for increased rainfall in the future, which will exacerbate the effect the increasing glacier melt is having on water discharge. But this is not the case in Chile, where the drought in the summer months of December to March will get worse. Today, farmers in Chile’s most fertile regions use meltwater to irrigate their fields. “If the upper basins of rivers deliver less water in the future, it will be essential to take action to encourage conservation of the country’s water reserves,” says corresponding author Silvan Ragettli, post-doctoral student at the Institute of Environmental Engineering at ETH Zurich.
In contrast, efforts in the Nepalese Himalayas will have to focus on flood management. Climate change will mean higher snow lines. This will increase the amount of rain that falls in high elevations. “Increased precipitation in the form of rain means that water runs off immediately, which in turn can lead to massive flooding,” says Ragettli.
New model also enables regional predictions
“What’s new and unique about our model is that it can realistically illustrate many different processes,” says Ragettli. For instance, it can take into account a whole range of factors that are decisive for hydrology, such as rain and snow volume, evaporation, groundwater and also the ways in which glaciers expand and experience changes in volume. In their intensive field work, the researchers gathered local measurement data so they could create the model for the areas they are studying. This enables them to make precise predictions for how the water balance is likely to shift.
The researchers began their study back in 2005, when they made the first ETH expedition to the Chilean Andes. Measurement work began in the Langtang valley in 2012 in collaboration with Utrecht University and ICIMOD, an international organisation based in Kathmandu that is committed to sustainable development in the Himalayan region. Up to now, there has been no systematic collection of climate and water measurement data in either test region, which is why the researchers first had to establish measurement stations there.
The Andes and the Himalayas were chosen because existing models for these regions were very imprecise. The study the researchers have now published showed that the previous models were too rough to provide reliable projections for the mountainous regions that surround urban centres in Chile and Nepal.
Reference:
Ragettli S, Immerzeel WW, Pellicciotti F. Contrasting climate change impact on river flows from high-altitude catchments in the Himalayan and Andes Mountains. PNAS,, 1 August 2016 DOI: 10.1073/pnas.1606526113
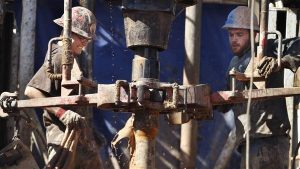
Oil field workers drill the Gypsum Hills in Kansas. A byproduct of fracking for oil in states like Kansas and Oklahoma is a sharp rise in the number of earthquakes — a danger states are trying to prevent.
Stopping an earthquake before it starts? It sounds like a feat possible only for a superhero.
But in Kansas and Oklahoma state policymakers are showing that insofar as humans are causing earthquakes, they can stop them, too. After restricting oil and natural gas operations in certain hotspots, Oklahoma is feeling an average of about two earthquakes a day, down from about six last summer, and Kansas is feeling about a quarter of the tremors it once did.
Using a growing body of research, along with trial and error, scientists and state regulators are gradually getting closer to pinpointing the cause of the startling increase in earthquakes in the Central and Eastern U.S., and preventing them.
The general cause, scientists have found, is not drilling, but what happens after, when operators dispose of wastewater that comes up naturally during the oil and gas extraction process. The operators inject the wastewater into disposal wells that go thousands of feet underground, which can increase fluid pressures and sometimes cause faults underneath or nearby to move.
Since March 2015, Kansas and Oklahoma have placed new restrictions on how much wastewater each operator in certain areas can dispose of at a given time.
To gather more data, Oklahoma, Pennsylvania and Texas are expanding their seismic monitoring systems this year, placing permanent stations across the states and moving temporary stations to new hotspots. And Oklahoma and Texas hired more staff or are contracting with scientists to study the geology of areas where earthquakes are occurring, the details of the quakes that happen, and the oil and gas activity that may be associated with them.
About 7 million people across the Central and Eastern U.S. are now at risk of man-made shaking powerful enough to crack walls and rattle items off shelves, according to a one-year United States Geological Survey (USGS) forecast released in March. The report outlined the risk from man-made earthquakes for the first time, listing the states with the highest risk in order as Oklahoma, Kansas, Texas, Colorado, New Mexico and Arkansas.
The tension below ground brought rise to political tension, too. Many of the epicenters are in rural towns in conservative states, which generally shy away from government regulations. The oil industry regulators in Oklahoma and Texas are elected officials, with campaigns often funded in part by contributions from the industry, said Cliff Frohlich, a seismologist with the University of Texas at Austin who has studied man-made quakes in Texas.
In Oklahoma, Republican Gov. Mary Fallin was at first hesitant to connect wastewater disposal with the quakes. Now, she’s taking action. In January, she allotted $1.4 million in state emergency funds to the state’s regulators and scientists to increase the state’s monitoring and research.
“Like many other Oklahoma residents, I have felt my walls shake from earthquakes that have struck our state with increasing frequency over the past few years,” Fallin wrote that month. “I’m committed to funding seismic research, bringing on line advanced technology and more staff to fully support our regulators as they take meaningful action on earthquakes.”
Where to Put the Water
States in the Central U.S. really weren’t ready for earthquakes—they didn’t need to be. From 1973 to 2008, the region saw on average 24 earthquakes of magnitude 3 or larger each year, according to USGS. These are quakes that can cause minor damage or more.
The USGS tallied 1,010 earthquakes in the region last year, a number that has increased steadily from 318 in 2009. Parts of the historically aseismic region, such as northern Oklahoma and southern Kansas, are now as seismically active as California.
“Every scientist working in the midcontinent of the U.S. is pretty confident that the vast majority of these earthquakes are induced,” said Tandis Bidgoli, assistant scientist and geologist for the Kansas Geological Survey. “Especially where you are having swarms of earthquakes.”
The spike corresponds with the drastic increase in oil and gas operators’ use of hydraulic fracturing, or fracking — a technique in which water, sand and chemicals are pumped at high pressures underground, fracturing rock and freeing trapped oil and gas. Fracking has allowed operators to drill in new places and get much more from each site. While fracking itself is rarely the cause of quakes, it is one reason why there is so much more wastewater to dispose of, Bidgoli said.
Injection wells have been safely used for wastewater disposal for decades, with permission from the U.S. Environmental Protection Agency, which has directed operators to bury the water thousands of feet below ground to avoid surface contamination. But now, the agency is looking for other options. In Oklahoma, Fallin created a group in December to study how the wastewater could be recycled or reused.
Meanwhile, scientists are trying to pin down answers: Is the wastewater being buried too deep, or is there too much being buried, or are large amounts being buried too quickly?
The regions most likely to see earthquakes associated with wastewater disposal are areas where there is more water naturally in the ground, such as in south-central Kansas, where extracting one barrel of oil means having to dispose of at least 16 barrels of wastewater, Bidgoli said.
Changing Pressures
States’ responses to the quakes have varied. But scientists and regulators say that’s mostly a good thing, as the geology of each area varies.
Since 2008, Arkansas, Colorado, Ohio and Texas have placed new restrictions on the disposal of wastewater in injection wells, although those haven’t affected operations as broadly as the new rules in Kansas and Oklahoma.
Kansas was studying the issue in 2014 when a magnitude 4.8 earthquake hit southwest of Wichita. That day, Republican Gov. Sam Brownback announced the expansion of the state’s seismic monitoring system. In March 2015, the Kansas Corporation Commission, which regulates the industry, began limiting wastewater disposal in five zones and two counties.
Since then, the state has felt fewer tremors. In the last six months of 2015, there were 39 quakes of magnitude 2.8 or larger, compared to 48 quakes during the last six months of 2014. In the first six months of 2016, only 11 were recorded by USGS. This is probably a result of the new restrictions and the slowdown in oil and gas production, said Rex Buchanan, interim director of the Kansas Geological Survey. The number of oil and gas wells drilled in the state declined almost 64 percent in a year, to 2,080 wells in 2015.
Oklahoma was slower to make sweeping changes, although it first began regulating the wells in 2013. In spring 2015, the state took its first broad approach, asking all operators to prove they weren’t drilling too deep. But when quakes continued to increase, they decided that volume cutbacks were needed. In March, the Oklahoma Corporation Commission began restricting how much wastewater operators dispose of in about 600 of its 3,800 disposal wells, in certain hotspots.
Since the regulations began, Oklahoma operators have drilled a million barrels fewer each day, a decrease driven by both the new rules and low oil and gas prices, said Jeremy Boak, a geologist and director of the Oklahoma Geological Survey.
Oklahoma felt 619 earthquakes of a magnitude of 2.8 or higher from January through June, compared to 701 during the same time last year, according to USGS data.
While state regulators in Kansas and Oklahoma have acknowledged a connection between earthquakes and wastewater injection, the Texas Railroad Commission, which regulates the industry there, has not clearly done so.
The state takes the issue seriously, said Ramona Nye, spokeswoman for the Texas commission. It put in place rules restricting use of disposal wells in areas of seismic activity, hired a seismologist, and gave staff the authority to set volumes and pressures on wells, and shut down a well if there is a correlation between it and a quake.
And Texas Gov. Greg Abbott, a Republican, signed a bill last year to spend $4.5 million on studying the issue. About 26 percent of the earthquakes of magnitude 3 or higher in the state since 1925 were almost certainly induced, according to a new study by Frohlich at the University of Texas at Austin and others.
The funding, which was approved by the governor, will go toward installing 22 permanent stations and buying 36 portable seismometers to monitor seismic activity across the state, along with research run by the University of Texas at Austin.
Regulators in Kansas and Oklahoma say oil and gas companies resisted the new rules at first, but the companies are now cooperative, even helpful, in providing information about their land and operations.
This is mostly because the companies are a part of the communities they work in, said Steve Everley, spokesman for Energy in Depth, an advocacy branch of the industry-backed Independent Petroleum Association of America.
“At the end of the day, they just want the earthquakes to slow down and eventually stop,” Everley said. “If that means do this, or do that, they are willing to do that.”
What’s Next
Despite the cooperation, Kim Hatfield, the president of Crawley Petroleum and a vice chairman of the Oklahoma Independent Petroleum Association, said policymakers should be cautious about imposing restrictions on the industry.
The regulations in Oklahoma would have caused a major reduction in drilling and revenue if low energy prices hadn’t reduced drilling, Hatfield said.
It’s important to understand what exactly is causing the quakes, he said, so when the price of oil recovers, the oil industry isn’t stuck with “ineffective or over burdensome regulations.” If the exact cause is determined, he said, there may be ways to safely use disposal wells.
Scientists are worried about what will happen when production picks up again. If the business becomes more profitable, more people in larger areas may be at risk of quakes, Bidgoli said.
Other concerns, such as building codes and earthquake insurance, haven’t been a big part of the conversation yet, except for in Oklahoma. Two bills were introduced there earlier this year — one that would prevent insurers from denying damage claims resulting from man-made quakes, the other to create a state-run insurance program. Both failed to pass.
Boak said he isn’t envious of policymakers. While scientists can go back and forth for decades on what’s happening, he said, regulators have to make decisions about who to hold liable.
“I’m very glad, as a geologist, I don’t have to have the answer for that,” he said.
Oxygen buried deep underground in minerals may have prompted the churning of Earth’s rocky mantle billions of years ago and helped transform the planet’s early atmosphere, according to a new study.
Research by geoscientists at Yale, Arizona State University, and Bayerisches Geoinstitut in Germany suggests that convection in Earth’s mantle—the slow movement of rocks circulating beneath the surface, caused by heat from inside the Earth—is affected by the distribution of oxygen in those minerals. The findings appear online Aug. 1 in the journal Nature Geoscience.
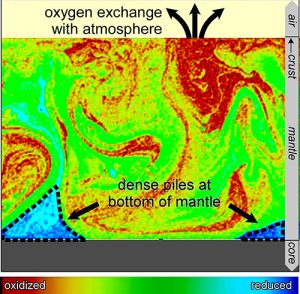
“When there’s less oxygen present in the rock, it’s denser than when there is more oxygen present, even though the rest of the elements are the same. The more oxidized rock preferentially rises over the reduced rock,” said Kanani Lee, the study’s principal investigator and an associate professor of geology and geophysics at Yale.
This process had consequences both above and below the surface. Deep below the surface, the more oxygen-depleted rocks sank to the bottom of the rocky mantle, leading to the creation of massive, dense piles just above the Earth’s core such as those found deep beneath the Pacific and Atlantic oceans.
“This is the first time anyone has shown that the relative amount of oxygen deep in the Earth influences the minerals that rocks are made of and how it changes their densities,” Lee said.
Tingting Gu, a former Yale postdoctoral associate and the paper’s lead author, added, “The mantle is not entirely isolated from the surface. For example, gases from volcanic eruptions connect the mantle with the atmosphere. Our model predicts that early in Earth’s history, the shallow mantle was less oxidized and thus released gases such as methane that would consume oxygen produced by photosynthesis. But as time progressed and the less dense oxidized material rose in the mantle, biotic oxygen could be preserved and accumulate in the atmosphere. This process could be unique among the terrestrial planets because of their different compositions.”
Reference:
Redox-induced lower mantle density contrast and effect on mantle structure and primitive oxygen, Nature Geoscience, DOI:10.1038/ngeo2772
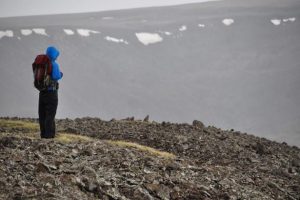
PhD Student Steve Smith looking across the flat-topped summits of the Hangay Mountains. Credit: Karl Wegmann
The Hangay Dome is a mountain range in Mongolia that is interesting for several reasons – among them its unique look. The range contains numerous summit plateaus, which make it look as though someone took a gigantic belt sander to the tops of mountains and filed them flat. The Hangay fascinates geologists not just because of its appearance, but because its formation – and its age – have been relatively hard to define.
New methods are allowing researchers to create a picture of what the Hangay looked like when it first formed – and giving geologists a more dependable way to uncover its history and age.
The Hangay’s formation is interesting because it’s what geologists refer to as an “intraplate” mountain belt. Mountain ranges are usually formed as the crust of the Earth is pushed upward along the margins of tectonic plates, where they are either converging or pulling apart. The Hangay isn’t along one of these intersecting plate boundaries, so geologists can’t use plate tectonic reconstructions to date the formation. As a result, age estimates range from 5 million to perhaps 50 million years old, and theories about the formation cover everything from an upwelling mantle plume (picture a giant magma bubble pushing up against the crust) to delamination, where a piece of the crust detaches from the continent, allowing partially molten rock from the asthenosphere to fill in beneath it and lift it.
Enter NC State geologist Karl Wegmann, former Ph.D. student Stephen Smith, and colleagues at Lehigh University. The researchers knew that between 5 million and 15 million years ago, lava flows filled in the valleys between the mountains with basalt. During the subsequent glacial period (beginning about 2.5 million years ago), glaciers carved out portions of the basalt and the mountains’ own granite, which revealed cross-sections of valleys that were previously filled in with lava.
Wegmann and Smith used satellite imagery from the Hangay Mountains to differentiate the basalt from the granite. Different rock types reflect light differently. By analyzing the spectral signatures returned from the exposed rock across the Hangay Mountains the team could pinpoint the basalt, and then digitally remove the basalt flows to reveal what the landscape looked like between 13 and 15 million years ago – essentially erasing the present in order to see the past.
“We could see that the Hangay wasn’t a flat plain at that time,” Wegmann says. “There was a mountain range with valleys just as deep as the ones there now – the ridgelines were about 2,000 feet above the valleys. The range we see today is most likely due to erosion rather than uplift, and the previous mountains were uplifted between 20 and 25 million years ago.”
Reference:
Stephen G. Smith et al. Paleotopography and erosion rates in the central Hangay Dome, Mongolia: Landscape evolution since the mid-Miocene, Journal of Asian Earth Sciences (2016). DOI: 10.1016/j.jseaes.2016.05.013
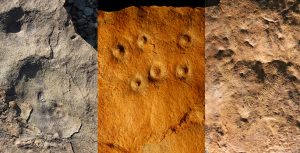
Fossils from Zaris site in Namibia: left, the discs are fossil remains of the holdfast structures that were holdfast structures for an Ediacaran species called aspidella; middle, bumps on the rock surface are the remains of burrows, called conich burrow, that were originally inhabited by anemone-like animals that may have fed on Ediacaran larvae; and,right, odd annulated and ribbon-like fossils that represent mysterious early animals (likely ecosystem engineers) called shaanxilithes. (Simon Darroch / Vanderbilt)
Newly discovered fossil evidence from Namibia strengthens the proposition that the world’s first mass extinction was caused by “ecosystem engineers” — newly evolved biological organisms that altered the environment so radically it drove older species to extinction.
The event, known as the end-Ediacaran extinction, took place 540 million years ago. The earliest life on Earth consisted of microbes — various types of single-celled organisms. These held sway for more than 3 billion years, when the first multicellular organisms evolved. The most successful of these were the Ediacarans, which spread around the globe about 600 million years ago. They were a largely immobile form of marine life shaped like discs and tubes, fronds and quilted mattresses.
After 60 million years, evolution gave birth to another major innovation: metazoans, the first animals. Metazoans could move spontaneously and independently at least during some point in their life cycle and sustain themselves by eating other organisms or what other organisms produce. Animals burst onto the scene in a frenzy of diversification that paleontologists have labeled the Cambrian explosion, a 25 million-year period when most of the modern animal families — vertebrates, mollusks, arthropods, annelids, sponges and jellyfish — came into being.
“These new species were ‘ecological engineers’ who changed the environment in ways that made it more and more difficult for the Ediacarans to survive,” said Simon Darroch, assistant professor of earth and environmental sciences at Vanderbilt University, who directed the new study described in the paper titled “A mixed Ediacaran-metazoan assemblage from the Zaris Sub-basin, Namibia,” published in the journal Palaeogeography, Palaeoclimatology, Palaeoecology.
Darroch and his colleagues report that they have found one of the best-preserved examples of a mixed community of Ediacarans and animals, which provides the best evidence of a close ecological association between the two groups.
“Until this, the evidence for an overlapping ecological association between metazoans and soft-bodied Ediacaran organisms was limited,” Darroch said. “Here, we describe new fossil localities from southern Namibia that preserve soft-bodied Ediacara biota, enigmatic tubular organisms thought to represent metazoans and vertically oriented metazoan trace fossils. Although the precise identity of the tracemakers remains elusive, the structures bear several striking similarities with a cone-shaped organism called Conichnus that has been found in the Cambrian period.”
In a previous paper that Darroch and his collaborators published last September, they reported on a fossil record that showed stressed-looking communities of Ediacara associated with a suite of animal burrows.
“With this paper we’re narrowing in on causation; we’ve discovered some new fossil sites that preserve both Ediacara biota and animal fossils (both animal burrows — ‘trace fossils’ — and the remains of animals themselves) sharing the same communities, which lets us speculate about how these two very different groups of organisms interacted,” he said.
“Some of the burrow fossils we’ve found are usually interpreted as being formed by sea anemones, which are passive predators that may have preyed upon Ediacaran larvae. We’ve also found stands of Ediacaran frondose organisms, with animal fossils preserved in place coiled around their bases. In general, these new fossil sites reveal a snapshot of a very unusual ‘transitional’ ecosystem existing right before the Cambrian explosion, with the last of the Ediacara biota clinging on for grim death, just as modern-looking animals are diversifying and starting to realize their potential.”
Although Darroch is studying events that took place 540 million years ago, he believes there is a message relevant for today. “There is a powerful analogy between Earth’s first mass extinction and what is happening today,” he said. “The end-Ediacaran extinction shows that the evolution of new behaviors can fundamentally change the entire planet, and today we humans are the most powerful ‘ecosystems engineers’ ever known.”
Reference:
Simon A.F. Darroch, Thomas H. Boag, Rachel A. Racicot, Sarah Tweedt, Sara J. Mason, Douglas H. Erwin, Marc Laflamme. A mixed Ediacaran-metazoan assemblage from the Zaris Sub-basin, Namibia. Palaeogeography, Palaeoclimatology, Palaeoecology, 2016; 459: 198 DOI: 10.1016/j.palaeo.2016.07.003
Note: The above post is reprinted from materials provided by Vanderbilt University. The original item was written by David F. Salisbury.
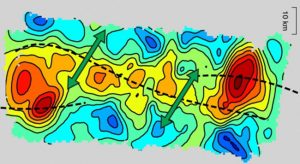
Tomographic image of Endeavor Ridge, where seismic P waves found mantle magma pooled (red) at hot at ends with cooler, more equally distributed mantle magma elsewhere. Credit: Brandon VanderBeek/University of Oregon
Deep down below us is a tug of war moving at less than the speed of growing fingernails. Keeping your balance is not a concern, but how the movement happens has been debated among geologists.
New findings from under the Pacific Northwest Coast by University of Oregon and University of Washington scientists now suggest a solution to a mystery that surfaced when the theory of plate tectonics arose: Do the plates move the mantle, or does the mantle move the plates.
The separation of tectonic plates, the researchers proposed in a paper online ahead of print in the journal Nature Geoscience, is not simply dictating the flow of the gooey, lubricating molten material of the mantle. The mantle, they argue, is actually fighting back, flowing in a manner that drives a reorientation of the direction of the plates.
The new idea is based on seismic imaging of the Endeavor segment of the Juan de Fuca Plate in the Pacific Ocean off Washington and on data from previous research on similar ridges in the mid-Pacific and mid-Atlantic oceans.
“Comparing seismic measurements of the present mantle flow direction to the recent movements of tectonic plates, we find that the mantle is flowing in a direction that is ahead of recent changes in plate motion,” said UO doctoral student Brandon P. VanderBeek, the paper’s lead author. “This contradicts the traditional view that plates move the mantle.”
While the new conclusion is based on a fraction of such sites under the world’s oceans, a consistent pattern was present, VanderBeek said. At the three sites, the mantle’s flow is rotated clockwise or counterclockwise rather than in the directions of the separating plates. The mantle’s flow, the researchers concluded, may be responsible for past and possibly current changes in plate motion.
The research — funded through National Science Foundation grants to the two institutions — also explored how the supply of magma varies under mid-ocean ridge volcanoes. The researchers conducted a seismic experiment to see how seismic waves moved through the shallow mantle below the Endeavor segment.
They found that the middle of the volcanic segment, where the seafloor is shallowest and the inferred volcanic activity greatest, the underlying mantle magma reservoir is relatively small. The ends, however, are much deeper with larger volumes of mantle magma pooling below them because there are no easy routes for it to travel through the material above it.
Traditional thinking had said there would be less magma under the deep ends of such segments, known as discontinuities.
“We found the opposite,” VanderBeek said. “The biggest volumes of magma that we believe we have found are located beneath the deepest portions of the ridges, at the segment ends. Under the shallow centers, there is much less melt, about half as much, at this particular ridge that we investigated.
“Our idea is that the ultimate control on where you have magma beneath these mountain ranges is where you can and cannot take it out,” he said. “At the ends, we think, the plate rips apart much more diffusely, so you are not creating pathways for magma to move, build mountains and allow for an eruption.”
Reference:
Brandon P. VanderBeek, Douglas R. Toomey, Emilie E. E. Hooft, William S. D. Wilcock. Segmentation of mid-ocean ridges attributed to oblique mantle divergence. Nature Geoscience, 2016; DOI: 10.1038/ngeo2745
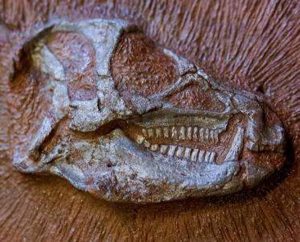
Skull of the Heterodontosaurus tucki dinosaur. Credit: ESRF/P. Jayet
The ESRF had an extraordinary and ancient visitor this week: the most complete fossil skeleton ever found of the small plant-eating dinosaur, heterondontosaurus tucki, which roamed the earth 200 million years ago. This exceptional specimen was discovered in South Africa’s Eastern Cape province and excavated by palaeontologist Billy de Klerk.
Because the small skeleton is embedded in hard rock, attempts to extract the bones would cause irreparable damage. To study the dinosaur’s anatomy, a team of scientists from the Evolutionary Studies Institute at the University of the Witwatersrand, South Africa, led by Professor Jonah Choiniere, has teamed up with palaeontologists at the ESRF to use the high-energy, high brilliance, wide X-rays produced to non-invasively reconstruct the skeleton in incredible detail.
Over the last two decades, the ESRF has developed unique worldwide expertise in palaeontology. If fossil teeth, bones and skulls are examined on a daily basis by the ESRF’s team of palaeontologists, the scanning of a complete skeleton remains exceptional.
From 21 -26 July, scientists from the Evolutionary Studies Institute at the University of the Witwatersrand in Johannesburg, South Africa, came to the ESRF to scan the complete skeleton of Heterodontosaurus tucki.
Heterodontosaurus was a small, plant eating animal with grinding teeth in the back of the jaw and big canines in the front. The scientists, led by Wits Professor Jonah Choiniere with ESRF’s Dr Vincent Fernandez, scanned the specimen over five days using the extremely brilliant X-rays produced at the ESRF to help them understand how Heterodontosaurus ate, moved, and breathed.
“There’s still a lot we don’t know about early plant-eating dinosaurs,” said Choiniere, Professor at the Evolutionary Studies Institute, Wits University, “and we need new specimens like this one and new technology like the synchrotron to fill in those gaps”.
After five days of data taking, Jonah Choiniere and the team took a first look at the images. The reaction is unanimous, with a sonorous and collective “Amazing!”. Choniere adds “Right away when we open these images we can tell quite a few things about the skull. One of the things is that it’s likely a juvenile: the skull bones aren’t strongly sutured together. We can also tell that we’re really able to reconstruct the skull very, very well. On the first scans we can see the openings in the skull which are for the balance organs. We can digitally reconstruct the balance organs of the animal and tell how it held it’s head and how it interacted with its environment. That’s the sort of data you just can’t get by looking at a skull in 2d. So it’s very exciting.”
This work is part of a long standing collaboration between palaeoscientists based at the ESRF and in South Africa, an associate country of the ESRF. Just last year, the ESRF’s Dr. Vincent Fernandez arranged for some of the world’s oldest dinosaur embryos, originating from South Africa, to be scanned at the ESRF. “The rocks of the Karoo from South Africa have yielded an extraordinary amount of amazing fossils” said Fernandez, “Since South Africa joined the ESRF as an associate country, we’ve been able to scan a lot of these fossils and work on projects that were not accessible before.”
Billy de Klerk found the dinosaur skeleton in a stream bed near a small town in the Eastern Cape province, on Hannie van Heerden’s farm. With the help of a crew from the Albany Museum in Grahamstown, de Klerk and John Hepple, a technician at Rhodes University Geology Department, excavated the fossil and painstakingly removed enough rock from the bones to identify the specimen.
“A few more years on the streambed and the specimen might have been washed away,” stated de Klerk, “we just happened to be at the right place at the right time.”
Further preparation work, however, was nearly impossible – the skeleton is too small and delicate, and the rocks around it too hard, to enable scientists to fully study the anatomy. That’s where the synchrotron comes in: the high-energy X-rays generated by the ESRF facility will allow scientists to reconstruct the skeleton in incredible detail.
Since 2000, the ESRF has developed unique worldwide expertise in palaeontology, designing non-invasive techniques specifically for palaeontological studies. The ESRF also benefits from a team of experts in palaeontology and houses several beamlines dedicated to X-ray imaging. Together with local expertise on scanning fossils including some very famous pieces like Sediba or Toumaï, these ESRF beamlines offer the unique combination of high-energy, high brilliance and wide X-ray beams necessary to scan large fossils. The high coherence of the beam provides the key factor for this type of research: fossilised bones and the surrounding rock have very similar density and this feature enhances the contrast between the two in the resulting images, a critical advantage for virtually digging out the fossil. For this experiment, explains Vincent Fernandez, “the ESRF allows to do long distance propagation phase contrast micro-tomography on a large sample at high energy with a dedicated sample stage.”
Master’s student and part of the scientific team, Kathleen Dollman, from Wits University, is hoping to apply this technique to the fossil crocodiles she is studying for her degree. “X-ray computed tomography (CT) methods have revolutionised palaeontology,” stated Dollman, “and we can use these methods to understand so much about the biology of these extinct animals.”
The results of this research should provide valuable insight into the life-style of early plant-eating dinosaurs. But, as the popular saying goes, “patience reaps the greatest awards” and the processing of the data collected, an amazing 1TB (that’s 60 piles of stacked paper as tall as the Eiffel tower), will take almost a year to complete. At the ESRF we have absolutely no doubts: the rewards will be great.
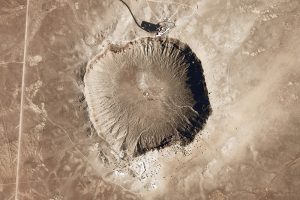
Meteor Crater, Arizona, USA. Credit: NASA Earth Observatory/National Map Seamless Server.
Having been reported in lunar samples returned by Apollo astronauts, meteorites, impact glass, and at a number of meteorite craters on Earth, granular zircon is the most unusual and enigmatic type of zircon known. The mechanisms and transformations that form this distinctive granular zircon have, until now, remained speculative because it has not been produced in shock experiments.
A new study of granular zircon from Meteor Crater in Arizona, USA, by Aaron J. Cavosie and colleagues, uses electron backscatter diffraction to unravel specific mineral transformations and pressure-temperature conditions involved in its genesis.
Mapping the orientation of recrystallized zircon domains (neoblasts) shows that making granular zircon first involves forming twins, followed by transformation to the high-pressure mineral reidite, all at extreme pressure and temperature, far beyond those found in Earth’s crust. While at high temperature, the grains recrystallize to form the distinctive small neoblasts that define granular zircon, and then partially react to zirconia if high temperature persists.
These results, which include the first new shocked mineral discovery at Meteor Crater in more than 50 years, provide new insights into extreme impact conditions at inaccessible sites where granular zircon occurs, such as the surface of the Moon and collisions among asteroids.
Reference:
Aaron J. Cavosie, Nicholas E. Timms, Timmons M. Erickson, Justin J. Hagerty, Friedrich Hörz Transformations to granular zircon revealed: Twinning, reidite, and ZrO2in shocked zircon from Meteor Crater (Arizona, USA). Geology, 2016; G38043.1 DOI: 10.1130/G38043.1
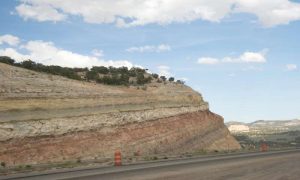
An outcrop of the Carmel Formation near Interstate-70 in the San Rafael Swell in southeastern Utah, USA. Utah State University geologists, with collaborators from Cambridge University, Shell Global Solutions, Tennessee’s Oak Ridge National Laboratory and German’s Jülich Center for Neutron Science, probed the Carmel caprock to assess the feasibility of effective carbon capture and storage (CCS) in underground reservoirs. Credit: Elizabeth Petrie, Western State Colorado University, USA.
Effective carbon capture and storage or “CCS” in underground reservoirs is one possible way to meet ambitious climate change targets demanded by countries and international partnerships around the world. But are current technologies up to the task of securely and safely corralling buoyant carbon dioxide (CO2) for at least 10,000 years – the minimum time period required of most agreements?
Across the globe, several pilot projects exist for CCS , the process by which CO2 emissions are collected and injected into underground reservoirs, but upscaling and demonstrating the process will work over the long term is a topic of active research.
“Nature may provide some answers,” says Utah State University geologist Jim Evans, who, along USU alum Elizabeth Petrie, currently of Western State Colorado University, students and colleagues, participated in an international research project, led by England’s Cambridge University and Shell Global Solutions, aimed at assessing geological formations able to effectively contain carbon dioxide emissions.
The team published findings in the July 28, 2016, edition of Nature Communications. The USU researchers’ participation in the study, funded by Royal Dutch Shell, was also supported by a U.S. Department of Energy Basic Energy Sciences Grant.
“Storing carbon dioxide underground is a challenge because CO2 is less dense than water, exerts upward pressure, corrodes surrounding rocks and escapes,” says Evans, a professor in USU’s Department of Geology. “Yet, natural carbon dioxide sequestration occurs and, with the study, we set out to discover the characteristics of areas where secure storage is possible.”
For several years, the team’s research has focused on an area of southeastern Utah, where Evans says a natural laboratory exists to study the long-term interactions between CO2, water and rocks. Located near a fault, the site’s natural and human-caused CO2 emissions can be studied from a minute to 400,000-year timescales. The current paper examines the result of a scientific drill hole in the area’s Carmel Formation, a sandstone caprock about five miles south of Green River, Utah.
“The Carmel caprock features sandstone and fine siltstones overlying an aquifer naturally charged with carbon dioxide,” Evans says. “Our collaborators from Tennessee’s Oak Ridge National Laboratory and Germany’s Jülich Center for Neutron Science analyzed reservoir fluids from the drill hole, along with continuous drill core, using neutron scattering to determine the variations in the chemistry of the rocks.”
Evans and Petrie helped to design the coordinate the drilling and students from USU participated in the coring and water sampling.
“Water samples were obtained from depth, and this sampling was tricky,” Evans says.
Shell’s Niko Kampman, the paper’s lead author, used a device lowered in the drilling hole to capture the water and dissolved CO2 and keep it at pressure until samples could be analyzed in laboratories in Europe.
“Coring and sampling rocks and fluids, while a natural pressure is pushing everything upwards into the hole, is very challenging,” Evans says. “But the team was ultimately successful.”
The team then used computer modeling of the chemistry measured in the water, gas and rock to determine the naturally altered caprock’s effectiveness in trapping carbon dioxide. They found it provided a barrier-forming zone in which minerals dissolve, react with carbon dioxide and precipitate and clog pores.
“These geochemical reactions occur at the nanopore level and create a very tight seal and, at the study site, retained carbon dioxide much longer than expected,” Evans says. “Our findings reveal important insights about the feasibility of storing carbon. Our work suggests that in natural systems, the CO2 may move very slowly in rocks and that effective seals are possible in some CCS scenarios.”
Reference:
N. Kampman, A. Busch, P. Bertier, J. Snippe, S. Hangx, V. Pipich, Z. Di, G. Rother, J. F. Harrington, J. P. Evans, A. Maskell, H. J. Chapman & M. J. Bickle.Observational evidence confirms modelling of the long-term integrity of CO2-reservoir caprocks. DOI:10.1038/ncomms12268
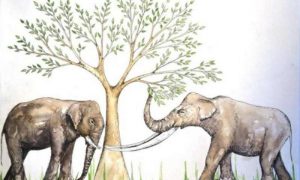
Interpretive illustration of proboscidean feeding ecology in the Late Pleistocene of southern China. Elephas (left) incoporates more graze in its diet; whereas Stegodon (right) is an obligate browser of fresh shoots and leaves. Credit: Nicola Heath
How can we ever know what ancient animals ate? For the first time, the changing diets of elephants in the last two million years in China have been reconstructed, using a technique based on analysis of the surface textures of their teeth.
The work was carried out by a University of Bristol student, working with an international team of researchers. The research was published online in Quaternary International.
Today, elephants live only in remote, tropical parts of Africa and southern Asia, but before the Ice Ages they were widespread.
As his undergraduate research project, Zhang Hanwen, MSci Palaeontology and Evolution graduate and now PhD student at the University of Bristol, undertook cutting-edge analysis of fossilised elephant teeth from China.
In a collaboration with the University of Leicester, and the Institute of Vertebrate Paleontology and Paleoanthropology in Beijing, where the fossilised teeth are curated, Hanwen sampled 27 teeth for tiny wear patterns called microwear.
“We are talking huge, brick-sized molars here – the largest of any animal,” said Hanwen, “but the signs of tooth wear are tiny, down to thousandths of a millimetre. However, these microscopic surface textures can tell us whether they were eating grass or leaves.”
Hanwen took peels of the fossilised teeth in China, using high-grade dental moulding materials, and captured the 3-D surface textures under a digital microscope at the University of Leicester. The textures were quantified and analysed to identify what the elephants were eating in the days and weeks before they died.
By comparing the results with information from modern ruminants (deer, antelopes and oxen) of known diet, the study concluded two extinct elephants from Southern China – Sinomastodon and Stegodon – were primarily browsing on leaves. The third, Elephas, which includes the modern Asian elephants, shows much more catholic feeding habit, incorporating both grazing and browsing.
“It’s wonderful that we can identify diets of any fossil mammal with confidence now,” said Professor Christine Janis, from the University of Bristol, one of Hanwen’s PhD supervisors and a leading expert on the evolution of herbivorous mammals.
“This is based on the fact that the microwear textures produced by different kinds of plant material are comparable across unrelated animals.”
“This method for identifying diet relies on high-quality 3-D surface data and analysis,” said Professor Mark Purnell, of the University of Leicester, another co-supervisor of Hanwen’s.
“It removes the subjectivity of trying to quantify microwear textures by identifying and counting scratches and pits in 2D microscopic images.”
Sinomastodon and Stegodon coexisted in Southern China between 2.6 and one million years ago, but Sinomastodon then became extinct and left Stegodon to become the dominant elephant of Southern China for the remainder of the Pleistocene, the time of the great Ice Ages.
“The fossil pollen record, and recently-excavated mammal fossil assemblages from various karst cave sites near the Chinese-Vietnamese border, suggest a prolonged, fluctuating period of environmental deterioration around this time,” Hanwen explained.
He added: “Forests were on the decline, alongside many of the more archaic mammal species that inhabited them. The highly evolved molars of Stegodon, with multiple enamel ridges, might have allowed it to browse on its preferred foliage in a more efficient way, thus outcompeting Sinomastodon, which preferred the same diet, but had less sophisticated molars consisting of large, blunt, conical cusps.”
On the other hand, the new study also suggests that Stegodon and Elephas subsequently coexisted for long periods in Southern China by eating different things. Stegodon remained a specialist foliage feeder whereas Elephas was more of a generalist, consuming a wider variety of vegetation.
Stegodon became extinct at around 11,000 years ago, at the end of the Pleistocene, coinciding with the worldwide disappearance of large mammal species at this time, including the iconic woolly mammoths, giant deers and sabretoothed cats. The Asian elephant survived in Southern China into historical times.
Reference:
‘An examination of feeding ecology in Pleistocene proboscideans from southern China (Sinomastodon, Stegodon, Elephas), by means of Dental Microwear Texture Analysis’ by Zhang Hanwen, Wang Yuan, Christine M. Janis, Robert H. Goodhall, And Mark A. Purnell, in Quaternary International. DOI:10.1016/j.quaint.2016.07.011
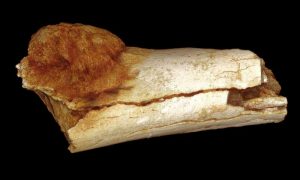
Volume rendered image of the external morphology of the foot bone shows the extent of expansion of the primary bone cancer beyond the surface of the bone. Credit: Patrick Randolph-Quinney (UCLAN)
Johannesburg, South Africa – an international team of researchers led by scientists from the University of the Witwatersrand’s Evolutionary Studies Institute and the South African Centre for Excellence in PalaeoSciences today announced in two papers, published in the South African Journal of Science, the discovery of the most ancient evidence for cancer and bony tumours yet described in the human fossil record.
The discovery of a foot bone dated to approximately 1.7 million years ago from the site of Swartkrans with definitive evidence of malignant cancer, pushes the oldest date for this disease back from recent times into deep prehistory. Although the exact species to which the foot bone belongs is unknown, it is clearly that of a hominin, or bipedal human relative.
In an accompanying paper appearing in the same journal, a collaborating team of scientists identify the oldest tumour ever found in the human fossil record, a benign neoplasm found in the vertebrae of the well-known Australopithecus sediba child, Karabo from the site of Malapa, and dated to almost two million years in age. The oldest previously demonstrated possible hominin tumour was found in the rib of a Neanderthal and dated to around 120,000 years old.
Edward Odes, a Wits doctoral candidate and lead author of the cancer paper, and co-author on the tumour paper, notes “Modern medicine tends to assume that cancers and tumours in humans are diseases caused by modern lifestyles and environments. Our studies show the origins of these diseases occurred in our ancient relatives millions of years before modern industrial societies existed”.
The cancer in a foot bone, a metatarsal, was identified as an osteosarcoma, an aggressive form of cancer which usually affects younger individuals in modern humans, and, if untreated typically results in early death. “Due to its preservation, we don’t know whether the single cancerous foot bone belongs to an adult or child, nor whether the cancer caused the death of this individual, but we can tell this would have affected the individuals’ ability to walk or run,” says Dr Bernhard Zipfel, a Wits scientist and an expert on the foot and locomotion of early human relatives. “In short, it would have been painful.”
Lead author of the tumour paper and co-author of the cancer paper, Dr Patrick Randolph-Quinney of Wits University and the University of Central Lancashire in the UK, suggests “The presence of a benign tumour in Australopithecus sediba is fascinating not only because it is found in the back, an extremely rare place for such a disease to manifest in modern humans, but also because it is found in a child. This, in fact, is the first evidence of such a disease in a young individual in the whole of the fossil human record”.
Prof. Lee Berger, an author on both papers and leader of the Malapa project where the fossil vertebra was found adds “not only has there been an assumption that these sorts of cancers and tumours are diseases of modernity, which these fossils clearly demonstrate they are not, but that we as modern humans exhibit them as a consequence of living longer, yet this rare tumour is found in a young child. The history of these types of tumours and cancers is clearly more complex than previously thought”.
Both incidences of disease were diagnosed using state of the art imaging technologies including those at the European Synchrotron Research Facility in Grenoble, France, medical CT at the Charlotte Maxeke Hospital in Johannesburg, and the micro-CT facility at the Nuclear Energy Corporation of South Africa at Pelindaba.
“Researchers in South Africa are at the forefront of using various X-Ray modalities to discover new and interesting facts about ancient human relatives,” notes Dr Jacqueline Smilg, a radiologist based at Charlotte Maxeke Hospital, who is an author on both papers and was involved in the clinical diagnoses. “This is another good example of how the modern clinical sciences and the science of palaeoanthropology are working together in South Africa and with international collaborators to advance our understanding of diseases in both the past and the present.”
Reference:
Patrick S. Randolph-Quinney et al. Osteogenic tumour in Australopithecus sediba: Earliest hominin evidence for neoplastic disease, South African Journal of Science (2016). DOI: 10.17159/sajs.2016/20150470
Edward J. Odes et al. Earliest hominin cancer: 1.7-million-year-old osteosarcoma from Swartkrans Cave, South Africa, South African Journal of Science (2016). DOI: 10.17159/sajs.2016/20150471
Note: The above post is reprinted from materials provided by Wits University.
Listed below are all known earthquakes measured or estimated to have a magnitude of 8.5 or above on the moment magnitude or Richter magnitude scale.
Location
Date UTC
Magnitude
1
Chile
22/05/1960
9.5
2
1964 Great Alaska Earthquake
28/03/1964
9.2
3
Off the West Coast of Northern Sumatra
26/12/2004
9.1
4
Near the East Coast of Honshu, Japan
11/03/2011
9.0
5
Kamchatka
04/11/1952
9.0
6
Offshore Maule, Chile
27/02/2010
8.8
7
Off the Coast of Ecuador
31/01/1906
8.8
8
Rat Islands, Alaska
04/02/1965
8.7
9
Northern Sumatra, Indonesia
28/03/2005
8.6
10
Assam – Tibet
15/08/1950
8.6
1- Chile “1960 Valdivia earthquake”
The 1960 Valdivia earthquake or Great Chilean earthquake (Gran terremoto de Chile) of 22 May is the most powerful earthquake ever recorded. Various studies have placed it at 9.4–9.6 on the moment magnitude scale. It occurred in the afternoon (19:11 GMT, 15:11 local time), and lasted approximately 10 minutes. The resulting tsunami affected southern Chile, Hawaii, Japan, the Philippines, eastern New Zealand, southeast Australia and the Aleutian Islands.
The epicenter of this megathrust earthquake was near Lumaco (see map), approximately 570 kilometres (350 mi) south of Santiago, with Valdivia being the most affected city. The tremor caused localised tsunamis that severely battered the Chilean coast, with waves up to 25 metres (82 ft). The main tsunami raced across the Pacific Ocean and devastated Hilo, Hawaii. Waves as high as 10.7 metres (35 ft) were recorded 10,000 kilometres (6,200 mi) from the epicenter, and as far away as Japan and the Philippines.
The death toll and monetary losses arising from this widespread disaster are not certain. Various estimates of the total number of fatalities from the earthquake and tsunamis have been published, ranging between 1,000 and 6,000 killed. Different sources have estimated the monetary cost ranged from US$400 million to 800 million (or $3.2 billion to $6.4 billion today, adjusted for inflation)
2- 1964 Great Alaska Earthquake
The 1964 Alaskan earthquake, also known as the Great Alaskan earthquake and Good Friday earthquake, occurred at 5:36 P.M. AST on Good Friday, March 27. Across south-central Alaska, ground fissures, collapsing structures, and tsunamis resulting from the earthquake caused about 139 deaths.
Lasting four minutes and thirty-eight seconds, the magnitude 9.2 megathrust earthquake was the most powerful recorded in North American history, and the second most powerful recorded in world history. Soil liquefaction, fissures, landslides, and other ground failures caused major structural damage in several communities and much damage to property. Anchorage sustained great destruction or damage to many inadequately earthquake engineered houses, buildings, and infrastructure (paved streets, sidewalks, water and sewer mains, electrical systems, and other man-made equipment), particularly in the several landslide zones along Knik Arm. Two hundred miles southwest, some areas near Kodiak were permanently raised by 30 feet (9.1 m). Southeast of Anchorage, areas around the head of Turnagain Arm near Girdwood and Portage dropped as much as 8 feet (2.4 m), requiring reconstruction and fill to raise the Seward Highway above the new high tide mark.
In Prince William Sound, Port Valdez suffered a massive underwater landslide, resulting in the deaths of 30 people between the collapse of the Valdez city harbor and docks, and inside the ship that was docked there at the time. Nearby, a 27-foot (8.2 m) tsunami destroyed the village of Chenega, killing 23 of the 68 people who lived there; survivors out-ran the wave, climbing to high ground. Post-quake tsunamis severely affected Whittier, Seward, Kodiak, and other Alaskan communities, as well as people and property in British Columbia, Washington, Oregon, and California. Tsunamis also caused damage in Hawaii and Japan. Evidence of motion directly related to the earthquake was reported from all over the world.
3- Off the West Coast of Northern Sumatra
The 2004 Indian Ocean earthquake occurred at 00:58:53 UTC on 26 December with the epicentre off the west coast of Sumatra, Indonesia. The shock had a moment magnitude of 9.1–9.3 and a maximum Mercalli intensity of IX (Violent). The undersea megathrust earthquake was caused when the Indian Plate was subducted by the Burma Plate and triggered a series of devastating tsunamis along the coasts of most landmasses bordering the Indian Ocean, killing 230,000 people in 14 countries, and inundating coastal communities with waves up to 30 metres (100 ft) high. It was one of the deadliest natural disasters in recorded history. Indonesia was the hardest-hit country, followed by Sri Lanka, India, and Thailand.
It is the third-largest earthquake ever recorded on a seismograph and had the longest duration of faulting ever observed, between 8.3 and 10 minutes. It caused the entire planet to vibrate as much as 1 centimetre (0.4 inches) and triggered other earthquakes as far away as Alaska. Its epicentre was between Simeulue and mainland Indonesia. The plight of the affected people and countries prompted a worldwide humanitarian response. In all, the worldwide community donated more than US$14 billion (2004) in humanitarian aid. The event is known by the scientific community as the Sumatra–Andaman earthquake. The resulting tsunami was given various names, including the 2004 Indian Ocean tsunami, South Asian tsunami, Indonesian tsunami, the Christmas tsunami and the Boxing Day tsunami.
4- Near the East Coast of Honshu, Japan
The 2011 earthquake off the Pacific coast of Tōhoku was a magnitude 9.0 (Mw) undersea megathrust earthquake off the coast of Japan that occurred at 14:46 JST (05:46 UTC) on Friday 11 March 2011, with the epicentre approximately 70 kilometres (43 mi) east of the Oshika Peninsula of Tōhoku and the hypocenter at an underwater depth of approximately 30 km (19 mi). The earthquake is also often referred to in Japan as the Great East Japan earthquake and also known as the 2011 Tohoku earthquake, and the 3.11 earthquake. It was the most powerful earthquake ever recorded to have hit Japan, and the fourth most powerful earthquake in the world since modern record-keeping began in 1900.The earthquake triggered powerful tsunami waves that reached heights of up to 40.5 metres (133 ft) in Miyako in Tōhoku’s Iwate Prefecture, and which, in the Sendai area, traveled up to 10 km (6 mi) inland. The earthquake moved Honshu (the main island of Japan) 2.4 m (8 ft) east, shifted the Earth on its axis by estimates of between 10 cm (4 in) and 25 cm (10 in), and generated sound waves detected by the low-orbiting GOCE satellite.
5- Kamchatka
The 1952 Severo-Kurilsk Tsunami was a major tsunami that hit Severo-Kurilsk, Kuril Islands, Sakhalin Oblast, Russian SFSR, USSR, which occurred on 5 November 1952 at about 5 a.m. It led to the destruction of many settlements in Sakhalin Oblast and Kamchatka Oblast, while the main impact struck the town of Severo-Kurilsk.
The tsunami was generated by a major earthquake in the Pacific Ocean, 130 kilometers (81 mi) from the shore of Kamchatka, with an estimated magnitude of 9.0. There were three waves about 15–18 meters (49–59 ft) high. After the earthquake the majority of the Severo-Kurilsk citizens fled to the surrounding hills, where they escaped the first wave. However, most of them returned to the town and were killed by the second wave. The third wave was minor. According to the authorities, out of a population of 6,000 people, 2,336 died. The remaining survivors were evacuated to continental Russia. The settlement was then rebuilt in another location.
6- Offshore Maule, Chile
The 2010 Chile earthquake occurred off the coast of central Chile on Saturday, 27 February at 03:34 local time (06:34 UTC), having a magnitude of 8.8 on the moment magnitude scale, with intense shaking lasting for about three minutes. It ranks as the fifth largest earthquake ever to be recorded by a seismograph. It was felt strongly in six Chilean regions (from Valparaíso in the north to Araucanía in the south), that together make up about 80 percent of the country’s population. According to the United States Geological Survey (USGS) the cities experiencing the strongest shaking—VIII (Severe) on the Mercalli intensity scale (MM)—were Concepción, Arauco and Coronel. According to Chile’s Seismological Service Concepción experienced the strongest shaking at MM IX (Violent). The earthquake was felt in the capital Santiago at MM VII (Very strong) or MM VIII. Tremors were felt in many Argentine cities, including Buenos Aires, Córdoba, Mendoza and La Rioja.7 Tremors were felt as far north as the city of Ica in southern Peru (approx. 2,400 km (1,500 mi) away).
The earthquake triggered a tsunami which devastated several coastal towns in south-central Chile and damaged the port at Talcahuano. Tsunami warnings were issued in 53 countries, and the wave caused minor damage in the San Diego area of California and in the Tōhoku region of Japan, where damage to the fisheries business was estimated at ¥6.26 billion (US$66.7 million). The earthquake also generated a blackout that affected 93 percent of the Chilean population and which went on for several days in some locations. President Michelle Bachelet declared a “state of catastrophe” and sent military troops to take control of the most affected areas. According to official sources, 525 people lost their lives, 25 people went missing and about 9% of the population in the affected regions lost their homes.
7- Off the Coast of Ecuador
The 1906 Ecuador–Colombia earthquake occurred at 15:36 UTC on January 31, off the coast of Ecuador, near Esmeraldas. The earthquake had a moment magnitude of 8.8 and triggered a destructive tsunami that caused at least 500 casualties on the coast of Colombia.
8- Rat Islands, Alaska
The 1965 Rat Islands earthquake occurred at 05:01 UTC, on 4 February (19:01, 3 February local time). It had a magnitude of 8.7 and triggered a tsunami of over 10 m on Shemya Island, but caused very little damage.
9- Northern Sumatra, Indonesia
More than 1,000 people were killed, with hundreds more injured, mostly in Nias, in northern Sumatra, Indonesia. The quake hit just months after an even bigger earthquake destroyed the region.
The quake ruptured below the surface of the Indian Ocean, where the Indo-Australian Plate is pushing under the Eurasian plate at the Sunda trench, similar to the 2004 quake.
10- Assam – Tibet
The 1950 Assam–Tibet earthquake, also known as the Assam earthquake, occurred on August 15, the third Independence Day of India, and had a moment magnitude of 8.6. The epicentre was located near Rima, Tibet. The earthquake was destructive in both Assam and Tibet, and between 1,500 and 3,300 people were killed.
It was the 6th largest earthquake of the 20th century. It is also the largest known earthquake to have not been caused by an oceanic subduction. Instead, this quake was caused by two continental plates colliding.
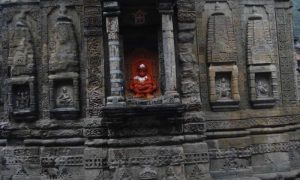
Damaged and clamped pillar at Lakshi Narayan temple, Chamba, India. Damage likely to have occurred during the 1555 Kashmir earthquake. Credit: Mayank Joshi
Tilted pillars, cracked steps, and sliding stone canopies in a number of 7th-century A.D. temples in northwest India are among the telltale signs that seismologists are using to reconstruct the extent of some of the region’s larger historic earthquakes.
In their report published online July 27 in Seismological Research Letters, Mayank Joshi and V.C. Thakur of the Wadia Institute of Himalayan Geology show how the signs of destructive earthquakes are imprinted upon the ancient stone and wooden temples.
The temples in the Chamba district of Himachal Pradesh, India lie within the Kashmir “seismic gap” of the Northwest Himalaya range, an area that is thought to have the potential for earthquakes magnitude 7.5 or larger. The new analysis extends rupture zones for the 1905 Kangra earthquake (magnitude 7.8) and the 1555 Kashmir earthquake (possibly a magnitude 7.6 quake) within the Kashmir gap.
The type of damage sustained by temples clustered around two towns in the region—Chamba and Bharmour—suggests that the Chamba temples may have been affected by the 1555 earthquake, while the Bharmour temples were damaged by the 1905 quake, the seismologists conclude.
The epicenter of the 1555 earthquake is thought to be in the Srinagar Valley, about 200 kilometers northwest of Chamba. If the 1555 earthquake did extend all the way to Chamba, Joshi said, “this further implies that the eastern Kashmir Himalaya segment between Srinagar and Chamba has not been struck by a major earthquake for the last 451 years.”
The stress built up in this section of the fault, Joshi added, “may be able to generate an earthquake of similar magnitude to that of the 2005 Kashmir earthquake that devastated the eastern Kashmir.”
That magnitude 7.6 earthquake killed more than 85,000 people, mostly in north Pakistan, and caused massive infrastructure damage.
To better understand the historical earthquake record in the region, Joshi and Thakur examined several temples in the region to look for telltale signs of earthquake damage. It can be difficult at first to distinguish whether a tilted pillar, for example, is due to centuries of aging or to earthquake deformation.
But Joshi noted that archaeoseismologists are trained to look for regular kinds of deformation to a structure—damages “that have some consistency in their pattern and orientation,” said Joshi. “In the cases of aging and ground subsidence, there is no regular pattern of damage.”
At the temples, the researchers measured the tilt direction, the amount of inclination on pillars and the full temple structures, and cracks in building stones, among other types of damage. They then compared this damage to historic accounts of earthquakes and information about area faults to determine which earthquakes were most likely to have caused the damage.
“In the Chamba-area temples, there are some marker features that indicate that the body of the temple structure has suffered some internal deformation,” said Joshi. “The pillars and temple structures are tilted with respect to their original positions. The rooftop portions show tilting or displacement.”
Other earthquake damage uncovered by the researchers included upwarping of stone floors, cracked walls, and a precariously leaning fort wall.
“The deformation features also give some clues about the intensity of an earthquake,” Joshi explained. “For example if a structure experiences a higher intensity XI or X, then the structure could collapse. But if the structure is not collapsed but it tilts only, then it indicates that the structure experienced lower intensity of IX and VIII.”
The Mercalli intensity scale is a measurement of the observed effects of an earthquake, such as its impact on buildings and other infrastructure. Scale measurements of VIII (“severe”) and IX (“violent”) would indicate significant damage, while higher scale measurements indicate partial to complete destruction of buildings, roads, and other infrastructure.
Reference:
“Signatures of 1905 Kangra and 1555 Kashmir earthquakes in medieval period temples of Chamba region, NW Himalaya,” DOI: 10.1785/0220160033
CAPT Satellite image of Meteor Crater in Arizona, caused by an impact about 49,000 years ago. Credit: NASA Earth Observatory
In molten sandstone extracted by prospectors a century ago, an international team of scientists has discovered microscopic crystals telling of unimaginable pressures and temperatures when a 50-meter asteroid (traveling 12 kilometers per second) formed Meteor Crater in northern Arizona some 49,000 years ago.
The crystals, called zircons, have endured temperatures of 2,000 degrees Celsius or more, hot enough to melt any rock on Earth. In our planet’s crust, such temperatures occur only briefly inside impact zones, says Aaron Cavosie, a visiting professor in the Wisconsin Astrobiology Research Consortium at the University of Wisconsin-Madison.
Zircons are tiny, phenomenally stable crystals that can persist for billions of years and have been used to date ancient asteroid impacts. But the new study, now online in the journal Geology, sheds light on a more recent impact at Meteor Crater, which may be the best studied impact zone on Earth. “It’s fresh, young and easy to get to,” says Cavosie, who is also a senior research fellow at the Western Australian School of Mines, Curtin University, in Perth, Australia.
In an electron microscope, the zircons look like agglomerations of BBs. Such “granular” zircons are also found in a giant impact crater in South Africa and on the moon, “but until now no one has cracked the code to figure out what turned normal zircons into thousands of grains glued together,” Cavosie says.
Cavosie’s group, including Nick Timms and Curtin Ph.D. candidate Timmons Erickson, along with collaborators Justin Hagerty from the U.S. Geological Survey and Fred Hörz from NASA, strung together several lines of evidence to conclude that the zircons had been subjected to a pressure of at least 300,000 atmospheres, and temperatures above 2,000 degrees C.
When the researchers fired a beam of electrons at 14 zircons, the electrons scattered back to a detector revealed the chemistry and the complex structure of the zircons. “When we looked at the texture of these unusual zircons, we saw that the orientations of the BBs are non-random, and instead are highly systematic,” Cavosie says.
These zircons are so tiny that eight, lined up, would extend across the width of a hair.
The orientations “record a series of changes that happen as zircons get shocked at increasing pressures – think Dante’s levels of hell for zircons,” Cavosie says. A moderate level of shock creates planar cleavages, “but as you go to higher levels, the zircon makes a twin, which is what happens when parts of a crystal are forced into a different orientation. This specific change is only caused by impact, and we have seen it in other places.”
Another distinctive orientation “only forms when zircon changes to the extremely rare mineral reidite,” Cavosie says. “This transformation is proven in the lab to require even more extreme pressures than twins.”
Finally, the impact created such an extraordinarily high temperature that it vaporized or melted all rocks in the surrounding crust. The quartz grains in the sandstone fused into the glassy, “shock-melted silica” that encased the zircons.
“When we screwed all these parts together,” Cavosie says, “the orientation of the granular zircons, the pressure required to form the twin phase and then reidite, and the finding that zircons were briefly swimming in a pool of liquid silica at about 2,000 degrees, hot enough for the zircons to recrystallize into this beebee-like granular texture, and then the evidence that this cooled very quickly, we saw that the granular zircons left a trail of breadcrumbs that allowed us to reconstruct how they were made, and in what conditions.”
Extreme pressures and temperatures that quickly subside comprise an unusual realm for geology. “Geologists are used to thinking about slow processes,” Cavosie says. “The process that transforms carbon into diamond is slow and steady; it involves high pressure and temperature but happens over millions of years.”
The equally dramatic transformation that creates a granular zircon occurs over a few minutes at most. “Then, the extreme pressure is gone, the high temperature has cooled off,” Cavosie says. “The impact leaves a giant hole in the ground, but it takes a mental adventure to wrap your head around the fact that the transformation in these zircons happened in seconds to minutes.”
The significance of understanding the formation of granular zircons extends far beyond one large meteor crater, Cavosie says. “These granular zircons have been found in meteorites, whose history we know very little about. Now, when we find them in a meteorite, it will allow us to recreate the conditions that the meteorite experienced on its path to Earth.”
The same is true for rocks returned from Mars and the moon, Cavosie says, and indeed he’s already investigating some moon rocks returned by the Apollo program.
“The new diagnostic techniques reported by Cavosie and colleagues will aid in cataloging impact events on Earth and elsewhere in the solar system,” says zircon expert John Valley, a professor of geoscience at UW-Madison. “This is important for understanding the history of Earth and the emergence of life. It will also aid in predicting the frequency of future large impacts to Earth, equivalent to the one that killed off the dinosaurs 65 million years ago, nearly extinguishing all life on land.”
Lyall’s wren: an extinct acanthisittid wren, infamously reported as having been both discovered and exterminated by a lighthouse-keeper’s cat. Credit: Public Domain, John Gerrard Keulemans (1842-1912)
A DNA analysis of living and extinct species of mysterious New Zealand wrens may change theories around the country’s geological and evolutionary past.
A University of Adelaide study into New Zealand’s acanthisittid wrens has provided compelling evidence that, contrary to some suggestions, New Zealand was not completely submerged under the ocean around 21 to 25 million years ago.
The acanthisittid wrens are a group of tiny, largely flightless, birds found nowhere else in the world. They are called wrens because of their similarity in appearance and behaviour to “true wrens”, but they don’t belong to the same family.
“Of the seven species living before humans arrived in New Zealand, only two now remain, the rock wren and the rifleman,” says lead author Dr Kieren Mitchell, Postdoctoral Research Associate in the University’s Australian Centre for Ancient DNA (ACAD). “Consequently, little is known about their evolution.”
Published in the journal Molecular Phylogenetics and Evolution and led by ACAD, the researchers analysed DNA from three of the extinct species along with the two living species.
The research was in collaboration with the Museum of New Zealand Te Papa Tongarewa, Canterbury Museum and the New Zealand Department of Conservation.
“Most surprisingly, we found that some of the wren species were only distantly related to each other, potentially sharing a common ancestor over 25 million years ago,” Dr Mitchell says.
“Previously, researchers have suggested that New Zealand was completely submerged 21 to 25 million years ago, which implies that all of New Zealand’s unique plants and animals must have immigrated and diversified more recently than that time.
“This theory is consistent, for instance, with what is known about the moa, where the different species all shared a common ancestor much more recently than 21 million years ago.
“But the ancient divergences we found among the wrens suggest that they have been resident in New Zealand for more than 25 million years, and possibly as long as 50 million years (when New Zealand became disconnected from the rest of Gondwana).
“As the wrens were largely very poor fliers, or even flightless, some land must have remained throughout that period.
“This has important consequences for our understanding of the evolution of New Zealand’s unique ecosystems.”
Reference:
Kieren J. Mitchell, Jamie R. Wood, Bastien Llamas, Patricia A. McLenachan, Olga Kardailsky, R. Paul Scofield, Trevor . Worthy, Alan Cooper. Ancient mitochondrial genomes clarify the evolutionary history of New Zealand’s enigmatic acanthisittid wrens. DOI: 10.1016/j.ympev.2016.05.038
This is a global map of Mars sulfur concentration (as percentage by mass) derived from the 2001: Mars Odyssey Gamma Ray Spectrometer spectra. Overlay shows qualitatively what types of hydrated sulfates are consistent with the variations seen in sulfur and water across the latitudes. Upright triangles indicate peaks in possible sulfate type abundance while the inverted triangles show less prominent values. Credit: Nicole Button, LSU Planetary Science Lab
Water is the key to life on Earth. Scientists continue to unravel the mystery of life on Mars by investigating evidence of water in the planet’s soil. Previous observations of soil observed along crater slopes on Mars showed a significant amount of perchlorate salts, which tend to be associated with brines with a moderate pH level.
However, researchers have stepped back to look at the bigger picture through data collected from the 2001: Mars Odyssey, named in reference to the science fiction novel by Arthur C. Clarke, “2001: A Space Odyssey,” and found a different chemical on Mars may be key. The researchers found that the bulk soil on Mars, across regional scales the size of the U.S. or larger, likely contains iron sulfates bearing chemically bound water, which typically result in acidic brines. This new observation suggests that iron sulfates may play a major role in hydrating martian soil.
This finding was made from data collected by the 2001: Mars Odyssey Gamma Ray Spectrometer, or GRS, which is sensitive enough to detect the composition of Mars soil up to one-half meter deep. This is generally deeper than other missions either on the ground or in orbit, and it informs the nature of bulk soil on Mars. This research was published recently in the Journal of Geophysical Research: Planets.
“This is exciting because it’s contributing to the story of water on Mars, which we’ve used as a path for our search for life on Mars,” said Nicole Button, LSU Department of Geology and Geophysics doctoral candidate and co-author in this study.
The authors expanded on previous work, which explored the chemical association of water with sulfur on Mars globally. They also characterized how, based on the association between hydrogen and sulfur, the soil hydration changes at finer regional scales. The study revealed that the older ancient southern hemisphere is more likely to contain chemically bound water while the sulfates and any chemically bound water are unlikely to be associated in the northerly regions of Mars.
The signature of strong association is strengthened in the southern hemisphere relative to previous work, even though sulfates become less hydrated heading southwards. In addition, the water concentration may affect the degree of sulfate hydration more than the sulfur concentration. Limited water availability in soil-atmosphere exchange and in any fluid movement from deeper soil layers could explain how salt hydration is water-limited on Mars. Differences in soil thickness, depth to any ground ice table, atmospheric circulation and sunshine may contribute to hemispheric differences in the progression of hydration along latitudes.
The researchers considered several existing hypotheses in the context of their overall observations, which suggest a meaningful presence of iron-sulfate rich soils, which are wet compared to Mars’ typically desiccated soil. This type of wet soil was uncovered serendipitously by the Spirit Rover while dragging a broken wheel across the soil in the Paso Robles area of Columbia Hills at Gusev Crater. Key hypotheses of the origin of this soil include hydrothermal activity generating sulfate-rich, hydrated deposits on early Mars similar to what is found along the flanks of active Hawaiian volcanoes on Earth. Alternatively, efflorescence, which creates the odd salt deposits on basement walls on Earth, may have contributed trace amounts of iron-sulfates over geologic time. A third key hypothesis involves acidic aerosols released at volcanic sites, such as acid fog, dispersed throughout the atmosphere, and interacting subsequently with the finer components of soil as a source of widespread hydrated iron-sulfate salts.
Among these hypotheses, the researchers identify acid fog and hydrothermal processes as more consistent with their observations than efflorescence, even though the sensitivity of GRS to elements, but not minerals, prevents a decisive inference. Hydrothermal sites, in particular, are increasingly recognized as important places where the exchange between the surface and deep parts of Earth’s biosphere are possible. This hypothesis is significant to the question of martian habitability.
“Our story narrows it to two hypotheses, but emphasizes the significance of all of them,” said LSU Department of Geology and Geophysics Assistant Professor Suniti Karunatillake, who is a fellow lead author. “The depth and breadth of these observation methods tell us about global significance, which can inform the big question of what happened to the hydrologic cycle on Mars.”
Reference:
Suniti Karunatillake, James J. Wray, Olivier Gasnault, Scott M. McLennan, A. Deanne Rogers, Steven W. Squyres, William V. Boynton, J. R. Skok, Nicole E. Button, Lujendra Ojha. The association of hydrogen with sulfur on Mars across latitudes, longitudes, and compositional extremes. Journal of Geophysical Research: Planets, 2016; DOI: 10.1002/2016JE005016
Saguaro cacti are the tallest things standing at Kofa National Wildlife Refuge, near Yuma, Arizona. The cultural icon is a keystone species of the Sonoran Desert, serving as perch, nesting site, shelter, thermal refuge, and food for the birds and other animals in the desert ecosystem. Credit: Taly Drezner
One hundred and thirty years ago, the volcano Krakatoa erupted in what is now Indonesia, unleashing a cataclysm locally and years of cool temperatures and rain globally. On the far side of the world, a bumper crop of saguaro cacti were getting their start in life in Arizona’s Sonoran Desert. Many of the large exemplars of the famous cacti standing spiny and tall with arms akimbo in the Southwest today started their lives in the shadow of the 1883 eruption.
Biogeographer Taly Drezner believes that distant volcanic paroxysms and the emergence of bountiful saguaro age-mate cohorts are connected. Volcanic climate perturbations that delivered disastrously cold and stormy weather to much of the Northern Hemisphere generated a combination of conditions in the Sonoran Desert that were just right for the delicate young cacti. Drezner will present her research on the first known example of regional population effects on a species from volcanic eruptions in distant parts of the world on 9 August 2016 at the 101st Annual Meeting of the Ecological Society of America, gathering this year in Fort Lauderdale, Florida.
“The saguaro is key to the survival of many species. Almost every animal in the Sonoran uses them in some way, as a nest site, or food, or a cool refuge,” said Drezner, a professor at York University in Ontario, who studies among other things, how heat and aridity shape the community of life in the desert. Temperatures can easily exceed 40 C (104 F) every day for weeks in summer, when saguaro seedlings have just germinated.
A keystone species of the Sonoran ecosystem and charismatic cultural emblem of the arid southwestern United States, the saguaro (Carnegiea gigantea) is sturdy in maturity but delicate in the early years of its life. Though mature individuals can top 12 meters (40 feet), new cacti grow only a few millimeters in the first year. Tiny young saguaros are susceptible to heat and cold, vulnerable to drying out or freezing in the extremes of their desert environment. For a critical two to three years, until they grow large enough to withstand cold and drought, they demand cool summers, mild winters, and sufficient rain: a combination of weather conditions at the outer edge of normal for the Sonoran in every dimension. A summer may be relatively cool, but too dry. A winter wet, but too cold. In most years, all the baby saguaros die.
In the year after Krakatoa, summer temperatures in the Northern Hemisphere fell 1.2 C below average. The eruption violently disgorged tons of ash and sulfur dioxide gas into the stratosphere. Dust particles and sulfuric acid droplets rode winds through the upper atmosphere, conspiring in a haze that reflected sunshine and lowered global temperatures. Though not as disruptive as the “year without a summer” that followed the eruption of Mount Tambora in 1815, Krakatoa’s influence was seen and felt around the globe in vivid sunsets and stormy weather. Southern California experienced a “water year” of record rainfall. Sulfate aerosols in particular can hang out in the atmosphere for years, and Krakatoa released an unusual abundance of sulfur. Typical temperature and weather patterns did not recover for years. For the saguaro, the perturbations appear to have amounted to a collection of “just right” conditions for new growth.
“I started noticing that these saguaro age cohorts followed notable volcanic eruptions,” said Drezner. “I knew that volcanoes drive milder summers and winters, and typically more rainfall for an extended period—two to three years after the event, which is a perfect window of time for the saguaro to get established and have a chance to survive.”
To investigate her hunch, Drezner went to Kofa National Wildlife Refuge near Yuma, Arizona, where limited water pushes the physiological limits of the saguaro, to sample the age structure of the local cacti. Rainfall at Kofa is a third of other locations in the Sonoran. Cacti do not have rings, like trees, that make age simple to gauge. Drezner estimated the ages of 250 cacti based on meticulous calculations of local growth rates using a model she pioneered. She added data from 30 locations in the Northern Sonoran Desert and compared the generational cohorts of the cacti to climate datasets for the region and the annual Weighted Historical Dust Veil Index, an indicator of volcanism.
Saguaro boom years tracked the peaks in the dust index, particularly in the marginal environment at Kofa. High volcanic dust levels also correlated with warmer, wetter, local winters, and more rain in late spring.
“The saguaro are protected because they are a beloved symbol and icon of the desert,” Drezner said. They are not currently threatened, but the unpredictable nature of their reproduction makes some conservators nervous about how the giants will respond to a changing climate. “That a volcano elsewhere on the continent, or even the other side of the world, can so profoundly influence a local population underscores interconnectedness of ecosystems and our global climate.”
Reference:
Erupting volcanoes promote species regeneration on the other side of the world: the inter-connectedness of geology, climate and ecosystems “ESA Annual Meeting 2016”