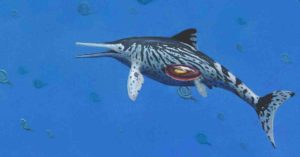
Scientists from the UK and Germany have discovered the largest Ichthyosaurus on record and found it was pregnant at the time of death.
The new specimen is estimated to be between 3 and 3.5 m long and is an adult female. Ichthyosaurs were a highly successful group of sea-going reptiles that became extinct about 90 million years ago. Often misidentified as swimming dinosaurs, these reptiles appeared before the first dinosaurs had evolved. The largest species of ichthyosaur grew to over 20 m in length.
The new specimen was originally discovered on the Somerset coast, during the mid-1990s, and is from the Early Jurassic, roughly 200 million years old. However, the specimen remained unstudied until it wound up in the collections of the Lower Saxony State Museum in Hannover, Germany.
Palaeontologist Sven Sachs of the Bielefeld Natural History Museum (Germany) first saw the specimen in August 2016, whilst on a routine visit. He informed University of Manchester palaeontologist and ichthyosaur expert, Dean Lomax, and together, the pair examined the new specimen in early 2017. They identified it as an example of an Ichthyosaurus somersetensis, a new species that Dean and another colleague, Prof. Judy Massare, had previously identified.
Dean said “It amazes me that specimens such as this [the biggest] can still be ‘rediscovered’ in museum collections. You don’t necessarily have to go out in the field to make a new discovery. This specimen provides new insights into the size range of the species, but also records only the third example of an Ichthyosaurus known with an embryo. That’s special”
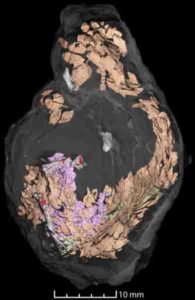
The embryo is incomplete and preserves only a portion of the back bone, a forefin, ribs and a few other bones. The preserved string of vertebrae is less than 7 cm long. The bones of the embryo are not fully ossified, meaning that the embryo was still developing.
Another intriguing discovery the duo made was that the tail of this new specimen did not belong with the rest of the skeleton. A tail from another ichthyosaur had been added to the skeleton to make it appear more complete and visually appealing for display.
Sven added “It is often important to examine fossils with a very critical eye. Sometimes, as in this instance, specimens aren’t exactly what they appear to be. However, it was not ‘put together’ to represent a fake, but simply for a better display specimen. But, if ‘fake’ portions remain undetected then scientists can fall foul to this, which results in false information presented in the published record.
“Specimens like this provide palaeontologists with important information about when these animals lived. Many examples of Ichthyosaurus are from historical collections and most do not have good geographical or geological records, but this specimen has it all. It may help to date other ichthyosaur fossils that currently have no information.”
Ichthyosaurus is one of the most common fossil reptiles in the UK, with thousands of specimens known, ranging from isolated bones to complete skeletons. Some of the very first examples were collected from along the Dorset coast by Victorian palaeontologist, Mary Anning, who first brought them to the attention of the scientific world.
The new study has been published today in the scientific journal Acta Palaeontologica Polonica.
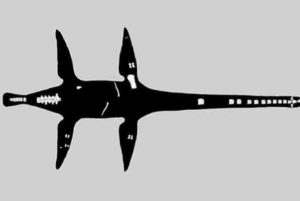
The silhouette of the newly named plesiosaur species, Lagenanectes richterae, reveals the reptile’s size as it compares to researcher Annette Richter. Credit: Joschua Knuppe/Uppsala University
A previously unrecognized 132 million-year-old fossilized sea monster from northern Germany has been identified by an international team of researchers. Findings published in the Journal of Vertebrate Paleontology.
The bizarre sea creature was a plesiosaur, an extinct long-necked aquatic reptile resembling the popular image of the Loch Ness monster, which dominated the seas during the Age of Dinosaurs.
The remains of the eight-meter-long skeleton were collected in 1964 by private fossil collectors. The perfectly preserved bones were rescued from heavy machinery excavating a clay-pit at Sarstedt near Hannover.
Despite being discovered nearly half a century ago, a group of international scientists was only recently invited to study the specimen by the Lower Saxony State Museum in Hannover. “It was an honor to be asked to research the mysterious Sarstedt plesiosaur skeleton” says Sven Sachs from the Natural History Museum in Bielefeld, Germany, and lead author on the study. “It has been one of the hidden jewels of the museum, and even more importantly, has turned out to be new to science.”
The new plesiosaur was christened Lagenanectes richterae, literally meaning ‘Lagena swimmer’, after the medieval German name for the Leine River near Sarstedt. The species was named for Dr Annette Richter, Chief Curator of Natural Sciences at the Lower Saxony State Museum, who facilitated documentation of the fossil.
The skeleton of Lagenanectes includes most of the skull, which had a meshwork of long fang-like teeth, together with vertebrae, ribs and bones from the four flipper-like limbs.
“The jaws had some especially unusual features.” says Dr Jahn Hornung a palaeontologist based in Hamburg and co-author on the paper. “Its broad chin was expanded into a massive jutting crest, and its lower teeth stuck out sideways. These probably served to trap small fish and squid that were then swallowed whole.”
Internal channels in the upper jaws might have housed nerves linked to pressure receptors or electroreceptors on the outside of the snout that would have helped Lagenanectes to locate its prey.
The bones also showed evidence of chronic bacterial infection suggesting that the animal had suffered from a long-term disease that perhaps eventually claimed its life.
“The most important aspect of this new plesiosaur is that it is amongst the oldest of its kind” says Dr Benjamin Kear from the Museum of Evolution at Uppsala University in Sweden and senior author on the study. “It is one of the earliest elasmosaurs, an extremely successful group of globally distributed plesiosaurs that seem to have had their evolutionary origins in the seas that once inundated Western Europe.”
Elasmosaurs had spectacularly long necks – the longest of any vertebrate – including up to 75 individual vertebrae. Not all of the neck vertebrae of Lagenanectes were recovered but it is estimated that around 40 or 50 must have originally been present.
Elasmosaurs flourished during the Cretaceous period but went extinct with the dinosaurs 66 million years ago. Lagenanectes lived in a shallow sea that covered northern Germany around 132 million years ago. It thus predates the last elasmosaurs by nearly 70 million years.
The skull of Lagenanectes will be displayed as a centerpiece in the ‘Water Worlds’ exhibition at the Lower Saxony State Museum in Hannover.
Reference:
Sachs, S., Hornung, J. J. & Kear, B. P. 2017. A new basal elasmosaurid (Sauropterygia: Plesiosauria) from the Lower Cretaceous of Germany. Journal of Vertebrate Paleontology e1301945 DOI: 10.1080/02724634.2017.1301945
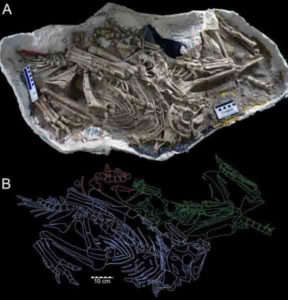
Photo and sketch of the confiscated specimen showing three different juveniles of the same species of dinosaur preserved in roosting posture, immediately next to each other. Credit: Gregory Funston
The Mongolian Desert has been known for decades for its amazing array of dinosaurs, immaculately preserved in incredible detail and in associations that give exceedingly rare glimpses at behavior in the fossil record. New remains from this region suggest an entirely unknown behavior for bird-like dinosaurs about 70 million years ago. At least some dinosaurs likely roosted together to sleep, quite possibly as a family, much like many modern birds do today. Gregory Funston, Ph.D. Candidate at the University of Alberta, will present the team’s research findings at the annual meeting of the Society of Vertebrate Paleontology, held this year in Calgary, Alberta (Canada) on Friday, Aug. 25th.
This new evidence for dinosaur roosting stems from a confiscated fossil block that was illegally exported from Mongolia, which preserved the amazing remains of three juvenile dinosaurs known as oviraptorids (part of the bird line of dinosaur evolution). These three dinosaurs represent the same species that were roughly the same age, preserved in a sleeping posture, so close to each other that they would have been touching in life. Known as “communal roosting,” this behavior is seen in many birds today including chickens and pigeons. The specimen luckily made its way into the hands of researchers currently led by Gregory Funston of the University of Alberta, along with his advisor Dr. Philip Currie (also of the University of Alberta) and the Institute of Paleontology and Geology of Mongolia (based in Ulaanbaatar). Regarding the finding, Funston said, “It’s a fantastic specimen. It’s rare to find a skeleton preserved in life position, so having two complete individuals and parts of a third is really incredible.”
The three juvenile oviraptors had several features that indicated they belonged to a whole new species. Other fossils found in Mongolia also seem to belong to this new species, and further flesh out the life history of these animals. The notable head crest is present even at a young age, but the dinosaurs would have had gradually shorter tails as they aged, and some of their bones fused across their lifetime. Their head crests and tails have been argued to represent sexual display features used in mating, somewhat similar to modern peacocks or turkeys. Funston added “The origins of communal roosting in birds are still debated, so this specimen will provide valuable information on roosting habits in bird-line theropods.”
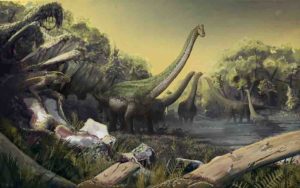
Reconstruction of the new titanosaur and the landscape in which it lived, in what is now Tanzania. Credit: Mark Witton
Paleontologists have identified a new species of titanosaurian dinosaur. The research is reported in a paper published this week in the Journal of Vertebrate Paleontology and is funded by the National Science Foundation (NSF).
The new species is a member of the gigantic, long-necked sauropods. Its fossil remains were recovered from Cretaceous Period (70-100 million years ago) rocks in southwestern Tanzania.
Titanosaur skeletons have been found worldwide, but are best known from South America. Fossils in this group are rare in Africa.
The new dinosaur is called Shingopana songwensis, derived from the Swahili term “shingopana” for “wide neck”; the fossils were discovered in the Songwe region of the Great Rift Valley in southwestern Tanzania.
Part of the Shingopana skeleton was excavated in 2002 by scientists affiliated with the Rukwa Rift Basin Project, an international effort led by Ohio University Heritage College of Osteopathic Medicine researchers Patrick O’Connor and Nancy Stevens.
Additional portions of the skeleton — including neck vertebrae, ribs, a humerus and part of the lower jaw — were later recovered.
“There are anatomical features present only in Shingopana and in several South American titanosaurs, but not in other African titanosaurs,” said lead paper author Eric Gorscak, a paleontologist at the Field Museum of Natural History in Chicago. “Shingopana had siblings in South America, whereas other African titanosaurs were only distant cousins.”
The team conducted phylogenetic analyses to understand the evolutionary relationships of these and other titanosaurs.
They found that Shingopana was more closely related to titanosaurs of South America than to any of the other species currently known from Africa or elsewhere.
“This discovery suggests that the fauna of northern and southern Africa were very different in the Cretaceous Period,” said Judy Skog, a program director in NSF’s Division of Earth Sciences, which supported the research. “At that time, southern Africa dinosaurs were more closely related to those in South America, and were more widespread than we knew.”
Shingopana roamed the Cretaceous landscape alongside Rukwatitan bisepultus, another titanosaur the team described and named in 2014.
“We’re still only scratching the surface of understanding the diversity of organisms, and the environments in which they lived, on the African continent during the Late Cretaceous,” said O’Connor.
During the tectonically active Cretaceous Period, southern Africa lost Madagascar and Antarctica as they split off to the east and south, followed by the gradual northward “unzipping” of South America.
Northern Africa maintained a land connection with South America, but southern Africa slowly became more isolated until the continents completely separated 95-105 million years ago. Other factors such as terrain and climate may have further isolated southern Africa.
Paper co-author Eric Roberts of James Cook University in Australia studied the paleo-environmental context of the new discovery.
The bones of Shingopana, he found, were damaged by the borings of ancient insects shortly after death.
Roberts said that “the presence of bone-borings provides a CSI-like opportunity to study the skeleton and reconstruct the timing of death and burial, and offers rare evidence of ancient insects and complex food webs during the age of the dinosaurs.”
The study was also funded by the National Geographic Society, Jurassic Foundation, Paleontological Society, Ohio University Student Enhancement Award, Ohio University Original Work Grant, Ohio University Heritage College of Osteopathic Medicine, Ohio University Office of the Vice President for Research and Creative Activity, and James Cook University.
This is a coprolite with fish remains. Credit: Martin Qvarnström
Coprolites are fossilized feces that give evidence of an organism’s behavior and often contain food residues, parasite remains and other fossils that provide clues to ancient paleoecological relations. Many of the inclusions in coprolites are delicate and fossilized soft tissues, which in many cases are more likely preserved within the coprolites than in other rocks. However, the composition, size and organization of the inclusions within the coprolites make them difficult to analyze. Classic techniques, such as looking at thin sections under the microscope or Scanning Electron Microscopy (SEM) require destructive preparation and can destroy the specimens. In a new study being presented at the annual Society of Vertebrate Paleontology meeting in Alberta, Canada researchers use synchrotron microtomography to understand as much of the content of the coprolites as possible.
Contents from coprolites from the Upper Triassic bone beds Poland were segmented into 3D models. As researcher Martin Qvarnström explains, “Examples from two feces of Triassic age (230 million years old) include delicate remains of beetles in one, and a half-complete fish and fragments of crushed bivalves in the other.” The coprolite with fish remains including fin rays, scales and bones that were fractured and sheared during ingestion/digestion was likely produced by a lungfish. The other coprolite contains various fully three-dimensional beetle remain and was produced by a medium-sized terrestrial animal that evidently targeted small beetles as prey. Likely candidates include animals like cynodonts and archosaurs.
These examples underline the importance of coprolites, which have an underestimated potential in unraveling paleoecological relations from ancient ecosystems. Qvarnström explains, “I investigate the content of vertebrate coprolites with the aim to reconstruct trophic food webs of ancient ecosystems.” Using these new advanced techniques give a rare glimpse into the paleodiets of organisms that lived over 200 million years ago.
This is Brandon Peecook excavating a therapsid (mammal-relative) femur from the upper Permian in North Luangwa National Park, Zambia. Credit: Steve Tolan
The end-Permian mass extinction (EPME) occurred about 250 million years ago and represents the Earth’s most catastrophic extinction event. Up to 96% of marine species and 70% of terrestrial vertebrate species went extinct, opening up habitats for the evolution of dinosaurs and mammals. A new study, being presented at the 77th Annual Society of Vertebrate Paleontology meeting in Calgary, Alberta, compares the recovery of land-dwelling vertebrates from different localities in the southern portion of the super continent Pangaea. Presenter Brandon Peecook explains, “By studying the different ecosystems that assembled after the largest mass extinction in Earth history we can get a sense of the ecological and geographic context in which the earliest members of important lineages (like mammals and dinosaurs) first appeared.”
One of the most studied localities for the extinction of land-dwelling vertebrates during the EPME is the Karoo Basin of South Africa. This geographic area has a continuous record across this massive extinction event and the recovery period. To compare the recovery of vertebrates from different localities, Peecook studied other fossil assemblages from Zambia and Tanzania. “One would expect that animal communities on Pangea would be similar, but intriguingly contemporaneous ecosystems in the wake of the end-Permian mass extinction are starkly different from one another,” Peecook said.
The recovery of organisms after the EPME is extremely important to understand how resilient both marine and terrestrial life is on Earth. The patterns of mass extinction events and subsequent recoveries are among the most powerful contributions of paleontology to evolutionary theory. Mass extinctions are recognized as global events; however, studies of single localities or regions deepen our understanding of extinction and recovery by revealing heterogeneity in timing and process.
Peecock found the recovery of organisms in the Middle Triassic regions studied are very dissimilar. Carnivores and archosaurs are diverse and abundant in Zambia and Tanzania, but relatively uncommon or absent in South Africa. Ecological diversity levels of the Zambian and Tanzanian assemblages are equal to or exceed Permian ecological diversities, whereas those of the Karoo Basin are less. Peecook stated, ” The fossil record is our best source of data on the effects of massive disturbances on natural ecosystems, and their subsequent recoveries. We can’t perform
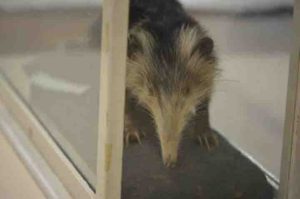
Solenodon, a bizarre venomous mammal from the Caribbean, survived extinction due to its generalist ecology. Credit: Photo by Alexis Mychajliw
Animals that live on islands are among the most at risk from extinction. A remarkable eighty percent of extinctions occurring since 1500AD have been on islands, with inhabitants facing dangers from climate change, sea level rise, invasive species, and human interactions. However, new research presented this week at the Society of Vertebrate Paleontology conference in Alberta, Canada, suggests that one island mammal may hold the key to survival — a flexible diet.
Alexis Mychajliw, a PhD student at Stanford University mentored by Dr. Elizabeth Hadly, is using the Caribbean islands as a living experiment to understand factors driving the extinction of mammals. Since before the time of Columbus, humans have been altering the environments of the Caribbean. Mychajliw wanted to know how the native species responded, which survived and why. She explains “The Caribbean is now full of introduced mammals — cows, pigs, rats, dogs — that look nothing like the original fauna. Are they doing similar things ecologically, or have we created an entirely different dynamic? And where do the remaining native mammals fit in this new ecosystem?”
As part of an international team, Mychajliw gathered data on fossil mammal species and ancient human populations coexisting in the Caribbean for 7000 years. She correlated changes in size and diversity of Caribbean mammals over time with human population growth and climate change. She discovered that there have been extinctions on the Caribbean islands associated with arrival of both indigenous and European human populations, wiping out many of the smallest and largest species. “By piecing together the radiocarbon record, our analysis makes it clear that people had a hand in Caribbean extinctions — both before and after Columbus’ arrival,” says collaborator Dr. Siobhan Cooke. However, one mammal has persisted throughout, the enigmatic Solenodon.
These bizarre mammals resemble giant venomous shrews. “Looking at solenodons today, you might think of them as a strange relictual creature that, like many ancient lineages, can’t keep up with modern threats. But the recent fossil record tells a different story: the solenodon is a survivor, persisting when nearly every other mammal around it went extinct.” Mychajliw explains. To understand the hardiness of Solenodon documented in the fossil record, Mychajliw turned to an unusual source of data — their feces. Using a technique called ‘metabarcoding’, she could genetically analyze the feces of modern Solenodon and piece together variations in their diet. Based on this data, she classified Solenodon as a ‘flexible generalist’ — an animal capable of eating virtually anything. Mychajliw thinks that it is this flexibility that allowed Solenodon to survive human and climatic changes that made other species extinct.
Mychajliw hopes that by teaming with Caribbean conservationists, such as Grupo Jaragua of the Dominican Republic, this work can provide vital clues to tackling our current biodiversity crisis. “By partnering with a conservation group in the community where we work, we’ve been able to directly translate our fossil discoveries into a tangible example of what extinction really looks like and why we need to prevent it”
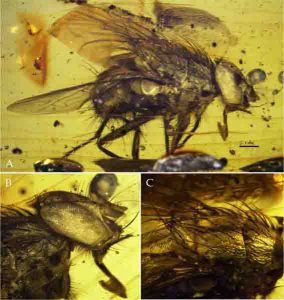
This is a holotype of Mesembrinella caenozoica sp. nov. Credit: Cerretti et al (2017); CCAL
The first unambiguous fossil from the botfly family adds to the few known fossils of a major clade of flies (Calyptratae), shedding light on their rapid radiation during the Cenozoic Era, according to a study published August 23, 2017 in the open-access journal PLOS ONE by Pierfilippo Cerrito from Sapienza Università di Roma, Italy, and colleagues.
The bot fly family (Oestroidea) is the most diverse group of calyptrate flies, which is a clade of some 22,000 living species that comprise about 14% all flies. Calyptrates arose during the Cenozoic, in what was the most rampant radiation of flies ever and among the largest radiations of insects during this era. The clade includes some of the most diverse and ecologically important families of flies: tsetse, louse, and bat flies; house flies and relatives; and blow flies, bot flies, flesh flies, and relatives. Abundant in most terrestrial ecosystems, calyptrates often play key roles as decomposers, parasites, parasitoids, vectors of pathogen vectors, and pollinators. However, there are few reliable calyptrate fossils.
Cerretti and colleagues describe the first unambiguous oestroid fossil: a new species of fly (Mesembrinella caenozoica) discovered in amber from the Dominican Republic. The researchers also used the few known calyptrate fossils as calibration points for a molecular phylogeny to estimate the timing of major radiations in this clade.
The researchers estimate that the most recent common ancestor of today’s calyptrate flies lived about 70 million years ago — that is, just before the Cretaceous-Paleogene boundary; that the radiation of oestroids began about 50 million years ago; and that the family M. caenozoica belongs to (Mesembrinellidae) originated about 40 million years ago. Importantly, the Cretaceous-Paleogene extinction event played a role in major radiations of birds, mammals and angiosperms — and this work suggests that it may also have been crucial to boosting calyptrate diversification during the Cenozoic.
Reference:
Cerretti P, Stireman JO III, Pape T, O’Hara JE, Marinho MAT, Rognes K, et al. First fossil of an oestroid fly (Diptera: Calyptratae: Oestroidea) and the dating of oestroid divergence. PLoS ONE, 2017 DOI: 10.1371/journal.pone.0182101
Note: The above post is reprinted from materials provided by PLOS.
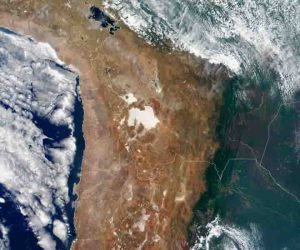
A true-color image of the Central Andes and surrounding landscape acquired by the Moderate-resolution Imaging Spectroradiometer (MODIS), flying aboard NASA’s Terra spacecraft. Credit: Image courtesy of NASA
Seismologists investigating how Earth forms new continental crust have compiled more than 20 years of seismic data from a wide swath of South America’s Andean Plateau and determined that processes there have produced far more continental rock than previously believed.
“When crust from an oceanic tectonic plate plunges beneath a continental tectonic plate, as it does beneath the Andean Plateau, it brings water with it and partially melts the mantle, the layer below Earth’s crust,” said Rice University’s Jonathan Delph, co-author of the new study published online this week in Scientific Reports. “The less dense melt rises, and one of two things happens: It either stalls in the crust to crystallize in formations called plutons or reaches the surface through volcanic eruptions.”
Delph, a Wiess Postdoctoral Research Associate in Rice’s Department of Earth, Environmental and Planetary Science, said the findings suggest that mountain-forming regions like the Andean Plateau, which geologists refer to as “orogenic plateaus,” could produce much larger volumes of continental rock in less time than previously believed.
Study lead author Kevin Ward, a postdoctoral researcher at the University of Utah, said, “When we compared the amount of trapped plutonic rock beneath the plateau with the amount of erupted volcanic rock at the surface, we found the ratio was almost 30:1. That means 30 times more melt gets stuck in the crust than is erupted, which is about six times higher than what’s generally believed to be the average. That’s a tremendous amount of new material that has been added to the crust over a relatively short time period.”
The Andean Plateau covers much of Bolivia and parts of Peru, Chile and Argentina. Its average height is more than 12,000 feet, and though it is smaller than Asia’s Tibetan Plateau, different geologic processes created the Andean Plateau. The mountain-building forces at work in the Andean plateau are believed to be similar to those that worked along the western coast of the U.S. some 50 million years ago, and Delph said it’s possible that similar forces were at work along the coastlines of continents throughout Earth’s history.
Most of the rocks that form Earth’s crust initially came from partial melts of the mantle. If the melt erupts quickly, it forms basalt, which makes up the crust beneath the oceans on Earth; but there are still questions about how continental crust, which is more buoyant than oceanic crust, is formed. Delph said he and Ward began their research in 2016 as they were completing their Ph.D.s at the University of Arizona. The pair spent several months combining public datasets from seismic experiments by several U.S. and German institutions. Seismic energy travels through different types of rock at different speeds, and by combining datasets that covered a 500-mile-wide swath of the Andean Plateau, Ward and Delph were able to resolve large plutonic volumes that had previously been seen only in pieces.
Over the past 11 million years, volcanoes have erupted thousands of cubic miles’ worth of material over much of the Andean Plateau. Ward and Delph calculated their plutonic-to-volcanic ratio by comparing the volume of regions where seismic waves travel extremely slowly beneath volcanically active regions, indicating some melt is present, with the volume of rock deposited on the surface by volcanoes.
“Orogenic oceanic-continental subduction zones have been common as long as modern plate tectonics have been active,” Delph said. “Our findings suggest that processes similar to those we observe in the Andes, along with the formation of supercontinents, could have been a significant contributor to the episodic formation of buoyant continental crust.”
References:
Kevin M. Ward, Jonathan R. Delph, George Zandt, Susan L. Beck, Mihai N. Ducea. Magmatic evolution of a Cordilleran flare-up and its role in the creation of silicic crust. Scientific Reports, 2017; 7 (1) DOI: 10.1038/s41598-017-09015-5
Kevin M. Ward, Jonathan R. Delph, George Zandt, Susan L. Beck, Mihai N. Ducea. Magmatic evolution of a Cordilleran flare-up and its role in the creation of silicic crust. Scientific Reports, 2017; 7 (1) DOI: 10.1038/s41598-017-09015-5
Note: The above post is reprinted from materials provided by Rice University. Original written by Jade Boyd.
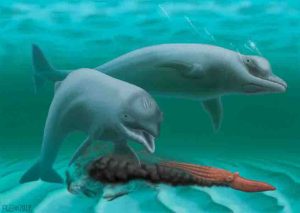
A rendering of the toothless dwarf dolphin, according to the researcher’s findings. Credit: Robert Boessenecker
Continuing to uncover fossil evidence along the coast of South Carolina, researchers, led by a faculty member at College of Charleston, have discovered a species of extinct dolphin. The toothless dolphin, which lived about 28-30 million years ago, provides new evidence of the evolution of feeding behavior in whales (which includes dolphins).
The species, named Inermorostrum xenops, lived during the same period as Coronodon havensteini, a species of ancient whale announced recently by investigators at New York Institute of Technology College of Osteopathic Medicine and College of Charleston in Current Biology.
The skull of Inermorostrum was discovered by a diver in the Wando River in Charleston, just miles from the location where Coronodon’s remains were found, and presents the first clear evidence of suction feeding in echolocating sea mammals. The researchers estimate that the dolphin grew to be only four feet long, smaller than its closest relatives, and significantly smaller than today’s bottlenose dolphins, which measure seven to twelve feet in length.
The study has been released in the journal Proceedings of the Royal Society B.
According to College of Charleston adjunct geology professor Robert W. Boessenecker, Ph.D., the dwarf dolphin had a short snout and entirely lacked teeth. The genus name, Inermorostrum xenops, means “defenseless snout,” referring to its toothless condition. Boessenecker, the lead author of the study, believes that the suction-feeding dolphin fed primarily on fish, squid, and other soft-bodied invertebrates from the seafloor, similar to the feeding behavior of a walrus. Furthermore, a series of deep channels and holes for arteries on the snout indicate the presence of extensive soft tissues, likely enlarged lips, and also perhaps even whiskers.
“We studied the evolution of snout length in cetaceans, and found that during the Oligocene (25-35 million years ago) and early Miocene epochs (20-25 million years ago), the echolocating whales rapidly evolved extremely short snouts and extremely long snouts, representing an adaptive radiation in feeding behavior and specializations,” says Boessenecker. “We also found that short snouts and long snouts have both evolved numerous times on different parts of the evolutionary tree — and that modern dolphins like the bottlenose dolphin, which have a snout twice as long as it is wide, represent the optimum length as it permits both fish catching and suction feeding.”
Research team member, Jonathan Geisler, Ph.D., chair of the Anatomy Department and associate professor at NYITCOM, says the discovery is an important step in understanding why the South Carolina Coast provides unique insights into cetacean evolution.
“Coronodon, a filter feeder whale, and Inermorostrum, a suction feeding dolphin, may well have fed on the same prey. Their feeding behaviors not only help us understand their vastly different body sizes, but also shed light on the ecology of habitats that led to Charleston’s present-day fossil riches,” says Geisler.
Dr. Danielle Fraser, a paleontologist at the Canadian Museum of Nature and also part of the research team, notes that the identification of Inermorostrum opens up new questions about the evolution of early whales. “The discovery of a suction feeding whale this early in their evolution is forcing us to revise what we know about how quickly new forms appeared, and what may have been driving early whale evolution” she explains. “Increased ocean productivity may have been one important factor,” she says.
Many species of Oligocene whales have been described from South Carolina, with several discovered in and around Charleston. The area is among a few in the world, including others in New Zealand, Japan, and the Pacific Northwest, to offer a window into early toothed whale evolution.
Inermorostrum xenops is now on display in the Mace Brown Museum of Natural History at College of Charleston, reunited with its prehistoric neighbor Coronodon havensteini.
Reference:
Robert W. Boessenecker, Danielle Fraser, Morgan Churchill, Jonathan H. Geisler. A toothless dwarf dolphin (Odontoceti: Xenorophidae) points to explosive feeding diversification of modern whales (Neoceti). Proceedings of the Royal Society B: Biological Sciences, 2017; 284 (1861): 20170531 DOI: 10.1098/rspb.2017.0531
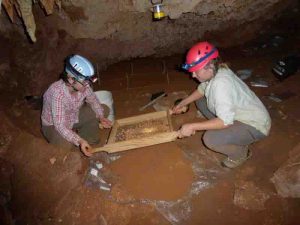
Johns Hopkins paleontologist Siobhán Cooke and her colleague Alexis Mychajliw collect more fossils for dating in a Caribbean cave. Credit: Lauren Gibson
A Johns Hopkins paleontologist and her collaborative team of scientists report they have clear evidence that the arrival of humans and subsequent human activity throughout the islands of the Caribbean were likely the primary causes of the extinction of native mammal species there. The evidence, they say, highlights the need for urgent human intervention to protect the native mammal species still inhabiting the region.
In an article published in the Annual Review of Ecology, Evolution, and Systematics, the investigators describe a chronology they developed from collecting established fossil dates reported in hundreds of already-published and peer reviewed papers in an array of scientific journals. The data, they say, shows mammal extinctions at much higher rates occurring after the arrival of humans on various islands in the Caribbean.
The team’s analysis found “the timing of extinctions indicates humans played a role in the disappearance of many of the endemic Caribbean mammals,” says Siobhan Cooke, Ph.D., assistant professor of functional anatomy and evolution at Johns Hopkins University School of Medicine.
The team created its chronology by collecting and analyzing published extinction dates of mammals from the fossil record and comparing them to the first arrival dates of humans.
By weaving together data scattered across several hundred journal articles and archaeologic site reports, they were able to demonstrate what they believe is evidence of cause and effect in the extinction of more than 60 percent of the nearly 150 native mammal species. Multiple waves of human settlement in the Caribbean occurred over the past six to seven thousand years. The four human settlement waves occurred over the past 6,000 to 7,000 years, and are known as the Lithic, Archaic, Ceramic, and — the most recent — European, which has occurred over the past 500 years.
The authors showed that after each wave of human arrival, mammal extinctions followed, presumably caused by hunting and loss of native mammal habitat due to settlement and agricultural development.
The final wave of human settlement in the Caribbean, the European colonization, severely altered the native ecosystem, Cooke and her team say, owing to the introduction of destructive invasive species by Europeans, including ants, rats, mice, cats, goats, cows, horses, and pigs, many of which established feral populations and pushed the remaining native mammals out of their ecological niches.
The introduction of invasive species coupled with landscape transformation through the clear-cutting of forests for cultivation of commercial field crops such as sugar cane, cotton, coffee and rice, caused “a large burst of extinctions” during that period, says Cooke. Currently, agriculture, mining, and urban development continue to disrupt the native ecosystem.
The mammals that survived these waves of extinction are primarily bats and insectivores, including shrews, says Cooke. Currently, 60 native bat species remain on the islands, nine of which are threatened with extinction, and only 12 other native mammal species survive, eight of which are threatened with extinction, including the hutia, a large rodent, and the solenodon, a shrew-like mammal.
“The current situation is so precarious that if a single cave collapses in a hurricane, for example, an entire species of bats could go extinct,” says Cooke. “Moving forward, it’s clear that we need to manage these threatened and endangered species with a hands-on approach. They need our help to survive.” Native bats are critical to the long-term sustainability of the native ecosystem, as they pollinate flowers, spread seeds and control insect populations.
Cooke’s team is now working to bring together a larger interdisciplinary team to create an intensive conservation management plan incorporating the expertise of conservation researchers, biologists, ecologists, policy-makers, educators, and land and wildlife management experts to save the last surviving native Caribbean mammals. “Our approach on this paper has been deeply collaborative with each co-author bringing their own area of expertise to the table to address these difficult problems,” says Cooke. “To save this community of mammals we need a community of people working together.”
Reference:
Siobhán B. Cooke, Liliana M. Dávalos, Alexis M. Mychajliw, Samuel T. Turvey, Nathan S. Upham. Anthropogenic Extinction Dominates Holocene Declines of West Indian Mammals. Annual Review of Ecology, Evolution, and Systematics, 2016; 48 (1) DOI: 10.1146/annurev-ecolsys-110316-022754
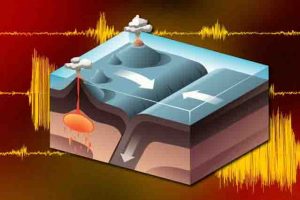
New findings suggest the ancient Earth harbored a mantle that was much more efficient at drawing down pieces of the planet’s crust. Credit: MIT News
Plate tectonics has shaped the Earth’s surface for billions of years: Continents and oceanic crust have pushed and pulled on each other, continually rearranging the planet’s façade. As two massive plates collide, one can give way and slide under the other in a process called subduction. The subducted slab then slips down through the Earth’s viscous mantle, like a flat stone through a pool of honey.
For the most part, today’s subducting slabs can only sink so far, to about 670 kilometers below the surface, before the mantle’s makeup turns from a honey-like consistency, to that of paste — too dense for most slabs to penetrate further. Scientists have suspected that this density filter existed in the mantle for most of Earth’s history.
Now, however, geologists at MIT have found that this density boundary was much less pronounced in the ancient Earth’s mantle, 3 billion years ago. In a paper published in Earth and Planetary Science Letters, the researchers note that the ancient Earth harbored a mantle that was as much as 200 degrees Celsius hotter than it is today — temperatures that may have brewed up more uniform, less dense material throughout the entire mantle layer.
The researchers also found that, compared with today’s rocky material, the ancient crust was composed of much denser stuff, enriched in iron and magnesium. The combination of a hotter mantle and denser rocks likely caused subducting plates to sink all the way to the bottom of the mantle, 2,800 kilometers below the surface, forming a “graveyard” of slabs atop the Earth’s core.
Their results paint a very different picture of subduction than what occurs today, and suggests that the Earth’s ancient mantle was much more efficient in drawing down pieces of the planet’s crust.
“We find that around 3 billion years ago, subducted slabs would have remained more dense than the surrounding mantle, even in the transition zone, and there’s no reason from a buoyancy standpoint why slabs should get stuck there. Instead, they should always sink through, which is a much less common case today,” says lead author Benjamin Klein, a graduate student in MIT’s Department of Earth, Atmospheric and Planetary Sciences (EAPS). “This seems to suggest there was a big change going back in Earth’s history in terms of how mantle convection and plate tectonic processes would have happened.”
Klein’s co-authors are Oliver Jagoutz, associate professor in EAPS, and Mark Behn of the Woods Hole Oceanographic Institution.
Temperature difference
“There’s this open question as to when plate tectonics really started in Earth’s history,” Klein says. “There’s general consensus that it was probably going on back at least 3 billion years ago. This is also when most models suggest the Earth was at its hottest.”
Around 3 billion years ago, the mantle was probably about 150-200 C warmer than it is today. Klein, Jagoutz, and Behn investigated whether hotter temperatures in the Earth’s interior made a difference in how tectonic plates, once subducted, were transported through the mantle.
“Our work started as this thought experiment to say, if we know temperatures were much hotter, how might that have modulated what the tectonics looked like, without changing it wholesale?” Klein says. “Because the debate before was this binary argument: Either there was plate tectonics, or there wasn’t, and we’re suggesting there’s more room in between.”
A “density flip”
The team carried out its analysis, making the assumption that plate tectonics was indeed shaping the Earth’s surface 3 billion years ago. They looked to compare the density of subducting slabs at that time with the density of the surrounding mantle, the difference of which would determine how far slabs would have sunk.
To estimate the density of ancient slabs, Klein compiled a large dataset of more than 1,400 previously analyzed samples of both modern rocks and komatiites — classic rock types that were around 3 billion years ago but are no longer produced today. These rocks contain a higher amount of dense iron and magnesium compared to today’s oceanic crust. Klein used the composition of each rock sample to calculate the density of a typical subducting slab, for both the modern day and 3 billion years ago.
He then estimated the average temperature of a modern versus an ancient subducting slab, relative to the temperature of the surrounding mantle. He reasoned that the distance a slab sinks depends on not only its density but also its temperature relative to the mantle: The colder an object is relative to its surroundings, the faster and further it should sink.
The team used a thermodynamic model to determine the density profile of each subducting slab, or how its density changes as it sinks through the mantle, given the mantle’s temperature, which they took from others’ estimates and a model of the slab’s temperature. From these calculations, they determined the depth at which each slab would become less dense than the surrounding mantle.
At this point, they hypothesized that a “density flip” should occur, such that a slab should not be able to sink past this boundary.
“There seems to be this critical filter and control on the movement of slabs and therefore convection of the mantle,” Klein says.
A final resting place
The team found that their estimates for where this boundary occurs in the modern mantle — about 670 kilometers below the surface — agreed with actual measurements taken of this transition zone today, confirming that their method may also accurately estimate the ancient Earth.
“Today, when slabs enter the mantle, they are denser than the ambient mantle in the upper and lower mantle, but in this transition zone, the densities flip,” Klein says. “So within this small layer, the slabs are less dense than the mantle, and are happy to stay there, almost floating and stagnant.”
For the ancient Earth, 3 billion years ago, the researchers found that, because the ancient mantle was so much hotter than today, and the slabs much denser, a density flip would not have occurred. Instead, subducting slabs would have sunk straight to the bottom of the mantle, establishing their final resting place just above the Earth’s core.
Jagoutz says the results suggest that sometime between 3 billion years ago and today, as the Earth’s interior cooled, the mantle switched from a one-layer convection system, in which slabs flowed freely from upper to lower layers of the mantle, to a two-layer configuration, where slabs had a harder time penetrating through to the lower mantle.
“This shows that when a planet starts to cool down, this boundary, even though it’s always there, becomes a significantly more profound density filter,” Jagoutz says. “We don’t know what will happen in the future, but in theory, it’s possible the Earth goes from one dominant regime of one-layer convection, to two. And that’s part of the evolution of the entire Earth.”
This research was funded, in part, by the National Science Foundation.
Reference:
Benjamin Z. Klein, Oliver Jagoutz, Mark D. Behn. Archean crustal compositions promote full mantle convection. Earth and Planetary Science Letters, 2017; 474: 516 DOI: 10.1016/j.epsl.2017.07.003
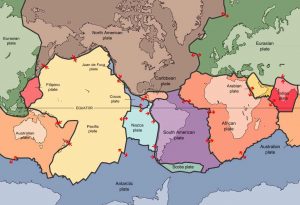
Representative Image: The tectonic plates underlying the continents and oceans. Credit: USGS
Researchers from Germany and Switzerland have used computer simulations to analyse how plate tectonics have evolved on Earth over the last three billion years. They show that tectonic processes have changed in the course of the time, and demonstrate how those changes contributed to the formation and destruction of continents. The model reconstructs how present-day continents, oceans and the atmosphere may have evolved.
Priyadarshi Chowdhury and Prof Dr Sumit Chakraborty from Ruhr-Universität Bochum, together with Prof Dr Taras Gerya from the Swiss Federal Institute of Technology in Zürich (ETH), present their work in the journal Nature Geosciences.
Hotly disputed: when did plate tectonics emerge?
The Earth formed approximately four and a half billion years ago. There was a phase — perhaps even several — when it was mainly composed of molten rock. As it cooled, solid rock and the Earth’s crust formed. Generally speaking, there are two types of crust on Earth: a lighter continental crust that is rich in silicon and constitutes the dry land above sea level, and a denser oceanic crust where water gathers in the form of large oceans. “These properties render the Earth habitable,” says Sumit Chakraborty. “We haven’t found anything comparable anywhere else in the universe.”
Even though the young Earth did have continents and oceans, there were initially perhaps no plates and, consequently, no plate tectonics. The question when they emerged is much disputed. The Earth’s crust slowly assumed its present dynamic form: in some places the plates go into the mantle; in other places new plates form from the hot material that rises from the interior of the Earth.
Also, the question when plate tectonics first emerged is not the only one that remains unanswered; it is also unclear whether that process has always been the same and whether continents last forever or are recycled. These are the questions that the German-Swiss research team investigated. Their new thermomechanical computer model supports the growing notion that perhaps plate tectonics was already operating approximately three billion years ago. More uniquely, the study demonstrates how the Earth’s earliest continental crust — richer in iron and magnesium — was destroyed some two or three billion years ago and how the present continental crust — richer in silicon — formed from it.
Continental recycling is the order of the day
On the young Earth, continents were recycled all the time. Continental recycling still takes place today when two continents collide, but it progresses more slowly and in a different manner than it used to. “Over time, the continental crust became prone to preservation during continent-continent collision,” says Priyadarshi Chowdhury. On the old, still hot Earth, thin layers peeled off from the Earth’s crust whereas on the present-day Earth, chunks of the continental crust break off in the collision zones, i.e. in places where one plate moves under another.
The researchers assume that the destruction of the early iron-magnesium rich continental crust was crucial for the formation of the silicon-rich continents and that it was the reason why these continents could rise above sea level to a larger extent. “These changes to the continental character might have contributed to the Great Oxygenation Event on Earth — and, consequently, to the origin of life as we know it,” suspects Chowdhury.
Reference:
Priyadarshi Chowdhury, Taras Gerya, Sumit Chakraborty. Emergence of silicic continents as the lower crust peels off on a hot plate-tectonic Earth. Nature Geoscience, 2017; DOI: 10.1038/ngeo3010
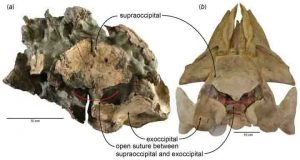
Open suture between the supraoccipital and exoccipital in (A) a fossil baleen whale (Parietobalaena yamaokai) and (B) a fetal specimen of blue whale, Balaenoptera musculus. Credit: Cheng-Hsiu Tsai; CC BY 4.0
Baleen whales are amongst the largest animals to have ever lived and yet very little is known about their breeding habits. One researcher’s second look at previously found baleen whale fossils from Japan provides new evidence of a now long-gone breeding ground of the extinct baleen whale Parietobalaena yamaokai dating back over 15 million years.
The research published in the open-access journal PeerJ elaborates on the evidence of the presence of a very young individual of an extinct baleen whale, along with the occurrence of several fossil specimens of the same whale species. This study claims to have discovered a very uncommon case — a breeding ground for a long extinct large whale.
Researcher Cheng-Hsiu Tsai noticed the open suture in the skull of one fossil specimen, which indicates the preservation of a very young whale — under six months old, perhaps even close to a new-born calf. The fossil specimens investigated were originally found in the 20th century and are currently held at the Hiwa Museum for Natural History, Shobara, Hiroshima, Japan.
Identifying breeding grounds of living species of whales are incredibly rare, let alone for extinct Miocene species. For example, scientists are not certain where the endangered western gray whales reproduce, in turn leading to no concrete strategies to recover this critically endangered population of around 100 individuals.
The discovery of an ancient paleo-breeding site, which dates back to 15 million years ago, could provide new insights into the future of baleen whale survival. In a rapidly changing world, locating breeding sites and understanding why a breeding site disappeared may subsequently lead to information on how best to respond in order to conserve these living endangered populations.
Reference:
Cheng-Hsiu Tsai. A Miocene breeding ground of an extinct baleen whale (Cetacea: Mysticeti). PeerJ, 2017; 5: e3711 DOI: 10.7717/peerj.3711
Note: The above post is reprinted from materials provided by PeerJ.
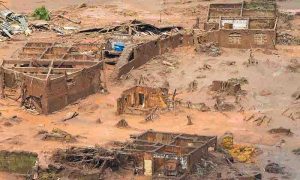
Survey under way seeks to help ensure earthquake-resistant construction becomes more widespread . Credit: Bento Rodrigues, Mariana, MG / Antonio Cruz / Agência Brasil
Researchers are working on a new national map of seismic hazards for Brazil. In preparing the seismic hazard map, the researchers first conducted a survey of the tremors that have occurred in Brazil in recent decades in order to determine the level of seismic activity in each region.
According to the survey, seismic events occur most frequently in the Northeast, especially in the states of Ceará and Rio Grande do Norte, in northern parts of Mato Grosso and Goiás states, and in Mato Grosso state’s wetlands (Pantanal biome). “Actually, any region is susceptible to seismic tremors,” said Marcelo Sousa de Assumpção, a professor at the University of São Paulo. “The probability is higher in some areas, such as Minas Gerais, and lower in others. We don’t yet know exactly why some areas are more active than others.”
“Seismic risk is relatively low in Brazil compared with other South American countries, such as Chile or Peru, thanks to its location in a stable region with very old topography and in the interior of a tectonic plate,” Assumpção said. “But low-and medium-intensity tremors occur with a certain frequency in Brazil, and these can have drastic consequences depending on where they happen.”
A recent example was the series of tremors of magnitudes 2.01 to 2.55 that occurred in Mariana, Minas Gerais state, three days before the collapse of the Fundão tailings dam owned by Samarco, resulting in the worst environmental disaster in Brazilian history. Despite its low magnitude, the epicenter of the 2.5 tremor occurred only 1 km from the tailings dam, according to a statement by Samarco in a report on the causes of the accident prepared by an international committee of experts that analyzed the dam geotechnically.
One of the committee’s conclusions was that low-magnitude tremors cannot endanger well-built structures that are in use. “This dam, however, was in a fragile condition, and the tremors occurred an hour before it burst,” Assumpção said. Based on the frequency and magnitude of these tremors, they estimated the probability of similar tremors in the coming years and the level of vibration they would cause in the soil on which homes, hospitals, stores and other buildings stand, given their distance from the epicenter.
Magnitude 3 tremors, for example, occur twice per month on average in Brazil. Magnitude 4 tremors, such as the 2012 quake in Montes Claros, Minas Gerais, occur twice a year. Magnitude 5 tremors, such as the quake that hit the town of Itacarambi in Minas Gerais in 2007, cause damage and occur once every 50 years, according to the researchers.
“The tremors that occurred before the collapse of Samarco’s tailings dam in Mariana, for example, occur all the time and are felt only when they occur near a town or city,” Assumpção said. “Although seismic events of this magnitude are relatively low-level, if they occur 1 km from a building or in the middle of a town, their intensity can be substantial, and they can have a serious impact on the population.”
He added that Brazil’s seismic-resistant building standard, NBR-15421, in force since 2006, was based on an outdated seismic hazard map. “We believe Brazil has many more earthquake-prone areas than are identified by the old map on which the standard was based,” he said.
Builders of hydroelectric dams are required to perform seismic hazard studies before their designs are approved. In the case of tailings dams, many mining companies perform seismic hazard studies as part of the design process to make sure they can withstand a major earthquake, but not all do so, according to Assumpção. “There were no regulations that required seismic studies for approval of tailings dams,” he said.
Note: The above post is reprinted from materials provided by FAPESP.
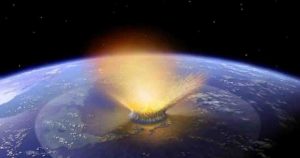
An illustration of an asteroid impacting Earth. Credit: Image courtesy NASA
Tremendous amounts of soot, lofted into the air from global wildfires following a massive asteroid strike 66 million years ago, would have plunged Earth into darkness for nearly two years, new research finds. This would have shut down photosynthesis, drastically cooled the planet, and contributed to the mass extinction that marked the end of the age of dinosaurs.
These new details about how the climate could have dramatically changed following the impact of a 10-kilometer-wide asteroid will be published Aug. 21 in the Proceedings of the National Academy of Sciences. The study, led by the National Center for Atmospheric Research (NCAR) with support from NASA and the University of Colorado Boulder, used a world-class computer model to paint a rich picture of how Earth’s conditions might have looked at the end of the Cretaceous Period, information that paleobiologists may be able to use to better understand why some species died, especially in the oceans, while others survived.
Scientists estimate that more than three-quarters of all species on Earth, including all non-avian dinosaurs, disappeared at the boundary of the Cretaceous-Paleogene periods, an event known as the K-Pg extinction. Evidence shows that the extinction occurred at the same time that a large asteroid hit Earth in what is now the Yucatán Peninsula. The collision would have triggered earthquakes, tsunamis, and even volcanic eruptions.
Scientists also calculate that the force of the impact would have launched vaporized rock high above Earth’s surface, where it would have condensed into small particles known as spherules. As the spherules fell back to Earth, they would have been heated by friction to temperatures high enough to spark global fires and broil Earth’s surface. A thin layer of spherules can be found worldwide in the geologic record.
“The extinction of many of the large animals on land could have been caused by the immediate aftermath of the impact, but animals that lived in the oceans or those that could burrow underground or slip underwater temporarily could have survived,” said NCAR scientist Charles Bardeen, who led the study. “Our study picks up the story after the initial effects — after the earthquakes and the tsunamis and the broiling. We wanted to look at the long-term consequences of the amount of soot we think was created and what those consequences might have meant for the animals that were left.”
Other study co-authors are Rolando Garcia and Andrew Conley, both NCAR scientists, and Owen “Brian” Toon, a researcher at the University of Colorado Boulder.
A world without photosynthesis
In past studies, researchers have estimated the amount of soot that might have been produced by global wildfires by measuring soot deposits still preserved in the geologic record. For the new study, Bardeen and his colleagues used the NCAR-based Community Earth System Model (CESM) to simulate the effect of the soot on global climate going forward. They used the most recent estimates of the amount of fine soot found in the layer of rock left after the impact (15,000 million tons), as well as larger and smaller amounts, to quantify the climate’s sensitivity to more or less extensive fires.
In the simulations, soot heated by the Sun was lofted higher and higher into the atmosphere, eventually forming a global barrier that blocked the vast majority of sunlight from reaching Earth’s surface. “At first it would have been about as dark as a moonlit night,” Toon said.
While the skies would have gradually brightened, photosynthesis would have been impossible for more than a year and a half, according to the simulations. Because many of the plants on land would have already been incinerated in the fires, the darkness would likely have had its greatest impact on phytoplankton, which underpin the ocean food chain. The loss of these tiny organisms would have had a ripple effect through the ocean, eventually devastating many species of marine life.
The research team also found that photosynthesis would have been temporarily blocked even at much lower levels of soot. For example, in a simulation using only 5,000 million tons of soot — about a third of the best estimate from measurements — photosynthesis would still have been impossible for an entire year.
In the simulations, the loss of sunlight caused a steep decline in average temperatures at Earth’s surface, with a drop of 50 degrees Fahrenheit (28 degrees Celsius) over land and 20 degrees Fahrenheit (11 degrees Celsius) over the oceans.
While Earth’s surface cooled in the study scenarios, the atmosphere higher up in the stratosphere actually became much warmer as the soot absorbed light from the Sun. The warmer temperatures caused ozone destruction and allowed for large quantities of water vapor to be stored in the upper atmosphere. The water vapor then chemically reacted in the stratosphere to produce hydrogen compounds that led to further ozone destruction. The resulting ozone loss would have allowed damaging doses of ultraviolet light to reach Earth’s surface after the soot cleared.
The large reservoir of water in the upper atmosphere formed in the simulations also caused the layer of sunlight-blocking soot to be removed abruptly after lingering for years, a finding that surprised the research team. As the soot began to settle out of the stratosphere, the air began to cool. This cooling, in turn, caused water vapor to condense into ice particles, which washed even more soot out of the atmosphere. As a result of this feedback loop — cooling causing precipitation that caused more cooling — the thinning soot layer disappeared in just a few months.
Challenging the model
While the scientists think the new study gives a robust picture of how large injections of soot into the atmosphere can affect the climate, they also caution that the study has limitations.
For example, the simulations were run in a model of modern-day Earth, not a model representing what Earth looked like during the Cretaceous Period, when the continents were in slightly different locations. The atmosphere 66 million years ago also contained somewhat different concentrations of gases, including higher levels of carbon dioxide.
Additionally, the simulations did not try to account for volcanic eruptions or sulfur released from the Earth’s crust at the site of the asteroid impact, which would have resulted in an increase in light-reflecting sulfate aerosols in the atmosphere.
The study also challenged the limits of the computer model’s atmospheric component, known as the Whole Atmosphere Community Climate Model (WACCM).
“An asteroid collision is a very large perturbation — not something you would normally see when modeling future climate scenarios,” Bardeen said. “So the model was not designed to handle this and, as we went along, we had to adjust the model so it could handle some of the event’s impacts, such as warming of the stratosphere by over 200 degrees Celsius.”
These improvements to WACCM could be useful for other types of studies, including modeling a “nuclear winter” scenario. Like global wildfires millions of years ago, the explosion of nuclear weapons could also inject large amounts of soot into the atmosphere, which could lead to a temporary global cooling.
“The amount of soot created by nuclear warfare would be much less than we saw during the K-Pg extinction,” Bardeen said. “But the soot would still alter the climate in similar ways, cooling the surface and heating the upper atmosphere, with potentially devastating effects.”
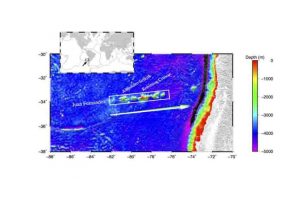
Rice University geophysicists have developed a method that uses the average motion of hot-spot groups by plate to determine that the spots aren’t moving as fast as geologists thought. For example, the Juan Fernandez Chain (outlined by the white rectangle) on the Nazca Plate west of Chile was formed by a hot spot now at the western end of the chain as the Nazca moved east-northeast relative to the hotspot forming the chain that includes Alejandro Selkirk and Robinson Crusoe islands. The white arrow shows the direction of motion of the Nazca Plate relative to the hot spot, and it is nearly indistinguishable from the direction predicted from global plate motions relative to all the hot spots on the planet (green arrow). The similarity in direction indicates that very little motion of the Juan Fernandez hot spot relative to other hot spots is needed to explain its trend. Credit: Illustration by Chengzu Wang/Rice University
Through analysis of volcanic tracks, Rice University geophysicists have concluded that hot spots like those that formed the Hawaiian Islands aren’t moving as fast as recently thought.
Hot spots are areas where magma pushes up from deep Earth to form volcanoes. New results from geophysicist Richard Gordon and his team confirm that groups of hot spots around the globe can be used to determine how fast tectonic plates move.
Gordon, lead author Chengzu Wang and co-author Tuo Zhang developed a method to analyze the relative motion of 56 hot spots grouped by tectonic plates. They concluded that the hot-spot groups move slowly enough to be used as a global reference frame for how plates move relative to the deep mantle. This confirmed the method is useful for viewing not only current plate motion but also plate motion in the geologic past.
The study appears in Geophysical Research Letters.
Hot spots offer a window into the depths of Earth, as they mark the tops of mantle plumes that carry hot, buoyant rock from deep Earth to near the surface and produce volcanoes. These mantle plumes were once thought to be straight and stationary, but recent results suggested they can also shift laterally in the convective mantle over geological time.
The primary evidence of plate movement relative to the deep mantle comes from volcanic activity that forms mountains on land, islands in the ocean or seamounts, mountain-like features on the ocean floor. A volcano forms on a tectonic plate above a mantle plume. As the plate moves, the plume gives birth to a series of volcanoes. One such series is the Hawaiian Islands and the Emperor Seamount Chain; the youngest volcanoes become islands while the older ones submerge. The series stretches for thousands of miles and was formed as the Pacific Plate moved over a mantle plume for 80 million years.
The Rice researchers compared the observed hot-spot tracks with their calculated global hot-spot trends and determined the motions of hot spots that would account for the differences they saw. Their method demonstrated that most hot-spot groups appear to be fixed and the remainder appear to move slower than expected.
“Averaging the motions of hot-spot groups for individual plates avoids misfits in data due to noise,” Gordon said. “The results allowed us to say that these hot-spot groups, relative to other hot-spot groups, are moving at about 4 millimeters or less a year.
“We used a method of analysis that’s new for hot-spot tracks,” he said. “Fortunately, we now have a data set of hot-spot tracks that is large enough for us to apply it.”
For seven of the 10 plates they analyzed with the new method, average hot-spot motion measured was essentially zero, which countered findings from other studies that spots move as much as 33 millimeters a year. Top speed for the remaining hot-spot groups — those beneath the Eurasia, Nubia and North America plates — was between 4 and 6 millimeters a year but could be as small as 1 millimeter per year. That’s much slower than most plates move relative to the hot spots. For example, the Pacific Plate moves relative to the hot spots at about 100 millimeters per year.
Gordon said those interested in paleogeography should be able to make use of the model. “If hot spots don’t move much, they can use them to study prehistorical geography. People who are interested in circum-Pacific tectonics, like how western North America was assembled, need to know that history of plate motion.
“Others who will be interested are geodynamicists,” he said. “The motions of hot spots reflect the behavior of mantle. If the hot spots move slowly, it may indicate that the viscosity of mantle is higher than models that predict fast movement.”
“Modelers, especially those who study mantle convection, need to have something on the surface of Earth to constrain their models, or to check if their models are correct,” Wang said. “Then they can use their models to predict something. Hot-spot motion is one of the things that can be used to test their models.”
Reference:
Chengzu Wang, Richard G. Gordon, Tuo Zhang. Bounds on geologically current rates of motion of groups of hot spots. Geophysical Research Letters, 2017; 44 (12): 6048 DOI: 10.1002/2017GL073430
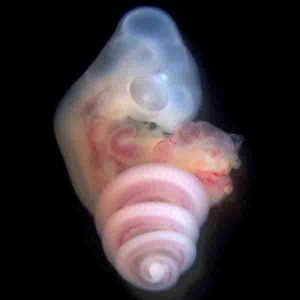
In the snake embryo, onset of GDF11 function in the prospective vertebra region is later than in other vertebrates’ embryos, resulting in a longer flank. Credit: Takayuki Suzuki
In the evolution of tetrapods, the position of the hindlimb has diversified along with the vertebral formula, which is the number of small bones forming the vertebra. Tetrapods, as the name implies, are species that have four feet. However, this group also includes many other animals without four or any feet, such as snakes and birds. This is because tetrapods include all the organisms, living and extinct, that descended from the last common ancestor of amphibians, reptiles and mammals, even if they have secondarily lost their “four feet.”
Although researchers have long studied tetrapod anatomy, how the species-specific position of the body parts of these species — for example, the hindlimb position along the body — are formed in early development remains unclear. Elucidating this mystery will be a major step in evolution biology.
This crucial piece of the puzzle has finally been found by a team of researchers from Nagoya University in Japan. The researchers demonstrated that a protein called GDF11, which is involved in embryonic development, plays a vital role in the eventual position of the sacral vertebrae and the hindlimb. The study results were published in July 2017 in Nature Ecology & Evolution.
“In laboratory mice that do not produce the protein GDF11, we have noted that the sacral vertebrae and the hindlimbs are shifted more to the back,” said Yoshiyuki Matsubara, researcher at the Division of Biological Science and first author of the study.
To arrive at that conclusion, the research team started by analyzing the expression pattern of the gene of interest and examining the relationship between the pattern and the prospective position of the spine and hindlimb at different development stages in chicken embryos. Next, they tested whether hindlimb positioning can be manipulated by changing the timing of GDF11 activity in the embryos. Lastly, to fully elucidate the role of GDF11 in diversification of the hindlimb position in tetrapods, the team examined the correlation between Gdf11 expression and hindlimb positioning in eight tetrapod species, including the African clawed frog, Chinese soft-shelled turtle, ocelot gecko, Japanese striped snake, chick, quail, emu and mouse.
“Our results also suggest that species-specific hindlimb positioning may have been an effect of the change in the timing or rate of events in the gene that expresses GDF11 during embryonic development,” said Takayuki Suzuki, last author of the study.
According to their conclusion, snakes have a long trunk because initiation timing of Gdf11 expression in the developmental stage is much later than that in other tetrapod species.
Based on the present observations, the researchers will propose a model to explain the coupling of sacral-hindlimb positioning in tetrapod evolution. This will lead to a deeper understanding of the diversification of lineage-specific tetrapod hindlimb positions, a valuable piece of information in the field of evolution.
Reference:
Yoshiyuki Matsubara, Tatsuya Hirasawa, Shiro Egawa, Ayumi Hattori, Takaya Suganuma, Yuhei Kohara, Tatsuya Nagai, Koji Tamura, Shigeru Kuratani, Atsushi Kuroiwa, Takayuki Suzuki. Anatomical integration of the sacral–hindlimb unit coordinated by GDF11 underlies variation in hindlimb positioning in tetrapods. Nature Ecology & Evolution, 2017; DOI: 10.1038/s41559-017-0247-y
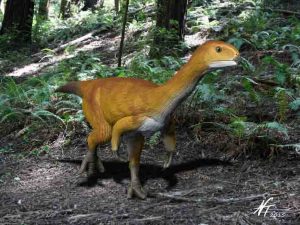
Life reconstruction of Chilesaurus diegosuarezi. Credit: Nobu Tamura
A bizarre dinosaur which looked like a raptor but was in fact a vegetarian may be the ‘missing link’ between plant-eating dinosaurs and theropods, the group that includes carnivores such as Tyrannosaurus rex and Velociraptor.
Researchers from the University of Cambridge and the Natural History Museum used a comprehensive dataset to analyse more than 450 anatomical characteristics of early dinosaurs and correctly place the creature, known as Chilesaurus, in the dinosaur family tree. Their results, reported in the journal Biology Letters, suggest that Chilesaurus effectively fills a large gap between two of the major dinosaur groups, and shows how the divide between them may have happened.
Chilesaurus, which was discovered in southern Chile, was first described in 2015. It lived during the Late Jurassic period, about 150 million years ago, and has an odd collection of physical characteristics, which made it difficult to classify. For example, its head resembles that of a carnivore, but it has flat teeth for grinding up plant matter.
“Chilesaurus almost looks like it was stitched together from different animals, which is why it baffled everybody,” said Matthew Baron, a PhD student in Cambridge’s Department of Earth Sciences and the paper’s joint first author.
Earlier research suggested that this peculiar dinosaur belonging to the group Theropoda, the ‘lizard-hipped’ group of dinosaurs that includes Tyrannosaurus, but the new study suggests that it was probably a very early member of a completely different group, called Ornithischia. This shuffling of the dinosaur family tree has major implications for understanding the origins of Ornithischia, the ‘bird-hipped’ group of dinosaurs that includes Stegosaurus, Triceratops and Iguanodon.
The bird-hipped dinosaurs have several common physical traits: the two most notable of these are an inverted, bird-like hip structure and a beak-like structure for eating. The inverted hips allowed for bigger, more complex digestive systems, which in turn allowed larger plant-eaters to evolve.
While Chilesaurus has a bird-like hip structure, and has flat teeth for grinding up plants, it does not possess the distinctive ‘beak’ of many other bird-hipped dinosaurs, which is what makes it such an important find.
“Before this, there were no transitional specimens – we didn’t know what order these characteristics evolved in,” said Baron. “This shows that in bird-hipped dinosaurs, the gut evolved first, and the jaws evolved later – it fills the gap quite nicely.”
“Chilesaurus is one of the most puzzling and intriguing dinosaurs ever discovered,” said co-author Professor Paul Barrett of the Natural History Museum. “Its weird mix of features places it in a key position in dinosaur evolution and helps to show how some of the really big splits between the major groups might have come about.”
“There was a split in the dinosaur family tree, and the two branches took different evolutionary directions,” said Baron. “This seems to have happened because of change in diet for Chilesaurus. It seems it became more advantageous for some of the meat eating dinosaurs to start eating plants, possibly even out of necessity.”
Earlier this year, the same group of researchers argued that dinosaur family groupings need to be rearranged, re-defined and re-named. In a study published in Nature, the researchers suggested that bird-hipped dinosaurs and lizard-hipped dinosaurs such as Tyrannosaurus evolved from a common ancestor, potentially overturning more than a century of theory about the evolutionary history of dinosaurs.
Although their dataset has already thrown up some surprising results, the researchers say that as it currently analyses only early dinosaurs, there are probably many more surprises about dinosaur evolution to be found, once characteristics of later dinosaurs are added.
Reference:
A dinosaur missing-link? Chilesaurus and the early evolution of ornithischian dinosaurs, Biology Letters, DOI: 10.1098/rsbl.2017.0220
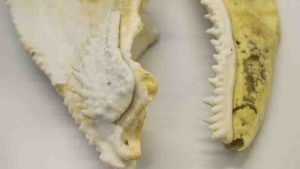
3-D print of the jaw. Credit: Australian National University
A new study from ANU on a 400 million year old fish fossil has found a jaw structure that is part of the evolutionary lineage linked to humans.
The fossil comes from ancient limestones around Lake Burrinjuck, 50 kilometres northwest of Canberra. The area is rich in fossil shells and corals, but also home to the rare skulls of extinct armoured fish called placoderms.
Co-researcher, ANU PhD scholar Yuzhi Hu, said this example was the best preserved skull and braincase of a placoderm ever found.
“The fossil reveals, in intricate detail, the jaw structure of this ancient fish, which is part of the evolutionary lineage that ultimately led to humans,” said Ms Hu from the ANU Research School of Earth Sciences.
“The jaw joint in this ancient fish is still in the human skull, but is now part of the middle ear.”
The team used high-resolution CT scanning facilities at ANU to investigate the internal structure of the skull and braincase and produced high-resolution 3-D printouts to reassemble the jaw elements – a technique never previously used for fossil vertebrates.
Ms Hu analysed the CT scanning data to reveal a complete set of internal jaw cartilages for the first time in any placoderm, with structures surrounding the jaw joint different to all previous interpretations.
“The amazing preservation of the fossil allows us to trace the grooves carrying the blood supply to the jaws and brain,” she said.
Co-researcher Dr Gavin Young, from Department of Applied Mathematics within the ANU Research School of Physics and Engineering, said the direction of blood flow can be worked out for some major arteries.
“The carotid arteries in humans and other mammals bring blood through the neck to supply the head with oxygen,” he said.
“The intersection of grooves on the floor of the braincase in the Burrinjuck fossil shows the blood was flowing in the opposite direction in the equivalent of the external carotid artery, which supplies blood to the jaw and face in humans.
“This was the main oxygenated blood supply to the internal carotid artery, which forms a distinct groove leading to an opening where it entered the brain cavity.”
The extinct placoderms have been traditionally regarded as an evolutionary side branch, until the recent discovery of Chinese maxillate placoderms, a fossil group researched in Beijing by co-author Dr Jing Lu before she came to ANU.
“The maxilla is the bone forming the upper jaw in humans,” said Dr Lu from the Department of Applied Mathematics within the ANU Research School of Physics and Engineering.
“The Chinese fish fossils have this bone, demonstrating a much closer relationship to human ancestry than previously thought. But other internal structures were apparently made of cartilage, and are not clearly preserved, unlike the Burrinjuck skull.”
Dr Lu said very few fossils preserved such intricate details to allow the reconstruction of extinct animals.
“The Australian fossil helps us to interpret these aspects in the Chinese maxillate placoderms,” she said.
“Thanks to the international collaboration, we are making great progress to work out the sequence of key evolutionary innovations at the origin of the jawed vertebrates.”
The paper is published in Scientific Reports.
Reference:
Yuzhi Hu et al. New findings in a 400 million-year-old Devonian placoderm shed light on jaw structure and function in basal gnathostomes, Scientific Reports (2017). DOI: 10.1038/s41598-017-07674-y