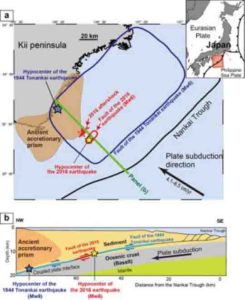
(a) This is a location map showing fault planes of the 2016 earthquake (red) and the 1944 Tonankai earthquake (blue). Yellow and blue stars indicate the hypocenters of the 2016 earthquake and 1944 Tonankai earthquake, respectively. Orange-shaded area indicates ancient accretionary prism. (b) Schematic sections of the accretionary prism in the study area. Fully coupled and partially coupled plate interfaces are shown in red and orange, respectively. Credit: Kyushu University
The islands of the Japanese archipelago are affected both by frequent, low-magnitude earthquakes and tremors and by larger, highly destructive events. One of the largest quakes to strike Japan occurred in 1944, leading to the loss of more than 1,200 lives on the main and most populated island of Honshu. Its strength resulted from the abrupt release of plate tectonic forces, a process known as subduction, centered on an area beneath Honshu where it slides over the top of oceanic crust.
Highly destructive earthquakes caused by subduction occur because of excessive friction that develops during the sliding process, resulting in a build-up of stress. Sudden release of this stress, a condition called rupturing, leads to the violent shaking felt during an earthquake. A recent study led by the International Institute for Carbon-Neutral Energy Research (I2CNER) at Kyushu University in Japan, and published in Earth and Planetary Science Letters, now sheds new light on this stress build-up in tectonic plates. The focus was on the Nankai Trough, one of three major subduction zones offshore of Japan.
“Our understanding of the dynamic behavior of plate boundary faults has advanced,” the study’s lead author Takeshi Tsuji says. “Yet the factors that control the build-up of friction and stress along plate interfaces and in co-seismic zones are less established.”
The researchers used advanced 2D and 3D seismic profiles to reveal the detailed structure of the Nankai Trough, particularly of an ancient accretionary prism — a large mass of rock and sediment accumulated in the trough.
The added mass of this rock and sediment has impeded subduction, ultimately causing stress to build up over time. This stress build-up, and rupturing, was the root cause of the massive 1944 Tonankai earthquake and the smaller Off-Mie earthquake that struck almost the same area on April 1, 2016.
“Along with evidence of frictional obstruction to subduction,” Tsuji says, “the fault structure appears to have also impacted earthquake location and behavior. We found that aftershocks of the 2016 quake only occurred in front of the accretionary prism, where stress accumulation is greatest.”
The long-term implications of the study hinge on evidence that the pre-existing faults from the 1944 earthquake have strongly influenced the orientation and location of rupturing during the 2016 event, suggesting that large earthquakes in Japan are most likely to occur in this very same region of the Nankai Trough in the future.
Reference:
Takeshi Tsuji, Shohei Minato, Rie Kamei, Tetsuro Tsuru, Gaku Kimura. 3D geometry of a plate boundary fault related to the 2016 Off-Mie earthquake in the Nankai subduction zone, Japan. Earth and Planetary Science Letters, 2017; 478: 234 DOI: 10.1016/j.epsl.2017.08.041
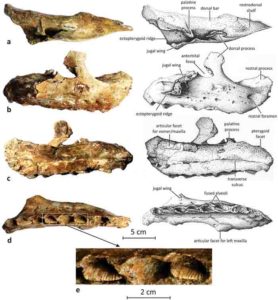
Right maxilla of Matheronodon provincialis gen. et sp. nov. (MMS/VBN-02–102; holotype) in dorsal (a), lateral (b), medial (c), and ventral (d) views. (e) Close-up of the second and third maxillary crowns.
Rhabdodontidae is a successful clade of ornithopod dinosaurs, characteristic of Late Cretaceous continental faunas in Europe.
A new rhabdodontid from the late Campanian, of southern France, Matheronodon provincialis gen. et sp. nov., is characterized by the extreme enlargement of both its maxillary and dentary teeth, correlated to a drastic reduction in the number of maxillary teeth (4 per generation in MMS/VBN-02-102).
The interalveolar septa on the maxilla are alternately present or resorbed ventrally so as to be able to lodge such enlarged teeth. The rhabdodontid dentition and masticatory apparatus were adapted for producing a strict and powerful shearing action, resembling a pair of scissors. With their relatively simple dentition, contrasting with the sophisticated dental batteries in contemporary hadrosaurids, Matheronodon and other rhabdodontids are tentatively interpreted as specialized consumers of tough plant parts rich in sclerenchyma fibers, such as Sabalites and Pandanites.
Rhabdodontids are basal iguanodontian dinosaurs and characteristic elements of Late Cretaceous dinosaur faunas in Europe. They have also been described in Early Cretaceous deposits of Spain. Rhabdodontids are commonly represented, in late Campanian-early Maastrichtian dinosaur faunas of southern France, by two species of the genus Rhabdodon: R. priscus and R. septimanicus.
Rhabdodontid disarticulated elements have recently been discovered at Velaux-La Bastide Neuve, Bouches-du-Rhône Department, southern France. This locality has yielded an abundant and diversified vertebrate fauna, including the titanosaurid sauropod Atsinganosaurus velauciensis, ankylosaurian remains, theropod teeth, an ontogenetic series of cranial and postcranial elements of the basal eusuchian crocodile Allodaposuchus precedens, pleurodiran and cryptodiran turtles, pterosaurs, hybodont shark teeth, and mawsoniid bones. Here we describe a new rhabdodontid dinosaur, Matheronodon provincialis, from Velaux-La Bastide Neuve, with a quite unusual dentition.
Reference:
Extreme tooth enlargement in a new Late Cretaceous rhabdodontid dinosaur from Southern France. DOI:10.1038/s41598-017-13160-2
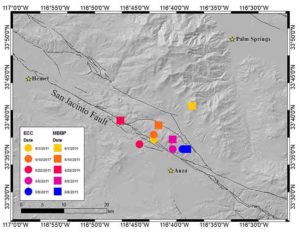
Locations of tectonic tremor (colored circles and squares) detected under the San Jacinto Fault by researchers at UCR. Credit: University of California – Riverside
Scientists at the University of California, Riverside have detected spontaneous tectonic tremor—a signature of slow earthquakes deep below the earth’s surface—in the Anza Gap region of the San Jacinto Fault. Tectonic tremors are believed to increase the likelihood of a moderate to large, damaging earthquake occurring close to the earth’s surface by altering the stress along the fault.
Abhijit Ghosh, an assistant professor of earth sciences in UCR’s College of Natural and Agricultural Sciences, and Alexandra Hutchinson, an earth sciences graduate student, published the research in the Bulletin of the Seismologic Society of America.
The paper is titled “Ambient Tectonic Tremor in the San Jacinto Fault, Near the Anza Gap, Detected by Multiple Mini Seismic Arrays.”
The San Jacinto Fault zone, which is part of the San Andreas Fault system, runs underneath densely populated areas of Inland Southern California, including San Bernardino, Redlands, and Moreno Valley. It is the most active fault in Southern California and sits five miles from the UCR campus. While it is technically not a plate boundary, the San Jacinto Fault accommodates some of the movement that occurs as the North American Plate and the Pacific Plate grind together at the San Andreas Fault.
Over the past 200 years, the 20-km region known as the Anza Gap is the only stretch along the 200-km fault line that has not experienced an earthquake of magnitude 5.5 or greater.
“While other regions of the San Jacinto fault give rise to small and moderate earthquakes on a regular basis, the Anza Gap is surprisingly quiet, which raises questions about how it is releasing the stress it accumulates,” Ghosh said. “For that reason, many experts suspect that this area is ripe to produce a damaging earthquake.”
Using data from 2011 and a new, highly sensitive detection method developed by Ghosh called “multibeam backprojection,” the researchers uncovered the first evidence of a spontaneous tectonic tremor in the Anza Gap. Relatively little is known about tectonic tremors, which were first identified in Japan in 2001. Researchers now know they are associated with a phenomenon called “slow slip,” a slow and transient movement of plates deep below the earth’s surface that can last from several minutes to several years and may occur daily, annually, or anywhere between, depending on the fault.
“While relatively little is known about tectonic tremors, in part because they have historically been difficult to detect, we know that these tremors are being caused by slow slip deep in the fault, and that when the deep part of the fault slips it adds stress to the shallow part. This may ultimately help to cause a damaging earthquake,” Ghosh said.
Ghosh said seismologists should further study tremor activity in the area to learn how the deep roots of fault zones impact activity closer to the earth’s surface and affect earthquake hazard.
“Tectonic tremors and slow slip will change the way we view faults. For example, our research on the Anza gap shows that the fault is spontaneously slipping at a greater depth than we previously thought, with slow earthquakes occurring between 13 and 24 km deep.”
“Since there is a connection between deep slow slip and damaging earthquakes closer to the surface, it may be possible that tectonic tremors will enable us to forecast major earthquakes in the future. Much more research is needed before that can happen, though.”
Reference:
Ambient Tectonic Tremor in the San Jacinto Fault, near the Anza Gap, Detected by Multiple Mini Seismic Arrays. Bulletin of the Seismological Society of America. DOI: doi.org/10.1785/0120160385
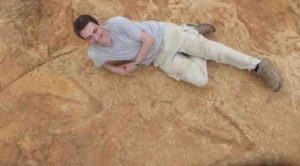
Fabien Knoll, Honorary Senior Research Fellow at the University of Manchester, lies next to the new exceptionally large carnivorous dinosaur footprints found in Lesotho. Credit: Fabien Knoll
An international team of scientists has discovered the first evidence that a huge carnivorous dinosaur roamed southern Africa 200 million year ago.
The team, which includes researchers from The University of Manchester, University of Cape Town, South Africa, and Universidade de São Paulo, Brazil, have found several three-toed footprints measuring 57cm long and 50cm wide.
This means the dinosaur would have an estimated body length of around nine metres (30 feet) and be a little less than three metres tall at the hip. That’s four times the size of a lion, which is currently the largest carnivore in southern Africa.
The footprints belong to a new species, named Kayentapus ambrokholohali, which is part of the group of dinosaurs called “megatheropod.” The term “Megatheropods” describes the giant two-legged carnivorous dinosaurs, such as the iconic Tyrannosaurus rex (T. rex) which fossil evidence shows was around 12 metres long.
This study, which is published in PLOS ONE, also reveals that these footprints make up the largest theropod tracks in Africa.
The tracks were found on an ancient land surface, known as a palaeosurface, in the Maseru District of Lesotho, a small country in southern Africa. The surface is covered in 200 million years old ‘current-ripple marks’ and ‘desiccation cracks’ which are signs of a prehistoric watering hole or river bank.
Dr Fabien Knoll, Senior Research Fellow at The University of Manchester, said: ‘The latest discovery is very exciting and sheds new light on the kind of carnivore that roamed what is now southern Africa.
‘That’s because it is the first evidence of an extremely large meat-eating animal roaming a landscape otherwise dominated by a variety of herbivorous, omnivorous and much smaller carnivorous dinosaurs. It really would have been top of the food chain.’
What makes the discovery even more important is that these footprints date back to the Early Jurassic epoch, when it was thought the size of most theropod dinosaurs was considerably smaller. On average they were previously thought to be around three to five metres in body length, with some records showing they may have reached seven metres at the very most. It is only much later in the Jurassic and during the Cretaceous, which starts 145 million years ago, that truly large forms of theropods, such as T. rex, appear in body and trace fossil records.
Dr Lara Sciscio, postdoctoral Research Fellow at the University of Cape Town, said: ‘This discovery marks the first occurrence of very large carnivorous dinosaurs in the Early Jurassic of southern Gondwana — the prehistoric continent which would later break up and become Africa and other landmasses. This makes it a significant find. Globally, these large tracks are very rare. There is only one other known site similar in age and sized tracks, which is in Poland.’
The ancient surface where these footprints were found is also covered with the tracks of much smaller theropod dinosaurs.
Dr Knoll added: ‘In South Africa, Lesotho, Zimbabwe and Namibia, there is good record of theropod footprints from the Late Triassic and Early Jurassic epochs. In fact, there are numerous palaeosurfaces where footprints and even tail and body impressions of these, and other animals, can be found. But now we have evidence this region of Africa was also home to a mega-carnivore.’
Reference:
L. Sciscio, E. M. Bordy, M. Abrahams, F. Knoll, B. W. McPhee. The first megatheropod tracks from the Lower Jurassic upper Elliot Formation, Karoo Basin, Lesotho. PLOS ONE, 2017; 12 (10): e0185941 DOI: 10.1371/journal.pone.0185941
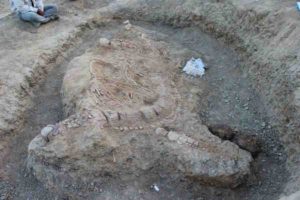
Articulated skeleton of Ophthalmosaurid ichthyosaur at the excavation site south of Lodai village, situated 30 km northeast of Bhuj town, the headquarters of Ka-chchh District in Gujarat state, western India. Credit: Guntupalli V.R. Prasad CC-BY
A new near-complete fossilized skeleton is thought to represent the first Jurassic ichthyosaur found in India, according to a study published October 25, 2017 in the open-access journal PLOS ONE by Guntupalli Prasad from the University of Delhi, India, and colleagues.
Ichthyosaurs, literally ‘fish lizards’ in Greek, were large marine reptiles which lived alongside dinosaurs in the Mesozoic Era. While many ichthyosaur fossils have been found in North American and Europe, in the Southern Hemisphere, their fossil record has mostly been limited to South America and Australia.
Now, the authors of the present study report what they believe to be the first Jurassic ichthyosaur found in India, from the Kachchh area in Gujarat. The near-complete skeleton, nearly 5.5m long, is thought to belong to the Ophthalmosauridae family, which likely lived between around 165 and 90 million years ago. It was found among fossils of ammonites and squid-like belemnites, and its tooth wear patterns suggest it predated such hard, abrasive animals.
While the authors have not yet been able to pinpoint the ichthyosaur’s species, they believe that a full identification could inform on possible ophthalmosaurid dispersal between India and South America. They hope that unearthing more Jurassic vertebrates in this region could provide further insights into the evolution of marine reptiles in this part of the globe.
Lead author Guntupalli Prasad notes: “This is a remarkable discovery not only because it is the first Jurassic ichthyosaur record from India, but also it throws light on the evolution and diversity of ichthyosaurs in the Indo-Madagascan region of the former Gondwanaland and India’s biological connectivity with other continents in the Jurassic.”
Reference:
Guntupalli V. R. Prasad, Dhirendra K. Pandey, Matthias Alberti, Franz T. Fürsich, Mahesh G. Thakkar, Gaurav D. Chauhan. Discovery of the first ichthyosaur from the Jurassic of India: Implications for Gondwanan palaeobiogeography. PLOS ONE, 2017; 12 (10): e0185851 DOI: 10.1371/journal.pone.0185851
Note: The above post is reprinted from materials provided by PLOS.
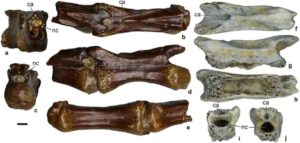
This is an image of alvarezsauridae gen. et sp. indet., posterior caudal vertebrae. Credit: Averianov et al (2017); CCAL
Bones from an Alvarezsaurid dinosaur were discovered in Uzbekistan and could shed light on the evolution and origin of the species, according to a study published October 25, 2017 in the open-access journal PLOS ONE by Alexander Averianov of Zoological Institute of the Russian Academy of Sciences, Russia and Hans-Dieter Sues of the Smithsonian Institution, USA.
Previous studies have described Alvarezsauridae as small, long-legged, bipedal dinosaurs with short forelimbs that featured bird-like hands. Since Alvarezsaurid remains are extremely rare, there is plenty to learn about the evolution of this species.
The authors of this study analyzed previously excavated Alvarezsaurid remains from the Turonian Bissekty Formation of Uzbekistan. They examined the vertebrae, the bird-like bone that fuses the wrist and knuckle known as the carpometacarpus, and pieces of what would be the fingers or toes, known as the phalanx. They then measured and compared the shapes and sizes of these bones with those from similar species from the literature.
The authors state that the characteristics for the Alvarezsaurid bones are so distinctive that it could be identified just from the seven bones collected at the Bissekty Formation. These distinctive features included rounded vertebrae located close to the tail, a large and depressed second metacarpal, and a robust second digit with a claw-like end.
While there are competing theories about where the Alvarezsaurid originated, the authors suggest that the discovery of an Alvarezsaurid at this site in Uzbekistan indicates that this group had an evolutionary history in Asia and provides evidence that this continent could have been where the clade originated.
Lead author Hans Sues says: “Our paper reports the discovery of the earliest known alvarezsaurid dinosaur from the Northern Hemisphere, based on 90-million-year-old fossils from Central Asia. Alvarezsaurids were unusual small predatory dinosaurs that had very short but powerfuly built arms that ended in a single large digit.”
Reference:
Alexander Averianov, Hans-Dieter Sues. The oldest record of Alvarezsauridae (Dinosauria: Theropoda) in the Northern Hemisphere. PLOS ONE, 2017; 12 (10): e0186254 DOI: 10.1371/journal.pone.0186254
Note: The above post is reprinted from materials provided by PLOS.
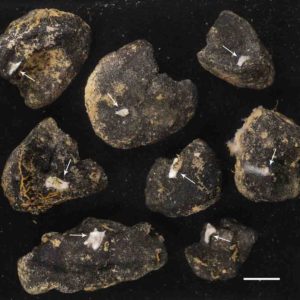
These are polymetallic nodules with Plenaster craigi. White line is 1 cm. Credit: The University of Gothenburg
Less than half of our planet’s surface is covered by land. The rest is water, and this environment is home to an enormous range of animal species, most of which remain undiscovered and thus have not yet been named.
Threatened by Mining Activities
A newly discovered species, Plenaster craigi, has turned out to be the most abundant species on the ocean floors. Its habitat is dominated by nodules, which are metal balls the size of grapefruits that have been formed over millions of years and that are found in most big oceans at depths of over 4 000 metres. A new study involving researchers from the University of Gothenburg finds that, as deep-sea mining companies remove the nodules in order to extract the metals inside them, Plenaster craigi will probably disappear entirely from the affected areas.
‘Modern society, with its power lines and advanced batteries, has a great need for cobalt, nickel and copper, metals found in high concentrations in so-called polymetallic nodules on the Pacific seafloor in the Clarion-Clipperton Zone,’ says Thomas Dahlgren from the Department of Marine Sciences, University of Gothenburg.
Needs an Undisturbed Environment to Survive
The sponge Plenaster craigi must filter the water to find small particles with nutrients and energy that after being formed at surface level several kilometres above have slowly fallen down to the bottom.
‘There is not a whole lot of material that makes it all the way to the bottom. Most of it gets eaten by zooplankton and small fish on its way down and is returned to the food web in the ocean’s upper sunlit layer. Consequently, Plenaster craigi must filter large amounts of water to survive. This makes it vulnerable to the sand and mud stirred up when the nodules are harvested and pumped the 4 000 metres to the collection barges waiting at the surface,’ says Dahlgren.
New Species Can Reveal Effects of Deep-Sea Mining
Since 2013 when the sponge was first discovered, the species has temporarily been referred to as Porifera sp. A. Following the recent species description (see link to the article below), the sponge has now been assigned a permanent name, Plenaster craigi.
Plenaster craigi is the only known species of the newly defined genus Plenaster, which means ‘many stars’. Craigi was included in the name to honour Professor Craig Smith at the University of Hawaii, who led the two expeditions during which the animal was first discovered and collected.
The new species can now be used to explore how deep-see mining of minerals affects an environment that has not been touched for billions of years.
Reference:
A new genus and species of abyssal sponge commonly encrusting polymetallic nodules in the Clarion-Clipperton Zone, East Pacific Ocean. DOI: 10.1080/14772000.2017.1358218
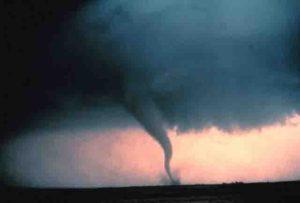
Tornado with dust and debris cloud forming at surface. Credit: NOAA Photo Library/Flickr
Seismic waves generated by tornadoes when they touch down could be used to measure a twister’s intensity, according to a new study.
The new research examined a catastrophic tornado that struck Joplin, Missouri in May 2011 and revealed the size of seismic waves produced by the tornado on the ground correlated with its strength.
The results suggest researchers can estimate a large tornado’s strength by measuring the seismic waves it creates, a finding that could open the door to devising more accurate methods to study tornadoes from the ground, according to the authors of the new study published in Geophysical Research Letters, a journal of the American Geophysical Union.
Weather authorities currently forecast the locations of tornadoes using surface weather stations and Doppler radar. But they still rely on storm chasers and spotters to find out when a tornado touches down. There is also no way to directly measure a tornado’s wind speed, so authorities rely on damage reports to indirectly judge its intensity.
“Our results have applications for developing a more quantitative measure of a tornado’s strength,” said Anne Valovcin, a graduate student in the Earth science department at the University of California in Santa Barbara and lead author of the new study. “Also, we only see the seismic signals when it touches the ground, so that could provide a new way to directly determine when a tornado has touched down.”
A new way to monitor twisters
Seismic waves are vibrations in the Earth created when the ground shakes, usually felt during earthquakes, volcanic eruptions or large explosions. Tornadoes also generate small seismic waves when they travel over the ground, but scientists know little about how these waves vary with storm strength.
In the new study, Valovcin and her colleagues analyzed seismic waves generated by the May 22, 2011 Joplin tornado to characterize the relationship between the size of these waves and the tornado’s strength. The Joplin twister clocked in as a powerful EF5 on the Enhanced Fujita Scale, a scale that rates the intensity of tornadoes by how much damage they cause. It killed 158 people and resulted in $2.8 billion in damage, making it the costliest single tornado in U.S. history.
The study’s authors hypothesized that if the tornado touched the ground close enough to a seismic station, the instruments could pick up those signals. “We wanted to see if we could detect these ground signals, then work backwards and create a model for the seismic waves generated by the tornado along its entire path,” Valovcin said.
The researchers collected data from a network of stations built to detect small earthquakes and map Earth’s interior under North America. These stations are equipped with seismometers and barometers that measure seismic signals and changes in air pressure. The measurements for the new study came from one station close enough to the Joplin tornado to detect its seismic signals.
The authors divided the tornado’s path on land into hundreds of individual points and calculated the size of the seismic wave generated at each point. They then correlated the size of the seismic waves at each stage in the tornado’s lifetime with the tornado’s intensity at that time.
The results show the size of the seismic waves correlated well with the tornado’s EF rating. EF ratings range from EF0 to EF5, with EF5 being the most destructive category. The Joplin tornado went from an EF1-2 to an EF4-5 in fewer than 10 minutes, and stayed at that intensity for approximately 15 minutes before beginning to lose its strength. As the twister got stronger and then weaker, the size of the seismic waves it generated increased and decreased accordingly.
Measuring a tornado’s seismic signals could provide a better way for researchers to measure a tornado’s strength and could help determine exactly when a twister touches down, according to the study’s authors. But they cautioned the new method is largely preliminary and has several limitations.
For example, the technique requires measuring the air pressure at the time of the tornado to eliminate seismic interference from the turbulent air surrounding the twister. Seismic stations therefore need to be located next to functioning barometers to provide usable data.
Additionally, seismic waves generated by tornadoes are very small, and can’t be felt by a person without equipment. They don’t propagate far from their source, unlike seismic waves generated by earthquakes, which are often larger and can travel long distances. Detecting tornadoes in real-time with this method would require building a much denser network of seismic stations and barometers than currently exists, Valovcin said.
Reference:
Anne Valovcin et al. Modeling the Excitation of Seismic Waves by the Joplin Tornado, Geophysical Research Letters (2017). DOI: 10.1002/2017GL074185
A new geological record of the Yellowstone supervolcano’s last catastrophic eruption is rewriting the story of what happened 630,000 years ago and how it affected Earth’s climate. This eruption formed the vast Yellowstone caldera observed today, the second largest on Earth.
Two layers of volcanic ash bearing the unique chemical fingerprint of Yellowstone’s most recent super-eruption have been found in seafloor sediments in the Santa Barbara Basin, off the coast of Southern California. These layers of ash, or tephra, are sandwiched among sediments that contain a remarkably detailed record of ocean and climate change. Together, both the ash and sediments reveal that the last eruption was not a single event, but two closely spaced eruptions that tapped the brakes on a natural global-warming trend that eventually led the planet out of a major ice age.
“We discovered here that there are two ash-forming super-eruptions 170 years apart and each cooled the ocean by about 3 degrees Celsius,” said U.C. Santa Barbara geologist Jim Kennett, who will be presenting a poster about the work on Wednesday, 25 Oct., at the annual meeting of the Geological Society of America in Seattle. Attaining the resolution to detect the separate eruptions and their climate effects is due to several special conditions found in the Santa Barbara Basin, Kennett said.
One condition is the steady supply of sediment to the basin from land — about one millimeter per year. Then there is the highly productive ocean in the area, fed by upwelling nutrients from the deep ocean. This produced abundant tiny shells of foraminifera that sank to the seafloor where they were buried and preserved in the sediment. These shells contain temperature-dependent oxygen isotopes that reveal the sea surface temperatures in which they lived.
But none of this would be much use, said Kennett, if it not for the fact that oxygen levels at the seafloor in the basin are so low as to preclude burrowing marine animals that mix the sediments and degrade details of the climate record. As a result, Kennett and his colleagues can resolve the climate with decadal resolution.
By comparing the volcanic ash record with the foraminifera climate record, it’s quite clear, he said, that both of these eruptions caused separate volcanic winters — which is when ash and volcanic sulfur dioxide emissions reduce that amount of sunlight reaching Earth’s surface and cause temporary cooling. These cooling events occurred at an especially sensitive time when the global climate was warming out of an ice age and easily disrupted by such events.
Kennett and colleagues discovered that the onset of the global cooling events was abrupt and coincided precisely with the timing of the supervolcanic eruptions, the first such observation of its kind.
But each time, the cooling lasted longer than it should have, according to simple climate models, he said. “We see planetary cooling of sufficient magnitude and duration that there had to be other feedbacks involved.” These feedbacks might include increased sunlight-reflecting sea ice and snow cover or a change in ocean circulation that would cool the planet for a longer time.
“It was a fickle, but fortunate time,” Kennett said of the timing of the eruptions. “If these eruptions had happened during another climate state we may not have detected the climatic consequences because the cooling episodes would not have lasted so long.”
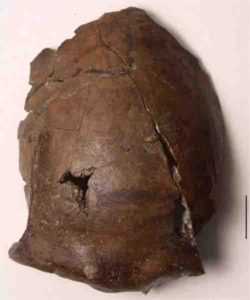
This is the cranium of a person who lived in what’s now Papua New Guinea, 6,000 years ago. Credit: Arthur Durband
Tsunamis spell calamity. These giant waves, caused by earthquakes, volcanic eruptions, and underwater landslides, are some of the deadliest natural disasters known; the 2004 tsunami in the Indian Ocean killed over 230,000 people, a higher death toll than any fire or hurricane. Scientists studying the effects of tsunamis have now shed light on what could be the earliest record of a person killed in a tsunami: someone who lived 6,000 years ago in what’s now Papua New Guinea in the southwest Pacific. Their skull was found in geological sediments having the distinctive hallmarks of ancient tsunami activity. This means, scientists posit in a new paper in PLOS ONE, that this skull could be from the earliest known tsunami victim.
“If we are right about how this person had died thousands of years ago, we have dramatic proof that living by the sea isn’t always a life of beautiful golden sunsets and great surfing conditions,” says John Terrell, Regenstein Curator of Pacific Anthropology at The Field Museum and one of the study’s authors. “Maybe this individual can help us as scientists to convince skeptics today that all of us on earth must take climate change and rising sea levels seriously as the threats they truly are.”
The skull in question was found in 1929, buried in the ground near the small town of Aitape on the northern of Papua New Guinea, about 500 miles north of Australia. Terrell has been doing archaeological and anthropological research in this coastal region of New Guinea, the second largest island in the world, since 1990. The new PLOS One study is a continuation of that work, contributed to by the University of New South Wales, l’Université de Bourgogne-Franche-Comté, the University of Notre Dame, the University of Auckland, New Zealand’s National Institute of Water and Atmospheric Research, the University of Papua New Guinea, Papua New Guinea National Museum and Art Gallery, and The Field Museum. As a member of this international team, Terrell says he has long wondered what to make of this tantalizing human find.
“The skull has always been of great archaeological interest because it is one of the few early skeletal remains from the area,” says Mark Golitko of the University of Notre Dame and The Field Museum. “It was originally thought that the skull belonged to Homo erectus until the deposits were more reliably radiocarbon dated to about 5,000 to 6,000 years. Back then, sea levels were higher and the area would have been just behind the shoreline.”
In 2014 Golitko and others went back to the exact place where this skull had been found to look for new clues about what killed this individual. “We have now been able to confirm what we have long suspected,” says James Goff at the University of New South Wales in Australia, the report’s first author. “The geological similarities between the sediments at the place where the skull was found and sediments laid down during the 1998 tsunami that hit this same coastline have made us realise that human populations in this area have been affected by these massive inundations for thousands of years.”
“Given the evidence we have in hand, we are more convinced than before that this person was either violently killed by a tsunami, or had their grave ripped open by one — leading to their head but not the rest of their body being naturally reburied where it then remained undiscovered in the ground for some 6,000 or so years,” explains Goff.
“It is easy to be fooled by the great beauty of the Sepik coast of Papua New Guinea into thinking that surely this part of the world must be as close to paradise-on-earth as anybody could want. This person’s skull is witness to the fact that here as elsewhere natural disasters can suddenly and unexpectedly turn the world upside down,” says Terrell.
Reference:
James Goff, Mark Golitko, Ethan Cochrane, Darren Curnoe, Shaun Williams, John Terrell. Reassessing the environmental context of the Aitape Skull – The oldest tsunami victim in the world? PLOS ONE, 2017; 12 (10): e0185248 DOI: 10.1371/journal.pone.0185248
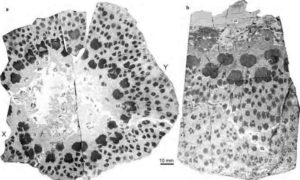
This is an illustrative transverse plane through the small trunk, showing the three naturally-fractured parts. Credit: Xu and Berry, 2017
The first trees to have ever grown on Earth were also the most complex, new research has revealed.
Fossils from a 374-million-year-old tree found in north-west China have revealed an interconnected web of woody strands within the trunk of the tree that is much more intricate than that of the trees we see around us today.
The strands, known as xylem, are responsible for conducting water from a tree’s roots to its branches and leaves. In the most familiar trees the xylem forms a single cylinder to which new growth is added in rings year by year just under the bark. In other trees, notably palms, xylem is formed in strands embedded in softer tissues throughout the trunk.
Writing in the journal Proceedings of the National Academy of Sciences, the scientists have shown that the earliest trees, belonging to a group known as the cladoxlopsids, had their xylem dispersed in strands in the outer 5 cm of the tree trunk only, whilst the middle of the trunk was completely hollow.
The narrow strands were arranged in an organised fashion and were interconnected to each other like a finely tuned network of water pipes.
The team, which includes researchers from Cardiff University, Nanjing Institute of Geology and Palaeontology, and State University of New York, also show that the development of these strands allowed the tree’s overall growth.
Rather than the tree laying down one growth ring under the bark every year, each of the hundreds of individual strands were growing their own rings, like a large collection of mini trees.
As the strands got bigger, and the volume of soft tissues between the strands increased, the diameter of the tree trunk expanded. The new discovery shows conclusively that the connections between each of the strands would split apart in a curiously controlled and self-repairing way to accommodate the growth.
At the very bottom of the tree there was also a peculiar mechanism at play — as the tree’s diameter expanded the woody strands rolled out from the side of the trunk at the base of the tree, forming the characteristic flat base and bulbous shape synonymous with the cladoxylopsids.
Co-author of the study Dr Chris Berry, from Cardiff University’s School of Earth and Ocean Sciences, said: “There is no other tree that I know of in the history of Earth that has ever done anything as complicated as this. The tree simultaneously ripped its skeleton apart and collapsed under its own weight while staying alive and growing upwards and outwards to become the dominant plant of its day.
“By studying these extremely rare fossils, we’ve gained an unprecedented insight into the anatomy of our earliest trees and the complex growth mechanisms that they employed.
“This raises a provoking question: why are the very oldest trees the most complicated?”
Dr Berry has been studying cladoxylopsids for nearly 30 years, uncovering fragmentary fossils from all over the world. He’s previously helped uncovered a previously mythical fossil forest in Gilboa, New York, where cladoxylopsid trees grew over 385 million years ago.
Yet Dr Berry was amazed when a colleague uncovered a massive, well-preserved fossil of a cladoxylopsid tree trunk in Xinjiang, north-west China.
“Previous examples of these trees have filled with sand when fossilised, offering only tantalising clues about their anatomy. The fossilised trunk obtained from Xinjiang was huge and perfectly preserved in glassy silica as a result of volcanic sediments, allowing us to observe every single cell of the plant,” Dr Berry continued.
The overall aim of Dr Berry’s research is to understand how much carbon these trees were capable of capturing from the atmosphere and how this effected Earth’s climate.
Reference:
Hong-He Xu, Christopher M. Berry, William E. Stein, Yi Wang, Peng Tang, Qiang Fu. Unique growth strategy in the Earth’s first trees revealed in silicified fossil trunks from China. Proceedings of the National Academy of Sciences, 2017; 201708241 DOI: 10.1073/pnas.1708241114
Sediments deposited by ice sheet meltwater provide clues about ancient climates, as well as the future effects of global warming. Credit: Francesco Muschitiello
Volcanic eruptions have been known to cool the global climate, but they can also exacerbate the melting of ice sheets, according to a paper published in Nature Communications.
Researchers who analyzed ice cores and meltwater deposits found that ancient eruptions caused immediate and significant melting of the ice sheet that covered much of northern Europe at the end of the last ice age, some 12,000 to 13,000 years ago.
“Over a time span of 1,000 years, we found that volcanic eruptions generally correspond with enhanced ice sheet melting within a year or so,” says lead author Francesco Muschitiello, who completed the research as a postdoctoral fellow at Columbia University’s Lamont-Doherty Earth Observatory.
These weren’t volcanoes erupting on or near the ice sheet, but located a thousand miles away in some cases. The eruptions heaved huge clouds of ash into the sky, and when the ash fell on the ice sheet, its darker color made the ice absorb more solar heat than usual.
“We know that if you have darker ice, you decrease the reflectance and it melts more quickly. It’s basic science,” says Muschitiello. “But no one so far has been able to demonstrate this direct link between volcanism and ice melting when it comes to ancient climates.”
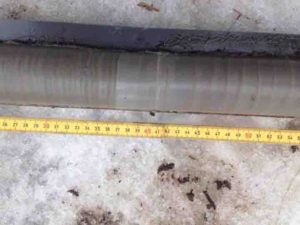
The discovery comes from the cross-sections of deposits, called glacial varves, most of which had been collected in the 1980s and 1990s. Varves are the layered sediments that form when meltwater below an ice sheet routes large amounts of debris into lakes near the sheet’s edge. Like the rings of a tree, the layers of a glacial varve tell the story of each year’s conditions; a thicker layer indicates more melting, since there would have been a higher volume of water to carry the sediment.
The team also compared the varves to cores from the Greenland ice sheet, whose layers contain a record of ancient atmospheric conditions. Testing of those layers for sulfates revealed which years experienced explosive volcanic eruptions, which tend to release large amounts of ash. Matching up the ice layers with varve layers from the same time periods, the team found that years with explosive volcanic activity corresponded to thicker varve layers, indicating more melting of the northern European ice sheet.
Muschitiello and his colleagues studied a period ranging from 13,200 to 12,000 years ago, when the last ice age was transitioning into today’s warm climate. They focused specifically on volcanic eruptions in the northern high latitudes — events similar to the 2010 eruptions of Iceland’s Eyjafjallajökull volcano. Although that eruption was relatively minor, its large ash cloud shut down air traffic across most of Europe for about a week.
How much melting could an eruption like that cause? “It’s difficult to put an exact number to it,” says glaciologist and coauthor James Lea from the University of Liverpool. “It depends on many factors.” Running thousands of model simulations, the team found that the amount of melting depends on the individual eruption, which season it occurs in, the snowpack conditions at the time, and the elevation of the ice sheet. “Change any one of these and you would get different amounts of melt,” says Lea. In the worst scenarios, the model predicted that ash deposition would remove between 20 centimeters and almost one meter of ice from the surface of the highest parts of the ice sheet.
The model results should be taken with a pinch of salt, Muschitiello cautions, due to uncertainties about past conditions. However, because the team simulated a very broad range of potential conditions, he’s confident that the ice sheet’s real response lies somewhere within their range.
Michael Sigl, a paleoclimatologist from the Paul Scherrer Institute in Switzerland who wasn’t involved in the new study, says the hypothesis that ash particles might counteract the cooling effects of volcanic eruptions is intriguing. But, he said, “coincidences in the timing of rapid ice-sheet melting events and eruption dates do not automatically imply causation, and there may be other scenarios that could be consistent with the presented data.” Sigl’s own work has found a link between eruption-induced ozone depletion and deglaciation in the Southern Hemisphere. Nevertheless, he says, the new study shows that more work is needed to understand the effects of aerosol emissions from volcanic eruptions.
The preliminary results suggest that “present day ice sheets are potentially very vulnerable to volcanic eruptions,” says Muschitiello. They also point to a possible hole in the climate models that scientists use to make predictions about the future: Models currently don’t simulate the ice sheets’ response to changes in particulate deposition from the atmosphere in an interactive way.
Another intriguing implication is that previous research has suggested that melting ice sheets and glaciers could increase the frequency of volcanic eruptions in glaciated areas by lightening loads on earth’s crust, allowing underlying magma to rise. If the link between volcanism and ice sheet melting is confirmed, it could indicate the presence of a so-called “positive feedback loop” in which eruptions exacerbate melting, and more melting causes more eruptions, and so on.
Muschitiello says the study “can give us hints about the mechanisms at play when you’re expecting rapid climate change.”
Reference:
Francesco Muschitiello, Francesco S. R. Pausata, James M. Lea, Douglas W. F. Mair, Barbara Wohlfarth. Enhanced ice sheet melting driven by volcanic eruptions during the last deglaciation. Nature Communications, 2017; 8 (1) DOI: 10.1038/s41467-017-01273-1
A rash of earthquakes in southern Colorado and northern New Mexico recorded between 2008 and 2010 was likely due to fluids pumped deep underground during oil and gas wastewater disposal, says a new University of Colorado Boulder study.
The study, which took place in the 2,200-square-mile Raton Basin along the central Colorado-northern New Mexico border, found more than 1,800 earthquakes up to magnitude 4.3 during that period, linking most to wastewater injection well activity. Such wells are used to pump water back in the ground after it has been extracted during the collection of methane gas from subterranean coal beds.
One key piece of the new study was the use of hydrogeological modeling of pore pressure in what is called the “basement rock” of the Raton Basin – rock several miles deep that underlies the oldest stratified layers. Pore pressure is the fluid pressure within rock fractures and rock pores.
While two previous studies have linked earthquakes in the Raton Basin to wastewater injection wells, this is the first to show that elevated pore pressures deep underground are well above earthquake-triggering thresholds, said CU Boulder doctoral student Jenny Nakai, lead study author. The northern edges of the Raton Basin border Trinidad, Colorado, and Raton, New Mexico.
“We have shown for the first time a plausible causative mechanism for these earthquakes,” said Nakai of the Department of Geological Sciences. “The spatial patterns of seismicity we observed are reflected in the distribution of wastewater injection and our modeled pore pressure change.”
A paper on the study was published in the Journal of Geophysical Research: Solid Earth. Co-authors on the study include CU Boulder Professors Anne Sheehan and Shemin Ge of geological sciences, former CU Boulder doctoral student Matthew Weingarten, now a postdoctoral fellow at Stanford University, and Professor Susan Bilek of the New Mexico Institute of Mining and Technology in Socorro.
The Raton Basin earthquakes between 2008 and 2010 were measured by the seismometers from the EarthScope USArray Transportable Array, a program funded by the National Science Foundation (NSF) to measure earthquakes and map Earth’s interior across the country. The team also used seismic data from the Colorado Rockies Experiment and Seismic Transects (CREST), also funded by NSF.
As part of the research, the team simulated in 3-D a 12-mile long fault gleaned from seismicity data in the Vermejo Park region in the Raton Basin. The seismicity patterns also suggest a second, smaller fault in the Raton Basin that was active from 2008-2010.
Nakai said the research team did not look at the relationship between the Raton Basin earthquakes and hydraulic fracturing, or fracking.
The new study also showed the number of earthquakes in the Raton Basin correlates with the cumulative volume of wastewater injected in wells up to about 9 miles away from the individual earthquakes. There are 28 “Class II” wastewater disposal wells – wells that are used to dispose of waste fluids associated with oil and natural gas production – in the Raton Basin, and at least 200 million barrels of wastewater have been injected underground there by the oil and gas industry since 1994.
“Basement rock is typically more brittle and fractured than the rock layers above it,” said Sheehan, also a fellow at CU’s Cooperative Institute for Research in Environmental Sciences. “When pore pressure increases in basement rock, it can cause earthquakes.”
There is still a lot to learn about the Raton Basin earthquakes, said the CU Boulder researchers. While the oil and gas industry has monitored seismic activity with seismometers in the Raton Basin for years and mapped some sub-surface faults, such data are not made available to researchers or the public.
The earthquake patterns in the Raton Basin are similar to other U.S. regions that have shown “induced seismicity” likely caused by wastewater injection wells, said Nakai. Previous studies involving CU Boulder showed that injection wells likely caused earthquakes near Greeley, Colorado, in Oklahoma and in the mid-continent region of the United States in recent years.
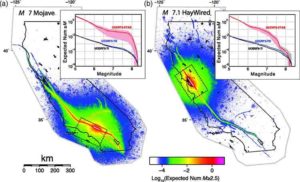
(a) Aftershock nucleation rates following a magnitude 7 earthquake on the Mojave section of the San Andreas fault based on 2×10⁵ UCERF3‐ETAS simulations. (Inset) Magnitude Frequency Distribution for ruptures with some part inside the dashed box defining the greater Los Angeles area. (b) Same as (a), but for an M 7.1 mainshock on the Hayward fault; inset graph pertains to the dashed box defining the San Francisco Bay area. Credit: Sean Cunningham, TACC
Southern California has the highest earthquake risk of any region in the U.S., but exactly how risky and where the greatest risks lie remains an open question.
Earthquakes occur infrequently and depend on complex geological factors deep underground, making them hard to reliably predict in advance. For that reason, forecasting earthquakes means relying on massive computer models and multifaceted simulations, which recreate the rock physics and regional geology and require big supercomputers to execute.
In June 2017, a team of researchers from the U.S. Geological Survey and the Southern California Earthquake Center (SCEC) released a major paper in Seismological Research Letters that summarized the scientific and hazard results of one of the world’s biggest and most well-known earthquake simulation projects: The Uniform California Earthquake Rupture Forecast (UCERF3).
The results relied on computations performed on the original Stampede supercomputer at the Texas Advanced Computing Center, resources at the University of Southern California Center for High-Performance Computing, as well as the newly deployed Stampede2 supercomputer, to which the research team had early access. (Stampede 1 and Stampede2 are supported by grants from the National Science Foundation.)
“High-performance computing on TACC’s Stampede system, and during the early user period of Stampede2, allowed us to create what is, by all measures, the most advanced earthquake forecast in the world,” said Thomas H. Jordan, director of the Southern California Earthquake Center and one of the lead authors on the paper.
The new forecast is the first fault-based model to provide self-consistent rupture probabilities from the very short-term — over a period of less than an hour — to the very long term — up to more than a century. It is also the first model capable of evaluating the short-term hazards that result from multi-event sequences of complex faulting.
To derive the model, the researchers ran 250,000 rupture scenarios of the state of California, vastly more than in the previous model, which simulated 8,000 ruptures.
Among its novel findings, the researchers’ simulations showed that in the week following a magnitude 7.0 earthquake, the likelihood of another magnitude 7.0 quake would be up to 300 times greater than the week beforehand. This scenario of ‘cascading’ ruptures was demonstrated in the 2002 magnitude 7.9 Denali, Alaska, and the 2016 magnitude 7.8 Kaikoura, New Zealand earthquakes, according to David Jacobson and Ross Stein of Temblor.
The dramatic increase in the likelihood of powerful aftershocks is due to the inclusion of a new class of models that assess short-term changes in seismic hazard based on what is known about earthquake clustering and aftershock excitations. These factors have never been used in a comprehensive, statewide model like this one.
The current model also takes into account the likelihood of ruptures jumping from one fault to a nearby one, which has been observed in California’s highly interconnected fault system.
Based on these and other new factors, the new model increases the likelihood of powerful aftershocks but downgrades the predicted frequency of earthquakes between magnitude 6.5 and 7.0, which did not match historical records.
Importantly, UCERF3 can be updated with observed seismicity — real-time data based on earthquakes in action — to capture the static or dynamic triggering effects that play out during a particular sequence of events. The framework is adaptable to many other continental fault systems, and the short-term component might be applicable to the forecasting of minor earthquakes and tremors that are caused by human activity.
The impact of such an improved model goes beyond the fundamental scientific improvement it represents. It has the potential to impact building codes, insurance rates, and the state’s response to a powerful earthquake.
Said Jordan, “The U.S. Geological Survey has included UCERF3 as the California component of the National Seismic Hazard Model, and the model is being evaluated for use in operational earthquake forecasting on timescales from hours to decades.”
ESTIMATING THE COST TO REBUILD
In addition to forecasting the likelihood of an earthquake, models like UCERF3 help predict the associated costs of earthquakes in the region. In recent months, the researchers used UCERF3 and Stampede2 to create a prototype operational loss model, which they described in a paper posted online to Earthquake Spectra in August.
The model estimates the statewide financial losses to the region (the costs to repair buildings and other damages) caused by an earthquake and its aftershocks. The risk metric is based on a vulnerability function and the total replacement cost of asset types in a given census tract.
The model found that the expected loss per year when averaged over many years would be $4.0 billion statewide. More importantly, the model was able to quantify how expected losses change with time due to recent seismic activity. For example, the expected losses in a year following an magnitude 7.1 main shock spike to $24 billion due to potentially damaging aftershocks, a factor of six greater than during “normal” times.
Being able to quantify such fluctuations will enable financial institutions, such as earthquake insurance providers, to adjust their business decisions accordingly.
“It’s all about providing tools that will help make society more resilient to damaging earthquake sequences,” says Ned Field of the USGS, another lead author of the two studies.
Though there’s a great deal of uncertainty in both the seismicity and the loss estimates, the model is an important step at quantifying earthquake risk and potentially devastation in the region, thereby helping decision-makers determine whether and how to respond.
Reference:
A Synoptic View of the Third Uniform California Earthquake Rupture Forecast (UCERF3). DOI: 10.1785/0220170045
The Earth is 4.565 billion years old, give or take a few million years. How do scientists know that? Since there’s no “established in” plaque stuck in a cliff somewhere, geologists deduced the age of the Earth thanks to a handful of radioactive elements.
With radiometric dating, scientists can put an age on really old rocks — and even good old Mother Earth. For the 30th anniversary of National Chemistry Week, this edition of Reactions describes how scientists date rocks
The American Chemical Society, the world’s largest scientific society, is a not-for-profit organization chartered by the U.S. Congress. ACS is a global leader in providing access to chemistry-related information and research through its multiple databases, peer-reviewed journals and scientific conferences. ACS does not conduct research, but publishes and publicizes peer-reviewed scientific studies. Its main offices are in Washington, D.C., and Columbus, Ohio.
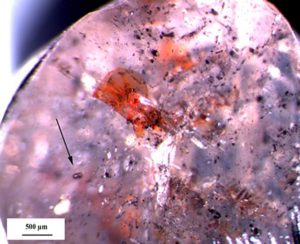
Inclusion within a diamond (black arrow, microscopic Credit: A. Schreiber, GFZ)
Nitrogen is one of the most enigmatic elements within system Earth. No matter where in the world scientists take measurements, in the atmosphere or in solid rock, everywhere they come across the “missing nitrogen“ problem: compared to other planets there is obviously far too little nitrogen found. The scientists Felix Kaminsky, KM Diamond Exploration, Canada, and Richard Wirth, GFZ section Chemistry and Physics of Earth Materials, now identified a “witness“ from the deep that is able to unravel the mystery.
With an amount of 78 percent nitrogen is the main component of air on Earth and it also is a key component of life. A comparison with other planets, however, reveals that there should be a much higher amount found on Earth. According to recent estimates the balance is missing up to 90 percent of nitrogen. Where is it gone? Existing hypotheses assume that large amounts of nitrogen may have been degassed during the formation of Earth or following a meteor impact. Another hypothesis assumes that large amounts of nitrogen may be found within the Earth’s interior, in the Earth’s mantle or core. Since measuring devices cannot reach down there these are, however, not more than assumptions so far.
Diamonds from Northwest Brazil now give the crucial hint. In Rio Soriso volcanic vents, called kimberlite pipes, broke through the Earth’s crust and thereby transported the diamonds up to the Earth’s surface. Felix Kaminsky and Richard Wirth now precisely investigated the molecular composition of inclusions within the diamonds and published their results in the scientific journal American Mineralogist. Wirth: “Diamonds are formed under high pressure and high temperatures within the Earth’s mantle and are transported to the Earth’s surface by volcanic activity. The chemical composition of diamonds and of the inclusions within them are therefore a reflection of the composition of the Earth’s interior”.
Diamonds from kimberlite pipes also occur on other places of the Earth, for example in South Africa, Siberia or the Canadian Shield. However, the diamonds of Rio Soriso are especially rich in inclusions. They were formed in the lowermost layers of the lower mantle and thereby allow for a rare insight into the deep. At the GFZ, Wirth investigated the inclusions by different electron-microscopic methods.
Wirth: “Unlike other diamond deposits on Earth, the inclusions of the Rio Soriso diamonds contain large amounts of nitrogen. For the first time, we were able to detect iron nitrides and carbonitride, chemical compounds of iron and carbon with nitrogen, within diamond inclusions. .” This provides science with an unambiguous proof of the existence of nitrogen in the lower Earth’s mantle and core. The scientists assume that the chemical compounds of iron nitrides and carbonitride are typical compounds of the core-mantle-boundary. Wirth: “The compounds were probably transported by liquid metal from the core to the lowermost layers of the lower mantle.” The search for the “missing nitrogen” of system Earth seems to have come to an end. (ak)
Reference:
Kaminsky, F., Wirth, R., 2017. Nitrides and carbonitrides from the lowermost mantle and their importance in the search for Earth’s “lost” nitrogen. American Mineralogist 102, 1667-1676. DOI: 10.2138/am-2017-6101
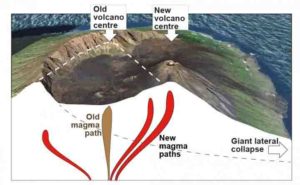
Giant lateral volcano collapses affects the deep paths of magma. This process can be seen at Fogo Volcano, Cabo Verde. Credit: GFZ/Walter
Giant lateral collapses are huge landslides occurring at the flanks of a volcano. Giant lateral collapses are rather common events during the evolution of a large volcanic edifice, often with dramatic consequences such as tsunami and volcano explosions. These catastrophic events interact with the magmatic activity of the volcano, as a new research in Nature Communications suggests. Giant lateral collapses may change the style of volcanism and the chemistry of magma, and as a new study by GFZ scientists reveals, also affects and diverges the deep paths of magmas. New volcano centres may form at other places, which the scientists explain by studying the stress field changes associated with the lateral collapse.
In the study entitled “The effect of giant lateral collapses on magma pathways and the location of volcanism,” authored by F. Maccaferri, N. Richter and T. Walter, all working at GFZ, in section 2.1 (Physics of earthquakes and volcanoes), the propagation path of magmatic intrusions underneath a volcanic edifice has been simulated by means of a mathematical model. Computer simulations revealed that the mechanical effect on the earth crust resulting from a large lateral collapse, can promote the deflection of deep magmatic intrusions, favouring the formation of a new eruptive centre within the collapse embayment. This result has been quantitatively validated against observations at Fogo Volcano, Cabo Verde.
A broader view to other regions reveals that this shift of volcanism associated with giant lateral collapses is rather common, as observed at several of the Canary Islands, Hawaii, Stromboli and elsewhere. This study may have implications particularly for our understanding of the long term evolution of intraplate volcanic ocean islands and sheds lights on the interacting processes occurring during growth and collapse of volcanic edifices.
Reference:
Francesco Maccaferri, Nicole Richter, Thomas R. Walter. The effect of giant lateral collapses on magma pathways and the location of volcanism. Nature Communications, 2017; 8 (1) DOI: 10.1038/s41467-017-01256-2
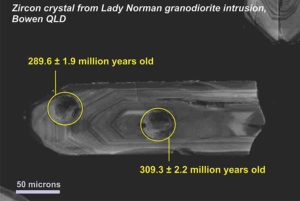
Cathodoluminescence image from a scanning electron microscope of a typical igneous zircon crystal from samples studied by the QUT research team, revealing growth rings of the zircon. Yellow circles enclose ablation sites by a laser from which isotopic data is measured to determine the age of zircon growth. The analytical spots here show this zircon had two main growth periods approximately 20 million years apart in different magmas. Credit: QUT
Zircon crystals in igneous rocks must be carefully examined and not relied upon solely to predict future volcanic eruptions and other tectonic events, QUT researchers have shown.
Zircon is a robust mineral and a timekeeper of Earth history
Distinguishing the origins of zircon crystals, their individual chemistry and properties is not straightforward
Misinterpreting data from zircon crystals could skew timescales for geological events such as volcanic eruptions by millions of years
This has implications for understanding volcanic hazards and the future risks they pose
The researchers’ findings have been published in Earth-Science Reviews. The paper, Use and abuse of zircon-based thermometers: A critical review and a recommended approach to identify antecrystic zircons, also proposes an efficient and integrated approach to assist in identifying zircons and evaluating zircon components sourced from older rocks.
Associate Professor Scott Bryan, from QUT’s Science and Engineering Faculty, said the researchers had “gone back to basic science” and reassessed large data sets of analyses of igneous rocks in Queensland and from around the world, to show that wrong assumptions can be made about zircon crystals.
Igneous rocks are formed by the cooling of magma (molten rock) which makes its way to Earth’s surface, often leading to volcanic eruptions.
“One of the assumptions being made is that the composition of the zircons and the rocks in which they have formed give an accurate record of the magmas and conditions at which the zircons and magmas formed,” Associate Professor Bryan said.
“From this, we then estimate the age of the event that caused them to form.
“But some zircon crystals may not be related to their host rocks at all. They may have come from the source of the magma deep in the Earth’s crust or they may have been picked up by the magma on its way to the surface.
“If you don’t distinguish between the types of crystals then you get a big variation in the age of the event which formed the rocks, potentially millions of years, as well as developing incorrect views on the conditions needed to make magmas.
“It is critical to get the timescales of magmatism correct, so we can understand how long it might take for reservoirs of magma to build up and erupt.”
This is particularly relevant to ‘supervolcanoes’ which do not always have pools of magma sitting beneath them, Associate Professor Bryan said.
There are more than 20 supervolcanoes on Earth, including Yellowstone in the US and Taupo in New Zealand.
“Determining accurately what zircon is telling us is fundamental to understanding Earth’s history, defining major events such as mass extinctions, and how we understand global plate tectonics,” he said.
“We need to understand the past, and read the geological clocks correctly, to accurately predict the future and to mitigate future hazards.”
Reference:
C. Siégel, S.E. Bryan, C.M. Allen, D.A. Gust. Use and abuse of zircon-based thermometers: A critical review and a recommended approach to identify antecrystic zircons. Earth-Science Reviews, 2018; 176: 87 DOI: 10.1016/j.earscirev.2017.08.011
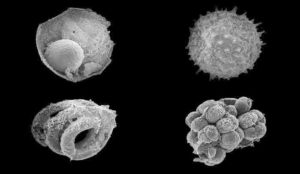
This is an image of assorted microfossils from the Ediacaran Khesen Formation, Mongolia. Each fossil is on the order of 200 microns maximum dimension. Credit: Yale University
A Yale-led research team has discovered a cache of embryo-like microfossils in northern Mongolia that may shed light on questions about the long-ago shift from microbes to animals on Earth.
Called the Khesen Formation, the site is one of the most significant for early Earth fossils since the discovery of the Doushantuo Formation in southern China nearly 20 years ago. The Dousantuo Formation is 600 million years old; the Khesen Formation is younger, at about 540 million years old.
“Understanding how and when animals evolved has proved very difficult for paleontologists. The discovery of an exceptionally well-preserved fossil assemblage with animal embryo-like fossils gives us a new window onto a critical transition in life’s history,” said Yale graduate student Ross Anderson, first author of a study in the journal Geology.
The new cache of fossils represents eight genera and about 17 species, comprising tens to hundreds of individuals. Many of them are spiny microfossils called acritarchs, which are roughly 100 microns in size — about one-third the thickness of a fingernail.
The Khesen Formation is located to the west of Lake Khuvsgul in northern Mongolia. “This site was of particular interest to us because it had the right type of rocks — phosphorites — that had preserved similar organisms in China,” Anderson said.
The discovery may help scientists confirm a much earlier date for the existence of Earth ecosystems with animals, rather than just microbes. For two decades, researchers have debated the findings at the Doushantuo Formation, with no resolution. If confirmed as animals, these microfossils would represent the oldest animals to be preserved in the geological record.
The other authors of the study are Derek Briggs, Yale’s G. Evelyn Hutchinson Professor of Geology and Geophysics and curator at the Yale Peabody Museum of Natural History; Sean McMahon, a postdoctoral fellow in the Briggs lab; Francis Macdonald of Harvard; and David Jones of Amherst College.
The researchers said the Khesen Formation should provide scientists with additional information for years to come.
“This study is only the tip of the iceberg, as most of the fossils derive from only two samples,” Anderson said. Since the original discovery, the Yale team has worked with Harvard and the Mongolian University of Science and Technology to sample several additional sites within the formation.
Reference:
Ross P. Anderson, Francis A. Macdonald, David S. Jones, Sean McMahon, Derek E.G. Briggs. Doushantuo-type microfossils from latest Ediacaran phosphorites of northern Mongolia. Geology, 2017; DOI: 10.1130/G39576.1
Note: The above post is reprinted from materials provided by Yale University. Original written by Jim Shelton.
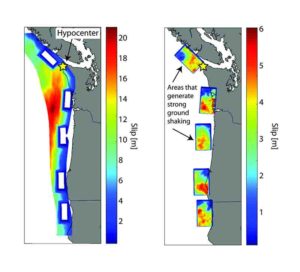
Simulation parameters for the scenario that generated the least shaking in the Seattle area. Credit: Erin Wirth/University of Washington/USGS
One of the worst nightmares for many Pacific Northwest residents is a huge earthquake along the offshore Cascadia Subduction Zone, which would unleash damaging and likely deadly shaking in coastal Washington, Oregon, British Columbia and northern California.
The last time this happened was in 1700, before seismic instruments were around to record the event. So what will happen when it ruptures next is largely unknown.
A University of Washington research project, to be presented Oct. 24 at the Geological Society of America’s annual meeting in Seattle, simulates 50 different ways that a magnitude-9.0 earthquake on the Cascadia subduction zone could unfold.
“There had been just a handful of detailed simulations of a magnitude-9 Cascadia earthquake, and it was hard to know if they were showing the full range,” said Erin Wirth, who led the project as a UW postdoctoral researcher in Earth and space sciences. “With just a few simulations you didn’t know if you were seeing a best-case, a worst-case or an average scenario. This project has really allowed us to be more confident in saying that we’re seeing the full range of possibilities.”
Off the Oregon and Washington coast, the Juan de Fuca oceanic plate is slowly moving under the North American plate. Geological clues show that it last jolted and unleashed a major earthquake in 1700, and that it does so roughly once every 500 years. It could happen any day.
Wirth’s project ran simulations using different combinations for three key factors: the epicenter of the earthquake; how far inland the earthquake will rupture; and which sections of the fault will generate the strongest shaking.
Results show that the intensity of shaking can be less for Seattle if the epicenter is fairly close to beneath the city. From that starting point, seismic waves will radiate away from Seattle, sending the biggest shakes in the direction of travel of the rupture.
“Surprisingly, Seattle experiences less severe shaking if the epicenter is located just beneath the tip of northwest Washington,” Wirth said. “The reason is because the rupture is propagating away from Seattle, so it’s most affecting sites offshore. But when the epicenter is located pretty far offshore, the rupture travels inland and all of that strong ground shaking piles up on its way to Seattle, to make the shaking in Seattle much stronger.”
The research effort began by establishing which factors most influence the pattern of ground shaking during a Cascadia earthquake. One, of course, is the epicenter, or more specifically the “hypocenter,” which locates the earthquake’s starting point in three-dimensional space.
Another factor they found to be important is how far inland the fault slips. A magnitude-9.0 earthquake would likely give way along the whole north-south extent of the subduction zone, but it’s not well known how far east the shake-producing area would extend, approaching the area beneath major cities such as Seattle and Portland.
The third factor is a new idea relating to a subduction zone’s stickiness. Earthquake researchers have become aware of the importance of “sticky points,” or areas between the plates that can catch and generate more shaking. This is still an area of current research, but comparisons of different seismic stations during the 2010 Chile earthquake and the 2011 Tohoku earthquake show that some parts of the fault released more strong shaking than others.
Wirth simulated a magnitude-9.0 earthquake, about the middle of the range of estimates for the magnitude of the 1700 earthquake. Her 50 simulations used variables spanning realistic values for the depth of the slip, and had randomly placed hypocenters and sticky points. The high-resolution simulations were run on supercomputers at the Pacific Northwest National Laboratory and the University of Texas, Austin.
Overall, the results confirm that coastal areas would be hardest hit, and locations in sediment-filled basins like downtown Seattle would shake more than hard, rocky mountaintops. But within that general framework, the picture can vary a lot; depending on the scenario, the intensity of shaking can vary by a factor of 10. But none of the pictures is rosy.
“We are finding large amplification of ground shaking by the Seattle basin,” said collaborator Art Frankel, a U.S. Geological Survey seismologist and affiliate faculty member at the UW. “The average duration of strong shaking in Seattle is about 100 seconds, about four times as long as from the 2001 Nisqually earthquake.”
The research was done as part of the M9 Project, a National Science Foundation-funded effort to figure out what a magnitude-9 earthquake might look like in the Pacific Northwest and how people can prepare. Two publications are being reviewed by the USGS, and engineers are already using the simulation results to assess how tall buildings in Seattle might respond to the predicted pattern of shaking.
As a new employee of the USGS, Wirth will now use geological clues to narrow down the possible earthquake scenarios.
“We’ve identified what parameters we think are important,” Wirth said. “I think there’s a future in using geologic evidence to constrain these parameters, and maybe improve our estimate of seismic hazard in the Pacific Northwest.”