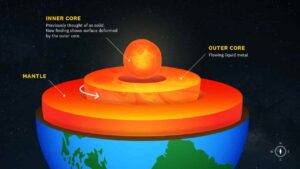
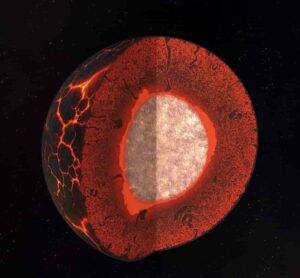
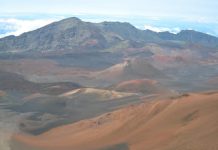
The near surface of the inner core may be changing. (USC Graphic/Edward Sotelo)
Earthquakes, volcanic eruptions, shifting tectonic plates — these are all signs that our planet is alive. But what is revealed deep inside the Earth surprises laymen and scientists alike: Almost 3000 kilometers below the Earth’s surface, solid rock is flowing that is neither liquid, like lava, nor brittle like solid rock. This is shown by a new study by geoscientists led by Motohiko Murakami, Professor of Experimental Mineral Physics at ETH Zurich. The study has just been published in the journal Communications Earth & Environment.
Half a century of guesswork
For over 50 years, researchers have been puzzling over a strange zone deep inside the Earth — the so-called D” layer, around 2700 kilometers beneath our feet. Earthquake waves suddenly behave differently there: their speed jumps as if they were traveling through a different material. What exactly happens at that layer of the mantle has been unclear for a long time, until now.
In 2004, Murakami, who has been a professor at ETH Zurich since 2017, discovered that perovskite, the main mineral of the Earth’s lower mantle, transforms into a new mineral near the D” layer under extreme pressure and very high temperatures — so-called “post-perovskite.”
The researchers assumed that this change explained the strange acceleration of the seismic waves. But that was not the full story. In 2007, Murakami and colleagues found new evidence that the phase change of perovskite alone is not enough to accelerate earthquake waves.
Using a sophisticated computer model, they finally discovered something important: depending on the direction in which the post-perovskite crystals point, the hardness of the mineral changes. Only when all the crystals of the mineral point in the same direction in the model are the seismic waves accelerated — as can be observed in the D” layer at a depth of 2700 kilometers.
In an unusual laboratory experiment at ETH Zurich, Murakami has now proven that post-perovskite crystals align themselves in the identical direction under enormous pressure and extreme temperatures. To do this, the researchers measured the speed of seismic waves in their experiment and were also able to reproduce the jump that occurs at the D” layer in the laboratory. “We have finally found the last piece of the puzzle,” says Murakami.
Mantle flow aligns crystals
The big question is: what makes these crystals line up? The answer is that solid mantle rock that flows horizontally along the lower edge of the Earth’s mantle. Researchers have long suspected that this movement — a kind of convection like boiling water — must exist but have never been able to prove it directly.
A new chapter in Earth research begins
Murakami and his colleagues have now also demonstrated experimentally that mantle convection of solid rock is present at the boundary between the core and the Earth’s mantle, i.e. that solid — not liquid — rock flows slowly but steadily at this depth. “This discovery not only solves the mystery of the D” layer but also opens a window into the dynamics in the depths of the Earth,” Murakami explains.
It is not only a milestone, but also a turning point. The assumption that solid rock flows has been transformed from a theory into a certainty. “Our discovery shows that the Earth is not only active on the surface, but is also in motion deep inside,” says the ETH professor.
With this knowledge, researchers can now begin to map the currents in the Earth’s deepest interior and thus visualize the invisible motor that drives volcanoes, tectonic plates, and perhaps even the Earth’s magnetic field.
Reference:
Motohiko Murakami, Shin-ichiro Kobayashi, Naohisa Hirao, Tomofumi Kawadai. The texture of the post-perovskite phase controls the characteristics of the D” seismic discontinuity. Communications Earth & Environment, 2025; 6 (1) DOI: 10.1038/s43247-025-02383-1
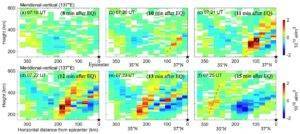
Cross-section showing changes in electron density at different altitudes. Dashed lines show changes in vertical alignment. Credit: Fu et al., 2025
Earthquakes create ripple effects in Earth’s upper atmosphere that can disrupt satellite communications and navigation systems we rely on. Nagoya University scientists and their collaborators have used Japan’s extensive network of Global Navigation Satellite System (GNSS) receivers to create the first 3D images of atmospheric disturbances caused by the 2024 Noto Peninsula Earthquake. Their results show sound wave disturbance patterns in unique 3D detail and provide new insights into how earthquakes generate these waves. The results were published in the journal Earth, Planets and Space.
Mapping electron density in the ionosphere
With over 4,500 GNSS receivers spread across the country, Japan has one of the densest networks in the world. These receivers help with precise location tracking and can also detect changes in a region of the upper atmosphere called the ionosphere. A research team led by Dr. Weizheng Fu and Professor Yuichi Otsuka from Nagoya University’s Institute for Space-Earth Environmental Research (ISEE) has captured the detailed 3D structure of electron density changes in the ionosphere after the 7.5 magnitude Noto Peninsula Earthquake that occurred on January 1, 2024, in Ishikawa Prefecture, Japan.
When satellite signals travel through the ionosphere, they slow down because the radio waves interact with electrically charged particles. By measuring how much the signals slow down, scientists can calculate how many electrons are in the signals’ path and map the total electron content. Mapping these electrons allows them to effectively probe and monitor the state of the ionosphere.
About 10 minutes after the earthquake, the sound waves it generated traveled upward through the atmosphere and reached the ionosphere (60-1000 km above Earth). This created ripple disturbances similar to throwing a stone in a pond.
To build a 3D model of wave patterns, the researchers used a technique called “tomography” — similar to how CT scans create 3D images of the human body. They collected data on electron numbers from thousands of receivers tracking signals from satellites at different angles. By tracking their 3D models at different times after the earthquake, they created a time series of how electron density changed.
Sound waves generated from entire fault lines, not single points
South of the epicenter, the researchers observed a tilted sound wave pattern that gradually became more vertical over time. When an earthquake creates sound waves that travel upward through the atmosphere, the upper parts of the waves move faster than the lower parts. This makes the wave front lean or tilt as it moves. Over time, the tilted pattern gradually straightens into a more vertical alignment.
The researchers produced the first detailed 3D visualization of how the tilt angle changes over time during a seismic event. They tracked how the tilted wave patterns gradually straightened in unprecedented detail. Previous models assumed all sound waves came from a single point at the earthquake’s center. While this matched some of their observations, it could not explain the complex, uneven wave patterns they saw in their 3D images.
To understand this, they included data from multiple wave sources along the fault line in their model, assuming that some parts of the fault generated waves about 30 seconds after the initial rupture. The results better matched their real-world observations and showed that earthquakes do not create atmospheric waves from just one spot, but rather from multiple points along the entire fault as different sections rupture over time. This explains why the atmospheric disturbances observed, such as tilted waves, were more complex than previous simpler models had predicted.
“By including multiple distributed sources and time delays, our improved modeling provides a more accurate representation of how these waves propagate through the upper atmosphere,” Professor Otsuka highlighted.
“Disturbances in the ionosphere can interfere with satellite communications and location accuracy. If we understand these patterns better, we could improve our ability to protect sensitive technologies during and after earthquakes and enhance early warning systems for similar natural events,” Dr. Weizheng Fu, the lead author added.
Moving forward, the researchers are working on applying their model to other natural events such as volcanic eruptions, tsunamis, and severe weather events.
Reference:
Weizheng Fu, Yuichi Otsuka, Nicholas Ssessanga, Atsuki Shinbori, Takuya Sori, Michi Nishioka, Septi Perwitasari. Unveiling the vertical ionospheric responses following the 2024 Noto Peninsula Earthquake with an ultra-dense GNSS network. Earth, Planets and Space, 2025; 77 (1) DOI: 10.1186/s40623-025-02211-y
Several key moments in Earth’s history help us humans answer the question, “How did we get here?” These moments also shed light on the question, “Where are we going”? — offering scientists deeper insight into how organisms adapt to physical and chemical changes in their environment. Among them is an extended evolutionary occurrence over 2 billion years ago, known as the Great Oxidation Event (GOE). This marked the first time that oxygen produced by photosynthesis — essential for the survival of humans and many other life forms — began to accumulate in significant amounts in the atmosphere.
If you traveled back in time to before the GOE (more than ~2.4 billion years ago), you would encounter a largely anoxic (oxygen-free) environment. The organisms that thrived then were anaerobic, meaning they didn’t require oxygen and relied on processes like fermentation to generate energy. Some of these organisms still exist today in extreme environments such as acidic hot springs and hydrothermal vents.
The GOE triggered one of the most profound chemical transformations in Earth’s surface history. It marked the transition from a planet effectively devoid of atmospheric oxygen — and inhospitable to complex life — to one with an oxygenated atmosphere that supports the biosphere we know today.
Scientists have long been interested in pinpointing the timing and causes of major shifts in atmospheric oxygen because they are fundamental to understanding how complex life, including humans, came to be. While our understanding of this critical period is still taking shape, a team of researchers from Syracuse University and MIT is digging deep — literally — into ancient rock cores from beneath South Africa to unearth clues about the timing of the GOE. Their work provides new insight into the pace of biological evolution in response to rising oxygen levels — and the long, complex journey toward the emergence of eukaryotes (organisms whose cells contain a nucleus enclosed within a membrane).
The study, published in the journal Proceedings of the National Academy of Sciences, was led by Benjamin Uveges ’18 Ph.D., who completed the project as a postdoctoral associate at MIT and collaborated with Syracuse University Earth sciences professor Christopher Junium on the chemical analyses.
Answers Embedded in Rock
To step back in time, the research team analyzed sedimentary rock cores collected from several sites across South Africa. These locations were carefully selected because their rocks, dating back 2.2 to 2.5 billion years, fall within the ideal age range for preserving evidence of the GOE. By analyzing stable isotopic ratios embedded in these rocks, the team uncovered evidence of oceanic processes that required the presence of nitrate — an indicator of more oxygen-rich conditions.
To analyze the ancient sediment, Uveges worked with Junium, an associate professor of Earth and environmental sciences at Syracuse University. Junium specializes in studying how past environments evolved to better understand future global change. His state-of-the-art instruments were essential for obtaining accurate readings of trace nitrogen levels.
“The rocks that we analyzed for this study had very low nitrogen concentrations in them, too low to measure with the traditional instrumentation used for this work,” says Uveges. “Chris has built one of only a handful of instruments in the world that can measure nitrogen isotope ratios in samples with 100 to 1,000 times less nitrogen in them than the typical minimum.”
In Junium’s lab, the team analyzed nitrogen isotope ratios from South African rock samples using an instrument called an Isotope Ratio Mass Spectrometer (IRMS). The samples were first crushed into powder, chemically treated to extract specific components, then converted into gas. This gas was ionized (turned into charged particles) and accelerated through a magnetic field, which separated the isotopes based on their mass. The IRMS then measured the ratio of ¹⁵N to ¹⁴N, which can reveal how nitrogen was processed in the past.
So how does this process reveal past oxygen levels? Microbes (short for microorganisms) influence the chemical makeup of sediments before they become rock, leaving behind isotopic signatures of how nitrogen was being processed and used. Tracking changes in ¹⁵N to ¹⁴N over time helps scientists understand how Earth’s environment, particularly oxygen levels, evolved.
Rewriting the Oxygen Timeline
According to Uveges, the most surprising finding is a shift in the timing of the ocean’s aerobic nitrogen cycle. Evidence suggests that nitrogen cycling became sensitive to dissolved oxygen roughly 100 million years earlier than previously thought — indicating a significant delay between oxygen buildup in the ocean and its accumulation in the atmosphere.
Junium notes that these results mark a critical tipping point in the nitrogen cycle, when organisms had to update their biochemical machinery to process nitrogen in a more oxidized form that was harder for them to absorb and use.
“All of this fits with the emerging idea that the GOE was a protracted ordeal where organisms had to find the balance between taking advantage of the energy gains of oxygenic photosynthesis, and the gradual adaptations to dealing with its byproduct, oxygen,” says Junium.
As oxygen produced through photosynthesis began to accumulate in the atmosphere, this rise in oxygen led to the extinction of many anaerobic organisms and set the stage for the evolution of aerobic respiration — a process that uses oxygen to break down glucose and provides the energy needed for functions like muscle movement, brain activity and cellular maintenance in humans and other animals.
“For the first 2 plus billion years of Earth’s history there was exceedingly little free oxygen in the oceans or atmosphere,” says Uveges. “In contrast, today oxygen makes up one fifth of our atmosphere and essentially all complex multicellular life as we know it relies on it for respiration. So, in a way, studying the rise of oxygen and its chemical, geological and biological impacts is really studying how the planet and life co-evolved to arrive at the current situation.”
Their findings reshape our understanding of when Earth’s surface environments became oxygen-rich after the evolution of oxygen-producing photosynthesis. The research also identifies a key biogeochemical milestone that can help scientists model how different forms of life evolved before and after the GOE.
“I hope our findings will inspire more research into this fascinating time period,” says Uveges. “By applying new geochemical techniques to the rock cores we studied, we can build an even more detailed picture of the GOE and its impact on life on Earth.”
This work was funded by grants including: An NSF CAREER award (Syracuse University — Christopher Junium) and a Simons Foundation Origins of Life Collaboration award (MIT — Benjamin Uveges, Gareth Izon and Roger Summons).
Reference:
Benjamin T. Uveges, Gareth Izon, Christopher K. Junium, Shuhei Ono, Roger E. Summons. Aerobic nitrogen cycle 100 My before permanent atmospheric oxygenation. Proceedings of the National Academy of Sciences, 2025; 122 (20) DOI: 10.1073/pnas.2423481122
Note: The above post is reprinted from materials provided by Syracuse University. Original written by Dan Bernardi.
Earth’s largest gold reserves are not kept inside Fort Knox, the United States Bullion Depository. In fact, they are hidden much deeper in the ground than one would expect. More than 99.999% of Earth’s stores of gold and other precious metals lie buried under 3,000 km of solid rock, locked away within the Earth’s metallic core and far beyond the reaches of humankind. Now, researchers from the University of Göttingen have found traces of the precious metal Ruthenium (Ru) in volcanic rocks on the islands of Hawaii that must ultimately have come from the Earth’s core. The findings were published in Nature.
Compared to the Earth’s rocky mantle, the metallic core contains a slightly higher abundance of a particular Ru isotope: 100Ru. This is because part of the Ru, which was locked in the Earth’s core together with gold and other precious metals when it formed 4.5 billion years ago, came from a different source than the scarce amount of Ru that is contained in the mantle today. These differences in 100Ru are so tiny that it was impossible to detect them in the past. Now, new procedures developed by researchers at the University of Göttingen made it possible to resolve them. The unusually high 100Ru signal they found in lavas on the Earth’s surface can only mean that these rocks ultimately originated from the core-mantle boundary.
Dr Nils Messling, at Göttingen University’s Department of Geochemistry, explains: “When the first results came in, we realised that we had literally struck gold! Our data confirmed that material from the core, including gold and other precious metals, is leaking into the Earth’s mantle above.”
Professor Matthias Willbold, at the same department, adds: “Our findings not only show that the Earth’s core is not as isolated as previously assumed. We can now also prove that huge volumes of super-heated mantle material — several hundreds of quadrillion metric tonnes of rock — originate at the core-mantle boundary and rise to the Earth’s surface to form ocean islands like Hawaii.”
This means that at least some of the precarious supplies of gold and other precious metals that we rely on for their value and importance in so many sectors such as renewable energy, may have come from the Earth’s core. Messling concludes: “Whether these processes that we observe today have also been operating in the past remains to be proven. Our findings open up an entirely new perspective on the evolution of the inner dynamics of our home planet.”
Reference:
Nils Messling, Matthias Willbold, Leander Kallas, Tim Elliott, J. Godfrey Fitton, Thomas Müller, Dennis Geist. Ru and W isotope systematics in ocean island basalts reveals core leakage. Nature, 2025; DOI: 10.1038/s41586-025-09003-0
Using advanced technology that analyzes tiny gas bubbles trapped in crystal, a team of scientists led by Cornell University has precisely mapped how magma storage evolves as Hawaiian volcanoes age.
Geologists have long proposed that, as the Hawaiian Islands slowly drift northwest with the Pacific Plate, they move away from a deep, heat-rich plume rising from near Earth’s core. Young volcanoes like Kilauea — positioned directly above the hotspot on Hawaii’s main island — receive a steady flow of magma. Far less is known about older volcanoes like Haleakala — located northwest on the island of Maui — where magma flow has significantly diminished.
The new research finds that as volcanoes move off the hotspot, their magma flow not only shrinks, but shifts deeper underground, reshaping assumptions about how Hawaii’s volcanic “pluming system” has evolved.
“This challenges the old idea that eruptions are fueled by magma stored in the Earth’s crust and suggests a new possibility,” said lead author Esteban Gazel, “that magma is stored and matures in the Earth’s mantle, and eruptions are fueled from this deep mantle reservoir.”
By analyzing fluid inclusions — tiny gas bubbles trapped inside crystals formed in magma — the researchers calculated the pressure, and therefore the depth, at which the inclusions were trapped before an explosive eruption ejects them to the surface.
“The technology allows us to measure pressure from depths with an uncertainty as small as just hundreds of meters, which is very, very precise for depths that are tens of kilometers below the surface,” Gazel said. “Before this, measuring magma storage was much more difficult, with uncertainties that could span kilometers.”
To achieve such level of precision, researchers optimized a custom gas chamber that fits under a laser-based Raman spectrometer.
“Our contribution to significantly increase accuracy was to get the thermocouple inside the chamber and precisely control and measure temperature and pressure,” Gazel said. By analyzing carbon dioxide behavior, researchers can determine its density and calculate the original depth of magma storage, he added.
The method was applied to samples from three Hawaiian volcanoes representing different evolutionary stages:
Kilauea, an active “shield” volcano, showed magma storage at shallow depths of 1-2 kilometers, consistent with previous findings;
Haleakala, in the post-shield stage, revealed dual storage zones: one shallow at approximately 2 kilometers and one deep at 20-27 kilometers in the Earth’s mantle; and
Diamond Head, a rejuvenation-stage volcanic vent on the island of O’ahu, showed magma stored around 22-30 kilometers deep, all within the Earth’s mantle.
“Knowing these depths precisely matters, because to understand the drivers of eruptions, one of the most important constraints is where magma is stored,” Gazel said. “That is fundamental for physical models that will explain eruptive processes and is required for volcanic risk assessment.”
Reference:
Esteban Gazel, Kyle Dayton, Wenwei Liang, Junlin Hua, Kendra J. Lynn, Julia E. Hammer. Crustal to mantle melt storage during the evolution of Hawaiian volcanoes. Science Advances, 2025; 11 (20) DOI: 10.1126/sciadv.adu9332
Note: The above post is reprinted from materials provided by Cornell University. Original written by Syl Kacapyr, courtesy of the Cornell Chronicle.
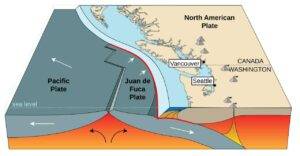
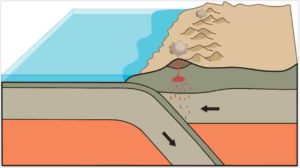
Illustration of the Cascadia subduction zone, a region where the patterns examined in this study play out. (Credit: Carie Frantz, Wikimedia Commons)
When we think of earthquakes, we imagine sudden, violent shaking. But deep beneath the Earth’s surface, some faults move in near silence. These slow, shuffling slips and their accompanying hum — called tremors — don’t shake buildings or make headlines. But scientists believe they can serve as useful analogs of how major earthquakes begin and behave.
A new study by geophysicists at UC Santa Cruz explains how some of these tremor events can yield insights into how stress builds up on the dangerous faults above where major earthquakes occur. The study, to be published on May 14 in the journal Science Advances, was led by Gaspard Farge, a postdoctoral researcher in the university’s Seismo Lab, and Earth and planetary sciences professor Emily Brodsky, the lab’s principal investigator.
When faults where tectonic plates meet slip fast past each other, earthquakes result. Tremors are produced when this happens slowly, usually tens of miles underground — often in subduction zones, where one plate dives beneath another. Tremors don’t pose immediate danger, but they also shouldn’t be ignored because they often happen in the vicinity of where the world’s biggest earthquakes eventually occur, say the study’s authors.
“We find that the faults that produce tremor are more sensitive and connected to their surroundings than previously thought,” said Farge, who researches what processes shape minute seismic activity. “Even small, frequent earthquakes can affect how a major fault behaves.”
Chaotic effect of small quakes
Farge and Brodsky discovered that small earthquakes, even those tens of kilometers away from the main fault, can disturb a tremor’s natural rhythm. As a patch of the fault begins to slip, it usually nudges its neighbors along for the ride — leading to large, synchronized tremor episodes. But when small quakes send seismic waves rippling through the area, they can throw off that coordination.
These outside disturbances can either speed up or delay tremor activity, depending on timing and location. And because small earthquakes happen far more often than large ones, they may constantly jostle the system out of synchrony.
Over time, this could explain why some segments of a fault show highly regular tremor patterns — slipping in coordinated episodes — while others remain chaotic. The segments aren’t just shaped by the rocks underground, a marble here, granite there; they also adapt to the constant perturbation from nearby seismic activity.
The dynamic Northwest
This pattern is evident in the Cascadia subduction zone, which extends from Northern California, through Oregon and Washington, to British Columbia. The zone produces extensive tremor activity and very large earthquakes on a 400-year basis. Across Oregon, the subduction is almost silent — and without perturbation from earthquakes — the plate slips like a clock, every year and a half in a section hundreds of kilometers long, tremor producing events.
In Northern California, however, the activity of small earthquakes near Cape Mendocino disturbs the regularity of the fault, and the tremor is produced in small, disorganized episodes.
Scientists have known that the shape and makeup of a fault zone — the rock types, temperature, water content, and even the slope of the sinking plate — all help define how and where a tremor happens. These are called structural factors, and they affect how sticky the fault is and how easily it slips.
But this new study introduces a twist: dynamic factors, like the stress waves from small earthquakes nearby, may also shape when and where tremor happens — and whether it occurs in a smooth, predictable way or in a scattered, messy fashion.
“These findings go beyond tremors. By showing how small earthquakes can affect the timing and behavior of slow fault movements, this discovery opens up new ways to understand the buildup to large, damaging earthquakes,” said Brodsky, a leading earthquake physicist. “If we can track how a tremor responds to these small stress nudges, it may be possible to read the stress landscape of a fault — offering clues about where and when it might rupture in a big way.”
Quake magnitude isn’t everything
This study shifts our understanding of a common assumption: that only large forces shape the behavior of major earthquake faults. In fact, tiny, nearby quakes — usually considered too small to matter — may play an outsized role in defining where and how the Earth’s plates slip past one another. That means that by listening to the Earth’s quietest rumbles, we may be able to learn how to better anticipate its loudest ones.
“Ultimately,” Brodsky said, “this study proposes a way to measure the elusive dynamic factors that influence how fault slips — the stress landscape that informs how stress is built up on these dangerous faults.”
“The fact that we can measure and understand the effects of earthquakes’ perturbation on slow fault ruptures gives us hope that we could use the same logic to understand where earthquakes should be expected to be regular, and where not,” Farge concludes.
Reference:
Gaspard Farge, Emily E. Brodsky. The big impact of small quakes on tectonic tremor synchronization. Science Advances, 2025; 11 (20) DOI: 10.1126/sciadv.adu7173
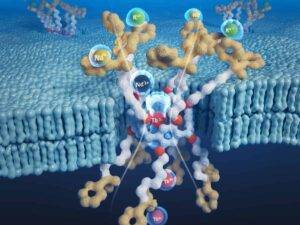
An illustration of the nano channels Texas Engineers developed for rare earth element extraction
A more efficient and environmentally friendly approach to extracting rare earth elements that power everything from electric vehicle batteries to smartphones could increase domestic supply and decrease reliance on costly imports.
This new method, developed by researchers at The University of Texas at Austin, allows for separating and extracting these in-demand elements where it’s not possible today, opening up new avenues for gathering rare earth elements amid global trade tensions.
“Rare earth elements are the backbone of advanced technologies, but their extraction and purification are energy intensive and extremely difficult to implement at the scales required,” said Manish Kumar, professor in the Cockrell School of Engineering’s Fariborz Maseeh Department of Civil, Architectural and Environmental Engineering and the McKetta Department of Chemical Engineering. “Our work aims to change that, inspired by the natural world.”
The research was recently published in ACS Nano. The researchers developed artificial membrane channels — tiny pores embedded in membranes — that mimic the selective transport mechanisms of transport proteins found in biological systems. These channels are the roadways used by different ions to travel between cells.
Each channel is different, letting only ions with certain characteristics through while keeping others out. That selectivity is critical to many biological processes, including how our brains think.
The researchers’ artificial channels use a modified version of a structure called pillararene to enhance their ability to bind and block specific common ions while transporting specific rare earth ions. The result is a system that can selectively transport middle rare earth elements, such as europium (Eu³⁺) and terbium (Tb³⁺), while excluding other ions like potassium, sodium, and calcium.
“Nature has perfected the art of selective transport through biological membranes,” said Venkat Ganesan, professor in the McKetta Department of Chemical Engineering and one of the research leaders. “These artificial channels are like tiny gatekeepers, allowing only the desired ions to pass through.”
Rare earth elements are split into several classes (light, middle and heavy), each with different properties that make them ideal for specific applications. Middle elements are used in lighting and displays, including TVs, and as magnets in green energy technologies, such as wind turbines and electric vehicle batteries.
The U.S. Department of Energy and the European Commission have identified several middle elements, including europium and terbium, as critical materials at risk of supply disruption. With demand for these elements expected to grow by over 2,600% by 2035, finding sustainable ways to extract and recycle them is more urgent than ever.
In experiments, the artificial channels showed a 40-fold preference for europium over lanthanum (a light rare earth element) and a 30-fold preference for europium over ytterbium (a heavy rare earth element). These selectivity levels are significantly higher than those achieved by traditional solvent-based methods that require dozens of stages to achieve similar results.
Using advanced computer simulations, they discovered that the channels’ selectivity is driven by unique water-mediated interactions between the rare earth ions and the channel. These interactions allow the channels to differentiate between ions based on their hydration dynamics — how water molecules surround and interact with ions.
Kumar and his team have been working on this research for more than five years. He is an expert in membrane-based separations, applying that knowledge to clean water generation as well.
The researchers envision their technology being integrated into scalable membrane systems for industrial use. The goal is to make it easier to conduct ion separations in the U.S., using clean energy.
They’re working on a platform for these channels that allows users to select a variety of ions to gather. This could include other critical minerals like lithium, cobalt, gallium, and nickel.
This is a first step towards translating nature’s sophisticated molecular recognition and transport strategies into robust industrial processes, thus bringing high selectivity to settings where current methods fall short,” said Harekrushna Behera, a research associate in Kumar’s lab who worked on the project.
The team includes researchers from the Fariborz Maseeh Department of Civil, Architectural and Environmental Engineering, McKetta Department of Chemical Engineering, and the College of Natural Sciences’ Department of Chemistry. They are: Tyler J. Duncan, Laxmicharan Samineni, Hyeonji Oh, Ankit Jogdand, Arnav Karnik, Raman Dhiman, Aida Fica, Tzu-Yun Hsieh.
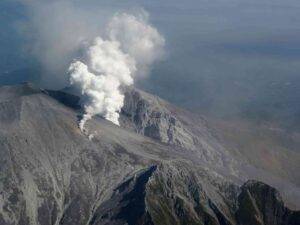
Aerial view of Ontake Volcano, Honshū Island, Japan. Image Credit: Dr. Koshun Yamaoka
A new study, led by Professor Mike Kendall from the Department of Earth Sciences, has investigated the use of a new monitoring technique for early warning of a volcanic eruption. The research team compared the earthquake signals during two eruptions of Ontake Volcano in Japan, one of which was a small eruption and the other of which was explosive. From this, they were able to identify that shear-wave splitting parameters showed differences depending on the size of the eruption.
Predicting Volcanic Eruptions
For communities living in the shadow of a volcano, early warning systems are a life line — but mistrust in these warnings can have deadly consequences. To avoid false alarms, it is vital that scientists seek more reliable ways to monitor volcanoes.
A new study by researchers from the University of Oxford has investigated a seismic signal known as shear-wave splitting for providing scientists and communities with an essential early warning of a dangerous eruption. Large movements of magma and rock inside a volcano causes seismic waves to be released, but these signals can be challenging to untangle. The goal of this research was to seek a useable parameter which could not only predict if an eruption was set to occur — but also if the eruption was going to be particularly damaging.
Shear-Wave Splitting
Shear-wave splitting is a phenomenon where seismic shear-waves waves travel at different speeds depending on their polarisation. Cracks and fractures inside the rock can slow down seismic waves, but have a larger delaying effect on seismic waves that travel across the cracks and fractures. If the cracks are aligned in one direction, then the amount of shear-wave splitting increases.
Magma and fluids moving beneath a volcano exert stresses on the surrounding rocks, causing cracks to open in certain orientations and close in others. Examining changes to shear-wave splitting through time can be really useful for scientists, as it tells them where these cracks are opening and closing. But the research team wanted to take this a step further — and test whether the larger stress changes during an explosive eruption also caused a more significant change to the amount of shear-wave splitting.
“Seismic anisotropy — or the effect of rock composition and internal fractures on the speed of shear-waves oscillating at right angles to each other — is a well-documented phenomenon,” said Professor Mike Kendall (Department of Earth Sciences, University of Oxford). “When we reflected on how anisotropy increases as the pressure inside a volcano builds, we were excited to explore if we could detect these changes, and if this could be a distinctive signal which could be applied to early warning systems.”
Observations at Ontake Volcano
The research team put this theory to the test by examining seismic signals during two eruptions of Ontake Volcano, on Honshū Island in Japan. The 2007 eruption was small and had much less of an impact on the surrounding community, whereas the 2014 eruption was larger, more explosive, and sadly more deadly.
They were excited to discover that during the smaller eruption, the amount of shear-wave splitting remained constant throughout, but during the larger eruption the amount of splitting doubled just before Ontake exploded. The team believe that the larger stress change during the 2014 eruption increased the observed shear-wave splitting, indicating a useful relationship between the amount of splitting and the size of the eruption.
Co-author Professor Toshiko Terakawa (Nagoya University) noted: “The focal mechanisms of volcano-tectonic earthquakes changed drastically before and after the 2014 eruption. Integrating data from shear-wave splitting and earthquake focal mechanisms could provide deeper insights into conditions required for an eruption to occur.”
Co-author Professor Martha Savage (Victoria University of Wellington) added: “The records around two eruptions on Ontake volcano in Japan have been able to show that the method can not only show changes before eruptions, but that they can potentially help to predict the size of an eruption. This work was an example of how cooperation among people from around the globe can address important societal problems.”
A Valuable Early Warning System
Because the change in shear-wave splitting occurred before the eruption of Ontake began, scientists monitoring the volcano will be able to use this parameter as both a vital early-warning system and an indicator of how damaging the eruption could be. This offers a new way to protect local communities from the devastating impacts of a volcanic eruption.
“We expect to see these effects at other volcanoes across the globe, not just at Ontake Volcano,” said co-author Dr Tom Kettlety (Department of Earth Sciences, University of Oxford). “As changes in volcanic stress occur prior to an eruption, we anticipate that we would see changes in shear-wave splitting. This could be a valuable tool for early warning of volcanic eruptions, especially for local communities.”
This work is part of a vibrant research programme in volcanology and geothermal energy at Oxford. Recently published work based on the ‘zombie’ volcano Uturuncu has shown unique insights into the architecture of volcanoes, which complement the type of hazard monitoring conducted at Ontake volcano.
Reference:
Michael Kendall, Toshiko Terakawa, Martha Savage, Tom Kettlety, Daniel Minifie, Haruhisa Nakamichi, Andreas Wuestefeld. Changes in seismic anisotropy at Ontake volcano: a tale of two eruptions. Seismica, 2025; 4 (1) DOI: 10.26443/seismica.v4i1.1101
About 240 miles long, Utah’s Wasatch Fault stretches along the western edge of the Wasatch Mountains from southern Idaho to central Utah, running through Salt Lake City and the state’s other population centers. It’s a seismically active normal fault, which means it is a fracture in the Earth’s crust that has moved many times in the past.
“Normal faults are observed along different tectonic systems, where the tectonic plates are moving apart,” says Utah State University geophysicist Srisharan Shreedharan. “The Wasatch Fault forms the eastern edge of the Basin and Range geologic province, which has stretched and broken over millions of years.”
Shreedharan, assistant professor in USU’s Department of Geosciences, says normal faults generally look like two slabs of rock, where one slab, the “hanging wall,” moves downward relative to the other slab, the “footwall.”
“The dip angle of the sliding surface tends to be steep, often between 45-90 degrees,” he says. “The Wasatch Fault plunges, toward the west, at a steep angle at the surface in the Salt Lake City area.”
A steep angle could mean seismic activity may be dampened during an earthquake and spare inhabitants and buildings from much injury and damage on the surface.
“But the 2020 earthquake Magna earthquake, which occurred at about 9 kilometers depth west of Salt Lake City, caused injuries and resulted in nearly $50 million in property damages,” Shreedharan says. “It was a wake-up call. We want to understand how and why it happened at such a shallow depth, if the Wasatch Fault dips so steeply at the surface.”
With USU Geosciences Associate Professor Alexis Ault and doctoral student Jordan Jensen, Shreedharan has published new findings about why earthquakes occur along the Wasatch Fault and why communities along the fault are more vulnerable to earthquake damage than previously thought. Their paper appeared in the April 25 online edition of Geology, a peer-reviewed journal of the Geological Society of America. The research is supported by the U.S. Geological Survey’s Earthquake Hazards Program.
Using rock samples collected from the fault, Shreedharan combined experiments and analysis in his Rock Deformation and Earthquake Mechanics lab with Ault’s investigative expertise in earthquake geology and fault rock textures at USU’s Microscopy Core Facility. Their research revealed significant clues about the Wasatch Fault’s earthquake risk.
“Although the Wasatch Fault dips sharply at Salt Lake City, it curves more gently at depth as it moves west and is probably oriented at a much shallower angle at earthquake depth than expected,” Shreedharan says. “This means that an earthquake rupture could lead to stronger, more intense shaking at the surface — meaning a greater chance of injury and destruction.”
Further, the scientists discovered earthquake slip is possible along the shallowly dipping portion of the Wasatch Fault because the fault rocks themselves are much weaker — worn down and slicker — than the surrounding, undamaged rock.
“It turns out this weak frictional behavior, which we characterized with deformation experiments and microscopy, is a product of deformation that happened more than 1.7 billion years ago when what is now the Wasatch Fault was at even greater depths within the Earth,” Ault says. “Repeated past earthquakes since then have further modified the fault properties through time, priming the fault rocks to fail again in a future event.”
Understanding how one rock is frictionally weaker than another, Shreedharan says, is like comparing ice to sand.
“You can envision how slick rock can slide more easily and at lower angles than a rock with a rough surface,” he says. “This process is happening continuously, though at a very slow pace, under our feet.”
Ault says USU, with its interdisciplinary team of earthquake scientists and engineers, is uniquely positioned to study Utah’s earthquake history, future risks and help build resilience.
Reference:
Srisharan Shreedharan, Alexis K. Ault, Jordan Jensen. Frictional and microstructural evidence for a weak Wasatch fault zone. Geology, 2025; DOI: 10.1130/G52606.1
Note: The above post is reprinted from materials provided by Utah State University. Original written by Mary-Ann Muffoletto.
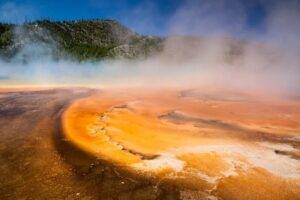
The Grand Prismatic Spring in Yellowstone National Park (Stock photo).
Beneath the steaming geysers and bubbling mud pots of Yellowstone National Park lies one of the world’s most closely watched volcanic systems. Now a team of geoscientists has uncovered new evidence that sheds light on how this mighty system may behave in the future — and what might keep it from erupting. The findings were recently published in Nature.
A team of researchers from Rice University, University of New Mexico, University of Utah and the University of Texas at Dallas have discovered a sharp, volatile-rich cap just 3.8 kilometers beneath Yellowstone’s surface. This cap, made of magma, acts like a lid, helping to trap pressure and heat below it. Using innovative controlled-source seismic imaging and advanced computer models, their findings suggest that the Yellowstone magma reservoir is actively releasing gas while remaining in a stable state.
The research, led by Rice’s Chenglong Duan and Brandon Schmandt along with collaborators, provides new insight into how magma, volatiles and fluids move within Earth’s crust. The project was supported by the National Science Foundation.
“For decades, we’ve known there’s magma beneath Yellowstone, but the exact depth and structure of its upper boundary has been a big question,” said Schmandt, professor of Earth, environmental and planetary sciences. “What we’ve found is that this reservoir hasn’t shut down — it’s been sitting there for a couple million years, but it’s still dynamic.”
Previous studies suggested the top of Yellowstone’s magma system could lie anywhere from 3 to 8 kilometers deep — an uncertainty that left geologists debating how the magma system today compares with conditions before prior eruptions.
That changed after Schmandt conducted a high-resolution seismic survey in the northeastern part of the caldera. A 53,000-pound vibroseis truck — typically used for oil and gas exploration — essentially generated tiny earthquakes to send seismic waves into the ground. These waves reflected off subsurface layers and were recorded at the surface, revealing a sharp boundary at about 3.8 km depth.
“The motivation behind my research is to advance structural seismic imaging beyond the limits of conventional travel-time methods,” said Duan, a postdoctoral research associate. “Using a wave-equation imaging technique I developed during my Ph.D. for irregular seismic data, we made one of the first super clear images of the top of the magma reservoir beneath Yellowstone caldera.”
“Seeing such a strong reflector at that depth was a surprise,” Schmandt said. “It tells us that something physically distinct is happening there — likely a buildup of partially molten rock interspersed with gas bubbles.”
To better understand what causes this signal, Duan and Schmandt modeled various rock, melt and volatile combinations. The best match they determined is a mixture of silicate melt and supercritical water bubbles within a porous rock matrix resulting in a volatile-rich cap with about 14% porosity, half of which is occupied by fluid bubbles.
As magma rises and decompresses in volcanic systems, gases like water and carbon dioxide exsolve from the melt, forming bubbles. In some cases, these bubbles can accumulate, increasing buoyancy and potentially driving explosive eruptions.
But present conditions at Yellowstone appear to tell a different story.
“Although we detected a volatile-rich layer, its bubble and melt contents are below the levels typically associated with imminent eruption,” Schmandt said. “Instead, it looks like the system is efficiently venting gas through cracks and channels between mineral crystals, which makes sense to me given Yellowstone’s abundant hydrothermal features emitting magmatic gases.”
Schmandt likened the system to “steady breathing” with bubbles rising and releasing through the porous rock — a natural pressure-release valve that lowers eruption risk.
Getting these results was anything but easy. The research team not only completed the field survey in the midst of the COVID-19 pandemic, but they also had to coordinate the project within a busy and carefully protected national park. This meant they could only operate the heavy vibroseis truck at night and only from designated roadside turnouts. More than 600 seismometers were temporarily deployed to record the vibroseis truck signals, then recovered a few weeks later. Collaboration with University of Utah professor Jamie Farrell, a Yellowstone geophysics expert and seismic network operator, was essential to making this unusual survey possible, Schmandt said.
Processing the data proved just as difficult. Yellowstone’s complex geology — known for scattering seismic waves — produced noisy data that were initially hard to interpret. But with persistence and many discussions with Schmandt, Duan said he kept going, refining his approach again and again until the numbers finally told a clear story.
“The challenge was that the raw data made it almost impossible to visualize any reflection signals,” Duan said. “We used the STA/LTA function to enhance coherent seismic reflections, and this was the first time we had innovatively applied STA/LTA data within the wave-equation imaging algorithm.”
Duan said that just like traversing the rocky landscape of Yellowstone, tenacity is key for navigating its mysteries underground.
“When you see noisy, challenging data, don’t give up,” Duan said. “After we realized the standard processing was not going to work, that’s when we got creative and adapted our approach.”
By identifying this sharp, volatile-rich cap beneath Yellowstone, Schmandt’s team has established a new benchmark for monitoring the volcano’s activity. Future research could attempt to detect any shifts in melt content or gas accumulation that may serve as early warning signs of unrest.
Beyond Yellowstone, the study offers broader insights into onshore subsurface imaging with potential applications not only for volcano monitoring but also for carbon storage, energy exploration and hazard assessment.
“Being able to image what’s happening underground is important for everything from geothermal energy to storing carbon dioxide,” Schmandt said. “This work shows that with creativity and perseverance, we can see through complicated data and reveal what’s happening beneath our feet.”
Reference:
Chenglong Duan, Wenkai Song, Brandon Schmandt, Jamie Farrell, David Lumley, Tobias Fischer, Lindsay Lowe Worthington, Fan-Chi Lin. A sharp volatile-rich cap to the Yellowstone magmatic system. Nature, 2025; DOI: 10.1038/s41586-025-08775-9
Note: The above post is reprinted from materials provided by Rice University. Original written by Alexandra Becker.
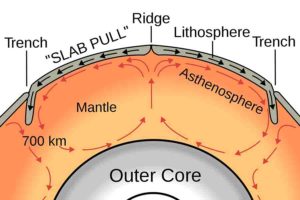
A graphic showing the convective heat cycle (red arrows) that drives plate tectonic motion (black arrows) on Earth. Heat flows toward subduction zones through the uppermost mantle layer, the asthenosphere. A computer model from Rice University finds that the asthenosphere can locally drag plates along with it rather than acting exclusively as a brake on plate movements as had been widely believed. (Image courtesy of Surachit/Wikimedia Commons)
Being a geophysicist can sometimes feel like being a detective — uncovering clues, and then building a case based on the evidence.
In a new article published in Science Advances, a collaborative team led by the Woods Hole Oceanographic Institution (WHOI), presents a never-before-seen image of an oceanic transform fault from electromagnetic (EM) data collected at the Gofar fault in the eastern Pacific Ocean. The National Science Foundation funded work reveals unexpected brine deposits beneath the seafloor near the fault, which could change the way we conceptualize oceanic transform faults.
The Gofar fault operates much like the San Andreas, in that two tectonic plates slide sideways past each other. Unlike the San Andreas, large earthquakes on this fault have been strangely predictable, with large ruptures occurring every five to six years. That predictability has made Gofar an ideal place to study earthquake mechanisms, with a variety of data collected at the fault, including a number of small earthquakes measured on ocean bottom seismographs.
In contrast to seismic data, EM measurements tell researchers how well a material can conduct electricity. This is useful because one of the models for why Gofar behaves as it does is related to differences in the amounts of seawater present in the seafloor: fluids influence how faults stick, slide, and slip, causing earthquakes of various magnitudes. The salt in seawater makes it conduct electricity well, far better than the surrounding rocks, and so EM data provide clues as to where seawater or other fluids are hiding beneath the seafloor.
Using state of the art instruments, the study’s authors were able to create a snapshot of the electrical properties beneath the Gofar fault. They expected that one portion of the fault would be slightly more conductive than its surroundings based on prior models of such faults. Instead, the team was surprised to find that extremely conductive blobs reside beneath the seafloor on one side of the fault but not the other. To make matters more perplexing, other geophysical data from the area did not reveal similar anomalies.
“It was shocking to see such a stark contrast across the fault,” said Christine Chesley, a WHOI postdoc in Geology & Geophysics, and lead author of the study. “The conductivity structure defied all of our expectations based on what we thought we knew about oceanic transform faults.”
Oceanic transform faults have historically been thought of as simple, predictable features. They represent the least well-studied of the three major plate boundaries, which include divergent boundaries, like East Africa, where plates move apart forming new crust; and convergent boundaries, like the Himalayas, where two plates collide and recycle crust. However, recent findings like this necessitate a new framework for understanding oceanic transform faults.
“Whenever we go out and make these kinds of EM measurements, we see the seafloor through a different lens, and it almost always changes our views on the processes that shape the earth,” explained Rob Evans, Senior Scientist at WHOI in Geology & Geophysics and co-author of the study.
Determining why the conductive blobs appeared in the EM data, but did not present as other kinds of geophysical anomalies, required some deductive reasoning.
“We needed a self-consistent mechanism that could help explain why these conductive masses are existing under only one side of the fault and where seismic velocities seem unaffected,” Chesley explained. “Something with conductivities this high isn’t normally seen beneath the seafloor, except where magma is involved.”
Working with these puzzle pieces, the authors realized that the conductive blobs required salt — a lot of salt — to account for their high conductivity values. This suggested the anomalies represented brine accumulations.
“And in order to create brines, you need a source of heat,” added Chesley. “We think this heat source is magma near the transform fault.”
The authors hypothesized that some magma is present on the side of the fault where the conductive blobs of brine are found. This would be a remarkable shift in our understanding of transform faults, which have generally not been considered to host magmatic or hydrothermal activity.
“We have this amazing image of this particular section of the Gofar fault, but we haven’t yet been able to see how it connects to the adjacent mid-ocean ridge. We are hopeful that additional project funding will support additional research,” said Evans.
The National Science Foundation’s Division of Ocean Sciences supported this project.
The following institutions contributed to this research: University of Delaware; Boise State University; Scripps Institution of Oceanography, University of California San Diego; Western Washington University; University of Texas Austin; MIT-WHOI Joint Program in Oceanography/Applied Ocean Science and Engineering; University of Southern Maine; Columbia University; University of New Hampshire.
Reference:
Christine Chesley, Rob Evans, Jessica M. Warren, Andrew C. Gase, Jacob Perez, Christopher Armerding, Hannah Brewer, Paige Koenig, Eric Attias, Bailey L. Fluegel, Jae-Deok Kim, Natalie Hummel, Katherine Enright, Emilia Topp-Johnson, Margaret S. Boettcher. Evidence for crustal brines and deep fluid infiltration in an oceanic transform fault. Science Advances, 2025; 11 (15) DOI: 10.1126/sciadv.adu3661
Creative destruction: a thinner ocean plate sides under a continental plate, melting and recycling the ocean crust into the Earth’s interior and birthing volcanoes in this illustration of subduction, a consequence of modern plate tectonics. A new study reports evidence of a transition in multiple locations around the world, 3.8-3.6 billion years ago, from stable “protocrust” to pressures and processes that look a lot like modern subduction, suggesting a time when plates first got moving. Credit: Nikolas Midttun, CC-BY
Newly published research has revealed that compositional rock anomalies within oceanic plates caused by ancient tectonics influence the trajectory and speed of the plates as they plunge deep into Earth’s mantle.
Between depths of 410 and 660 kilometers lies the mantle transition zone (MTZ), a critical region acting as a gateway for materials entering Earth’s deeper mantle. Large distributions of basalt rock compositions within the MTZ can cause subducting plates — ones that slide beneath other — to slow and/or stagnate within this zone, instead of descending directly into the lower mantle. Although basalt reservoirs have previously been discovered in the MTZ, their origins have remained unclear.
An international team of seismologists led by the University of Southampton (and now at the Woods Hole Oceanographic Institution) has provided evidence of an extremely thick MTZ, which can only be explained by a large basaltic rock composition, suggesting that, in certain regions, entire oceanic slabs — approximately 100 kilometers thick — can possess significant basaltic material.
The findings, published in the journal Nature, provide a greater understanding of plate subduction, which recycles surface materials and volatile elements deep into the Earth’s interior, sustaining long-term climate stability, atmospheric balance, and the habitability of our planet over billions of years.
This groundbreaking research is part of the VoiLA (Volatiles in the Lesser Antilles) project, in which the team deployed 34 seismometers on the ocean floor beneath the Lesser Antilles.
“This is the first large scale ocean bottom seismic experiment conducted at an Atlantic subduction zone,” said Dr. Catherine Rychert, formerly an Associate Professor at the University of Southampton and currently at the Woods Hole Oceanographic Institution. “We were very surprised to find an unexpected and exceptionally thick — approximately 330 kilometers — mantle transition zone beneath the Antilles, which makes it one of the thickest transition zones observed worldwide. Although the Caribbean is well-known for its sunshine and beaches, it now has a new claim to fame in the world of plate tectonics.”
“It’s wild to think that in some ways tectonic plates have a ‘memory’ and that affects the way the plates drive mantle convection and mix material back into the Earth,” said Dr. Nick Harmon, formerly an Associate Professor at the University of Southampton and currently at the Woods Hole Oceanographic Institution.
“It’s wild to think that in some ways tectonic plates have a ‘memory’ and that affects the way the plates drive mantle convection and mix material back into the Earth,” said Dr. Nick Harmon, formerly an Associate Professor at the University of Southampton and currently at the Woods Hole Oceanographic Institution.
Lead author, Dr. Xusong Yang, a former visiting scholar at the University of Southampton and currently at University of Miami, emphasized, “We cannot overlook the inherited compositional heterogeneity of subducting oceanic slabs. It may greatly influence their ultimate fate in Earth’s deep interior.”
Dr. Kate Rychert and Dr. Nick Harmon, formerly of the University of Southampton, Professor Saskia Goes from Imperial College London, and Professor Andreas Reitbrock from Karlsruhe Institute of Technology, led the experiment. The experiment was funded by NERC (Natural Environment Research Council, UK) and the ERC (European Research Council).
Reference:
Xusong Yang, Yujiang Xie, Catherine A. Rychert, Nicholas Harmon, Saskia Goes, Andreas Rietbrock, Lloyd Lynch, Colin G. Macpherson, Jeroen Van Hunen, Jon Davidson, Marjorie Wilson, Robert Allen, Jenny Collier, Jamie J. Wilkinson, Timothy J. Henstock, John-Michael Kendall, Jonathan D. Blundy, Joan Latchman, Richard Robertson. Seismic imaging of a basaltic Lesser Antilles slab from ancient tectonics. Nature, 2025; DOI: 10.1038/s41586-025-08754-0
Early Earth was bombarded by meteors which played a crucial role in disrupting and recycling Earth’s first crust.
Researchers have made a new discovery that changes our understanding of Earth’s early geological history, challenging beliefs about how our continents formed and when plate tectonics began.
A study published in Nature on 2 April reveals that Earth’s first crust, formed about 4.5 billion years ago, probably had chemical features remarkably like today’s continental crust.
This suggests the distinctive chemical signature of our continents was established at the very beginning of Earth’s history.
Professor Emeritus Simon Turner from the Faculty of Science and Engineering at Macquarie University led the study, which included researchers from elsewhere in Australia, the UK and France.
“This discovery has major implications for how we think about Earth’s earliest history,” says Professor Turner.
“Scientists have long thought that tectonic plates needed to dive beneath each other to create the chemical fingerprint we see in continents.
“Our research shows this fingerprint existed in Earth’s very first crust, the protocrust — meaning those theories need to be reconsidered,” says Professor Turner.
Rethinking early Earth formation
For decades, scientists have tried to identify when plate tectonics first began, marking the earliest evolution of life. The chemical signature of rocks formed in subduction zones (where one plate has slipped beneath another) is distinctive in its low quantity of the element Niobium.
Scientists thought finding the age of the earliest low-Niobium rocks was the key to identifying when plate tectonics first began; but while a series of research teams tried to track this down, the results from each study were remarkably inconsistent.
“I began to wonder if we were asking the right question,” says Professor Turner.
Together with collaborators across six universities, he created mathematical models simulating early Earth conditions when our planet’s core was forming and an ocean of molten rock covered the planet’s surface.
The team’s calculations showed the protocrust — Earth’s earliest crust formed during the Hadean eon (4.5-4.0 billion years ago) — would naturally develop the same chemical signatures found in today’s continents, without needing plate tectonics to create them.
Chemical clues to formation
The initial results from the model showed that under the reducing conditions of early Earth, the element niobium would become siderophilic, or attracted to metal, sinking through the global magma ocean into the Earth’s core.
“I realised there might be a connection between early core formation, high siderophile element patterns, and the infamous negative niobium anomaly observed in continental crust,” says Professor Turner.
The distinctive signature of the continental crust matched the probable signature of material extracted from the mantle after core formation but before meteorites bombarded early Earth — solving the mystery of why the chemical signature appears in nearly all continental rocks regardless of age.
Early Earth’s evolution
“Our research shows that the chemical signatures we see in continental crust were created in Earth’s earliest period — regardless of how the planet’s surface was behaving,” says Professor Turner.
“This early crust was reshaped and made richer in silica thanks to a combination of meteor impacts, chunks of crust peeling off, and the beginning of plate movements.”
The first crust likely broke into pieces that became thicker in some areas, forming the beginnings of continents.
As these pieces moved sideways, the molten magma between them created crust similar to what we find in ocean floors today.
Meteor impacts and plate tectonics
The heavy meteor bombardment during this early period caused extensive disruption and recycling of the crust.
Plate tectonics may have worked in fits and starts, triggered by meteor impacts until about 3.8 billion years ago, when meteor bombardment decreased dramatically as the early Solar System’s chaos gave way to more orderly orbits.
Plate tectonics then fell into a continuous, self-sustaining pattern.
“This discovery completely changes our understanding of Earth’s earliest geological processes,” says Professor Turner.
Reference:
Turner, S., Wood, B., Johnson, T. et al. Formation and composition of Earth’s Hadean protocrust. Nature, 2025 DOI: 10.1038/s41586-025-08719-3
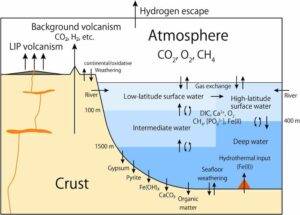
It is widely believed that Earth’s atmosphere has been rich in oxygen for about 2.5 billion years due to a relatively rapid increase in microorganisms capable of performing photosynthesis. Researchers, including those from the University of Tokyo, provide a mechanism to explain precursor oxygenation events, or “whiffs,” which may have opened the door for this to occur. Their findings suggest volcanic activity altered conditions enough to accelerate oxygenation, and the whiffs are an indication of this taking place.
Take a deep breath. Do you ever think about the air entering your lungs? It’s mostly inert nitrogen, and the valuable oxygen our lives depend on only accounts for 21%. But this hasn’t always been the case; in fact, several mass extinction events correspond to times when this figure changed dramatically. And if you go back far enough, you’ll find that before about 3 billion years ago, there was hardly any oxygen at all. So what changed, and how did it happen?
The scientific consensus is that about 2.5 billion years ago, the Great Oxygenation Event (GOE) took place, most likely due to a proliferation of microorganisms exploiting favorable conditions and facing little competition. They would have essentially converted the carbon dioxide-rich atmosphere into an oxygen-rich one, and following that came complex life, which favored this new abundance of oxygen. But it seems there were some precursor oxygenation events prior to the GOE that may indicate the exact nature and timing of changes in the conditions necessary for the GOE to begin.
“Activity of microorganisms in the ocean played a central role in the evolution of atmospheric oxygen. However, we think this would not have immediately led to atmospheric oxygenation because the amount of nutrients such as phosphate in the ocean at that time was limited, restricting activity of cyanobacteria, a group of bacteria capable of photosynthesis,” said Professor Eiichi Tajika from the Department of Earth and Planetary Science at the University of Tokyo. “It likely took some massive geological events to seed the oceans with nutrients, including the growth of the continents and, as we suggest in our paper, intense volcanic activity, which we know to have occurred.”
Tajika and his team used a numerical model to simulate key aspects of biological, geological and chemical changes during the late Archean eon (3.0-2.5 billion years ago) of Earth’s geologic history. They found that large-scale volcanic activity increased atmospheric carbon dioxide, thereby warming the climate, and increased nutrient supply to the ocean, thus feeding marine life, which in turn temporarily increased atmospheric oxygen. The increase in oxygen was not very steady, though, and came and went in bursts now known as whiffs.
“Understanding the whiffs is critical for constraining the timing of the emergence of photosynthetic microorganisms. The occurrences are inferred from concentrations of elements sensitive to atmospheric oxygen levels in the geologic record,” said visiting research associate Yasuto Watanabe. “The biggest challenge was to develop a numerical model that could simulate the complex, dynamic behavior of biogeochemical cycles under late Archean conditions. We built upon our shared experience with using similar models for other times and purposes, refining and coupling different components together to simulate the dynamic behavior of the late-Archean Earth system in the aftermath of the volatile volcanic events.”
Reference:
Yasuto Watanabe, Kazumi Ozaki, Mariko Harada, Hironao Matsumoto, Eiichi Tajika. Mechanistic links between intense volcanism and the transient oxygenation of the Archean atmosphere. Communications Earth & Environment, 2025; 6 (1) DOI: 10.1038/s43247-025-02090-x
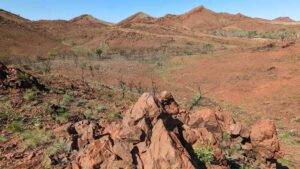
Large conical shatter cones within the Pilbara Craton, Western Australia, provide visible proof of a meteorite impact 3.5 billion years ago. Credit: Chris Kirkland, Curtin University
Curtin University researchers have discovered the world’s oldest known meteorite impact crater, which could significantly redefine our understanding of the origins of life and how our planet was shaped.
The team from Curtin’s School of Earth and Planetary Sciences and the Geological Survey of Western Australia (GSWA) investigated rock layers in the North Pole Dome — an area of the Pilbara region of Western Australia — and found evidence of a major meteorite impact 3.5 billion years ago.
Study co-lead Professor Tim Johnson, from Curtin University, said the discovery significantly challenged previous assumptions about our planet’s ancient history.
“Before our discovery, the oldest impact crater was 2.2 billion years old, so this is by far the oldest known crater ever found on Earth,” Professor Johnson said.
Researchers discovered the crater thanks to ‘shatter cones’, distinctive rock formations only formed under the intense pressure of a meteorite strike.
The shatter cones at the site, about 40 kilometres west of Marble Bar in WA’s Pilbara region, were formed when a meteorite slammed into the area at more than 36,000km/h.
This would have been a major planetary event, resulting in a crater more than 100km wide that would have sent debris flying across the globe.
“We know large impacts were common in the early solar system from looking at the Moon,” Professor Johnson said.
“Until now, the absence of any truly ancient craters means they are largely ignored by geologists.
“This study provides a crucial piece of the puzzle of Earth’s impact history and suggests there may be many other ancient craters that could be discovered over time.”
Co-lead author Professor Chris Kirkland, also from Curtin’s School of Earth and Planetary Sciences, said the discovery shed new light on how meteorites shaped Earth’s early environment.
“Uncovering this impact and finding more from the same time period could explain a lot about how life may have got started, as impact craters created environments friendly to microbial life such as hot water pools,” Professor Kirkland said.
“It also radically refines our understanding of crust formation: the tremendous amount of energy from this impact could have played a role in shaping early Earth’s crust by pushing one part of the Earth’s crust under another, or by forcing magma to rise from deep within the Earth’s mantle toward the surface.
“It may have even contributed to the formation of cratons, which are large, stable landmasses that became the foundation of continents.”
Reference:
Christopher L. Kirkland, Tim E. Johnson, Jonas Kaempf, Bruno V. Ribeiro, Andreas Zametzer, R. Hugh Smithies, Brad McDonald. A Paleoarchaean impact crater in the Pilbara Craton, Western Australia. Nature Communications, 2025; 16 (1) DOI: 10.1038/s41467-025-57558-3
Note: The above post is reprinted from materials provided by Curtin University. Original written by Samuel Jeremic.
Artistic view of Earth’s interior during mantle solidification in the first hundreds of millions of years of Earth’s history. Gravitational segregation of dense, iron-rich magma (in orange) likely formed a basal magma ocean atop the core, that can explain the present-day structure of the lower mantle.
New research led by a York University professor sheds light on the earliest days of the earth’s formation and potentially calls into question some earlier assumptions in planetary science about the early years of rocky planets. Establishing a direct link between the Earth’s interior dynamics occurring within the first 100 million years of its history and its present-day structure, the work is one of the first in the field to combine fluid mechanics with chemistry to better understand the Earth’s early evolution.
“This study is the first to demonstrate, using a physical model, that the first-order features of Earth’s lower mantle structure were established four billion years ago, very soon after the planet came into existence,” says lead author Faculty of Science Assistant Professor Charles-Édouard Boukaré in the Department of Physics and Astronomy at York.
The mantle is the rocky envelopment that surrounds the iron core of rocky planets. The structure and dynamics of the Earth’s lower mantle play a major role throughout Earth’s history as it dictates, among others, the cooling of the Earth’s core where the Earth’s magnetic field is generated.
Boukaré originally from France, worked with research colleagues from Paris on the paper, Solidification of Earth’s mantle led inevitably to a basal magma ocean, published today in Nature.
Boukaré says that while seismology, geodynamics, and petrology have helped answer many questions about the present-day thermochemical structure of Earth’s interior, a key question remained: how old are these structures, and how did they form? Trying to answer this, he says, is much like looking at a person in the form of an adult versus a child and understanding how the energetic conditions will not be the same.
“If you take kids, sometimes they do crazy things because they have a lot of energy, like planets when they are young. When we get older, we don’t do as many crazy things, because our activity or level of energy decreases. So, the dynamic is really different, but there are some things that we do when we are really young that might affect our entire life,” he says “It’s the same thing for planets. There are some aspects of the very early evolution of planets that we can actually see in their structure today.”
To better understand old planets, we must first learn how young planets behave.
Since simulations of the Earth’s mantle focus mostly on present-day solid-state conditions, Boukaré had to develop a novel model to explore the early days of Earth when the mantle was much hotter and substantially molten, work that he has been doing since his PhD.
Boukaré’s model is based on a multiphase flow approach that allows for capturing the dynamics of magma solidification at a planetary scale. Using his model, he studied how the early mantle transitioned from a molten to a solid state. Boukaré and his team were surprised to discover that most of the crystals formed at low pressure, which he says creates a very different chemical signature than what would be produced at depth in a high-pressure environment. This challenges the prevailing assumptions in planetary sciences in how rocky planets solidify.
“Until now, we assumed the geochemistry of the lower mantle was probably governed by high-pressure chemical reactions, and now it seems that we need to account also for their low-pressure counterparts.”
Boukare says this work could also help predict the behaviour of other planets down the line.
“If we know some kind of starting conditions, and we know the main processes of planetary evolution, we can predict how planets will evolve.”
Reference:
Charles-Édouard Boukaré, James Badro, Henri Samuel. Solidification of Earth’s mantle led inevitably to a basal magma ocean. Nature, 2025; DOI: 10.1038/s41586-025-08701-z
Note: The above post is reprinted from materials provided by York University. Original written by Emina Gamulin.
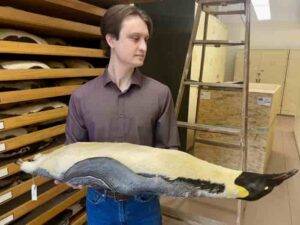
Evan Saitta, the paper’s lead author, with an emperor penguin in the Field Museum’s bird collections. Photographer(s): Kate Golembiewski (c) Field Museum
More than 99% of birds can fly. But that still leaves many species that evolved to be flightless, including penguins, ostriches, and kiwi birds. In a new study in the journal Evolution, researchers compared the feathers and bodies of different species of flightless birds and their closest relatives who can still fly. They were able to determine which features change first when birds evolve to be flightless, versus which traits take more time for evolution to alter. These findings help shed light on the evolution of complex traits that lose their original function, and could even help reveal which fossil birds were flightless.
All of the flightless birds alive today evolved from ancestors who could fly and later lost that ability. “Going from something that can’t fly to flying is quite the engineering challenge, but going from something that can fly to not flying is rather easy,” says Evan Saitta, a research associate at the Field Museum in Chicago and lead author of the paper.
In general, there are two common reasons why birds evolve flightlessness. When birds land on an island where there aren’t predators (including mammals) that would hunt them or steal their eggs, they sometimes settle there and gradually adapt to living on the ground. Since they don’t experience evolutionary pressure to stay in flying form, they gradually lose some of the features of their skeletons and feathers that help them fly. Meanwhile, some birds’ bodies change when they evolve semi-aquatic lifestyles. Penguins, for instance, can’t fly, but they swim in a way that’s akin to “flying underwater.” Their feathers and skeletons have changed accordingly.
Saitta is a paleontologist who often studies non-avian dinosaurs (the branches of the dinosaur family tree that do not include modern birds). However, when he arrived at the Field Museum for a postdoctoral fellowship, he was struck by the Field’s collections of over half a million birds.
“I suddenly had access to all these modern birds, and it made me wonder, ‘What happens when a bird loses the ability to fly?'” says Saitta. “And because I’m not an ornithologist, I went in and measured as many features of as many different feathers as I could. So it was a highly exploratory study in that sense.”
Saitta examined the preserved skins of thirty species of flightless birds and their closest flighted relatives and measured a variety of the birds’ feathers, including the microscopic branching structures that make up feather plumage. He also examined specimens of other, more distantly related species to represent more of the bird family tree.
Previous research has revealed how long ago different species of flightless birds branched off from their flying relatives. The ancestors of ostriches, for example, lost the ability to fly much longer ago than the ancestors of a flightless South American duck called the Fuegian steamer. Saitta found that these species’ feathers are very different. “Ostriches have been flightless for so long that their feathers are no longer optimized for being aerodynamic,” says Saitta. As a result, their feathers have become so long and shaggy that they’re sometimes used in feather dusters and boas. But even though Fuegian streamers can no longer fly, they lost this ability relatively recently, and their feathers remain similar to those of their flying cousins.
Saitta says he was surprised by how long it seemed to take flightless birds to lose the feather features that would have helped them fly. It didn’t seem to make sense why a flightless species would “waste” energy growing a bunch of feathers optimized for an activity that it no longer did, or why feathers no longer required for flight wouldn’t be freed up to evolve into a wide variety of forms. However, Saitta says, his postdoctoral advisor, Field Museum research associate and former Field curator Peter Makovicky (now at the University of Minnesota’s Bell Museum), had another perspective.
“Pete pointed out that when trying to understand why a modern bird looks the way it does, you can’t just think about natural selection or relaxation thereof. You have to also consider developmental constraints,” says Saitta. “Feathers are complex structures that have a really well-defined developmental sequence that’s hard to change. And when birds lose flight, those feather features disappear in the opposite order that they first evolved.”
When bird embryos develop feathers, those feathers increase in complexity in the same general order that those feather features first evolved in dinosaurs. After losing the ability to fly, birds lose those feather features in the opposite order that they first evolved. It’s like remodeling a house — it’s faster and easier to change elements that went in last, like the wallpaper, than it is to tear down a load-bearing wall and rebuild it into something new.
Some more recently-evolved feather adaptations, like the asymmetry in the flight feathers that allows birds to fly, are easier to change, and thus disappear relatively quickly once birds no longer need to fly. But overall, the basic feather structure is like those load-bearing walls. It takes a lot of evolutionary time for the underlying development of a standard feather to be transformed into producing something like a plume-y ostrich feather.
Saitta and his colleagues also found that certain larger features changed relatively quickly once a lineage lost the ability to fly. “The first things to change when birds lose flight, possibly even before the flight feathers become symmetrical, is the proportion of their wings and their tails. We therefore see skeletal changes and also a change in overall body mass,” he says.
The reason behind this, says Saitta, may be the comparative “costs” to grow these features. When animals develop, it takes a lot more energy to grow bones than it does to grow feathers — so evolution “prioritizes” changing the skeleton before the majority of the feathers.
“Let’s say a bird species lands on an island where they are able to safely live on the ground and don’t need to fly anymore. The first things to go are going to be these big, expensive bones and muscles, but feathers are cheap, so there’s less active selection to change them,” says Saitta. It’s like how if you auto-paid your $1,500 monthly rent on an old apartment that you no longer live in, that would have a bigger effect on your bank account than forgetting to cancel a $5-a-month subscription. For newly flightless birds, maintaining a flight-friendly skeleton is a bigger unnecessary cost than keeping some of their old feathers around unaltered.
Insights from this research could help scientists trying to determine whether a fossil bird, or a feathered dinosaur that isn’t part of the bird family, was able to fly. “Flight didn’t evolve overnight, and flight, or at least gliding, was possibly lost many times in extinct species, just as in surviving bird lineages. Our paper helps show the order in which birds’ bodies reflect those changes,” says Saitta. “Unless you have a fossil whose ancestors, even older fossils, have been flightless for a very long time, you might not see too many changes in their feathers. You might first want to look for changes in body mass, the relative length of the wings. Those change first, and then you can perhaps see changes in the symmetry of the feathers.”
Saitta’s research corroborates previous studies that have shown that a bird’s flight feathers become more symmetric after flight loss. “The good news is that because I came at this question from a different angle, we got results that are very consistent with a lot of the previous research, but I think maybe a little bit broader than if I had approached the question with a more specific focus,” says Saitta.
Reference:
Evan T Saitta, Lilja Carden, Jonathan S Mitchell, Peter J Makovicky. Feather Evolution Following Flight Loss In Crown Group Birds: Relaxed Selection And Developmental Constraints. Evolution, 2025; DOI: 10.1093/evolut/qpaf020
Detailed highlights of the rock sample at Biloela in Queensland.
A University of Queensland researcher has confirmed a boulder at a regional school contains one of the highest concentrations of dinosaur footprints per square metre ever documented in Australia.
Dr Anthony Romilio from UQ’s Dinosaur Lab has identified 66 fossilised footprints left in the Callide Basin in Central Queensland during the Early Jurassic period, around 200 million years ago.
“The footprints are from 47 individual dinosaurs which passed across a patch of wet, white clay, possibly walking along or crossing a waterway,” Dr Romilio said.
“It’s an unprecedented snapshot of dinosaur abundance, movement and behaviour from a time when no fossilised dinosaur bones have been found in Australia.
“Each footprint has 3 toes, indicating they belong to the ichnospecies Anomoepus scambus.
“These dinosaurs were small, with legs ranging from 15 — 50 cm in length and when they left these marks, they were travelling less than 6 km/hr.
“Evidence from skeletal fossils overseas tells us dinosaurs with feet like these were plant eaters with long legs, a chunky body, short arms, and a small head with a beak.”
The remarkable rock was uncovered 20 years ago at Callide Mine near Biloela and given to the local high school.
Its significance remained unknown until Dr Romilio’s previous work on nearby Mount Morgan footprints prompted the community to contact him.
“Significant fossils like this can sit unnoticed for years, even in plain sight,” Dr Romilio said.
“It’s incredible to think that a piece of history this rich was resting in a schoolyard all this time.
“With advanced 3D imaging and light filters, I was able to reveal hidden details in the footprints.
“Another sample in this study of Callide Basin footprints was also hiding in plain sight — I spotted it being used as a carpark entry delineator at Callide Mine.
“This rock is much larger at around 2-tonnes with 2 distinct footprints left by a slightly larger dinosaur walking on 2 legs around 80cm in length.
“Along with a sample from a third rock that is encased in resin and was being used as a bookend, we have gained new insight into the ancient past in this region.”
High-resolution models of the fossils are available online, allowing anyone to explore these ancient tracks in detail.
Investigation of the rock samples has been supported by Batchfire Resources, Biloela State High School and the Banana Shire Council.
Reference:
Anthony Romilio, Ron Park, Wes Nichols, Owen Jackson. Dinosaur footprints from the Lower Jurassic (Hettangian–Sinemurian) Precipice Sandstone of the Callide Basin, Queensland, Australia. Historical Biology, 2025; 1 DOI: 10.1080/08912963.2025.2472153
Feathers, essential for thermoregulation, flight, and communication in birds, originate from simple appendages known as proto-feathers, which were present in certain dinosaurs.By studying embryonic development of the chicken, two researchers from the University of Geneva (UNIGE) have uncovered a key role of a molecular signalling pathway (the Shh pathway) in their formation. This research, published in the journal PLOS Biology, provides new insights into the morphogenetic mechanisms that led to feather diversification throughout evolution.
Feathers are among the most complex cutaneous appendages in the animal kingdom. While their evolutionary origin has been widely debated, paleontological discoveries and developmental biology studies suggest that feathers evolved from simple structures known as proto-feathers. These primitive structures, composed of a single tubular filament, emerged around 200 million years ago in certain dinosaurs. Paleontologists continue to discuss the possibility of their even earlier presence in the common ancestor of dinosaurs and pterosaurs (the first flying vertebrates with membranous wings) around 240 million years ago.
Proto-feathers are simple, cylindrical filaments. They differ from modern feathers by the absence of barbs and barbules, and by the lack of a follicle — an invagination at their base. The emergence of proto-feathers likely marked the first key step in feather evolution, initially providing thermal insulation and ornamentation before being progressively modified under natural selection to give rise to the more complex structures that enabled flight.
The laboratory of Michel Milinkovitch, professor at the Department of Genetics and Evolution in the Faculty of Science at UNIGE, studies the role of molecular signaling pathways (communication systems that transmit messages within and between cells), such as the Sonic Hedgehog (Shh) pathway, in the embryonic development of scales, hair, and feathers in modern vertebrates. In a previous study, the Swiss scientists stimulated the Shh pathway by injecting an activating molecule into the blood vessels of chicken embryos and observed the complete and permanent transformation of scales into feathers on the bird’s feet.
Recreating the first dinosaur proto-feathers
”Since the Shh pathway plays a crucial role in feather development, we wanted to observe what happens when it is inhibited,” explains Rory Cooper, a postdoctoral researcher in Michel Milinkovitch’s lab and co-author of the study. By injecting a molecule that blocks the Shh signaling pathway on the 9th day of embryonic development — just before feather buds appear on the wings — the two researchers observed the formation of unbranched and non-invaginated buds, resembling the putative early stages of proto-feathers.
However, from the 14th day of embryonic development, feather morphogenesis partially recovered. Furthermore, although the chicks hatched with patches of naked skin, dormant subcutaneous follicles were autonomously reactivated, eventually producing chickens with normal plumage.
”Our experiments show that while a transient disturbance in the development of foot scales can permanently turn them into feathers, it is much harder to permanently disrupt feather development itself,” concludes Michel Milinkovitch. ”Clearly, over the course of evolution, the network of interacting genes has become extremely robust, ensuring the proper development offeathers even under substantial genetic or environmental perturbations. The big challenge now is to understand how genetic interactions evolve to allow for the emergence of morphological novelties such as proto-feathers.”
Reference:
Rory L. Cooper, Michel C. Milinkovitch. In vivo sonic hedgehog pathway antagonism temporarily results in ancestral proto-feather-like structures in the chicken. PLOS Biology, 2025; 23 (3): e3003061 DOI: 10.1371/journal.pbio.3003061
Dryolestes, a Late Jurassic relative of the Cretaceous therians. Credit: Artist James Brown, courtesy of Pamela Gill
More mammals were living on the ground several million years before the mass extinction event that wiped out the dinosaurs, new research led by the University of Bristol has revealed.
The study, published today in the journal Palaeontology, provides fresh evidence that many mammals were already shifting toward a more ground-based lifestyle leading up to the asteroid’s impact.
By analysing small-fossilised bone fragments, specifically end of limb bones, from marsupial and placental mammals found in Western North America — the only place with a well-preserved terrestrial fossil record from this time — the team discovered signs that these mammals were adapting to life on the ground.
End of limb bones were analysed as they bear signatures of locomotory habit that can be statistically compared with modern mammals.
Lead author Professor Christine Janis from the University of Bristol’s School of Earth Sciences said: “It was already known that plant life changed toward the end of the Cretaceous, with flowering plants, known as angiosperms, creating more diverse habitats on the ground. We also knew that tree dwelling mammals struggled after the asteroid impact. What had not been documented, was whether mammals were becoming more terrestrial, in line with the habitat changes.”
While previous studies used complete skeletons to study ancient mammal movement, this research is one of the first to use small bone elements to track changes within an entire community.
The team have used statistical data from museum collections in New York, California, and Calgary to analyse these tiny fossils.
Professor Janis added: “The vegetational habitat was more important for the course of Cretaceous mammalian evolution than any influence from dinosaurs.”
The evidence was gathered from bone articular fragments of therian mammals, which includes marsupials and placentals.
The team’s methods were not applied to more basal mammals such as multiberculates, which were common at the time, because their bones were different.
Professor Janis said: “We’ve known for a long time that mammalian long bone articular surfaces can carry good information about their mode of locomotion, but I think this is the first study to use such small bone elements to study change within a community, rather than just individual species.”
While this research marks the end of the project, the findings offer new insights into how prehistoric mammals responded to changing environments — a few million years before the asteroid impact reshaped life on Earth.
Reference:
Christine M. Janis, Alberto Martín-Serra, Jessica M. Theodor, Craig S. Scott. Down to earth: therian mammals became more terrestrial towards the end of the Cretaceous. Palaeontology, 2025 DOI: 10.1111/pala.70004