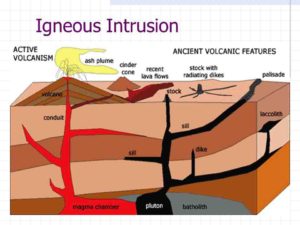
In geology, a pluton is a body of intrusive igneous rock (called a plutonic rock) that is crystallized from magma slowly cooling below the surface of the Earth. Plutons include batholiths, stocks, dikes, sills, laccoliths, lopoliths, and other igneous formations. In practice, “pluton” usually refers to a distinctive mass of igneous rock, typically several kilometers in dimension, without a tabular, or flat, shape like those of dikes and sills. Examples of plutons include Denali (formerly Mount McKinley) in Alaska; Cuillin in Skye, Scotland; Cardinal Peak in Washington State; Mount Kinabalu in Malaysia; and Stone Mountain in the US state of Georgia.
The most common rock types in plutons are granite, granodiorite, tonalite, monzonite, and quartz diorite. Generally light colored, coarse-grained plutons of these compositions are referred to as granitoids.
The term originated from Pluto, the classical god of the underworld. The use of the name and concept goes back to the beginnings of the science of geology in the late 18th century and the then hotly debated theories of plutonism (or vulcanism), and neptunism regarding the origin of basalt.
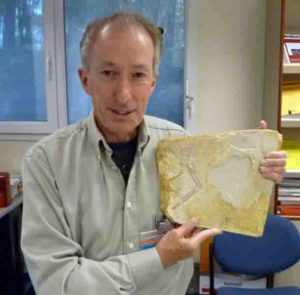
Dr. John Nudds with Archaeopteryx fossil specimen at the European Synchrotron in Grenoble. Credit: Image courtesy of The University of Manchester
Known as the ‘Icon of Evolution’ and ‘the missing link’ between dinosaurs and birds, Archaeopteryx has become one of the most famous fossil discoveries in Palaeontology.
Now, as part of an international team of scientists, researchers at The University of Manchester have identified a new species of Archaeopteryx that is closer to modern birds in evolutionary terms.
Dr John Nudds, from the University’s School of Earth and Environmental Sciences, and the team have been re-examining one of the only 12 known specimens by carrying out the first ever synchrotron examination, a form of 3D X-ray analysis, of an Archaeopteryx.
Thanks to this new insight, the team says that this individual Archaeopteryx fossil, known as ‘specimen number eight’, is physically much closer to a modern bird than it is to a reptile. Therefore, it is evolutionary distinctive and different enough to be described as a new species — Archaeopteryx albersdoerferi.
The research, which is being published in journal Historical Biology, says that some of the differing skeletal characteristics of Archaeopteryx albersdoerferi include the fusion of cranial bones, different pectoral girdle (chest) and wing elements, and a reinforced configuration of carpals and metacarpals (hand) bones.
These characteristics are seen more in modern flying birds and are not found in the older Archaeopteryx lithographica species, which more resembles reptiles and dinosaurs.
Specimen number eight is the youngest of all the 12 known specimens by approximately half a million years. This age difference in comparison to the other specimens is a key factor in describing it as a new species.
Dr Nudds explains: “By digitally dissecting the fossil we found that this specimen differed from all of the others. It possessed skeletal adaptations which would have resulted in much more efficient flight. In a nutshell we have discovered what Archaeopteryx lithographica evolved into — i.e. a more advanced bird, better adapted to flying — and we have described this as a new species of Archaeopteryx.”
Archaeopteryx was first described as the ‘missing link’ between reptiles and birds in 1861 — and is now regarded as the link between dinosaurs and birds. Only 12 specimens have ever been found and all are from the late Jurassic of Bavaria, now Germany, dating back approximately 150 million years.
Lead author, Dr Martin Kundrát, from the University of Pavol Jozef Šafárik, Slovakia, said: “This is the first time that numerous bones and teeth of Archaeopteryx were viewed from all aspects including exposure of their inner structure. The use of synchrotron microtomography was the only way to study the specimen as it is heavily compressed with many fragmented bones partly or completely hidden in limestone.”
Dr Nudds added: “Whenever a missing link is discovered, this merely creates two further missing links — what came before, and what came after! What came before was discovered in 1996 with the feathered dinosaurs in China. Our new species is what came after. It confirms Archaeopteryx as the first bird, and not just one of a number of feathered theropod dinosaurs, which some authors have suggested recently. You could say that it puts Archaeopteryx back on its perch as the first bird!”
Reference:
Martin Kundrát, John Nudds, Benjamin P. Kear, Junchang Lü, Per Ahlberg. The first specimen of Archaeopteryx from the Upper Jurassic Mörnsheim Formation of Germany. Historical Biology, 2018; 31 (1): 3 DOI: 10.1080/08912963.2018.1518443
Fossil tortoise at the Central Natural Science Collections at MLU. Credit: Markus Scholz / MLU
Tortoises are a group of terrestrial turtles globally distributed in habitats ranging from deserts to forests and include species such as the Greek and the Galapagos tortoise. Some species evolved large body sizes with a shell length exceeding 1 metre whereas others are no larger than 6-8 centimetres. Despite a particular interest from naturalists ever since the times of Darwin, the evolution of gigantism in tortoises remains enigmatic.
The fact that all living giant tortoises are insular may suggest that their evolution followed the so-called island rule: a trend toward dwarfism of large animals and gigantism of small animals on islands. An example of insular dwarfism is the Florida key deer, a dwarf version of the mainland white-tailed deer; its small size may be an adaptation to the limited resources found on the islands. Insular gigantism is best exemplified by the famous dodo, an extinct flightless pigeon from Mauritius, probably evolving large body size due to release from predatory pressure. Previous studies on extant tortoises were partly inconclusive: giant size has been linked to the absence of predatory mammals in islands but it has been also proposed that tortoises were already giants when they reached the remote archipelagos. Since very few giant tortoise species survive to the present, these hypotheses are impossible to test without analysing extinct species through the help of the fossil record.
In a recent study in the journal “Cladistics,” Dr Evangelos Vlachos from the Paleontological Museum of Trelew, Argentina, and Dr Márton Rabi from the Martin Luther University Halle-Wittenberg (MLU), funded by the German VolkswagenStiftung, assembled the most comprehensive family tree of extinct and extant tortoises so far. The researchers analysed genetic data from living species together with osteological data from fossil and living tortoises.
This is the first study of such global scale to allow for investigating body size evolution in tortoises. The fossils reveal a very different picture of the past compared to the present. Giant size evolved on multiple occasions independently in mainland Asia, Africa, Europe, North and South America at different times of Earth history. However, all of these species went extinct at latest during the Pleistocene ice age.
“The fossils highlight a great number of extinct mainland giant species and suggest that the evolution of giant size was not linked to islands,” says Dr Evangelos Vlachos.
Instead, living insular giant tortoises, such as the ones from Galapagos and Seychelles, more likely represent survivors of unrelated giant species that once inhabited South America, East Africa, and/or Madagascar.
“Giant tortoises may have been better island colonizers because they can tolerate water and food shortage during an oceanic dispersal for a longer period than smaller species. Giant tortoises have been reported to survive 740 km of floating in the ocean,” says Dr Márton Rabi.
What led to the extinction of these mainland giants remains enigmatic. For the ice age species, it may have been a combination of predatory (including human) pressure and climate change. It is likewise unclear, if not the island rule, then what is driving tortoises to repeatedly evolve into giant forms?
“We expect that warmer climate and predator pressure plays a role in the evolution of giant size but the picture is complex and our sampling of the fossil record is still limited.” — Vlachos adds.
An unexpected outcome of the study was that the Mediterranean tortoises (familiar due to their popularity as pets) actually represent a dwarf lineage as their ancestors turned out to be considerably larger.
“Tortoises have been around for more than 55 million years and we are now able to better understand the evolution of this successful group. Today, however, out of the approximately 43 living species 17 are considered endangered and many more are vulnerable largely due to human-induced habitat loss; this is a disappointing fact.” — Rabi points out.
Reference:
Evangelos Vlachos, Márton Rabi. Total evidence analysis and body size evolution of extant and extinct tortoises (Testudines: Cryptodira: Pan-Testudinidae). Cladistics, 2017; DOI: 10.1111/cla.12227
In the oxygen-poor air of the Mesozoic era, nothing should have been able to move very fast. But Velociraptors could run 64 kilometers per hour. Their secret weapon: superefficient, birdlike lungs, which would have pumped in a constant supply of oxygen, according to a new study. This unique adaptation may have given all dinos a leg up on their competition.
Biologists have long known that birds, which descend from one branch of extinct dinosaurs, have an unusual, sophisticated respiratory system that enables powered flight. But paleontologists have long debated whether those superlungs arose only in birds or earlier in dinosaurs.
Unlike humans and other mammals, whose lungs expand and deflate, bird lungs are rigid. Special air sacs alongside the lungs do the heavy lifting instead, pumping air through the lungs, where the oxygen diffuses into the bloodstream. The lungs are attached to the vertebrae and ribs, which form the “ceiling” of the rib cage—all of which helps keep the lungs stationary. A connector called the costovertebral joint, where the ribs and vertebrae meet, provides further support. That setup allows for a continuous stream of oxygen and requires less energy than inflating and deflating the lungs. It also allows paleontologists studying fossils to learn a lot about the lungs by examining the bones around them.
To find out when these superlungs evolved, paleobiologists Robert Brocklehurst and William Sellers of The University of Manchester in the United Kingdom, and biologist Emma Schachner of Louisiana State University in Baton Rouge turned to computer models. They compared the shapes of skeletal features like vertebrae and ribs in a range of bird and nonavian dinosaur species.
Many dinosaurs, including therapods like Velociraptor and Spinosaurus, a large carnivorous dinosaur, had similar lung architecture to birds, the team reports today in Royal Society Open Science. These dinosaurs sported a costovertebral joint and the birdlike bony “ceiling” of vertebrae and ribs that helps keep the lungs rigid.
All of this suggests dinos had the same kind of efficient respiratory organs as birds, the team concludes. These superlungs may help explain why dinosaurs were able to dominate and spread, despite the rarified air of the Mesozoic, Brocklehurst says. Back then, the air was only 10% to 15% oxygen, compared with 20% today.
The work sheds light on how birds’ extraordinary lungs evolved, says Jingmai O’Connor, a paleontologist with the Institute of Vertebrate Paleontology and Paleoanthropology at the Chinese Academy of Sciences in Beijing. “Birds are really weird compared to all other animals,” she says. “They have this highly evolved respiration system, [and] we’ve always wondered, ‘How did this evolve?'” Now, it seems likely that superlungs first developed in dinosaurs, and only later on evolved to support powered flight in birds, she says.
But O’Connor adds that just because a fossil has the bone structure for birdlike lungs doesn’t necessarily mean it actually had such lungs. Finding lung tissue, which is almost never preserved, would be the clincher. She described what may be the first preserved lungs found in a bird fossil at the Society of Vertebrate Paleontology’s annual meeting in Albuquerque, New Mexico, last week and in a paper in the Proceedings of the National Academy of Sciences yesterday. In that 120-million-year-old, dove-size bird from China, she and her team noted that although the putative lungs were sophisticated, the skeletal structure around them was primitive, suggesting bones and soft tissue may not evolve in lockstep.
Not everyone is sure O’Connor’s bird organs are really lungs, however. The structures could be a mineral artifact, speculates Corwin Sullivan, a paleontologist at the University of Alberta in Edmonton, Canada, who studies the evolution of avian respiratory systems. But even if so, he says, the specimen is “absolutely fascinating.”
Reference:
Robert J. Brocklehurst et al. Vertebral morphometrics and lung structure in non-avian dinosaurs, Royal Society Open Science (2018). DOI: 10.1098/rsos.180983
Xiaoli Wang et al. Archaeorhynchus preserving significant soft tissue including probable fossilized lungs, Proceedings of the National Academy of Sciences (2018). DOI: 10.1073/pnas.1805803115
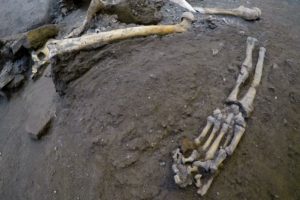
The remains of skeletons that were found in the Pompeii archaeological site, Italy, Wednesday, Oct. 24, 2018. The Italian news agency ANSA says new excavations in the ancient buried city of Pompeii have yielded the undisturbed skeletons of people who had taken refuge from the eruption of Mount Vesuvius in A.D.79. The director of the Pompeii archaeological site, Massimo Osanna, told ANSA on Wednesday the skeletons, believed to be two women and three children, were still intact, having been left undisturbed despite looting at the site centuries ago. Credit: Ciro Fusco/ANSA via AP
Italian news agency ANSA says new excavations in the ancient buried city of Pompeii have yielded the undisturbed skeletons of people who took refuge from the eruption of Mount Vesuvius in A.D.79.
The director of the Pompeii archaeological site, Massimo Osanna, told ANSA on Wednesday the skeletons were still intact, having been left undisturbed despite looting at the site centuries ago.
Osanna called it “a shocking find, but also very important for history.”
The bones — believed to be those of two women and three children — were discovered inside a house holding a charcoal inscription that historians say dates the deadly eruption to October, two months later than previously thought.
Archaeologists think the people sought safety in a small room but were either crushed when the roof caved in or burned.
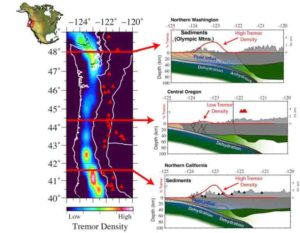
Rice University scientists studied how the density of microseismicity, or small tremors, related to the seismic structure of the Pacific Northwest in the United States. Red lines in the graphic at left correspond to cross-sections from northern Washington (top), central Oregon (middle), and northern California (bottom). The researchers determined a strong correlation exists between tremor density and underthrusting sediments (brown material in the graphics on right). Fluids that are released from the downgoing slab are concentrated in these sediments and lead to very slow seismic velocities in the region. Credit: Jonathan Delph/Rice University
The earthquakes are so small and deep that someone standing in Seattle would never feel them. In fact, until the early 2000s, nobody knew they happened at all. Now, scientists at Rice University have unearthed details about the structure of Earth where these tiny tremors occur.
Rice postdoctoral researcher and seismologist Jonathan Delph and Earth scientists Fenglin Niu and Alan Levander make a case for the incursion of fluid related to slippage deep inside the Cascadia margin off the Pacific Northwest’s coast.
Their paper, which appears in the American Geophysical Union journal Geophysical Research Letters, links fluids escaping from deep subduction to the frequent shakes that Delph said happen in relative slow motion when compared to the sudden, violent jolts occasionally felt by Southern Californians at the southern end of the west coast.
“These aren’t large, instantaneous events like a typical earthquake,” Delph said. “They’re seismically small, but there’s a lot of them and they are part of the slow-slip type of earthquake that can last for weeks instead of seconds.”
Delph’s paper is the first to show variations in the scale and extent of fluids that come from dehydrating minerals and how they relate to these low-velocity quakes. “We are finally at the point where we can address the incredible amount of research that’s been done in the Pacific Northwest and try to bring it all together,” he said. “The result is a better understanding of how the seismic velocity structure of the margin relates to other geologic and tectonic observations.”
The North American plate and Juan de Fuca plate, a small remnant of a much larger tectonic plate that used to subduct beneath North America, meet at the Cascadia subduction zone, which extends from the coast of northern California well into Canada. As the Juan de Fuca plate moves to the northeast, it sinks below the North American plate.
Delph said fluids released from minerals as they heat up at depths of 30 to 80 kilometers propagate upward along the boundary of the plates in the northern and southern portions of the margin, and get trapped in sediments that are subducting beneath the Cascadia margin.
“This underthrust sedimentary material is being stuck onto the bottom of the North American plate,” he said. “This can allow fluids to infiltrate. We don’t know why, exactly, but it correlates well with the spatial variations in tremor density we observe. We’re starting to understand the structure of the margin where these tremors are more prevalent.”
Delph’s research is based on extensive seismic records gathered over decades and housed at the National Science Foundation-backed IRIS seismic data repository, an institutional collaboration to make seismic data available to the public.
“We didn’t know these tremors existed until the early 2000s, when they were correlated with small changes in the direction of GPS stations at the surface,” he said. “They’re extremely difficult to spot. Basically, they don’t look like earthquakes. They look like periods of higher noise on seismometers.
“We needed high-accuracy GPS and seismometer measurements to see that these tremors accompany changes in GPS motion,” Delph said. “We know from GPS records that some parts of the Pacific Northwest coast change direction over a period of weeks. That correlates with high-noise ‘tremor’ signals we see in the seismometers. We call these slow-slip events because they slip for much longer than traditional earthquakes, at much slower speeds.”
He said the phenomenon isn’t present in all subduction zones. “This process is pretty constrained to what we call ‘hot subduction zones,’ where the subducting plate is relatively young and therefore warm,” Delph said. “This allows for minerals that carry water to dehydrate at shallower depths.
“In ‘colder’ subduction zones, like central Chile or the Tohoku region of Japan, we don’t see these tremors as much, and we think this is because minerals don’t release their water until they’re at greater depths,” he said. “The Cascadia subduction zone seems to behave quite differently than these colder subduction zones, which generate large earthquakes more frequently than Cascadia. This could be related in some way to these slow-slip earthquakes, which can release as much energy as a magnitude 7 earthquake over their duration. This is an ongoing area of research.”
Reference:
Jonathan R. Delph, Alan Levander, Fenglin Niu. Fluid Controls on the Heterogeneous Seismic Characteristics of the Cascadia Margin. Geophysical Research Letters, 2018; DOI: 10.1029/2018GL079518
Note: The above post is reprinted from materials provided by Rice University. Original written by Mike Williams.
Last September’s magnitude 8.2 Tehuantepec earthquake happened deep, rupturing both mantle and crust, on the landward side of major subduction zone in the Pacific Ocean off Mexico’s far south coast.
Initially, it was believed the earthquake was related to a seismic gap, occurring where the Cocos ocean plate is being overridden by a continental plate, in an area that had not had a quake of such magnitude since 1787. Subduction zone megaquakes generally occur near the top of where plates converge.
The epicenter, however, was 46 kilometers (28 miles) deep in the Cocos plate, well under the overriding plate and where existing earthquake modeling had said it shouldn’t happen, a 13-member research team reported Oct. 1 in the journal Nature Geoscience after an analysis of data from multiple sources.
“We don’t yet have an explanation on how this was possible,” said the study’s lead author Diego Melgar, an earth scientist at the University of Oregon. “We can only say that it contradicts the models that we have so far and indicates that we have to do more work to understand it.”
Earthquakes do occur in such locations, where a descending plate’s own weight creates strong forces that stretch the slab as it dives down toward the mantle, but have been seen only under older and cooler subduction zones. The 1933 Sanriku, Japan, earthquake was one. It generated a 94-foot tsunami that killed 1,522 people and destroyed more than 7,000 homes.
The Mexican quake, ruptured the descending slab and generated a 6-foot tsunami, which likely was limited in size by the angle of the overriding continental plate so close to shore, Melgar said.
“This subducting plate is still very young and warm, geologically speaking,” he said. “It really shouldn’t be breaking.”
Subduction zone ages and their temperatures relate to their distance from mid-ocean ridges, where plates are made in temperatures of 1,400 degrees Celsius (2,552 degrees Fahrenheit), Melgar said. The 25-million-year-old Cocos subduction zone is 600 miles from the mid-ocean ridge where it began. Japan’s subduction zone is much further from the ridge and 130-million-years old.
Temperatures cool as plates move outward. Tension-related earthquakes, the researchers noted, have been restricted to older plates with temperatures that are cooler than 650 degrees Celsius (1,202 degrees Fahrenheit).
Melgar’s team theorizes that seawater infiltration into the fabric of the stressed and diving Cocos plate has possibly accelerated the cooling, making it susceptible to tension earthquakes previously seen only in older and colder locations. It’s also possible, the researchers noted, that the 8.0 magnitude 1933 Oaxaca earthquake, previously thought to be in a traditional subduction zone event, was instead similar to the one that struck last year.
If such water-driven cooling is possible, it could suggest other areas, especially Guatemala southward in Central America, and the U.S. West Coast are susceptible to tension-zone earthquakes, Melgar said.
The Cascadia subduction zone, from northern California to British Columbia, is 15 million years old and warmer than the similar geology along the Mexican-Central America coastlines, but could still be at risk.
Building codes and hazard maps should reflect the potential danger, he added.
“Our knowledge of these places where large earthquakes happen is still imperfect,” Melgar said. “We can still be surprised. We need to think more carefully when we make hazard and warning maps. We still need to do a lot of work to be able to provide people with very accurate information about what they can expect in terms of shaking and in terms of tsunami hazard.”
Reference:
Diego Melgar, Angel Ruiz-Angulo, Emmanuel Soliman Garcia, Marina Manea, Vlad. C. Manea, Xiaohua Xu, M. Teresa Ramirez-Herrera, Jorge Zavala-Hidalgo, Jianghui Geng, Nestor Corona, Xyoli Pérez-Campos, Enrique Cabral-Cano, Leonardo Ramirez-Guzmán. Deep embrittlement and complete rupture of the lithosphere during the Mw 8.2 Tehuantepec earthquake. Nature Geoscience, 2018; DOI: 10.1038/s41561-018-0229-y
A mile-long sediment core drilled by the International Ocean Discovery Program helped researchers uncover how the Chicxulub crater formed. Credit: International Ocean Discovery Program
Sixty-six million years ago, an asteroid the size of a small city smashed into Earth. This impact, the one that would lead to the end of the dinosaurs, left a scar several miles underground and more than 115 miles wide.
Chicxulub, which lies underneath the Yucatán Peninsula of Mexico, is the best-preserved large impact crater on Earth, although it’s buried underneath a half mile of rocks. It’s also the only crater on the planet with a mountainous ring of smashed rocks inside its outer rim, called a peak ring. How these features form has long been debated, but a new study in Nature shows they’re a product of extremely strong vibrations that let rock flow like liquid for a crucial few minutes after the impact.
When an asteroid crashes into Earth, it leaves a bowl-shaped pit, just like you’d expect. But it doesn’t just leave a dent. If the asteroid is big enough, the resulting crater can be more than 20 miles deep, at which point it becomes unstable and collapses.
“For a while, the broken rock behaves as a fluid,” said Jay Melosh, a professor of earth, atmospheric and planetary sciences at Purdue University. “There have been a lot of theories proposed about what mechanism allows this fluidization to happen, and now we know it’s really strong vibrations shaking the rock constantly enough to allow it to flow.”
This mechanism, known as “acoustic fluidization,” is the process that allows the ring of mountains in the crater’s center to rise within minutes of the asteroid’s strike. (This idea was first proposed by Melosh in 1979). Craters are essentially the same on all the terrestrial planets (Earth, Mercury, Venus, Mars and our moon), but they’re hard to study in space for obvious reasons: We can’t look at them with the same detail we can on Earth.
The Chicxulub crater isn’t easily accessible by traditional standards either; it’s been buried throughout the last 66 million years. So the International Ocean Discovery Program (a group within the International Continental Scientific Drilling Program), did the only thing they could — they dug. The team drilled a core roughly six inches in diameter and a mile into Earth, collecting rock that was shattered and partly melted by the impact that wiped out the dinosaurs.
In examining fracture zones and patterns in the core, the international research team found an evolution in the vibration sequence that would allow debris to flow.
“These findings help us understand how impact craters collapse and how large masses of rock behave in a fluid-like manner in other circumstances, such as landslides and earthquakes,” Melosh said. “Towns have been wiped out by enormous landslides, where people thought they were safe but then discovered that rock will flow like liquid when some disturbance sets a big enough mass in motion.”
The extinction of the dinosaurs itself was probably not directly affected by the crater’s internal collapse — other, external effects of the impact did them in, Melosh said. Regardless, it’s important to understand the consequences of a large asteroid strike on Earth. Because cratering is the same on all the terrestrial planets, these findings also validate the mechanics of impacts everywhere in the solar system.
Reference:
Ulrich Riller, Michael H. Poelchau, Auriol S. P. Rae, Felix M. Schulte, Gareth S. Collins, H. Jay Melosh, Richard A. F. Grieve, Joanna V. Morgan, Sean P. S. Gulick, Johanna Lofi, Abdoulaye Diaw, Naoma McCall, David A. Kring. Rock fluidization during peak-ring formation of large impact structures. Nature, 2018; 562 (7728): 511 DOI: 10.1038/s41586-018-0607-z
Note: The above post is reprinted from materials provided by Purdue University.
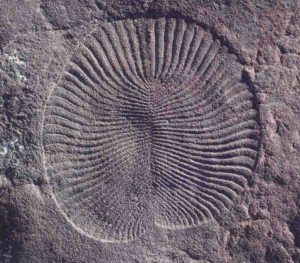
Dickinsonia costata, an extinct soft-bodied organism representing one of the first complex metazoans in the fossil record.Total length 53.5?mm. Credit: Scott Evans
Hundreds of millions of years before there was a chicken or an egg to debate, the first complex animals were evolving in parallel with Earth’s rising oxygen levels.
But what came first—animals or oxygen?
That question is the central theme of a special issue of Emerging Topics in Life Sciences published Sept. 28 by Portland Press. Titled “Early Earth and the Rise of Complex Life,” the issue was edited by UC Riverside’s Timothy Lyons, a distinguished professor of biogeochemistry, along with UCR professor Mary Droser and postdoctoral researcher Kimberly Lau, and Susannah Porter, a professor at UC Santa Barbara. Several of the 18 articles included in the collection were authored or co-authored by UCR researchers.
While geological and fossil records suggest the formation of complex life and oxygenation of the planet progressed hand-in-hand, the details about the possible cause-and-effect relationship are still murky and debated. Did rising oxygen levels in the oceans and atmosphere drive the formation of complex life, were they unrelated, or did the eventual emergence and proliferation of complex life instead cause a rise in oxygen?
“While those questions remain largely unanswered at this time, this curated collection offers an up-to-date look at the relationship between early organisms and their environments through the lens of a diverse group of scientists using a variety of cutting-edge methods,” Lyons said.
Oxygen began to accumulate in the oceans and atmosphere 2.3-2.4 billion years ago during the Great Oxidation Event. By 1.8 billion years ago, oxygen levels had fallen to intermediate levels, where they remained stable for another billion years—dubbed ‘the boring billion’ by scientists. Around 800 million years ago, the levels likely increased again, and the first animals evolved soon after.
A paper by Scott Evans, a graduate student in Droser’s lab, presents evidence suggesting another rise of oxygen catalyzed innovation in animal life. By studying fossil animals from between 550-560 million years ago, during the so-called Ediacaran era, Evans showed that Earth’s early animals, which were ocean-dwelling creatures that “breathed” by diffusion, evolved to be larger. This meant a lower fraction of their cells came in contact with the surrounding waters during a period of increased oxygen and became smaller again during a transient decrease.
“This relationship suggests that a rise in oxygen levels may have provided the environment necessary for the diversification of complex body plans and energetically demanding ecologies,” Lyons said.
Not everyone in the series agrees that a rise in oxygen was key to our early ancestors’ success. Daniel Mills at the University of Southern Denmark cautions the relationship between the evolution of complex life and increasing oxygenation remains open to question. Perhaps, he suggests, the emergence of animals might have been based on “internal developmental constraints,” meaning the time it took for animals with sophisticated cellular machinery governed by complex genetics to evolve independently of environmental changes.
“Readers will not leave this collection with a clear single answer,” Lyons said. “Instead, our goal was to give them an up-to-date view of the key debates about evolving early complex life and environmental change, the full context that lies behind the questions and uncertainties, and the work left to do.”
Reference:
Timothy W. Lyons et al, Early Earth and the rise of complex life, Emerging Topics in Life Sciences (2018). DOI: 10.1042/ETLS20180093
A team of researchers from The University of Western Australia and two Canadian universities has applied a first-of-its-kind technique that measures the long-term life cycle of sulphur, helping to explain the preferential location of high-value mineral deposits at the edges of ancient continents.
The study, published today in Nature Communications, charts the life cycle of sulphur over hundreds of millions of years, from its origins as a volcanic gas emitted into the primordial atmosphere and oceans, and all the way throughout its journey across the earth’s deep crust.
Sulphur plays a critical role in a variety of fundamental earth processes as it regulates the global climate, is essential to the living cell, and is the primary molecule necessary to transport and concentrate precious metals such as gold and platinum.
The team, which included researchers from Canada’s Université Laval and McGill University, initially set out to better understand the behaviour of sulphur in the ancient earth. During the process the researchers were able to create a technique using sophisticated technology based at UWA that could help explorers identify new mineral-rich provinces in Australia and around the world.
Co-author Associate Professor Marco Fiorentini, from UWA’s School of Earth Sciences, said that the largest and richest deposits of precious metals in Australia and on Earth were generally associated with large concentrations of sulphur-rich minerals.
“By understanding how and where sulphur is stored researchers can make predictions about the location of mineral deposits,” Professor Fiorentini said. “Just as a medical dye may be used to unveil the intricate pathways of the inner human body, we have developed a technique to illuminate the cryptic pathway of sulphur through the crust of our planet more than two billion years ago.”
The technique presents a new way to engage with the minerals industry, helping them to explore vast areas of the planet that may host valuable resources.
Reference:
Crystal LaFlamme et al. Atmospheric sulfur is recycled to the crystalline continental crust during supercontinent formation, Nature Communications (2018). DOI: 10.1038/s41467-018-06691-3
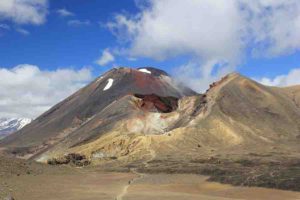
Eruption patterns in the Taupo Volcanic Zone provide insight into how super eruptions might work. Credit: Chad Deering/Michigan Tech
The road cut seems rather dull and gray at first, but the tuff and pumice rocks hold the secrets of a volcano. Covered in green ferns and brown roots, the rocks lock in the compositional and temporal signatures from past eruptions of the Taupo Volcanic Zone, New Zealand. Taupo is an active system, where some of the world’s largest eruptions have occurred over the past two million years. In particular, between 350,000 and 240,000 years ago, Taupo exploded with seven eruptions–a volcanic ‘flare-up’ of activity.
But why? A team of geoscientists went to New Zealand’s North Island to dig into the answers and the white-gray rocks holding them. As explained in their findings, published this week in Science Advances, the team found that the flare-up of eruptions showed a pattern: The underlying magma body would erupt and reset over only decades to centuries in progressively shallower chambers close to the Earth’s surface.
A better understanding of what governs this pattern can help with understanding supereruptions, which may be mitigated by smaller and more frequent eruptions. In addition, these results could aid with predictions of similar type eruptions through improved modeling down the road. Vanderbilt University geoscientists led the team along with Michigan Technological University, University of Canterbury, Brown University, Princeton University, University of Lausanne, OFM Research-West and Woods Hole Oceanographic Institution. Chad Deering, an assistant professor of geology at Michigan Tech, studied the Taupo Volcanic Zone for his PhD and continues to do fieldwork in the area.
“This massive outpouring of magma essentially drains the magmatic system over a relatively short period of time,” Deering says. “However, following this activity, new magma rapidly ascends within the crust and primes it at shallow depths only to feed more large eruptions.”
The magma climbs the crustal ladder, so to speak, as it lodges in shallower and shallower chambers before erupting. The crust then warms and weakens, melting more of the surrounding crust, which enriches the magma with new minerals and water–a recipe for explosion.
The question that remains is: How long did it take for these crystal-rich magma bodies to assemble between eruptions? The study’s lead researcher, Guilherme Gualda of Vanderbilt University, says it could be thousands of years, but may be even shorter.
“You have magma sitting there that’s crystal-poor/melt-rich for a few decades, maybe 100 years, and then it erupts,” Gualda said. “Then another magma body is established, but we don’t know how gradually that body assembles. It’s a period in which you’re increasing the amount of melt in the crust.”
It all comes down to timing. And better understanding the timeline and chemical make-up of the Taupo Volcanic Zone in New Zealand gives insight into how supereruptions build up in volcanoes around the world.
Reference:
Climbing the crustal ladder: Magma storage-depth evolution during a volcanic flare-up. DOI: 10.1126/sciadv.aap7567
Palaeontologist Jonah Choiniere says a student noticed a ‘few (fossilised) bones coming out’ of a massive rock on a remote farm in central South Africa. ‘It turned out to be a hip of a species we’ve never seen before’
The sun rises over the South African bush as scientists laden with backpacks climb a hillside.
They get down to work, carving into two immense blocks of stone that have concealed the secrets of an ancestor of modern-day crocodiles for some 200 million years.
Jonah Choiniere and his team from Johannesburg’s Witwatersrand University had tracked the reptile from another age for three years.
The search brought them to a stretch of farmland in the central town of Rosendal, where they are surrounded by cattle and impalas.
“In 2015, one of my students just saw a few (fossilised) bones coming out,” said Choiniere, his shirt sticking to sweat from the morning’s hike.
“We started to excavate it and we brought it back to the lab and it turned out to be a hip of a species we’ve never seen before,” said the palaeontologist, who is originally from the United States.
The delicate excavation process at the site is grindingly slow and continues today.
Before being extracted, the stone surrounding a fossil is carefully enveloped in a protective layer of plaster.
After five hours of drying time, the stone is chiselled free, lifted by three strong people, and then transported by road nearly 300 kilometres (185 miles) to Johannesburg into the expert hands of Wilfred Bilankulu.
“My job is to make the fossils visible,” said the former fine arts student. “I’m taking off the jacket that has been put in place around the fossil, and after I prepare them using dental tools.”
Rare specimen
The herculean task will take between eight and 12 months. A similar amount of time will be needed to meticulously examine, compare and describe the find.
Choiniere expected a bountiful haul even before he had the discovery in hand.
“This is a pretty good harvest for us. We didn’t know what to expect when we came into this quarry… I can say it’s much better than what we were expecting, very promising,” he said.
Given the bones already uncovered, Choiniere’s research student Rick Tolchard can barely hide his excitement.
He knows he is in the presence of a rare specimen, the improbable forefather of the crocodile family which today stalks African waterways.
“Two hundred and fifty to 200 million years ago, these animals were the dominant land carnivores and they were found all over the world… (but) in South Africa we don’t have a record of them,” he said.
“Some of them were, I imagine, sort of like a crocodile crossed with a lion, a very large quadrupedal, legs under the body, with these massive big jaws—a very intimidating animal.
“The one here would have stood on his hind legs, it would have looked more like a theropod dinosaur, almost like a raptor.”
In recent years, South Africa has become a top destination for dinosaur hunters.
Just an hour’s drive from the Rosendal farm, Choiniere’s team has already unearthed fossils belonging to a newly discovered type of dinosaur that roamed the earth 200 million years ago.
‘Giant thunderclap at dawn’
Measuring four metres (13 feet) to the shoulder and weighing 12 tonnes—twice the weight of a modern elephant—the giant herbivore known in the local Sesotho language as Ledumahadi mafube (“a giant thunderclap at dawn”) shook up the family tree of extinct monsters.
Choiniere said it could well be “the first of the true giants”.
The beast is a forerunner of the 60-tonne sauropods familiar from Steven Spielberg’s blockbuster “Jurassic Park” series.
Experts say the southern tip of Africa is an ideal place to study the transition between the Triassic and Jurassic periods, when mass extinction events shaped the evolution of the planet.
“One of the reasons is that about 66 percent of the surface of South Africa has fossils on it—there are a lot of fossil-bearing areas,” Choiniere said.
“We don’t get much rainfall, especially in the interior, so we have areas that erode rapidly—and that erosion exposes fossils.”
“It’s phenomenal, it’s really great,” said palaeontology masters candidate Cebisa Mdekazi, a young student flying the flag for the next generation of South African palaeontologists.
“It also instills pride for your country—you have all those amazing things in our country, and we can show the world.”
Her professor, Choiniere, is far from finished with South Africa.
“Every time we go out into the field and we dig something up, there’s a pretty good chance that it might be something new,” Mdekazi said.
“It’s dinosaur country, and there’s no way we’ll ever finish the work in my lifetime.”
Note: The above post is reprinted from materials provided by AFP.
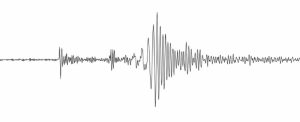
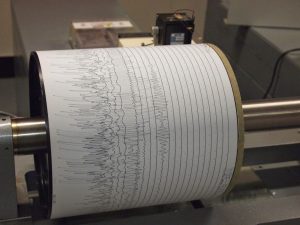
Seismogram being recorded by a seismograph at the Weston Observatory in Massachusetts, USA. Credit: Wikipedia
A Canadian fault scientists thought was inactive may actually be capable of producing large-magnitude earthquakes, a new study finds. The results suggest residents of British Columbia on Canada’s west coast have a higher risk of experiencing a damaging earthquake than previously thought, according to the study’s authors.
The Leech River fault, which extends across the southern tip of Vancouver Island, is part of the Cascadia Subduction Zone, where scientists think there is about a 40 percent chance a megathrust earthquake of 9.0 or more magnitude could occur in the next 50 years, according to the Oregon Office of Emergency Management. Scientists thought the Leech River fault itself was inactive, but the new study shows it produced three surface-rupturing earthquakes in the last 10,000 years with a magnitude greater than 6.5 and is still capable of producing large earthquakes.
The results suggest the part of the Cascadia Subduction Zone running through Canada could contain additional potentially dangerous active faults scientists aren’t even aware of yet, according to Kristin Morell, an assistant professor of Earth science at the University of California Santa Barbara and previously at the University of Victoria. Morell is lead author of the new study in Geophysical Research Letters, a journal of the American Geophysical Union.
Morell herself lived on the Leech River fault, which runs from Sombrio Beach through Royal Roads University and offshore of downtown Victoria. She published initial evidence for earthquake surface ruptures along the fault in 2017.
“Even though the fault had not shown any detectable seismic activity for thousands of years and was believed to be inactive, I had a strong suspicion that it could produce damaging surface rupturing earthquakes because it appears to connect with the Devil’s Mountain fault,” Morell said. The Devils Mountain fault has been found to be capable of causing a magnitude-7.5 earthquake off Victoria in United States Geological Survey scenarios.
In the new study, Morell and her team constructed a surface rupture history of the Leech River fault using data collected with a LiDAR (Light Detection and Ranging) system, which maps the Earth’s terrestrial surface by sending laser pulses from an aircraft, and paleoseismic trenching, which involves digging across the face of a fault to look for evidence of past surface rupture.
In addition to revealing a history of surface-rupturing earthquakes produced by the Leech River fault, the study also showed that in the past, rocks on either side of the fault moved vertically with respect to each other, even though other evidence says the fault should behave more like the San Andreas strike slip fault, where two blocks of rock slide past one another laterally.
Morell and her team said they don’t yet know why the Leech River fault moves differently from what they would have anticipated, but the new finding helps scientists understand how all the faults in the region fit together to accommodate the build-up of stresses within the earth, and how the fault will behave in the long term.
The new study also provides direct dating of earthquakes on this kind of fault, making it possible for scientists to calculate the slip rate per year, which is used in seismic hazard models for building and safety codes. These codes need to be updated to reflect how the Earth is moving near densely populated areas and how movement will affect the infrastructure and people living there, according to Morell.
Neither the rate nor the direction of movement of the fault could have been known without paleoseismic trenching and LiDAR technology. The technology is expensive, but without it it’s impossible to know what’s underneath 60 million hectares of trees, which cover close to two-thirds of the province of British Columbia, Morell said.
As a field geologist, Morell has a unique perspective on what it means to be aware of the environment, and our place in it as humans.
“I think it’s important for all of us to understand our surroundings and the landscape that we are a part of,” said Morell. “All of us as a society should have a grasp on the larger time scale of the Earth, where events leading up to the catastrophes we see in our lifetimes occur over millions of years.”
Reference:
K. D. Morell et al. Holocene surface rupture history of an active forearc fault redefines seismic hazard in southwestern British Columbia, Canada, Geophysical Research Letters (2018). DOI: 10.1029/2018GL078711
A new study by researchers at The Australian National University (ANU) could help us understand how our planet was formed.
Associate Professor Hrvoje Tkalčić and PhD Scholar Than-Son Phạm are confident they now have direct proof that Earth’s inner core is solid.
They came up with a way to detect shear waves, or “J waves” in the inner core — a type of wave which can only travel through solid objects.
“We found the inner core is indeed solid, but we also found that it’s softer than previously thought,” Associate Professor Tkalčić said.
“It turns out — if our results are correct — the inner core shares some similar elastic properties with gold and platinum. The inner core is like a time capsule, if we understand it we’ll understand how the planet was formed, and how it evolves.”
Inner core shear waves are so tiny and feeble they can’t be observed directly. In fact, detecting them has been considered the “Holy Grail” of global seismology since scientists first predicted the inner core was solid in the 1930s and 40s.
So the researchers had to come up with a creative approach.
Their so-called correlation wavefield method looks at the similarities between the signals at two receivers after a major earthquake, rather than the direct wave arrivals. A similar technique has been used by the same team to measure the thickness of the ice in Antarctica.
“We’re throwing away the first three hours of the seismogram and what we’re looking at is between three and 10 hours after a large earthquake happens. We want to get rid of the big signals,” Dr Tkalčic said.
“Using a global network of stations, we take every single receiver pair and every single large earthquake — that’s many combinations — and we measure the similarity between the seismograms. That’s called cross correlation, or the measure of similarity. From those similarities we construct a global correlogram — a sort of fingerprint of the Earth.”
The study shows these results can then be used to demonstrate the existence of J waves and infer the shear wave speed in the inner core.
While this specific information about shear waves is important, Dr Tkalčić says what this research tells us about the inner core is even more exciting.
“For instance we don’t know yet what the exact temperature of the inner core is, what the age of the inner core is, or how quickly it solidifies, but with these new advances in global seismology, we are slowly getting there.
“The understanding of the Earth’s inner core has direct consequences for the generation and maintenance of the geomagnetic field, and without that geomagnetic field there would be no life on the Earth’s surface.”
The research has been published in the journal Science.
Reference:
Hrvoje Tkalčić, Thanh-Son Phạm. Shear properties of Earth’s inner core constrained by a detection of J waves in global correlation wavefield. Science, 2018; 362 (6412): 329 DOI: 10.1126/science.aau7649
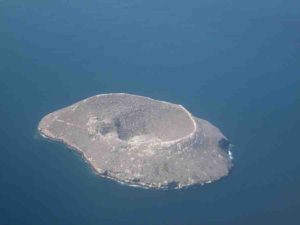
The island of Daphne to the north of Santa Cruz as seen from an aircraft approaching Baltra Airport. This island consists of a volcanic crater rising 120 meters above sea level. Credit: Yamirka Rojas-Agramonte
The Galapagos archipelago is one of the most famous groups of islands in the world. Many of the animal and plant species are unique because of the islands’ isolated location in the Pacific, 1,000 kilometers off of the coast of Ecuador. Thanks to a recently-signed special cooperation agreement, geoscientists based at Johannes Gutenberg University Mainz (JGU) in Germany will have the opportunity in coming years to research the geological development of the Galapagos Islands. An unusual mineral has recently been discovered that raises far-reaching questions about the composition of the magma source from which these oceanic islands were formed.
The idea for the collaboration came from geologist Dr. Yamirka Rojas-Agramonte, a member of the Isotope Geology group at JGU’s Institute of Geosciences. She has been studying the ages of the rocks from various islands in the archipelago since 2014 and was astounded when she suddenly came across the mineral zircon on a sandy beach. “It is extremely unusual to find zircons in basalt rock formations, such as those that predominate throughout the Galapagos,” explained Rojas-Agramonte. Zircon, a zirconium mineral, is commonly used to date ancient rocks. Zircon takes in trace amounts of uranium when it crystallizes in a newly-formed rock. Over time that uranium slowly decays to lead. The ratio between the lead formed and the uranium left can be used to determine the age of the zircon and thereby its host rock.
The zircon grains, commonly less than 0.2 millimeters in size, are first investigated under the microscope in Mainz and then, if appropriate, sent to China or Australia to be analyzed using a device called a sensitive high-resolution ion microprobe. “For the purposes of so-called SHRIMP dating, we have been collaborating for many years with a lab in Beijing, the Beijing SHRIMP Center,” said Professor Alfred Kröner of JGU, shortly before again departing with Galapagos zircon samples in his luggage.
Unexpected discovery of zircons in basalt rock
It has now been established that the zircon originates from young basalt rock, the main rock type that forms the Galapagos Islands. This rock is produced by volcanic eruptions such as those still occurring in the western sector of the archipelago. “Some of our newly discovered zircons are much older, however, than one would expect to find in young magmatic rock,” stated Kröner. How exactly these ancient zircons got into the Galapagos basalts remains a mystery. The explanation might well have wide-ranging implications for understanding the Earth’s crust-mantle system and the mantle geodynamics of the Earth. One of the current theories is that previously unexplained recycling processes might have taken place in the deep layers of the mantle.
Geoscientists at Johannes Gutenberg University Mainz and their colleagues from Spain, Australia, and Ecuador working in a wide range of different disciplines will, for the first time, be collaborating in this project in order to investigate the various hypotheses and search for further pieces of the puzzle that will help provide a solution. Over the next few years, they will be researching together on the Galapagos in a multi-disciplinary approach designed to explore a geological enigma, the significance of which could extend well beyond simply clarifying the formation of the Galapagos Islands.
Note: The above post is reprinted from materials provided by Universitaet Mainz.
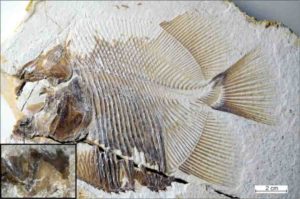
This image shows a new piranha-like fish from Jurassic seas with sharp, pointed teeth that probably fed on the fins of other fishes. From the time of dinosaurs and from the same deposits that contained Archaeopteryx, scientists recovered both this flesh-tearing fish and its scarred prey. Credit: M. Ebert and T. Nohl
Researchers reporting in Current Biology on October 18 have described a remarkable new species of fish that lived in the sea about 150 million years ago in the time of the dinosaurs. The new species of bony fish had teeth like a piranha, which the researchers suggest they used as piranhas do: to bite off chunks of flesh from other fish.
As further support for that notion, the researchers also found the victims: other fish that had apparently been nibbled on in the same limestone deposits in South Germany (the quarry of Ettling in the Solnhofen region) where this piranha-like fish was found.
“We have other fish from the same locality with chunks missing from their fins,” says David Bellwood of James Cook University, Australia. “This is an amazing parallel with modern piranhas, which feed predominantly not on flesh but the fins of other fishes. It’s a remarkably smart move as fins regrow, a neat renewable resource. Feed on a fish and it is dead; nibble its fins and you have food for the future.”
The newly described fish is part of the world famous collections in the Jura-Museum in Eichstätt. It comes from the same limestone deposits that contained Archaeopteryx.
Careful study of the fossilized specimen’s well-preserved jaws revealed long, pointed teeth on the exterior of the vomer, a bone forming the roof of the mouth, and at the front of both upper and lower jaws. Additionally, there are triangular teeth with serrated cutting edges on the prearticular bones that lie along the side of the lower jaw.
The tooth pattern and shape, jaw morphology, and mechanics suggest a mouth equipped to slice flesh or fins, the international team of researchers report. The evidence points to the possibility that the early piranha-like fish may have exploited aggressive mimicry in a striking parallel to the feeding patterns of modern piranha.
“We were stunned that this fish had piranha-like teeth,” says Martina Kölbl-Ebert of Jura-Museum Eichstätt (JME-SNSB). “It comes from a group of fishes (the pycnodontids) that are famous for their crushing teeth. It is like finding a sheep with a snarl like a wolf. But what was even more remarkable is that it was from the Jurassic. Fish as we know them, bony fishes, just did not bite flesh of other fishes at that time. Sharks have been able to bite out chunks of flesh but throughout history bony fishes have either fed on invertebrates or largely swallowed their prey whole. Biting chunks of flesh or fins was something that came much later.”
Or, so it had seemed.
“The new finding represents the earliest record of a bony fish that bit bits off other fishes, and what’s more it was doing it in the sea,” Bellwood says, noting that today’s piranhas all live in freshwater. “So when dinosaurs were walking the earth and small dinosaurs were trying to fly with the pterosaurs, fish were swimming around their feet tearing the fins or flesh off each other.”
The researchers call the new find a “staggering example of evolutionary versatility and opportunism.” With one of the world’s best known and studied fossil deposits continuing to throw up such surprises, they intend to keep up the search for even more fascinating finds.
Reference:
Martina Kölbl-Ebert, Martin Ebert, David R. Bellwood, Christian Schulbert. A Piranha-like Pycnodontiform Fish from the Late Jurassic. Current Biology, 2018; DOI: 10.1016/j.cub.2018.09.013
Note: The above post is reprinted from materials provided by Cell Press.
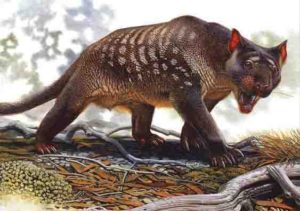
Thylacoleo carnifex was smaller than an African lioness, but with 80 per cent as powerful a bite as a large African lion. Credit: Peter Schouten
Scientists believe Thylacoleo carnifex was probably a victim of the drying out of Australia, which began about 350,000 years ago, rather than from the impact of humans.
The extinction of one of Australia’s top predators, Thylacoleo carnifex – aka the marsupial lion – was likely a result of changing weather patterns and loss of habitat rather than human impacts, new research has found.
Palaeontologists from UNSW Sydney, University of Queensland and Vanderbilt University (Tennessee) addressed the question about the demise of the marsupial lion by looking into the powerful carnivore’s chemistry.
By studying the chemical signature preserved within fossil teeth, the team was able to determine that the marsupial lion hunted primarily in forests, rather than open habitats. This is supported by features of the skeleton that indicate it was an ambush hunter, relying on catching its prey unaware rather than running them down across an open landscape.
For nearly two million years the marsupial lion was one of Australia’s top predators. The animals were sized between leopards and African lionesses but had a bite that was about 80 per cent as strong as a large lion, enabling it to crush bones with its powerful jaws.
The study led by Professor Larisa DeSantis of Vanderbilt University posited that, despite being well-adapted for consuming flesh and bone, Thylacoleo was likely the victim of the drying out of Australia, which began about 350,000 years ago.
The marsupial lions persisted for thousands of years afterwards, as more and more forests disappeared. The animals survived even past the influx of humans to the continent roughly 60,000 years ago. Ultimately, the loss of forest habitats likely led to the extinction of these predators, with the last known record sometime between approximately 35 and 45 thousand years ago.
“These data provide evidence that the marsupial lion was an ambush predator and relied on prey that occupied denser cover,” Professor DeSantis said.
“As the landscape became drier and forests less-dense, these apex predators may have become less-effective hunters and succumbed to extinction.
“The study of these ancient fossils provides us with cautionary lessons for the future: climate change can impact even the fiercest predators.”
Specialised
The marsupial lion lived alongside the Thylacine, which survived until the 20th century. The preference of the Thylacine for prey from more open habitats likely led to its survival, despite having a much weaker bite than Thylacoleo carnifex.
Professor Michael Archer, a vertebrate palaeontologist at the University of New South Wales and one of the researchers involved said that because of its extraordinarily specialised dentition, Thylacoleo carnifex has been declared to be the most specialised mammalian carnivore that ever evolved anywhere in the world.
“Marsupial lions were far more specialised than African lions. They even had a proportionately larger brain than African lions as well as large, uniquely formidable, large can-opener-like thumb claws,” Professor Archer said.
“What’s increasingly clear now is that it evidently survived the arrival of humans 60,000 years ago, but apparently not the profound impacts of a rapidly drying climate that undermined the survival of a range of megafaunal mammals in Australia.”
According to Professor Archer, Thylacoleo carnifex was the last representative of this extraordinary group of flesh-eating marsupials. He said it was the largest of many kinds documented by Dr. Anna Gillespie of UNSW, on the basis of the 25 million-year-long fossil record from the Riversleigh World Heritage Area in Queensland. This record includes pussy-cat-sized marsupial carnivores like Microleo attenboroughi and leopard-sized species like Wakaleo schouteni.
Study co-author Gilbert Price of the University of Queensland said: “When you’re big and bitey, you can eat pretty much anything you want. But our findings show that even the top predators are no match for extreme climate change.”
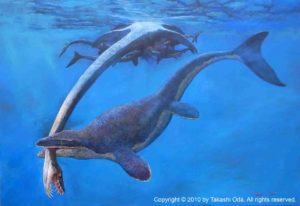
An artist’s illustration shows a mosasaur feeding on a plesiosaur called elasmosaur, although there is no fossil evidence of mosasaurs feeding on this particular species. Illustration/Takashi Oda
Did prehistoric sea creatures called mosasaurs subdue prey by ramming them with their bony snouts like killer whales do today?
It’s a theory that University of Cincinnati biology professor Takuya Konishi proposed after taking a closer look at a newborn fossil specimen for his latest research study. Konishi will present his findings at October’s Society of Vertebrate Paleontology conference in Albuquerque, New Mexico.
“Killer whales don’t hunt big prey by biting. They hunt by ramming and tearing them apart after the prey is weak,” Konishi said. “They are chasing fast-moving animals so they use inertia. If they were swimming full speed at you, they would generate a lot of force. And their snout is conspicuously protruding.”
Mosasaur, the unlikely hero of the movie “Jurassic World,” was an enormous marine reptile that lived in the time of Tyrannosaurus rex during the Cretaceous Period more than 65 million years ago. They had a similar body shape as today’s orcas, with flippers, powerful tails and sharp teeth. Some grew bigger than orcas to nearly the size of a school bus.
Like orcas, they were the apex predators of the seas. The only thing mosasaurs had to fear were bigger mosasaurs.
In a study published this month in the Journal of Vertebrate Paleontology, Konishi re-examined fossils of a newborn mosasaur he first studied in Kansas while working on his master’s degree in 2004. About 20 small fragments of skull were unearthed in 1991 by paleontologist Michael Everhart in a rock formation called the Kansas Chalk renowned for marine fossils.
Initially, the specimen was identified as a mosasaur called Platecarpus, a species commonly found in that area during the same period 85 million years ago. The family Mosasauridae features more than 30 genera of species, so identifying a particular specimen from a handful of fossil fragments can be daunting.
“A colleague of mine told me mosasaurs are boring because they all look the same. That’s sort of true,” he said. “But once you know more about them you can begin to tell them apart.”
Some mosasaurs had short, powerful jaws capable of crushing the shells of sea turtles. Others had pointy teeth that suggested they feed mostly on fish.
Konishi was inspired to take a second look after a fellow researcher demonstrated how particular bones called quadrates were not as reliable in identifying species as researchers once thought. The telltale fossils of adults of different species look very similar in juveniles.
In the many years since Konishi first examined the baby mosasaur, he has become an expert on these seagoing lizards, including the largest of them called Tylosaurus. This was the creature that inspired “Jurassic World,” a meat-eating monster capable of hunting other mosasaurs and marine reptiles.
In re-examining the skull fragments from the newborn mosasaur, Konishi found it did not resemble other specimens of Platecarpus. While Platecarpus and other mosasaurs have teeth that begin virtually at the tip of their snouts, Tylosaurus has a bony protrusion called a rostrum that extends out from its face like an orca that might have served to protect its front teeth when they slammed into prey.
“It’s a subtle feature perhaps by horned dinosaur standards, but for us it really signifies what kind of mosasaur you’re looking at,” Konishi said. “If you have this protruding snout in this part of western Kansas, you’re a Tylosaurus.”
Like many other kinds of baby animals today, the baby mosasaur had not yet developed certain telltale features found in adults, Konishi said.
“The degree of snout development was nowhere near that of an adult, which made me look elsewhere such as the braincase to call it Tylosaurus in the end. It was the ugly duckling that hadn’t yet become the graceful swan,” Konishi said.
Unlike other mosasaur species, Konishi said the tylosaur had broader and more robust facial bones connected to a sturdy cranial vault that would have provided support as a battering ram.
Konishi pulled up a dramatic photo showing a breaching orca pummeling a large dolphin with its snout. The dolphin, a species called a false killer whale, was struck so hard that its body was contorted at a painful-looking angle.
“When orcas hunt dolphins and small whales, they subdue them by ramming them. And when you look at them, you see they have a protruding snout as well,” Konishi said.
The fossils represent the youngest and smallest specimen of Tylosaurus ever found. Everhart confirmed to Konishi that the baby mosasaur was found alone with no associated fossils. Mosasaurs didn’t lay eggs but gave birth to live young. That suggests the specimen was a free-swimming newborn rather than an embryo when it died, he said.
Just how the baby mosasaur perished is a matter of speculation. Only its skull was found. Konishi said the mosasaur could have succumbed to countless mishaps from predation to accident to disease.
It took a miracle of improbability that the baby mosasaur was found in the first place, he said.
Finding any baby dinosaur, or marine reptile in this case, is extremely rare for the simple reason that baby animals often end up as someone else’s dinner. The bones of baby animals are lighter and more likely to scatter. But in this case, bones that weren’t chewed up reached the ocean floor where they were covered in sediment and remained for millions of years until the seas receded and the former ocean floor became the wheat fields and farmlands of today’s Kansas.
“And luckily an expert on mosasaurs was searching in exactly that spot and had sharp enough eyes to find it — all separated by about 85 million years,” Konishi said.
“Most fossils are fragmentary. You almost never find an entirely articulated fossil in the ground. That’s near fantasy,” Konishi said. “Luckily, the remaining bones were buried and became fossilized.”
Konishi’s theory strikes a chord with orca experts such as Ken Balcomb, senior scientist with the nonprofit Center for Whale Research outside Seattle, Washington. Balcomb has been studying orcas for 43 years. He has seen firsthand the myriad clever methods they employ to hunt different prey.
“They pummel their prey quite a bit. They will throw their body against a gray whale. They’ll ram great white sharks, too,” Balcomb said.
But Balcomb said they’re choosy about what and how they attack, often using their flukes or whole body rather than their heads. They even distinguish between different types of prey.
“They know which kinds of seals will fight back,” Balcomb said. “So they’re cautious. They don’t want to get hurt.”
Contributing to Konishi’s study were Paulina Jiménez-Huidobro and Michael Caldwell, both of the University of Alberta. The study was funded in part by the Natural Sciences and Engineering Research Council of Canada.
Konishi said this better understanding of the development of baby mosasaurs could help scientists learn more about fossils of other baby dinosaurs and marine reptiles that look markedly different from their parents.
“We now have a bit better insight into how this trademark feature evolved in this lineage,” he said. “It’s a good starting point for more studies in the future.”
Reference:
Takuya Konishi, Paulina Jiménez-Huidobro, Michael W. Caldwell. The Smallest-Known Neonate Individual of Tylosaurus (Mosasauridae, Tylosaurinae) Sheds New Light on the Tylosaurine Rostrum and Heterochrony. Journal of Vertebrate Paleontology, 2018; 1 DOI: 10.1080/02724634.2018.1510835
An underwater picture of the modern demosponge species Rhabdastrella globostellata, which make the same 26-mes steroids that the researchers found in ancient rocks. Credit: Paco Cárdenas
Researchers at the University of California, Riverside, have found the oldest clue yet of animal life, dating back at least 100 million years before the famous Cambrian explosion of animal fossils.
The study, led by Gordon Love, a professor in UCR’s Department of Earth Sciences, was published today in Nature Ecology & Evolution. The first author is Alex Zumberge, a doctoral student working in Love’s research group.
Rather than searching for conventional body fossils, the researchers have been tracking molecular signs of animal life, called biomarkers, as far back as 660-635 million years ago during the Neoproterozoic Era. In ancient rocks and oils from Oman, Siberia, and India, they found a steroid compound produced only by sponges, which are among the earliest forms of animal life.
“Molecular fossils are important for tracking early animals since the first sponges were probably very small, did not contain a skeleton, and did not leave a well-preserved or easily recognizable body fossil record,” Zumberge said. “We have been looking for distinctive and stable biomarkers that indicate the existence of sponges and other early animals, rather than single-celled organisms that dominated the earth for billions of years before the dawn of complex, multicellular life.”
The biomarker they identified, a steroid compound named 26-methylstigmastane (26-mes), has a unique structure that is currently only known to be synthesized by certain species of modern sponges called demosponges.
“This steroid biomarker is the first evidence that demosponges, and hence multicellular animals, were thriving in ancient seas at least as far back as 635 million years ago,” Zumberge said.
The work builds from a 2009 study by Love’s team, which reported the first compelling biomarker evidence for Neoproterozoic animals from a different steroid biomarker, called 24-isopropylcholestane (24-ipc), from rocks in South Oman. However, the 24-ipc biomarker evidence proved controversial since 24-ipc steroids are not exclusively made by demosponges and can be found in a few modern algae. The finding of the additional and novel 26-mes ancient biomarker, which is unique to demosponges, adds extra confidence that both compounds are fossil biomolecules produced by demosponges on an ancient seafloor.
The study also provides important new constraints on the groups of modern demosponges capable of producing unique steroid structures, which leave a distinctive biomarker record. The researchers found that within modern demosponges, certain taxonomic groups preferentially produce 26-mes steroids while others produce 24-ipc steroids.
“The combined Neoproterozoic demosponge sterane record, showing 24-ipc and 26-mes steranes co-occurring in ancient rocks, is unlikely attributed to an isolated branch or extinct stem-group of demosponges,” Love said. “Rather, the ability to make such unconventional steroids likely arose deep within the demosponge phylogenetic tree but now encompasses a wide coverage of modern demosponge groups.”
Reference:
J. Alex Zumberge, Gordon D. Love, Paco Cárdenas, Erik A. Sperling, Sunithi Gunasekera, Megan Rohrssen, Emmanuelle Grosjean, John P. Grotzinger, Roger E. Summons. Demosponge steroid biomarker 26-methylstigmastane provides evidence for Neoproterozoic animals. Nature Ecology & Evolution, 2018; DOI: 10.1038/s41559-018-0676-2
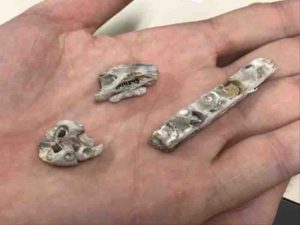
This photo shows from left to right a partial snout with teeth and tooth bases, partial braincase, and a section of upper jaw with tooth bases. Credit: Ms. Christina Byrd, Paleontology Collections Manager at the Sternberg Museum of Natural History in Hays, Kansas
The smallest Tylosaurus mosasaur fossil ever found has been revealed in a new study in the Journal of Vertebrate Paleontology and surprisingly it lacks a trademark feature of the species.
The fossil, likely to be that of a newborn, does not have the recognizable long snout typically seen in the species. The lack of this snout initially perplexed researchers, who struggled to identify which group of mosasaurs it belonged to.
After examining and comparing the fossil to young specimens of closely-related species, such as T. nepaeolicus and T. proriger which already had identifiable noses, researchers finally deemed it to be a young Tylosaurus.
Lead author Professor Takuya Konishi, of the Department of Biological Sciences at the University of Cincinnati said, “Having looked at the specimen in 2004 for the first time myself, it too took me nearly 10 years to think out of that box and realize what it really was — a baby Tylosaurus yet to develop such a snout.
For those 10 years or so, I had believed too that this was a neonate of Platecarpus, a medium-sized (5-6m) and short-snouted mosasaur, not Tylosaurus, a giant (up to 13m) mosasaur with a significantly protruding snout.”
The lack of snout in the baby specimen found suggests to researchers that the development of this feature happens extremely quickly, between birth and juvenile stage — something that previous studies on the species had failed to notice.
Konishi further commented, “Yet again, we were challenged to fill our knowledge gap by testing our preconceived notion, which in this case was that Tylosaurus must have a pointy snout, a so-called ‘common knowledge.’
As individual development and evolutionary history are generally linked, the new revelation hints at the possibility that Tylosaurus adults from much older rock units may have been similarly short-snouted, something we can test with future discoveries.”
The fragments found include a partial snout with teeth and tooth bases, partial braincase, and a section of upper jaw with tooth bases. From this, they can estimate the entire baby skull to have been around 30cm (1ft) in total.
Tylosaurus belong to one of the largest-known groups of mosasaurs, up to 13m long, the front 1.8 m of that body being its head. The baby, therefore, was about 1/6 the size of such an adult.
Michael J. Everhart, a Kansas native and a special curator of paleontology at the Sternberg Museum of Natural History, Hays, Kansas, found the tiny specimens in 1991 in the lower Santonian portion of the Niobrara Chalk, in Kansas, which are now housed at the museum. The paper was co-authored by Paulina Jiménez-Huidobro and Michael W. Caldwell of the University of Alberta, Canada.
Reference:
Takuya Konishi, Paulina Jiménez-Huidobro, Michael W. Caldwell. The Smallest-Known Neonate Individual of Tylosaurus (Mosasauridae, Tylosaurinae) Sheds New Light on the Tylosaurine Rostrum and Heterochrony. Journal of Vertebrate Paleontology, 2018; 1 DOI: 10.1080/02724634.2018.1510835