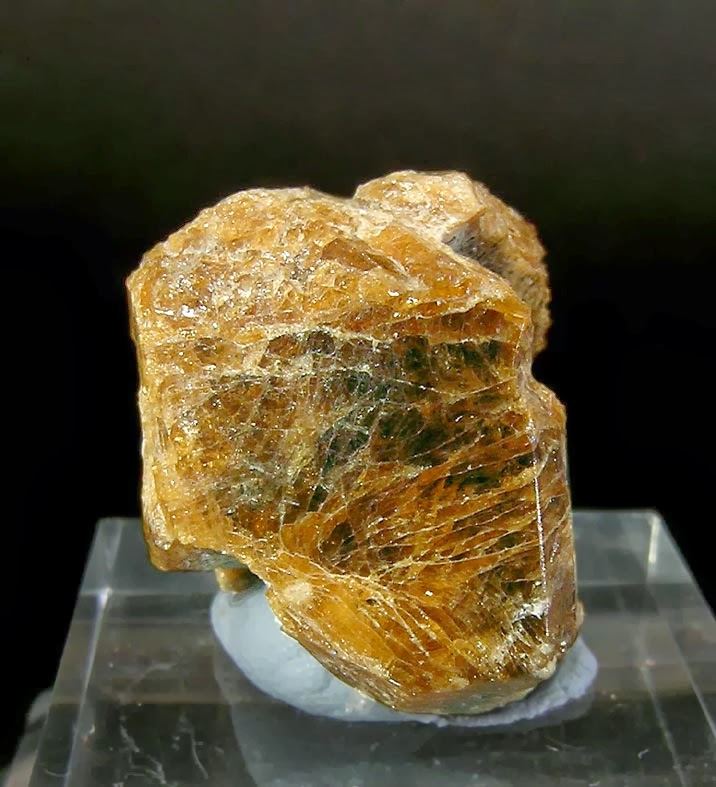
Chemical Formula: Na(Mg3)Al6(Si6O18)(BO3)3(OH)3(OH) Locality: Drava River, Austria. Name Origin: Named for the locality.
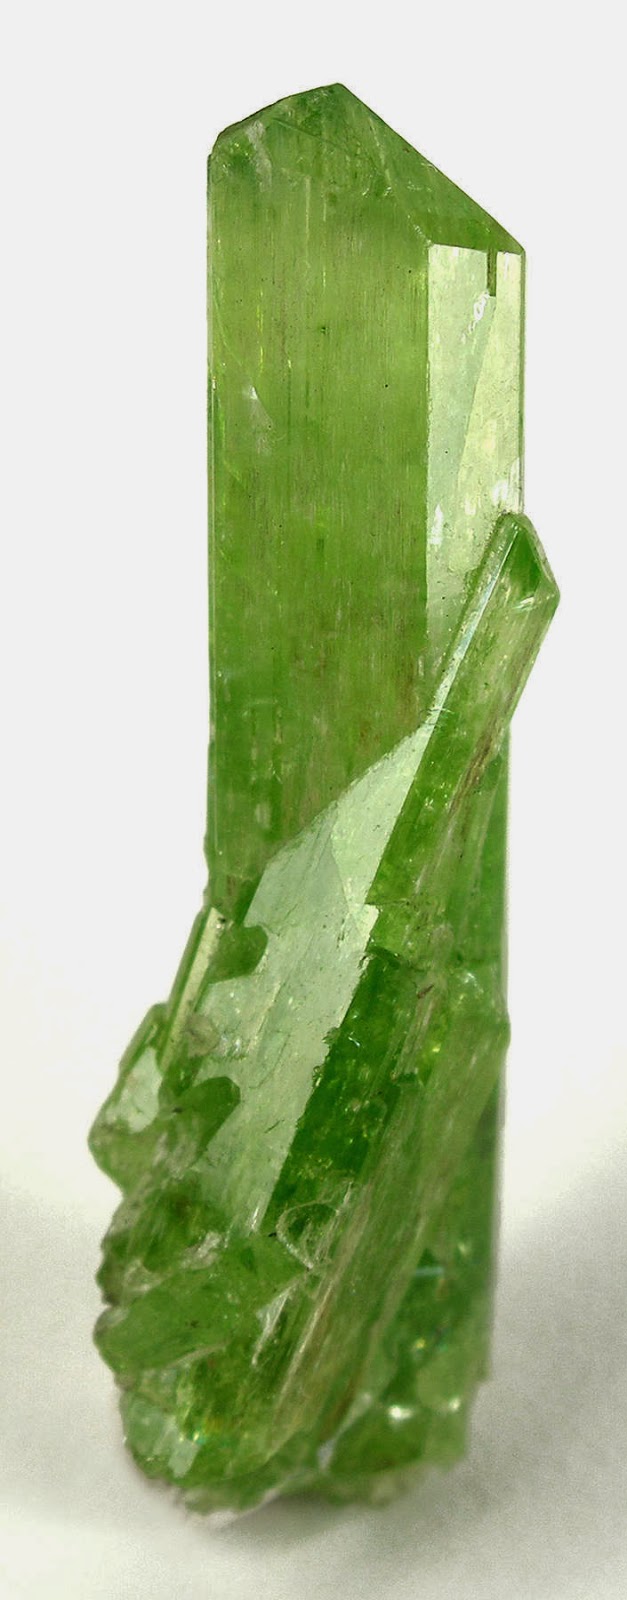
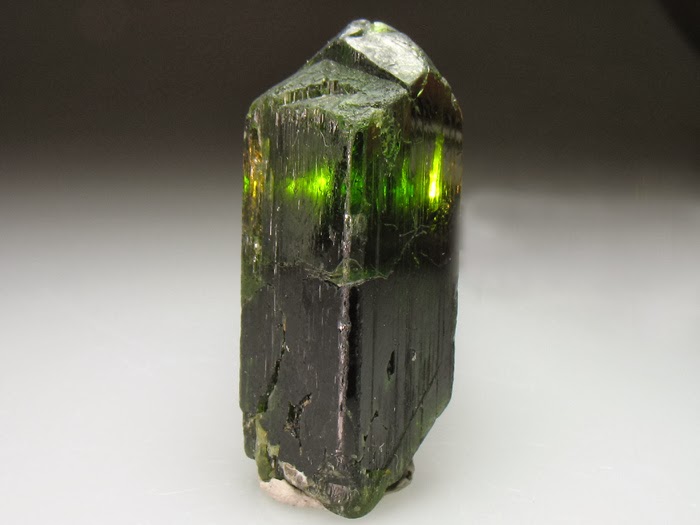
Dravite is best known as the “Brown Tourmaline”. It is a relatively common form of Tourmaline, and often forms in crude uninteresting formation. However, crystals from certain localities can be highly lustrous and beautifully crystallized. Dravite is named after Dravograd, in Slovenia, the area where Dravite was first described.
In a few rare instances, Dravite may be partially replaced or intergrown together with Schorl, with a specimen being part Dravite and part Schorl. Dravite is also very similar to Uvite Tourmaline, and often occurs together with Uvite in Uvite deposits. It can sometimes be very difficult to make an exact distinction between the Dravite and the Uvite.
Physical Properties
Cleavage: Indistinct Color: Black, Green, Red, Blue, White. Density: 2.98 – 3.2, Average = 3.09 Diaphaneity: Transparent to translucent to opaque Fracture: Sub Conchoidal – Fractures developed in brittle materials characterized by semi-curving surfaces. Hardness: 7-7.5 – Quartz-Garnet Luminescence: Fluorescent, Short UV=yellow to orange. Luster: Vitreous – Resinous Streak: colorless
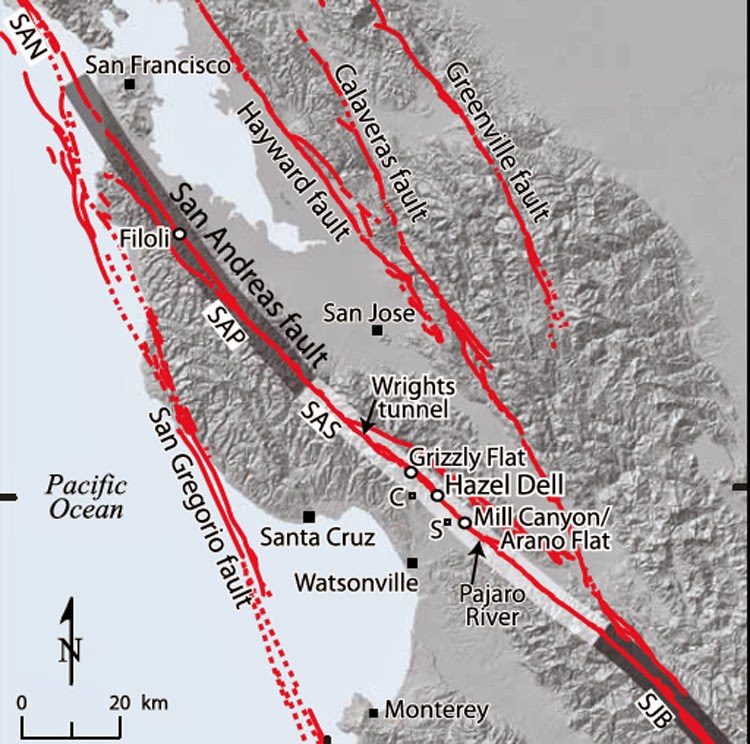
The study was the first to fully map the active fault trace in the Santa Cruz Mountains using a combination of on-the-ground observations and airborne Light Detection and Ranging (LiDAR), a remote sensing technology. The Santa Cruz Mountains run for about 39 miles from south of San Francisco to near San Juan Batista. Hazel Dell is east of Santa Cruz and north of Watsonville. Credit: Image courtesy of University of Oregon
Research led by a University of Oregon doctoral student in California’s Santa Cruz Mountains has uncovered geologic evidence that supports historical narratives for two earthquakes in the 68 years prior to San Francisco’s devastating 1906 disaster.
The evidence places the two earthquakes, in 1838 and 1890, on the San Andreas Fault, as theorized by many researchers based on written accounts about damage to Spanish-built missions in the Monterey and San Francisco bay areas. These two quakes, as in 1906, were surface-rupturing events, the researchers concluded.
Continuing work, says San Francisco Bay-area native Ashley R. Streig, will dig deeper into the region’s geological record — layers of sediment along the fault — to determine if the ensuing seismically quiet years make up a normal pattern — or not — of quake frequency along the fault.
Streig is lead author of the study, published in this month’s issue of the Bulletin of the Seismological Society of America. She collaborated on the project with her doctoral adviser Ray Weldon, professor of the UO’s Department of Geological Sciences, and Timothy E. Dawson of the Menlo Park office of the California Geological Survey.
The study was the first to fully map the active fault trace in the Santa Cruz Mountains using a combination of on-the-ground observations and airborne Light Detection and Ranging (LiDAR), a remote sensing technology. The Santa Cruz Mountains run for about 39 miles from south of San Francisco to near San Juan Batista. Hazel Dell is east of Santa Cruz and north of Watsonville.
“We found the first geologic evidence of surface rupture by what looks like the 1838 and 1890 earthquakes, as well as 1906,” said Streig, whose introduction to major earthquakes came at age 11 during the 1989 Loma Prieta Earthquake on a deep sub-fault of the San Andreas Fault zone. That quake, which disrupted baseball’s World Series, forced her family to camp outside their home.
Unlike the 1906 quake that ruptured 470 kilometers (296 miles) of the fault, the 1838 and 1890 quakes ruptured shorter portions of the fault, possibly limited to the Santa Cruz Mountains. “This is the first time we have had good, clear geologic evidence of these historic 19th century earthquakes,” she said. “It’s important because it tells us that we had three surface ruptures, really closely spaced in time that all had fairly large displacements of at least half a meter and probably larger.”
The team identified ax-cut wood chips, tree stumps and charcoal fragments from early logging efforts in unexpectedly deep layers of sediment, 1.5 meters (five feet) below the ground, and document evidence of three earthquakes since logging occurred at the site. The logging story emerged from 16 trenches dug in 2008, 2010 and 2011 along the fault at the Hazel Dell site in the mountain range.
High-resolution radiocarbon dating of tree-rings from the wood chips and charcoal confirm these are post European deposits, and the geologic earthquake evidence coincides with written accounts describing local earthquake damage, including damage to Spanish missions in 1838, and in a USGS publication of earthquakes in 1890 catalogued by an astronomer from Lick Observatory.
Additionally, in 1906 individuals living near the Hazel Dell site reported to geologists that cracks from the 1906 earthquake had occurred just where they had 16 years earlier, in 1890, which, Streig and colleagues say, was probably centered in the Hazel Dell region. Another displacement of sediment at the Hazel Dell site matched the timeline of the 1906 quake.
The project also allowed the team to conclude that another historically reported quake, in 1865, was not surface rupturing, but it was probably deep and, like the 1989 event, occurred on a sub zone of the San Andreas Fault. Conventional thinking, Streig said, has suggested that the San Andreas Fault always ruptures in a long-reaching fashion similar to the 1906 earthquake. This study, however, points to more regionally confined ruptures as well.
“This all tells us that there are more frequent surface-rupturing earthquakes on this section of the fault than have been previously identified, certainly in the historic period,” Streig said. “This becomes important to earthquake models because it is saying something about the connectivity of all these fault sections — and how they might link up.”
The frequency of the quakes in the Santa Cruz Mountains, she added, must have been a terrifying experience for settlers during the 68-year period.
“This study is the first to show three historic ruptures on the San Andreas Fault outside the special case of Parkfield,” Weldon said, referring to a region in mountains to the south of the Santa Cruz range where six magnitude 6-plus earthquakes occurred between 1857 and 1966. “The earthquakes of 1838 and 1890 were known to be somewhere nearby from shaking, but now we know the San Andreas Fault ruptured three times on the same piece of the fault in less than 100 years.”
More broadly, Weldon said, having multiple paleoseismic sites close together on a major fault, geologists now realize that interpretations gleaned from single-site evidence probably aren’t reliable. “We need to spend more time reproducing or confirming results rather than rushing to the next fault if we are going to get it right,” he said. “Ashley’s combination of historical research, C-14 dating, tree rings, pollen and stratigraphic correlation between sites has allowed us to credibly argue for precision that allows identification of the 1838 and 1890 earthquakes.”
“Researchers at the University of Oregon are using tools and technologies to further our understanding of the dynamic forces that continue to shape our planet and impact its people,” said Kimberly Andrews Espy, vice president for research and innovation and dean of the UO Graduate School. “This research furthers our understanding of the connectivity of the various sections of California’s San Andreas Fault and has the potential to save lives by leading to more accurate earthquake modeling.”
The U.S. Geological Survey funded the research through grants 08-HQ-GR-0071, 08-HQ-GR-0072, G10AP00064, G10AP0065 and G11AP20123. A Geological Society of America Student Research Grant to Streig funded the age-dating of the team’s evidence at the Lawrence Livermore National Laboratory’s Center for Accelerator Mass Spectrometry.
The above story is based on materials provided by University of Oregon.
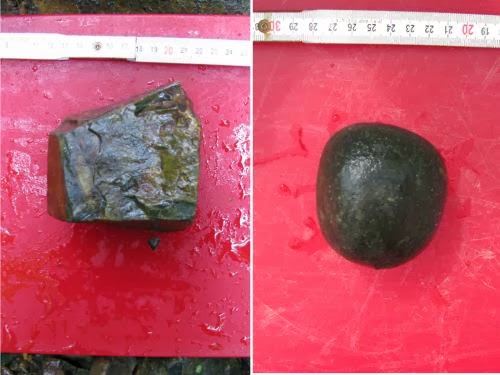
A new study by the University of Pennsylvania’s Douglas Jerolmack, working with mathematicians at Budapest University of Technology and Economics, has found that rocks traveling down a riverbed follow a distinct pattern, first becoming rounder, and then smaller. Credit: University of Pennsylvania
For centuries, geologists have recognized that the rocks that line riverbeds tend to be smaller and rounder further downstream. But these experts have not agreed on the reason these patterns exist. Abrasion causes rocks to grind down and become rounder as they are transported down the river. Does this grinding reduce the size of rocks significantly, or is it that smaller rocks are simply more easily transported downstream?
A new study by the University of Pennsylvania’s Douglas Jerolmack, working with mathematicians at Budapest University of Technology and Economics, has arrived at a resolution to this puzzle. Contrary to what many geologists have believed, the team’s model suggests that abrasion plays a key role in upholding these patterns, but it does so in a distinctive, two-phase process. First, abrasion makes a rock round. Then, only when the rock is smooth, does abrasion act to make it smaller in diameter.
“It was a rather remarkable and simple result that helps to solve an outstanding problem in geology,” Jerolmack said.
Not only does the model help explain the process of erosion and sediment travel in rivers, but it could also help geologists answer questions about a river’s history, such as how long it has flowed. Such information is particularly interesting in light of the rounded pebbles recently discovered on Mars—seemingly evidence of a lengthy history of flowing rivers on its surface.
Jerolmack, an associate professor in Penn’s Department of Earth and Environmental Science, lent a geologist’s perspective to the Hungarian research team, comprised of Gábor Domokos, András Sipos and Ákos Török.
Their work is to be published in the journal PLOS ONE.
Prior to this study, most geologists did not believe that abrasion could be the dominant force responsible for the gradient of rock size in rivers because experimental evidence pointed to it being too slow a process to explain observed patterns. Instead, they pointed to size-selective transport as the explanation for the pattern: small rocks being more easily transported downstream.
The Budapest University researchers, however, approached the question of how rocks become round purely as a geometrical problem, not a geological one. The mathematical model they conceived formalizes the notion, which may seem intuitive, that sharp corners and protruding parts of a rock will wear down faster than parts that protrude less.
The equation they conceived relates the erosion rate of any surface of a pebble with the curvature of the pebble. According to their model, areas of high curvature erode quickly, and areas of zero or negative curvature do not erode at all.
The math that undergirds their explanation for how pebbles become smooth is similar to the equation that explains how heat flows in a given space; both are problems of diffusion.
“Our paper explains the geometrical evolution of pebble shapes,” said Domokos, “and associated geological observations, based on an analogy with an equation that describes the variation of temperature in space and time. In our analogy, temperature corresponds to geometric (or Gaussian) curvature. The mathematical root of our paper is the pioneering work of mathematician Richard Hamilton on the Gauss curvature flow.”
From this geometric model comes the novel prediction that abrasion of rocks should occur in two phases. In the first phase, protruding areas are worn down without any change in the diameter of the pebble. In the second phase, the pebble begins to shrink.
“If you start out with a rock shaped like a cube, for example,” Jerolmack said, “and start banging it into a wall, the model predicts that under almost any scenario that the rock will erode to a sphere with a diameter exactly as long as one of the cube’s sides. Only once it becomes a perfect sphere will it then begin to reduce in diameter.”
The research team also completed an experiment to confirm their model, taking a cube of sandstone and placing it in a tumbler and monitoring its shape as it eroded.
“The shape evolved exactly as the model predicted,” Jerolmack said.
The finding has a number of implications for geologic questions. One is that rocks can lose a significant amount of their mass before their diameter starts to shrink. Yet geologists typically measure river rock size by diameter, not weight.
“If all we’re doing in the field is measuring diameter, then we’re missing the whole part of shape evolution that can occur without any change in diameter,” Jerolmack said. “We’re underestimating the importance of abrasion because we’re not measuring enough about the pebble.”
As a result, Jerolmack noted that geologists may also have been underestimating how much sand and silt arises because of abrasion, the material ground off of the rocks that travel downstream.
“The fine particles that are produced by abrasion are the things that go into producing the floodplain downstream in the river; it’s the sand that gets deposited on the beach; it’s the mud that gets deposited in the estuary,” he said.
With this new understanding of how the process of abrasion proceeds, researchers can address other questions about river flow—both here on Earth and elsewhere, such as on Mars, where NASA’s rover Curiosity recently discovered rounded pebbles indicative of ancient river flow.
“If you pluck a pebble out of a riverbed,” Jerolmack said, “a question you might like to answer, how far has this pebble traveled? And how long has it taken to reach this place?”
Such questions are among those that Jerolmack and colleagues are now asking.
“If we know something about a rock’s initial shape, we can model how it went from its initial shape to the current one,” he said. “On Mars, we’ve seen evidence of river channels, but what everyone wants to know is, was Mars warm and wet for a long time, such that you could have had life? If I can say how long it took for this pebble to grind down to this shape, I can put a constraint on how long Mars needed to have stable liquid water on the surface.”
Note : The above story is based on materials provided by University of Pennsylvania
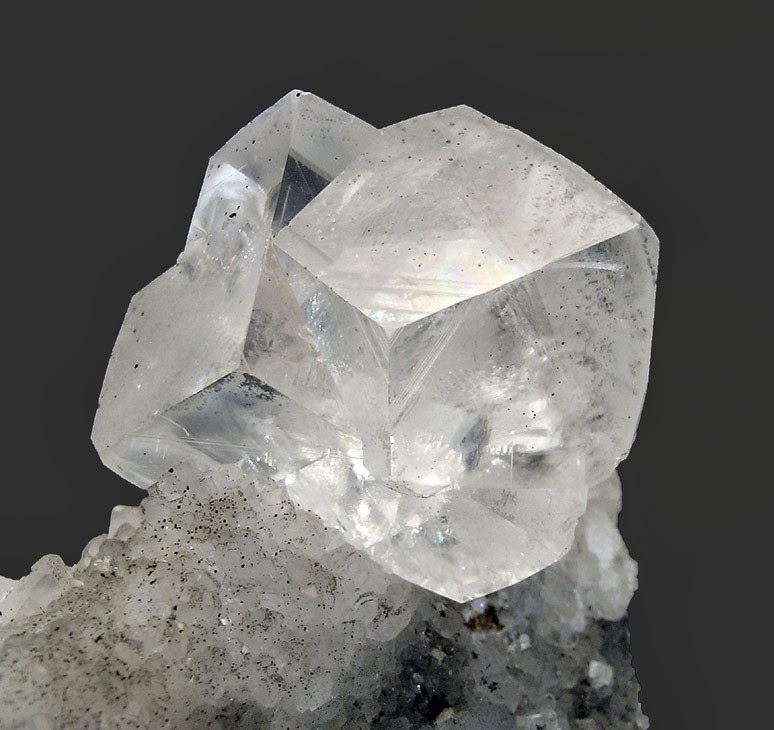
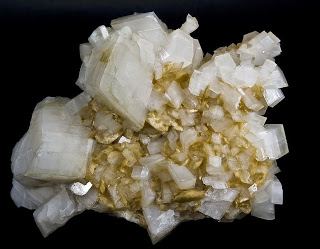
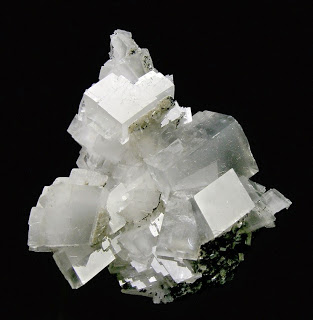
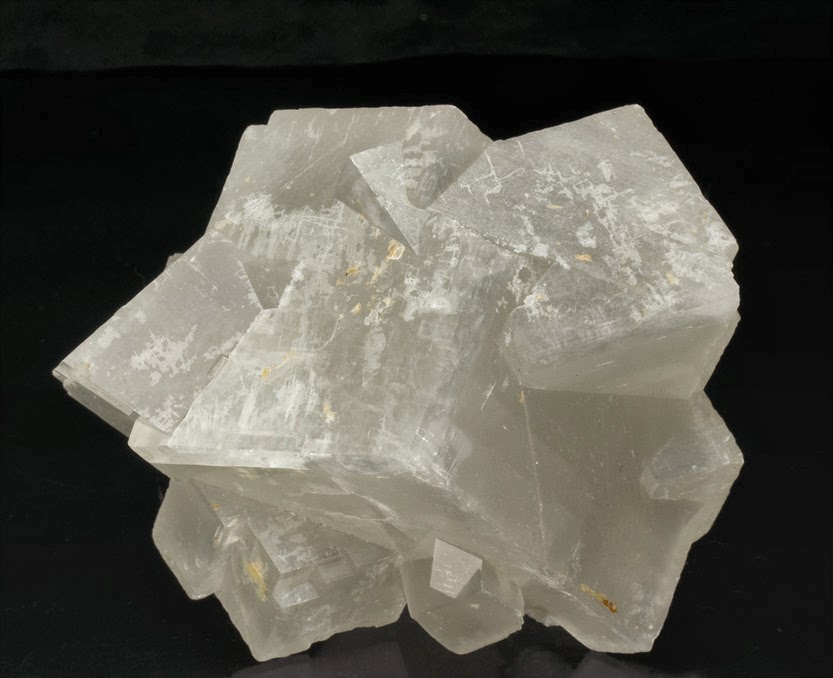
Chemical Formula: CaMg(CO3)2 Name Origin: Named after the French mineralogist and geologist, Deodat Guy Tancrede Gratet de Dolomieu (1750-1801).
Dolomite is an anhydrous carbonate mineral composed of calcium magnesium carbonate, ideally CaMg(CO3)2. The word dolomite is also used to describe the sedimentary carbonate rock, which is composed predominantly of the mineral dolomite (also known as dolostone).
History
Most probably the mineral dolomite was first described by Carl Linnaeus in 1768. In 1778, it was described by the Austrian naturalist Belsazar Hacquet as the “stinking stone” (German: Stinkstein, Latin: lapis suillus). In 1791, it was described as a rock by the French naturalist and geologist, Déodat Gratet de Dolomieu (1750–1801) first from buildings in the old city of Rome and later as samples collected in what is now known as the Dolomite Alps of northern Italy. The mineral was given its name in March 1792 by Nicolas de Saussure, naming it after De Dolomieu. Hacquet and Dolomieu met in Laibach (Ljubljana) in 1784, which may have contributed to De Dolomieu’s work.
Formation
Recent research has found modern dolomite formation under anaerobic conditions in supersaturated saline lagoons along the Rio de Janeiro coast of Brazil, namely, Lagoa Vermelha and Brejo do Espinho. It is often thought that dolomite will develop only with the help of sulfate-reducing bacteria (e.g. Desulfovibrio brasiliensis). However, promising new research on low-temperature dolomite formation indicates that low-temperature dolomite may occur in natural environments rich in organic matter and microbial cell surfaces. This occurs as a result of magnesium complexation by carboxyl groups associated with organic matter.
Vast deposits of dolomite are present in the geological record, but the mineral is relatively rare in modern environments. Reproducible, inorganic low-temperature syntheses of dolomite and magnesite were published for the first time in 1999. Those laboratory experiments showed how the initial precipitation of a metastable “precursor” (such as magnesium calcite) will change gradually into more and more of the stable phase (such as dolomite or magnesite) during periodical intervals of dissolution and re-precipitation. The general principle governing the course of this irreversible geochemical reaction has been coined “breaking Ostwald’s step rule”.
There is some evidence for a biogenic occurrence of dolomite. One example is that of the formation of dolomite in the urinary bladder of a Dalmatian dog, possibly as the result of an illness or infection
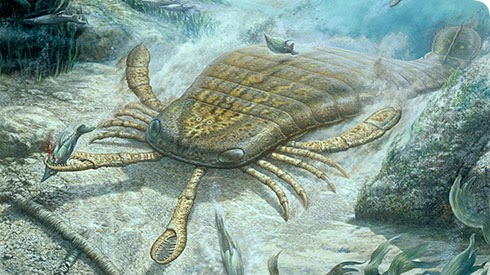
The largest mass extinction in the history of animal life occurred some 252 million years ago, wiping out more than 96 percent of marine species and 70 percent of life on land—including the largest insects known to have inhabited the Earth. Multiple theories have aimed to explain the cause of what’s now known as the end-Permian extinction, including an asteroid impact, massive volcanic eruptions, or a cataclysmic cascade of environmental events. But pinpointing the cause of the extinction requires better measurements of how long the extinction period lasted.
Now researchers at MIT have determined that the end-Permian extinction occurred over 60,000 years, give or take 48,000 years—practically instantaneous, from a geologic perspective. The new timescale is based on more precise dating techniques, and indicates that the most severe extinction in history may have happened more than 10 times faster than scientists had previously thought.
“We’ve got the extinction nailed in absolute time and duration,” says Sam Bowring, the Robert R. Shrock Professor of Earth and Planetary Sciences at MIT. “How do you kill 96 percent of everything that lived in the oceans in tens of thousands of years? It could be that an exceptional extinction requires an exceptional explanation.”
In addition to establishing the extinction’s duration, Bowring, graduate student Seth Burgess, and a colleague from the Nanjing Institute of Geology and Paleontology also found that, 10,000 years before the die-off, the oceans experienced a pulse of light carbon, which likely reflects a massive addition of carbon dioxide to the atmosphere. This dramatic change may have led to widespread ocean acidification and increased sea temperatures by 10 degrees Celsius or more, killing the majority of sea life.
But what originally triggered the spike in carbon dioxide? The leading theory among geologists and paleontologists has to do with widespread, long-lasting volcanic eruptions from the Siberian Traps, a region of Russia whose steplike hills are a result of repeated eruptions of magma. To determine whether eruptions from the Siberian Traps triggered a massive increase in oceanic carbon dioxide, Burgess and Bowring are using similar dating techniques to establish a timescale for the Permian period’s volcanic eruptions that are estimated to have covered over five million cubic kilometers.
“It is clear that whatever triggered extinction must have acted very quickly,” says Burgess, the lead author of a paper that reports the results in this week’s Proceedings of the National Academy of Sciences, “fast enough to destabilize the biosphere before the majority of plant and animal life had time to adapt in an effort to survive.”
Pinning dates on an extinction
In 2006, Bowring and his students made a trip to Meishan, China, a region whose rock formations bear evidence of the end-Permian extinction; geochronologists and paleontologists have flocked to the area to look for clues in its layers of sedimentary rock. In particular, scientists have focused on a section of rock that is thought to delineate the end of the Permian, and the beginning of the Triassic, based on evidence such as the number of fossils found in surrounding rock layers.
Bowring sampled rocks from this area, as well as from nearby alternating layers of volcanic ash beds and fossil-bearing rocks. After analyzing the rocks in the lab, his team reported in 2011 that the end-Permian likely lasted less than 200,000 years. However, this timeframe still wasn’t precise enough to draw any conclusions about what caused the extinction.
Now, the team has revised its estimates using more accurate dating techniques based on a better understanding of uncertainties in timescale measurements.
With this knowledge, Bowring and his colleagues reanalyzed rock samples collected from five volcanic ash beds at the Permian-Triassic boundary. The researchers pulverized rocks and separated out tiny zircon crystals containing a mix of uranium and lead. They then isolated uranium from lead, and measured the ratios of both isotopes to determine the age of each rock sample.
From their measurements, the researchers determined a much more precise “age model” for the end-Permian extinction, which now appears to have lasted about 60,000 years—with an uncertainty of 48,000 years—and was immediately preceded by a sharp increase in carbon dioxide in the oceans.
‘Spiraling toward the truth’
The new timeline adds weight to the theory that the extinction was triggered by massive volcanic eruptions from the Siberian Traps that released volatile chemicals, including carbon dioxide, into the atmosphere and oceans. With such a short extinction timeline, Bowring says it is possible that a single, catastrophic pulse of magmatic activity triggered an almost instantaneous collapse of all global ecosystems.
To confirm whether the Siberian Traps are indeed the extinction’s smoking gun, Burgess and Bowring plan to determine an equally precise timeline for the Siberian Traps eruptions, and will compare it to the new extinction timeline to see where the two events overlap. The researchers will investigate additional areas in China to see if the duration of the extinction can be even more precisely determined.
“We’ve refined our approach, and now we have higher accuracy and precision,” Bowring says. “You can think of it as slowly spiraling in toward the truth.”
Note : The above story is based on materials provided by Massachusetts Institute of Technology
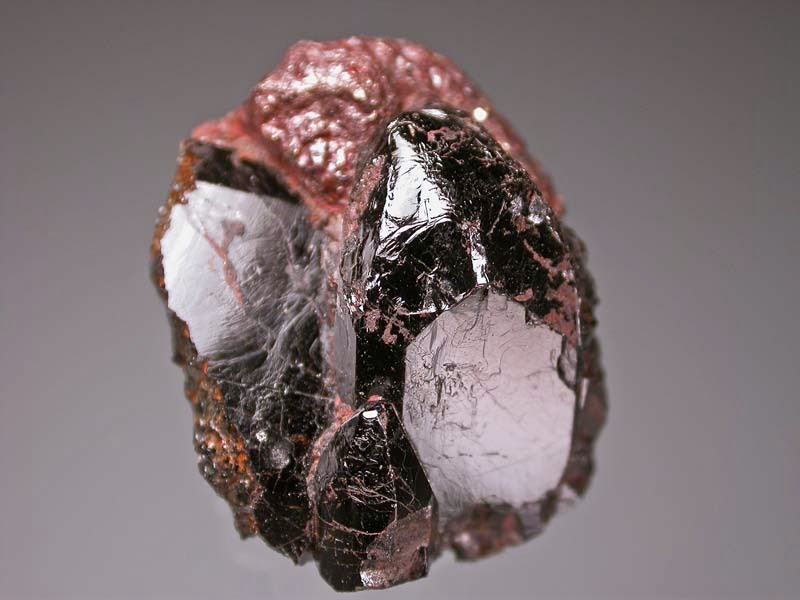
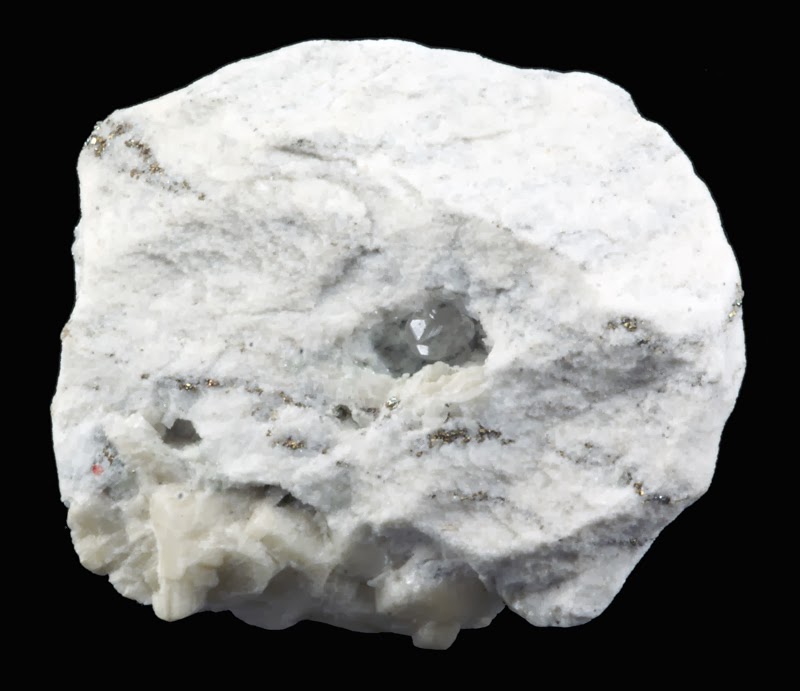
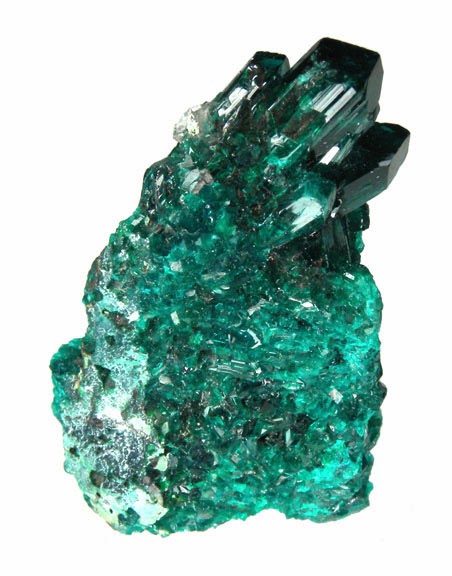
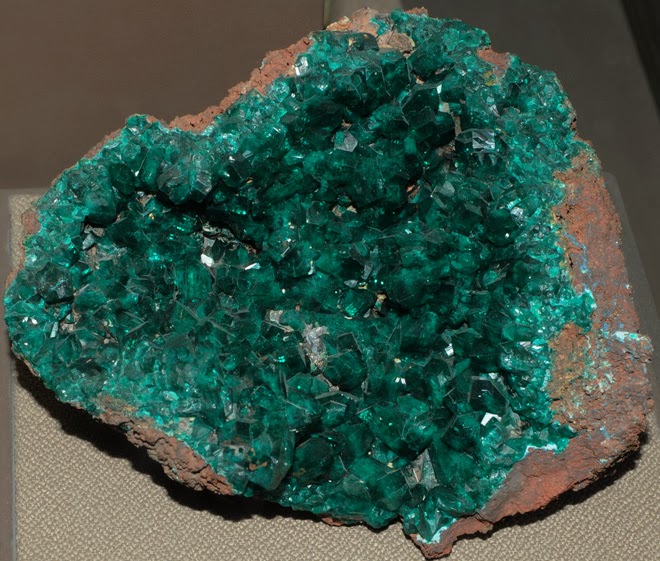
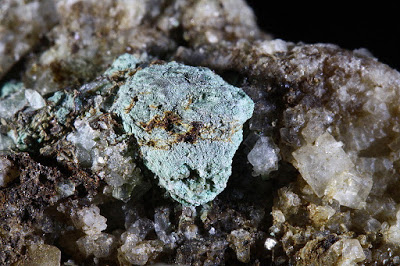
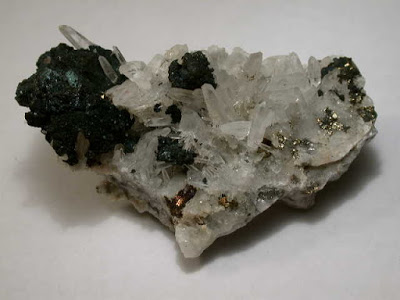
Chemical Formula: CuSiO3 · H2O Locality: Tsumeb and Cochab, Namibia. Altyn Tube, Russia. Name Origin: From the Greek, dia – “through” and optomai – “vision.”
Dioptase is an intense emerald-green to bluish-green copper cyclosilicate mineral. It is transparent to translucent. Its luster is vitreous to sub-adamantine. Its formula is CuSiO3 · H2O (also reported as CuSiO2(OH)2). It has a hardness of 5, the same as tooth enamel. Its specific gravity is 3.28–3.35, and it has two perfect and one very good cleavage directions. Additionally, dioptase is very fragile and specimens must be handled with great care. It is a trigonal mineral, forming 6-sided crystals that are terminated by rhombohedra.
History
Dioptase was used to highlight the edges of the eyes on the three Pre-Pottery Neolithic B lime plaster statues discovered at ‘Ain Ghazal known as Micah, Heifa and Noah. These sculptures date back to about 7200BC.
Late in the 18th century, copper miners at the Altyn-Tyube (Altyn-Tube) mine, Karagandy Province, Kazakhstan thought they found the emerald deposit of their dreams. They found fantastic cavities in quartz veins in a limestone, filled with thousands of lustrous emerald-green transparent crystals. The crystals were dispatched to Moscow, Russia for analysis. However the mineral’s inferior hardness of 5 compared with emerald’s greater hardness of 8 easily distinguished it. Later Fr. René Just Haüy (the famed French mineralogist) in 1797 determined that the enigmatic Altyn-Tyube mineral was new to science and named it dioptase (Greek, dia, “through” and optos, “visible”), alluding to the mineral’s two cleavage directions that are visible inside unbroken crystals.
Physical Properties
Cleavage: {1011} Good Color: Dark blue green, Emerald green, Turquoise. Density: 3.28 – 3.35, Average = 3.31 Diaphaneity: Transparent to translucent Fracture: Conchoidal – Fractures developed in brittle materials characterized by smoothly curving surfaces, (e.g. quartz). Hardness: 5 – Apatite Luminescence: Non-fluorescent. Luster: Vitreous (Glassy) Magnetism: Nonmagnetic Streak: green
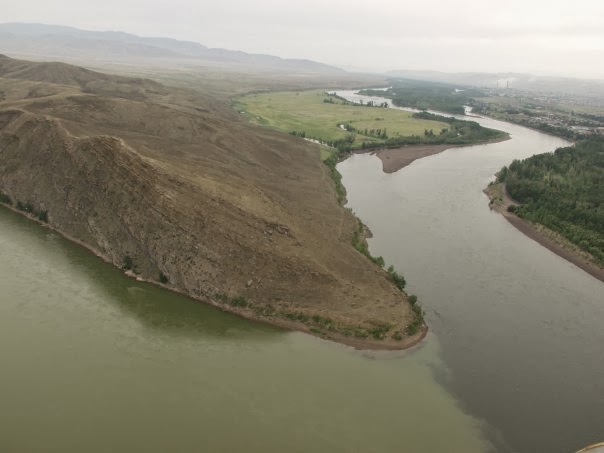
The Angara River is a 1,779-kilometer-long (1,105 mi) river in Irkutsk Oblast and Krasnoyarsk Krai, south-east Siberia, Russia. It is the river that drains Lake Baikal, and is the headwater tributary of the Yenisei River.
Leaving Lake Baikal near the settlement of Listvyanka (at 51.867°N 104.818°E), the Angara flows north past the Irkutsk Oblast’s cities of Irkutsk, Angarsk, Bratsk, and Ust-Ilimsk. It then turns west, enters the Krasnoyarsk Krai, and falls into the Yenisei near Strelka (at 58.102°N 92.991°E, 40 km south-east of Lesosibirsk).
Below its junction with the Ilim River, the Angara has been known in the past as the Upper Tunguska (Russian: Верхняя Тунгуска, Verkhnyaya Tunguska). Confusingly, some maps (e.g., 1773 atlas by Kitchen) referred to this same section of the Angara as Nizhnyaya Tunguska, i.e. the Lower Tunguska – the name that is currently applied to another river.
Note : The above story is based on materials provided by Wikipedia
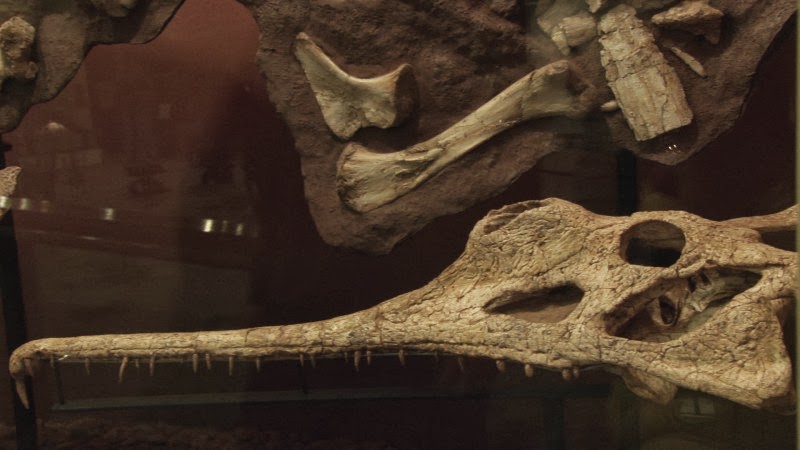
The female skull still had its teeth intact, which made the find even rarer. Credit: Photo by Lacey Nobles
In the dangerous waters of an ancient oxbow lake created by a flooded and unnamed meandering river, the female phytosaur died and sank to the bottom 205 million years ago. About 40 yards away the remains of a larger male also came to rest, and both disappeared in a tomb of soil and sediment.
Evidence for the cause of their deaths and the rest of their bodies have vanished with time, but their skulls remained. After careful research, a Texas Tech paleontologist says he and others have discovered a new species of the Triassic-age monster in the wilds of West Texas.
Their findings were published in the peer-reviewed journal Earth and Environmental Science Transactions of the Royal Society of Edinburgh.
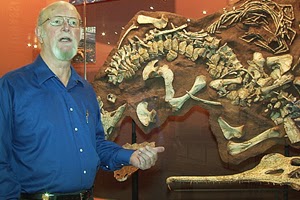
Bill Mueller, assistant curator of Paleontology at the Museum of Texas Tech University, said the team named their find Machaeroprosopus lottorum after the Lott family who own the ranch on which the animal was discovered.
“We found them in an area we’d been excavating in,” Mueller said. “I think we’ve gotten four skulls out of
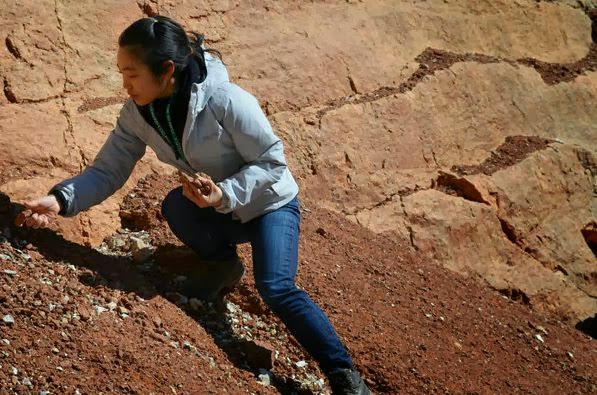
Cunningham, currently a field research assistant at the museum and a retired firefighter, remembered finding the unusual female skull on June 27, 2001. After removing it from the mudstone, he recalls looking it over carefully with others and wondering if his discovery would add a new animal to science.
“It was really well preserved with the teeth and everything,” Cunningham said. “Finding one with teeth is pretty rare. It was so odd, but when they come out of the ground, you have a long way to go to actually see what you have because they’re still covered in matrix. We were all kind of in awe of it. It had this long, skinny snout. It was quite a bit different. It took me years to get it prepped and ready. At the time, I was working full-time and I did that on my days off.” By looking an opening on the skull called the supratemporal fenestra, the snout and the shape of the bones at the back of the head, the team compared it to other phytosaurs and determined they’d discovered a separate species.
While West Texas is dry and dusty today, Mueller said the landscape looked more like a swampy, tropical rainforest during the Triassic period. Our planet’s landmasses had converged to form the supercontinent of Pangaea. In the forest undergrowth covered by tall conifers and choked with ferns, phytosaurs lurked beneath the water and waited for prey.
“A phytosaur resembles a crocodile,” Mueller said. “They had basically the same lifestyle as the modern
Bill Mueller stands in front of the case that houses the skull, bottom right, of the new phytosaur species.
crocodile by living in and around the water, eating fish, and whatever animals came to the margins of the rivers and lakes. But one of the big differences is the external nares, the nose, is back up next to its eyes instead of at the end of its snout.”
Mueller said scientists can tell the sexes of the animals by a distinctive feature on males. A bony crest stretched from the nostrils by the eyes to the tip of the animal’s beak — a feature lady phytosaurs probably found sexy.
Judging by the female’s skull size, which is more than three feet in length, Mueller guessed she would have measured 16 to 17 feet in length from nose to tail tip. The male would have measured about 17 to 18 feet. Their thin jaws suggested they hunted mainly fish as opposed to big prey.
Mueller said phytosaurs lived throughout the Triassic period from 230 to 203 million years ago, but died out during a mysterious mass extinction. Highly successful animals, they are commonly found because these animals liked to live in swampy areas and were more likely to become covered in sediment and fossilized.
that area already. Doug Cunningham found this specimen, and then we dug it up. When he found it, just the very back end of the skull was sticking out of the ground. The rest was buried. We excavated it and brought it into the museum to finish preparation.”
Video :
Note : The above story is based on materials provided by Texas Tech University. The original article was written by John Davis.
Tourists flock to Italy to see Michelangelo’s David and other iconic hunks of Renaissance stone, but in a trip over spring break, a group of Columbia students got to visit rocks that have shaped the world in even more profound ways. In the limestone outcrops of Italy’s Apennine Mountains, geologist Walter Alvarez collected some of the earliest evidence that a massive fireball falling from space some 66 million years ago was responsible for killing off the dinosaurs. Geologists have trekked to the region since then to study that catastrophic event as well as others imprinted in these rocks.
In March, it was the Columbia students’ turn. Led by Steven Goldstein and Sidney Hemming, scientists at Columbia’s Lamont-Doherty Earth Observatory, and visiting scientist David Barbeau, the students touched evidence of undersea mudslides, the drying of the Mediterranean Sea, and several extinction crises, including the one that ended the Age of Dinosaurs.
From about 200 million years ago to 6 million years ago, the vast, shallow Tethys Sea covered much of the Apennines, in Italy’s Umbria-Marche region. As the tiny plants and animals that lived in the sea died, their shells and skeletons piled up, leaving a record of the environment in which they lived. Later, tectonic forces rearranged this landscape, forming the Apennines in several bouts of squeezing and stretching. The activity left limestones made up of tiny microfossils exposed on land, providing a page-by-page story of the past.
More than any other geologist, Alvarez and his late father, Luis, are responsible for putting these rocks on the map. Now a professor-emeritus at University of California, Berkeley, the younger Alvarez began his career at Lamont-Doherty Earth Observatory in the late 1960s at the height of the plate tectonic revolution. In the 1970s, Alvarez traveled to the Bottaccione Gorge in Gubbio to measure magnetic reversals recorded in the rock to understand how seafloor spreading had moved Earth’s continents. Earth’s magnetic field periodically flips, leaving invisible stripes on the seafloor where magma rising from the mantle is magnetized in a northerly or southerly direction. These stripes also showed up in the Apennines, and Alvarez hoped that by dating them using the microfossils in each layer, he could learn more about the movement of continents.
But he stumbled across another mystery. At about 66 million years ago, the one-celled Globotruncana foraminifera suddenly disappeared from the fossil record, replaced by a smaller, more opportunistic species. Separating the two species was a half-inch of mud with no life at all. Testing the clay, Alvarez discovered high levels of the rare element iridium-an element rare on Earth’s surface but common in space. In a 1980 paper in Science, Alvarez hypothesized that a large comet or asteroid had fallen to Earth, kicking up a dust layer that blocked out the sun, starving much of life on earth. The dinosaurs and more than half of Earth’s species died during this time, marking the end of the Cretaceous period and start of the Tertiary, or in geology jargon: the K/T, boundary. In the late 1970s, two geophysicists searching for oil off Mexico’s Yucatán Peninsula discovered a 110-mile wide crater but it was many years before the Chicxulub crater was conclusively linked to Alvarez’s theory.
Sandro Montanari met Alvarez on one of his field trips to Gubbio, and at Alvarez’s encouragement, flew to California to pursue a PhD in geology. Among other things, Montanari collected evidence for a mega-tsunami in the Gulf of Mexico triggered by a six-mile wide asteroid crashing into the Yucatán. Eventually, Montanari returned to Italy and with Alvarez, bought and restored a farming hamlet, Coldigioco, outside the town of Apiro. Since 1992, Coldigioco has served as a base camp for geologists working in the area. Barbeau spent a summer there as a student at Carleton College, so when his colleagues at Lamont were searching for a new place to take students on spring break, Barbeau suggested the Apennines.
In the weeks leading up to the trip, the students read scientific papers detailing the discoveries made in this region and took turns presenting the material in class. They covered Italy’s tectonics and the evidence for several mass extinctions recorded in the Apennines’ exposed marine sediments of the Apennines—the K/T extinctions 66 million years ago; the Paleocene-Eocene Thermal Maximum, about 55 million years ago, when a rapid warming of the planet killed off many species, leading to the rise of some modern mammals; and the Eocene-Oligocene extinctions, about 34 million years ago, marked by a rapid cooling and the emergence of ice on Antarctica.
They would also study the drying of the Mediterranean Sea in an event called the Messinian Salinity Crisis, about 6 million years ago, and how scientists, including Lamont’s William Ryan, pieced the story together from sediments collected at sea; and the formation of the Frasassi Caves, discovered by their guide, Montanari, as a teenager. One day after their plane landed in Milan, they were on the ground, seeing, tasting and touching the places they had read about.
Video :
The above story is based on materials provided by Columbia University
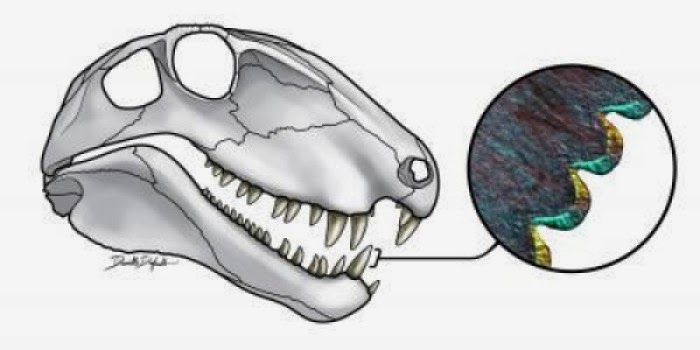
This is a Dimetrodon skull with histological thin section tooth detail by Danielle Dufault. Credit: Danielle Dufault
The first top predators to walk on land were not afraid to bite off more than they could chew, a University of Toronto Mississauga study has found.
Graduate student and lead author Kirstin Brink along with Professor Robert Reisz from U of T Mississauga’s Department of Biology suggest that Dimetrodon, a carnivore that walked on land between 298 million and 272 million years ago, was the first terrestrial vertebrate to develop serrated ziphodont teeth.
According to the study published in Nature Communications, ziphodont teeth, with their serrated edges, produced a more-efficient bite and would have allowed Dimetrodon to eat prey much larger than itself.
While most meat-eating dinosaurs possessed ziphodont teeth, fossil evidence suggests serrated teeth first evolved in Dimetrodon some 40 million years earlier than theropod dinosaurs.
“Technologies such as scanning electron microscope (SEM) and histology allowed us to examine these teeth in detail to reveal previously unknown patterns in the evolutionary history of Dimetrodon,” Brink said.
The four-meter-long Dimetrodon was the top of the terrestrial food chain in the Early Permian Period and is considered to be the forerunner of mammals.
According to Brink and Reisz’s research, Dimetrodon had a diversity of previously unknown tooth structures and were also the first terrestrial vertebrate to develop cusps — teeth with raised points on the crown, which are dominant in mammals.
The study also suggests ziphodont teeth were confined to later species of Dimetrodon, indicating a gradual change in feeding habits.
“This research is an important step in reconstructing the structure of ancient complex communities,” Reisz said.
“Teeth tell us a lot more about the ecology of animals than just looking at the skeleton.”
“We already know from fossil evidence which animals existed at that time but now with this type of research we are starting to piece together how the members of these communities interacted.”
Brink and Reisz studied the changes in Dimetrodon teeth across 25 million years of evolution.
The analysis indicated the changes in tooth structure occurred in the absence of any significant evolution in skull morphology. This, Brink and Reisz suggest, indicates a change in feeding style and trophic interactions.
“The steak knife configuration of these teeth and the architecture of the skull suggest Dimetrodon was able to grab and rip and dismember large prey,” Reisz said.
“Teeth fossils have attracted a lot of attention in dinosaurs but much less is known about the animals that lived during this first chapter in terrestrial evolution.”
Note : The above story is based on materials provided by University of Toronto.
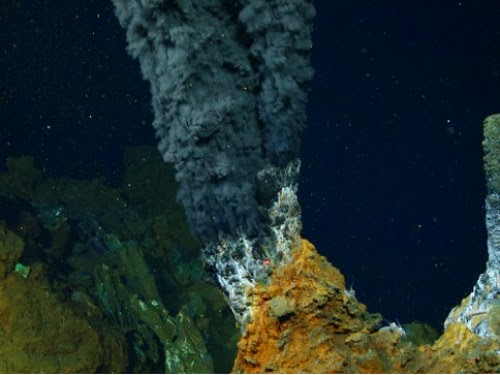
Scientists studying methane-producing microbes, like the ones found in deep-sea hydrothermal vents pictured here, discovered that a protein critical to photosynthesis likely developed on Earth long before oxygen became available. Credit: Image courtesy of Virginia Tech
An international team of researchers led by scientists at Virginia Tech and the University of California, Berkeley has discovered that a process that turns on photosynthesis in plants likely developed on Earth in ancient microbes 2.5 billion years ago, long before oxygen became available.
The research offers new perspective on evolutionary biology, microbiology, and the production of natural gas, and may shed light on climate change, agriculture, and human health.
“By looking at this one mechanism that was not previously studied, we will be able to develop new basic information that potentially has broad impact on contemporary issues ranging from climate change to obesity,” said Biswarup Mukhopadhyay, an associate professor of biochemistry at the Virginia Tech College of Agriculture and Life Sciences, and the senior author of the study. He is also a faculty member at the Virginia Bioinformatics Institute. Plant and microbial biology professor emeritus Bob B. Buchanan co-led the research and co-authored the paper.
The findings were described this week in an early online edition of the Proceedings of the National Academy of Sciences.
This research concerns methane-forming archaea, a group of microbes known as methanogens, which live in areas where oxygen is absent. Methane is the main component of natural gas and a potent greenhouse gas.
“This innovative work demonstrates the importance of a new global regulatory system in methanogens,” said William Whitman, a professor of microbiology at the University of Georgia who is familiar with the study, but not connected to it. “Understanding this system will provide the tools to use these economically important microorganisms better.”
Methanogens play a key role in carbon cycling. When plants die, some of their biomass is trapped in areas that are devoid of oxygen, such as the bottom of lakes.
Methanogens help convert the residual biological material to methane, which other organisms convert to carbon dioxide — a product that can be used by plants.
This natural process for producing methane forms the basis for treating municipal and industrial wastes, helps reduce pollution, and provides methane for fuel. The same process allows natural gas production from agricultural residues, a renewable resource.
Methanogens also play an important role in agriculture and human health. They live in the digestive systems of cattle and sheep where they facilitate the digestion of feed consumed in the diet.
Efforts to control methanogens in specific ways may improve feed utilization and enhance the production of meat and milk, researchers say.
Methanogens are additionally a factor in human nutrition. The organisms live in the large intestine, where they enhance the breakdown of food. Some have proposed that restricting this activity of methanogens could help alleviate obesity.
The team investigated an ancient type of methanogen, Methanocaldococcus jannaschii, which lives in deep-sea hydrothermal vents or volcanoes where environmental conditions mimic those that existed on the early Earth.
They found that the protein thioredoxin, which plays a major role in contemporary photosynthesis, could repair many of the organism’s proteins damaged by oxygen.
Since methanogens developed before oxygen appeared on earth, the evidence raises the possibility that thioredoxin-based metabolic regulation could have come into play for managing anaerobic life long before the advent of oxygen.
“It is rewarding to see that our decades of research on thioredoxin and photosynthesis are contributing to understanding the ancient process of methane formation,” Buchanan said. “It is an excellent illustration of how a process that proved successful early in evolution has been retained in the development of highly complex forms of life.”
Dwi Susanti, the lead author, recently received her doctoral degree in genetics, bioinformatics and computational biology from the Virginia Bioinformatics Institute, and is currently a postdoctoral scholar in the Department of Biochemistry at Virginia Tech.
Usha Loganathan, a graduate student in the Department of Biological Sciences in the College of Science at Virginia Tech, also participated in the study. William H. Vensel of the Western Regional Research Center in Albany, Calif., provided proteomics expertise as did Joshua Wong of University of California, Berkeley. Rebecca De Santis and Ruth Schmitz-Streit of University of Kiel in Germany, and Monica Balsera of the Institute of Natural Resources and Agrobiology of Salamanca in Spain also worked on the project
Grants from the National Science Foundation, the National Aeronautics and Space Administration, and the U.S. Department of Agriculture helped support the research.
Note : The above story is based on materials provided by Virginia Tech (Virginia Polytechnic Institute and State University).
Chemical Formula: CaMgSi2O6 Locality: Wide spread occurrence. Name Origin: From the Greek dis – “two kinds” and opsis – “opinion.”
Diopside is a monoclinic pyroxene mineral with composition MgCaSi2O6. It forms complete solid solution series with hedenbergite (FeCaSi2O6) and augite, and partial solid solutions with orthopyroxene and pigeonite. It forms variably colored, but typically dull green crystals in the monoclinic prismatic class. It has two distinct prismatic cleavages at 87 and 93° typical of the pyroxene series. It has a Mohs hardness of six, a Vickers hardness of 7.7 GPa at a load of 0.98 N, and a specific gravity of 3.25 to 3.55. It is transparent to translucent with indices of refraction of nα=1.663–1.699, nβ=1.671–1.705, and nγ=1.693–1.728. The optic angle is 58° to 63°.
Physical Properties of Diopside
Cleavage: {110} Good, {???} Indistinct Color: Blue, Brown, Colorless, Green, Gray. Density: 3.25 – 3.55, Average = 3.4 Diaphaneity: Transparent to translucent Fracture: Brittle – Conchoidal – Very brittle fracture producing small, conchoidal fragments. Hardness: 6 – Orthoclase Luminescence: Sometimes fluorescent.- red-purple Luster: Vitreous (Glassy) Streak: white green
Scientists at the University of Liverpool have shown that deep sea fault zones could transport much larger amounts of water from the Earth’s oceans to the upper mantle than previously thought.
Water is carried mantle by deep sea fault zones which penetrate the oceanic plate as it bends into the subduction zone. Subduction, where an oceanic tectonic plate is forced beneath another plate, causes large earthquakes such as the recent Tohoku earthquake, as well as many earthquakes that occur hundreds of kilometers below the Earth’s surface.
Seismic modelling
Seismologists at Liverpool have estimated that over the age of the Earth, the Japan subduction zone alone could transport the equivalent of up to three and a half times the water of all the Earth’s oceans to its mantle.
Using seismic modelling techniques the researchers analysed earthquakes which occurred more than 100 km below the Earth’s surface in the Wadati-Benioff zone, a plane of Earthquakes that occur in the oceanic plate as it sinks deep into the mantle.
Analysis of the seismic waves from these earthquakes shows that they occurred on 1 – 2 km wide fault zones with low seismic velocities. Seismic waves travel slower in these fault zones than in the rest of the subducting plate because the sea water that percolated through the faults reacted with the oceanic rocks to form serpentinite – a mineral that contains water.
Some of the water carried to the mantle by these hydrated fault zones is released as the tectonic plate heats up. This water causes the mantle material to melt, causing volcanoes above the subduction zone such as those that form the Pacific ‘ring of fire’. Some water is transported deeper into the mantle, and is stored in the deep Earth.
“It has been known for a long time that subducting plates carry oceanic water to the mantle,” said Tom Garth, a PhD student in the Earthquake Seismology research group led by Professor Andreas Rietbrock.
“This water causes melting in the mantle, which leads to arc releasing some of the water back into the atmosphere. Part of the subducted water however is carried deeper into the mantle and may be stored there.
Large amounts of water deep in the Earth
“We found that fault zones that form in the deep oceanic trench offshore Northern Japan persist to depths of up to 150 km. These hydrated fault zones can carry large amounts of water, suggesting that subduction zones carry much more water from the ocean down to the mantle than has previously been suggested.
“This supports the theory that there are large amounts of water stored deep in the Earth.”
Understanding how much water is delivered to the mantle contributes to knowledge of how the mantle convects, and how it melts, which helps to understand how plate tectonics began, and how the continental crust was formed.
Note : The above story is based on materials provided by University of Liverpool
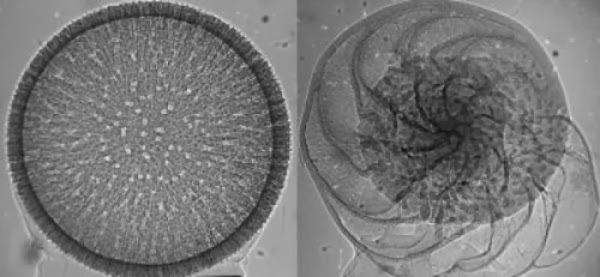
New research, published in Earth and Planetary Research Letters, led by scientists from the University of Cambridge, used plankton – tiny bugs, whose shells litter the ocean floors. By drilling into the seabed scientists can extract shells from plankton which lived millions of years ago.
‘The shells we used are of a type of plankton called foraminifera. They’re only about one tenth of a millimetre big, or small rather, and have been around over 150 million years, so we get a really well-preserved record of them in marine sediments going back tens of millions of years,’ explains Oscar Branson, a PhD student at the University of Cambridge and lead author of the study. ‘Recently people have been analysing them for climate records, but now we realise they’re more complex.’
As plankton grow they build a bit more onto their shells every day by turning elements in the sea water into harder minerals and adding them on. The impurities in the shell depend on what was in the sea water as the plankton grew, so these million-year-old shells can give us an almost daily snapshot of the chemistry of the oceans as it was when they were still alive.
‘We realised plankton have these growth bands, like tree rings, which we thought might tell us something in more detail. It turns out these bands are produced almost daily so you may one day be able to get a 5 day weather report by looking at them,’ Branson says.
The team used a synchrotron in California to study the shells, which let them find out how much magnesium was in each growth band compared to other chemicals.
Synchrotrons use magnetic and electrical fields to accelerate particles round a huge ring. As these charged particles approach the speed of light they give off radiation known as synchrotron light.
Researchers divert this light away from the main ring and down a targeted beamline, where it can be used in a similar way to an X-ray to study the structure of matter at tiny scales.
‘The concentration of magnesium changes depending on temperature of sea water, so by finding out how much there was in the shell it should allow us to find out the temperature of seawater virtually each day for the last 150 million years,’ says Branson.
The magnesium is more likely to be built into shells in warmer waters because it replaces calcium in their atomic structure.
‘Our X-ray data show that the trace magnesium sits inside the crystalline mineral structure of the plankton shell,’ concludes Professor Simon Redfern of the University of Cambridge, who also worked on the project. ‘That’s important because it validates previous assumptions about using magnesium contents as a measure of past ocean temperature.’
Note : The above story is based on materials provided by PlanetEarth Online
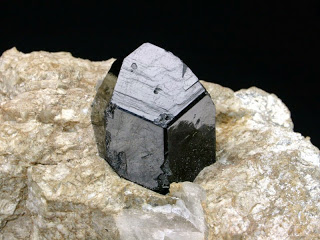
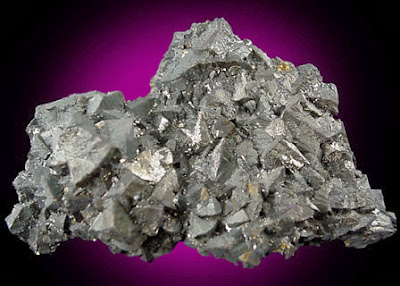
Chemical Formula: Cu9S5 Locality: In the USA, at Butte, Silver Bow Co., Montana. Name Origin: From the Greek for “two kinds” or “sexes,” in reference to the presumed presence of both cuprous and cupric ions.
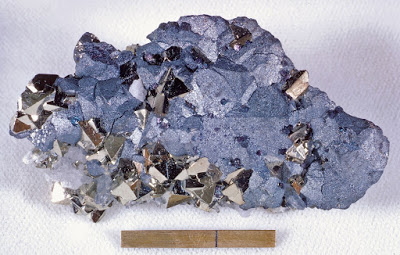
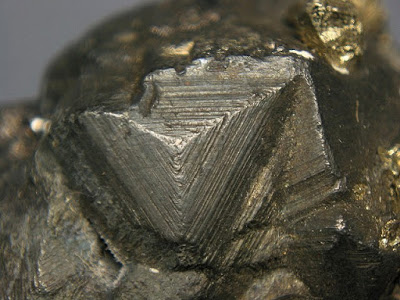
Digenite is a copper sulfide mineral with formula: Cu9S5. Digenite is a black to dark blue opaque mineral that crystallizes with a trigonal – hexagonal scalenohedral structure. In habit it is usually massive, but does often show pseudo-cubic forms. It has poor to indistinct cleavage and a brittle fracture. It has a Mohs hardness of 2.5 to 3 and a specific gravity of 5.6. It is found in copper sulfide deposits of both primary and supergene occurrences. It is typically associated with and often intergrown with chalcocite, covellite, djurleite, bornite, chalcopyrite and pyrite. The type locality is Sangerhausen, Thuringia, Germany, in copper slate deposits.
Occurrence
Digenite occurs in the transitional zone of supergene oxidation of primary sulfide ore deposits, at the interface between the upper and lower saprolite ore zones. It is rarely an important mineral for copper ores, as it is more usually replaced by chalcocite further up in the weathering profile, and is a minor weathering product of primary chalcopyrite. Natural digenite always contains a small amount of iron and is considered to be stable only in the Cu-Fe-S system.
In the Deflector and Deflector West Cu-Au lode deposits of the Gullewa Greenstone Belt, Western Australia, digenite is an important constituent of the transitional Cu-Au ore. However, it is difficult to treat metallurgically and remains a refractory ore type. In this locality digenite is found with covellite, chalcocite and bornite.
It was first described in 1844 from the type locality of Sangerhausen, Saxony-Anhalt, Germany. The name is from the Greek digenus meaning of two origins in reference to its close resemblance with chalcocite and covellite.
Physical Properties of Digenite
Cleavage: {???} Indistinct Color: Blue, Dark blue, Black. Density: 5.6 Diaphaneity: Opaque Fracture: Brittle – Conchoidal – Very brittle fracture producing small, conchoidal fragments. Hardness: 2.5-3 – Finger Nail-Calcite Luster: Sub Metallic Streak: grayish black
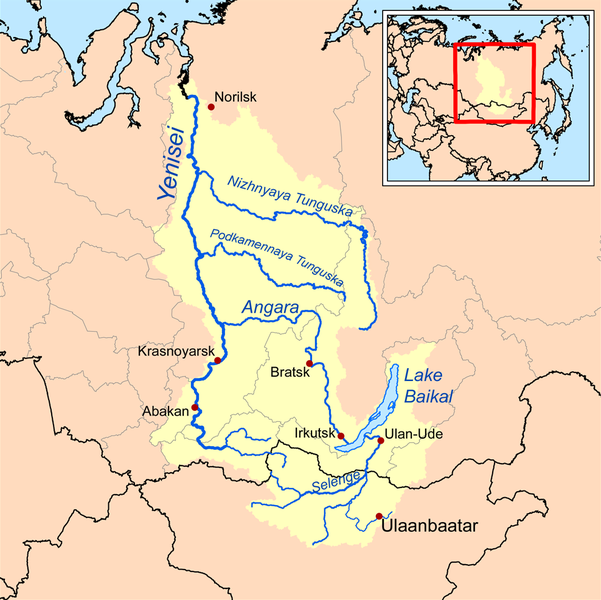
Yenisei (Russian: Енисе́й), also written as Yenisey, is the largest river system flowing to the Arctic Ocean. It is the central of the three great Siberian rivers that flow into the Arctic Ocean (the other two being the Ob River and the Lena River). Rising in Mongolia, it follows a northerly course to the Yenisei Gulf in the Kara Sea, draining a large part of central Siberia, the longest stream following the Yenisei-Angara-Selenga-Ider river system.
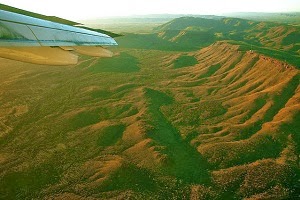
The upper reaches, subject to rapids and flooding, pass through sparsely populated areas. The middle section is controlled by a series of massive hydroelectric dams fuelling significant Russian primary industry. Partly built by gulag labor in Soviet times, industrial contamination remains a serious problem in an area hard to police. Moving on through sparsely populated taiga, the Yenisei swells with numerous tributaries and finally reaches the Kara Sea in desolate tundra where it is icebound for more than half the year.
The maximum depth of the Yenisei River is 80 feet (24 m) and the average depth is 45 feet (14 m). The depth of river outflow is 106 feet (32 m) and inflow is 101 feet (31 m).
The Yenisei basin, including Lake Baikal
Course
The river flows through Khakassia.
Lake Baikal
The 320 km (200 mi) partly navigable Upper Angara River feeds into the northern end of Lake Baikal from the Buryat Republic but the largest inflow is from the Selenga which forms a delta on the south-eastern side.
Lower Yenisei
The Great Kaz joins the Yenisei 300 kilometres (190 mi) downstream from Strelka. It is noteworthy for its connection to the Ob via the Ob-Yenisei canal and the Ket River.
Note : The above story is based on materials provided by Wikipedia
The work is expected to help discover new mineral deposits in WA, but the technique isn’t just limited to mining. Credit: Paul Reid
Mark Jessell has travelled half way around the world to help develop 3D software technology that will allow us to scratch beneath the earth’s surface and tell us more about such things as our mineral and water resources.
Professor Jessell is an internationally renowned structural geologist who recently moved to Perth to take up one of three prestigious WA Research Fellowships.
He is now based at the Centre for Exploration Targeting at the University of Western Australia.
He says good data is the key to unlocking the earth’s secrets.
“One of the problems is that we don’t have enough data,” he says.
“Even though we have lots of data, it’s not enough.
“We can a have a photograph of the surface, but what’s going on beneath the surface is much less sure.
“One of the problems we have is that the software at the moment isn’t really adapted to take in that uncertainty.”
As part of his research over the next few years, Prof Jessell will be looking at modifying and re-writing existing 3D software to tweak it to WA conditions.
“What we’re going to try to do is develop things that sit on top of existing packages that are specifically aimed at solving our problems,” he says.
Part of the work will focus on what is called geological inversion, which involves using geophysical data in 3D models and showing what is under the earth’s surface.
It is innovative technology – and the high-powered computing facilities such as those at the recently-opened Pawsey Centre was one of the things that attracted him to Perth.
“For the geophysical inversion side of our project, the access to that supercomputing facility is a big draw[card],” he says.
The work is expected to help discover new mineral deposits in WA, but the technique isn’t just limited to mining.
“The 3D geology of Western Australia is important to lots of other groups apart from the minerals industry,” he says.
“It’s also important to anybody who is worried about water in WA because the water we have comes from beneath the surface.
“And where it’s stored and where it goes and how it interacts with runoff from agriculture is all controlled by the 3D distribution of the geology.
“This is a big topic and its not something we’re going to be able to do alone.
“I’ve got colleagues at the CSIRO and the Geological Survey of WA and what we hope to do is have a critical mass of people working together on this problem.”
Note : The above story is based on materials provided by Science Network WA
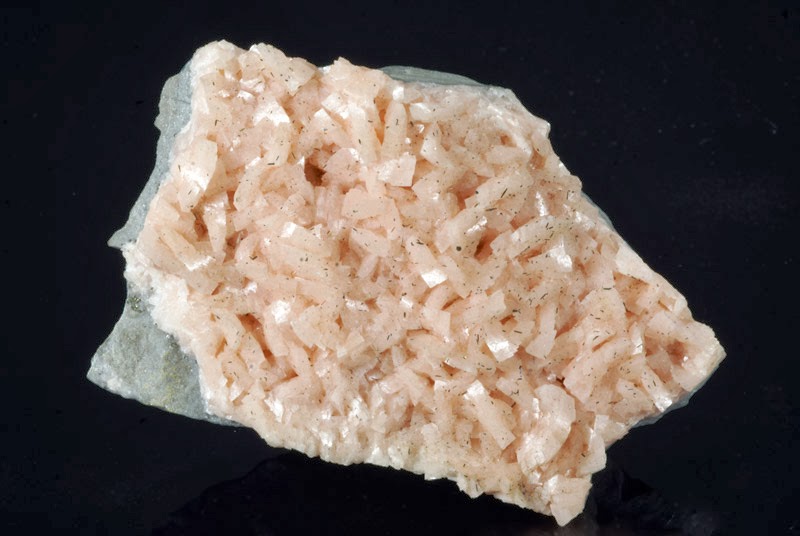
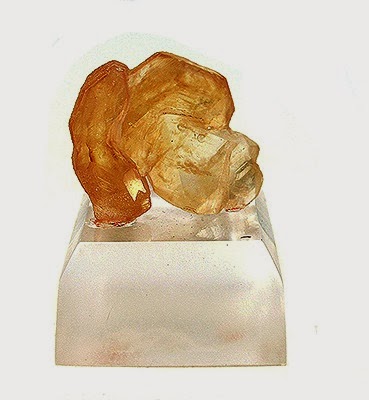
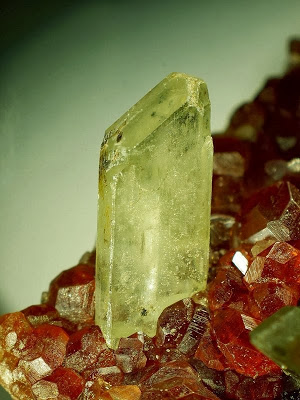
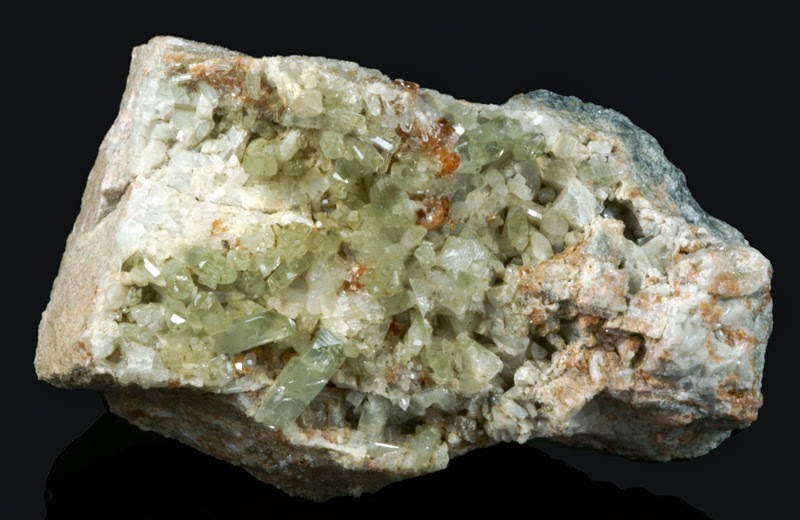
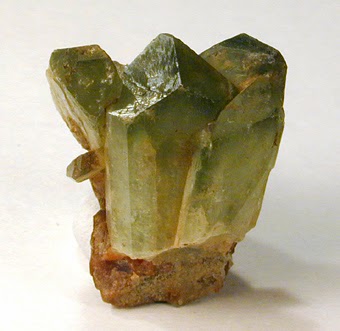
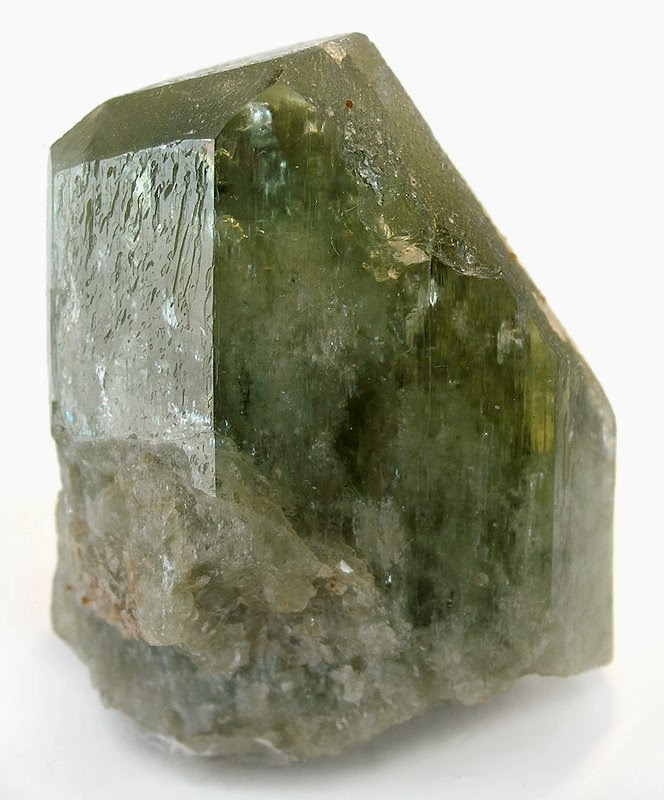
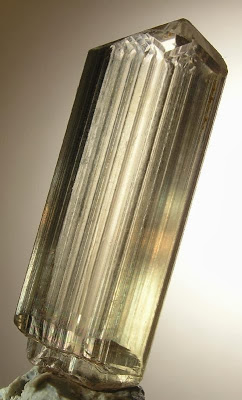
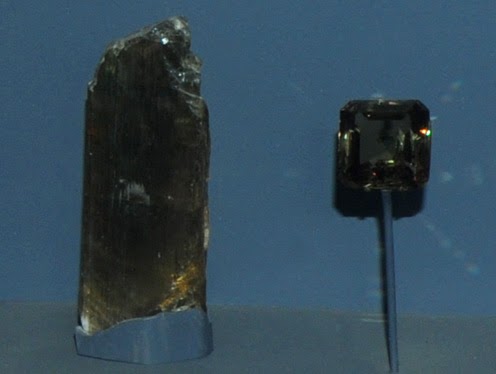
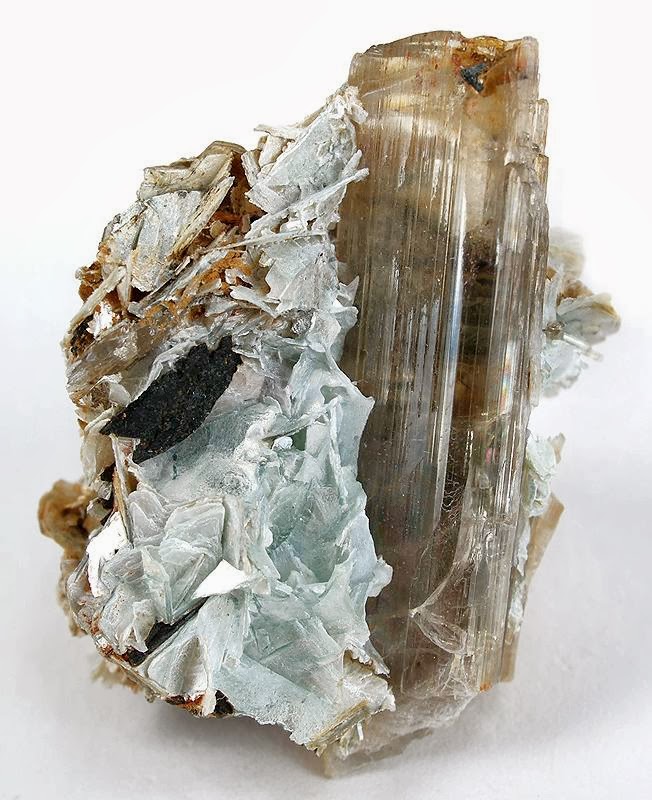
Muğla Province, Aegean Region, Turkey “Courtesy of Rob Lavinsky, The Arkenstone, www.iRocks.com”
Locality: Common world wide. Name Origin: From the Greek word “to scatter,” referring to the mineral’s easy disintegration in the blowpipe flame.
Diaspore also known as empholite, kayserite, or tanatarite, is an aluminium oxide hydroxide mineral, α-AlO(OH), crystallizing in the orthorhombic system and isomorphous with goethite. It occurs sometimes as flattened crystals, but usually as lamellar or scaly masses, the flattened surface being a direction of perfect cleavage on which the lustre is markedly pearly in character. It is colorless or greyish-white, yellowish, sometimes violet in color, and varies from translucent to transparent. It may be readily distinguished from other colorless transparent minerals with a perfect cleavage and pearly luster—like mica, talc, brucite, and gypsum— by its greater hardness of 6.5 – 7. The specific gravity is 3.4. When heated before the blowpipe it decrepitates violently, breaking up into white pearly scales.
The mineral occurs as an alteration product of corundum or emery and is found in granular limestone and other crystalline rocks. Well-developed crystals are found in the emery deposits of the Urals and at Chester, Massachusetts, and in kaolin at Schemnitz in Hungary. If obtainable in large quantity, it would be of economic importance as a source of aluminium.
Diaspore, along with gibbsite and boehmite, is a major component of the aluminium ore bauxite.
It was first described in 1801 for an occurrence in Mramorsk Zavod, Sverdlovskaya Oblast, Middle Urals, Russia. The name is from the Greek for διασπείρειυ, to scatter, in allusion to its decrepitation on heating.
Ottomanite, and zultanite are trade names for gem-quality diaspore (also known as Turkish diaspore) from the İlbir Mountains of southwest Turkey.
Physical Properties of Diaspore
Cleavage: {010} Perfect, {110} Good Color: White, Greenish gray, Grayish brown, Colorless, Yellow. Density: 3.3 – 3.5, Average = 3.4 Diaphaneity: Transparent to subtranslucent Fracture: Brittle – Conchoidal – Very brittle fracture producing small, conchoidal fragments. Hardness: 6.5-7 – Pyrite-Quartz Luminescence: Non-fluorescent. Luster: Vitreous – Pearly Streak: white
Photos :
This sample of diaspore is displayed in the Smithsonian Museum of Natural History. The sample is about 3 cm across and is from Mugla, Menderes Mountains, Anatolia, Turkey.DIASPORE on MARGARITEMugla Province, Aegean Region, Turkey Miniature, 3.8 x 2.6 x 2.3 cm “Courtesy of Rob Lavinsky, The Arkenstone, www.iRocks.com”
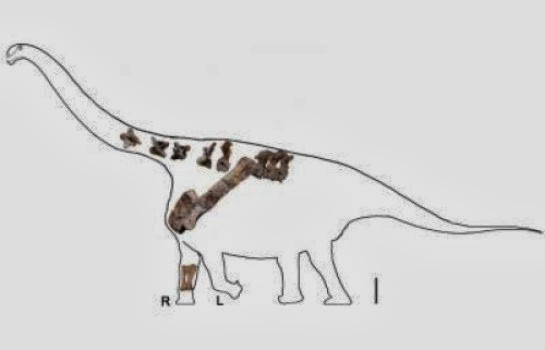
At roughly 50-60 feet long, the Yongjinglong individual discovered was a medium-sized Titanosaur. Anatomical evidence, however, points to it being a juvenile; adults may have been larger.Credit: University of Pennsylvania
A team led by University of Pennsylvania paleontologists has characterized a new dinosaur based on fossil remains found in northwestern China. The species, a plant-eating sauropod named Yongjinglong datangi, roamed during the Early Cretaceous period, more than 100 million years ago. This sauropod belonged to a group known as Titanosauria, members of which were among the largest living creatures to ever walk the earth.
At roughly 50-60 feet long, the Yongjinglong individual discovered was a medium-sized Titanosaur. Anatomical evidence, however, points to it being a juvenile; adults may have been larger.
The find, reported in the journal PLOS ONE, helps clarify relationships among several sauropod species that have been found in the last few decades in China and elsewhere. Its features suggest that Yongjinglong is among the most derived, or evolutionarily advanced, of the Titanosaurs yet discovered from Asia.
Doctoral student Liguo Li and professor Peter Dodson, who have affiliations in both the School of Veterinary Medicine’s Department of Animal Biology and the School of Arts and Sciences’ Department of Earth and Environmental Science, led the work. They partnered with Hailu You, a former student of Dodson’s, who now works at the Chinese Academy of Sciences’ Institute of Vertebrate Paleontology and Paleoanthropology, and Daqing Li of the Gansu Geological Museum in Lanzhou, China.
Until very recently, the United States was the epicenter for dinosaur diversity, but China surpassed the U.S. in 2007 in terms of species found. This latest discovery was made in the southeastern Lanzhou-Minhe Basin of China’s Gansu Province, about an hour’s drive from the province’s capital, Lanzhou. Two other Titanosaurs from the same period, Huanghetitan liujiaxiaensis and Daxiatitan binglingi, were discovered within the last decade in a valley one kilometer from the Yongjinglong fossils.
“As recently as 1997 only a handful of dinosaurs were known from Gansu,” Dodson said. “Now it’s one of the leading areas of China. This dinosaur is one more of the treasures of Gansu.”
During a trip to Gansu, Liguo Li was invited to study the remains, which had been in storage since being unearthed in 2008. They consisted of three teeth, eight vertebrae, the left shoulder blade, and the right radius and ulna.
The anatomical features of the bones bear some resemblance to another Titanosaur that had been discovered by paleontologists in China in 1929, named Euhelopus zdanskyi. But the team was able to identify a number of unique characteristics.
“The shoulder blade was very long, nearly 2 meters, with sides that were nearly parallel, unlike many other Titanosaurs whose scapulae bow outward,” Li said.
The scapula was so long, indeed, that it did not appear to fit in the animal’s body cavity if placed in a horizontal or vertical orientation, as is the case with other dinosaurs. Instead, Li and colleagues suggest the bone must have been oriented at an angle of 50 degrees from the horizontal.
In addition, an unfused portion of the shoulder blade indicated to the researchers that the animal under investigation was a juvenile or subadult.
“The scapula and coracoid aren’t fused here,” Li said. “It is open, leaving potential for growth.”
Thus, a full-grown adult might be larger than this 50-60 foot long individual. Future finds may help elucidate just how much larger, the researchers noted.
The ulna and radius were well preserved, enough so that the researchers could identify grooves and ridges they believe correspond with the locations of muscle attachments in the dinosaur’s leg.
The researchers were also able to draw evidence about the dinosaur’s relationship to other species from the vertebrae, one of which was from the neck and the other seven from the trunk. Notably, the vertebrae had large cavities in the interior that the team believes provided space for air sacs in the dinosaur’s body.
“These spaces are unusually large in this species,” Dodson said. “It’s believed that dinosaurs, like birds, had air sacs in their trunk, abdominal cavity and neck as a way of lightening the body.”
In addition, the longest tooth they found was nearly 15 centimeters long. Another shorter tooth contained unique characteristics, including two “buttresses,” or bony ridges, on the internal side, while Euhelopus had only one buttress on its teeth.
To gain a sense of where Yongjinglong sits on the family tree of sauropods, the researchers were able to compare its characteristics with specimens from elsewhere in China, as well as from Africa, South America and the U.S.
“We used standard paleontological techniques to compare it with phylogenies based on other specimens,” Dodson said. “It is definitely much more derived than Euhelopus and shows close similarities to derived species from South America.”
Not only does the discovery point to the fact that Titanosaurs encompass a diverse group of dinosaurs, but it also supports the growing consensus that sauropods were a dominant group in the Early Cretaceous — a view that U.S. specimens alone could not confirm.
“Based on U.S. fossils, it was once thought that sauropods dominated herbivorous dinosaur fauna during the Jurassic but became almost extinct during the Cretaceous,” Dodson said. “We now realize that, in other parts of the world, particularly in South America and Asia, sauropod dinosaurs continued to flourish in the Cretaceous, so the thought that they were minor components is no longer a tenable view.”
Note : The above story is based on materials provided by University of Pennsylvania. Note: Materials may be edited for content and length.
Ancient rocks in Quebec hold secrets to the early Earth
Provocative new research published this month in the journal Geology suggests that oceanic plate subduction was operating from the earliest times in Earth’s history, meaning conditions for the formation of life may have existed up to a billion years earlier than generally thought.
These findings came from a team of Australian researchers, who analysed similarities between modern-day subduction zones near Japan and early-Earth rock sequences from Quebec, Canada.
Subduction is a process whereby an oceanic plate descends beneath another plate (a characteristic of modern plate tectonics).
Lead author, Macquarie University’s Professor Simon Turner says, “Modern subduction settings, such as the Mariana arc, have all the right chemical ingredients to grow and sustain primitive life forms.
“From the similarities of our research into the earlier deposits from Canada, it follows that the conditions for the formation of life may have existed much earlier, with subduction starting far longer ago than we’d thought previously.”
The early Earth’s geological processes remain a fundamental question for the earth sciences and the rareness of rocks from this time period make exploration a significant challenge.
“We expect that this research will result in a lot of debate across the discipline, as there’s much that is yet to be discovered in the processes and earliest records of subduction. Our next steps are to investigate Zn isotopes which could show whether high pH fluids were present to stabilise amino acids, and we’ll continue to explore the secrets under the Earth’s crust”.
Note : The above story is based on materials provided by Macquarie University