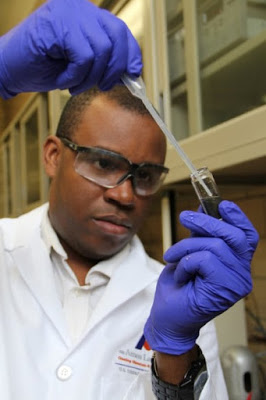
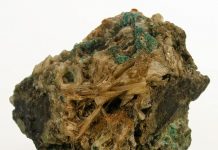
Ikenna Nlebedim and fellow scientists at the Critical Materials Institute have developed a new recycling method for recovering rare earths from manufacturing waste. Credit: Image courtesy of Ames Laboratory
A new recycling method developed by scientists at the Critical Materials Institute, a U.S. Department of Energy Innovation Hub led by the Ames Laboratory, recovers valuable rare-earth magnetic material from manufacturing waste and creates useful magnets out of it. Efficient waste-recovery methods for rare-earth metals are one way to reduce demand for these limited mined resources.
The process, which inexpensively processes and directly reuses samarium-cobalt waste powders as raw material, can be used to create polymer-bonded magnets that are comparable in performance to commercial bonded magnets made from new materials. It can also be used to make sintered magnets (formed by pressure compaction and heat).
The grinding and cutting processes used to manufacture magnets produces waste metal powders and filings, called swarf. When swarf contains costly rare-earth materials like samarium, neodymium, and dysprosium, materials recovery is important.
Early on, the CMI research team’s goal was to find an efficient method of separating and recovering the rare-earth metals for reuse. But CMI scientist Ikenna Nlebedim said he and co-inventor Bill McCallum wanted to push further. “We decided to see if there is a possibility of reusing the swarf itself for magnet manufacturing,” he said. “We wanted to see if we could save that extra step of metals separation, because it’s not just an extra step, it’s an expensive and time consuming one.”
The initial results of the process produced magnets with a magnetic strength (maximum energy product) of approximately 11 MGOe (megagauss-oersteds), a property that the team believes they can improve by optimizing the process.
“If we can optimize the process, this magnet will fit very well in a performance gap that exists between the non-rare-earth magnets and rare-earth magnets,” Nlebedim said. The product may be a more cost-effective choice for some applications, reducing the need for more expensive neodymium-iron-boron magnets.
Nlebedim said the researchers continue to explore other possibilities for the technology as well, including the production of sintered samarium-cobalt magnets, a material with more economic value than bonded magnets. Nlebedim said the process also accomplishes its original goal of separating rare-earth metals, when necessary.
“I think the beauty of this process is that it has direct value to manufacturers of magnets,” said Nlebedim. “They recover their own swarf directly and recycle it themselves. Because it is not recovered from post-consumer products, manufacturers retain quality control of the composition of their materials and can be confident of the grade of their product. From a profit standpoint, this process is very strategically placed to benefit them.”
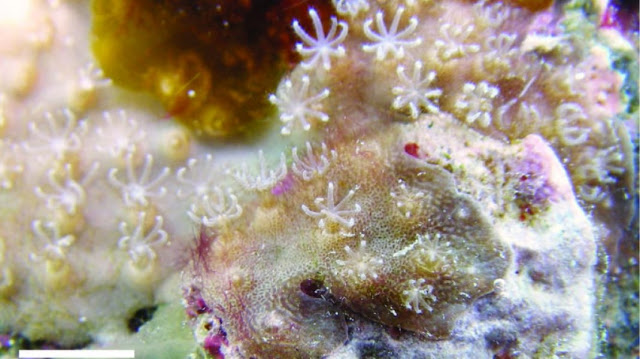
This is Nanipora kamurai found in Zamami Island Okinawa, Japan. Credit: Yu Miyazaki; CC-BY 4.0
Research conducted in Okinawa, Japan, by graduate student Yu Miyazaki and associate professor James Davis Reimer from the University of the Ryukyus has found a very unusual new species of octocoral from a shallow coral reef in Okinawa, Japan. The new species can be considered a “living fossil,” and is related in many ways to the unusual blue coral. The study was published in the open access journal ZooKeys.
Unlike scleractinians, most octocorals lack a hard skeleton, and therefore many have the common name “soft coral.” One exception is the endangered genus Heliopora, known as blue coral, which is found in tropical locations in the Pacific Ocean.
Blue coral forms a massive skeleton of aragonite calcium-carbonate. Due to this unique feature, blue corals have long been placed within their own special order inside the octocorals.
This new species, named Nanipora kamurai, also has an aragonite calcium-carbonate skeleton, and molecular analyses show the two groups are most closely related to each other among all octocorals. As fossils show that blue coral and their relatives were globally distributed during the Cretaceous period (XX-XXX mya), Heliopora and this new species can be considered “living fossils.”
In the past, another octocoral species with an aragonite skeleton, Epiphaxum, was discovered in 1977. Since 1977, several recent and fossil Epiphaxum specimens from the deep sea have been recorded. Although this new species seems to be morphologically close to Epiphaxum, it is classified in a separate genus inside the same family (Lithotelestidae) due to many structural differences.
Perhaps most surprisingly, Nanipora kamurai was found from a very shallow coral reef of <1 m depth. “Most living fossils from the ocean seem to come from deeper, more stable environments” stated Miyazaki, “suggesting that there are important discoveries on coral reefs even in shallow areas still awaiting us.”
“The diverse and pristine reefs of Zamami Island, which was recently included in a new national park, need to be investigated even more,” he added.
The discovery of this species undoubtedly will give new insight on octocoral taxonomy.
Reference:
Yu Miyazaki, James D. Reimer. A new genus and species of octocoral with aragonite calcium-carbonate skeleton (Octocorallia, Helioporacea) from Okinawa, Japan. ZooKeys, 2015; 511: 1 DOI: 10.3897/zookeys.511.9432
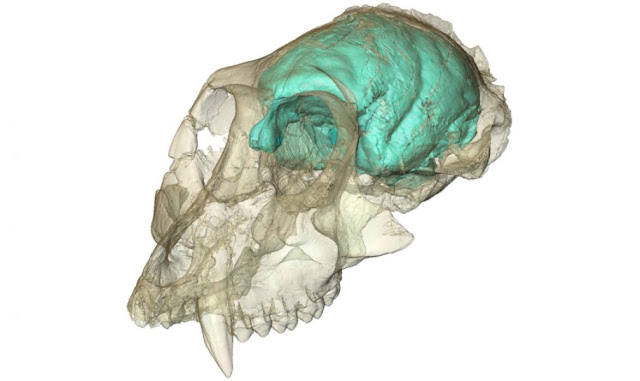
The brain hidden inside the oldest known Old World monkey skull has been visualized for the first time. The ancient monkey, known as Victoriapithecus, first made headlines in 1997 when its 15 million-year-old skull was discovered on an island in Kenya’s Lake Victoria. Now, thanks to high-resolution X-ray imaging, researchers have peered inside its cranial cavity and created a three-dimensional computer model of what the animal’s brain likely looked like. Its tiny but remarkably wrinkled brain supports the idea that brain complexity can evolve before brain size in the primate family tree. The creature’s fossilized skull is now part of the permanent collection of the National Museums of Kenya in Nairobi. Credit: Photo courtesy of Fred Spoor of the Max Planck Institute for Evolutionary Anthropology
The brain hidden inside the oldest known Old World monkey skull has been visualized for the first time. The creature’s tiny but remarkably wrinkled brain supports the idea that brain complexity can evolve before brain size in the primate family tree.
The ancient monkey, known scientifically as Victoriapithecus, first made headlines in 1997 when its fossilized skull was discovered on an island in Kenya’s Lake Victoria, where it lived 15 million years ago.
Now, thanks to high-resolution X-ray imaging, researchers have peered inside its cranial cavity and created a three-dimensional computer model of what the animal’s brain likely looked like.
Micro-CT scans of the creature’s skull show that Victoriapithecus had a tiny brain relative to its body.
Co-authors Fred Spoor of the Max Planck Institute for Evolutionary Anthropology and Lauren Gonzales of Duke University calculated its brain volume to be about 36 cubic centimeters, which is less than half the volume of monkeys of the same body size living today.
If similar-sized monkeys have brains the size of oranges, the brain of this particular male was more akin to a plum.
“When Lauren finished analyzing the scans she called me and said, ‘You won’t believe what the brain looks like,'” said co-author Brenda Benefit of New Mexico State University, who first discovered the skull with NMSU co-author Monte McCrossin.
Despite its puny proportions, the animal’s brain was surprisingly complex.
The CT scans revealed numerous distinctive wrinkles and folds, and the olfactory bulb — the part of the brain used to perceive and analyze smells — was three times larger than expected.
“It probably had a better sense of smell than many monkeys and apes living today,” Gonzales said. “In living higher primates you find the opposite: the brain is very big, and the olfactory bulb is very small, presumably because as their vision got better their sense of smell got worse.”
“But instead of a tradeoff between smell and sight, Victoriapithecus might have retained both capabilities,” Gonzales said.
The findings, published in the July 3 issue of Nature Communications, are important because they offer new clues to how primate brains changed over time, and during a period from which there are very few fossils.
“This is the oldest skull researchers have found for Old World monkeys, so it’s one of the only clues we have to their early brain evolution,” Benefit said.
In the absence of fossil evidence, previous researchers have disagreed over whether primate brains got bigger first, and then more folded and complex, or vice versa.
“In the part of the primate family tree that includes apes and humans, the thinking is that brains got bigger and then they get more folded and complex,” Gonzales said. “But this study is some of the hardest proof that in monkeys, the order of events was reversed — complexity came first and bigger brains came later.”
The findings also lend support to claims that the small brain of the human ancestor Homo floresiensis, whose 18,000-year-old skull was discovered on a remote Indonesian island in 2003, isn’t as remarkable as it might seem. In spite of their pint-sized brains, Homo floresiensis was able to make fire and use stone tools to kill and butcher large animals.
“Brain size and brain complexity can evolve independently; they don’t have to evolve together at the same time,” Benefit said.
The work was funded by the Max Planck Society and University College London. The skull was originally discovered with support from the National Science foundation (9505778).
Video
Reference:
Lauren A. Gonzales, Brenda R. Benefit, Monte L. McCrossin, Fred Spoor. Cerebral complexity preceded enlarged brain size and reduced olfactory bulbs in Old World monkeys. Nature Communications, 2015; 6: 7580 DOI: 10.1038/ncomms8580
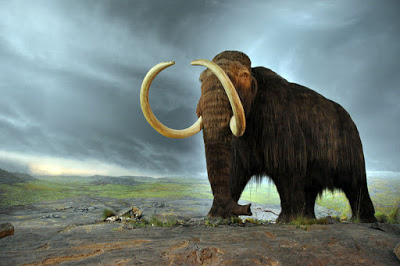
Royal BC Museum in Victoria (Canada) Credit: Flying Puffin
The first comprehensive analysis of the woolly mammoth genome reveals extensive genetic changes that allowed mammoths to adapt to life in the arctic. Mammoth genes that differed from their counterparts in elephants played roles in skin and hair development, fat metabolism, insulin signaling and numerous other traits. Genes linked to physical traits such as skull shape, small ears and short tails were also identified. As a test of function, a mammoth gene involved in temperature sensation was resurrected in the laboratory and its protein product characterized.
The study, published in Cell Reports on July 2, sheds light on the evolutionary biology of these extinct giants.
“This is by far the most comprehensive study to look at the genetic changes that make a woolly mammoth a woolly mammoth,” said study author Vincent Lynch, PhD, assistant professor of human genetics at the University of Chicago. “They are an excellent model to understand how morphological evolution works, because mammoths are so closely related to living elephants, which have none of the traits they had.”
Woolly mammoths last roamed the frigid tundra steppes of northern Asia, Europe and North America roughly 10,000 years ago. Well-studied due to the abundance of skeletons, frozen carcasses and depictions in prehistoric art, woolly mammoths possessed long, coarse fur, a thick layer of subcutaneous fat, small ears and tails and a brown-fat deposit behind the neck which may have functioned similar to a camel hump. Previous efforts to sequence preserved mammoth DNA were error-prone or yielded insights into only a limited number of genes.
To thoroughly characterize mammoth-specific genes and their functions, Lynch and his colleagues deep sequenced the genomes of two woolly mammoths and three Asian elephants — the closest living relative of the mammoth. They then compared these genomes against each other and against the genome of African elephants, a slightly more distant evolutionary cousin to both mammoths and Asian elephants.
The team identified roughly 1.4 million genetic variants unique to woolly mammoths. These caused changes to the proteins produced by around 1,600 genes, including 26 that lost function and one that was duplicated. To infer the functional effects of these differences, they ran multiple computational analyses, including comparisons to massive databases of known gene functions and of mice in which genes are artificially deactivated.
Genes with mammoth-specific changes were most strongly linked to fat metabolism (including brown fat regulation), insulin signaling, skin and hair development (including genes associated with lighter hair color), temperature sensation and circadian clock biology — all of which would have been important for adapting to the extreme cold and dramatic seasonal variations in day length in the Arctic. The team also identified genes associated with the mammoth body plan, such as skull shape, small ears and short tails.
Of particular interest was the group of genes responsible for temperature sensation, which also play roles in hair growth and fat storage. The team used ancestral sequence reconstruction techniques to “resurrect” the mammoth version of one of these genes, TRPV3. When transplanted into human cells in the laboratory, the mammoth TRPV3 gene produced a protein that is less responsive to heat than an ancestral elephant version of the gene. This result is supported by observations in mice that have TRPV3 artificially silenced. These mice prefer colder environments than normal mice and have wavier hair.
Although the functions of these genes match well with the environment in which woolly mammoths were known to live, Lynch warns that it is not direct proof of their effects in live mammoths. The regulation of gene expression, for example, is extremely difficult to study through the genome alone.
“We can’t know with absolute certainty the effects of these genes unless someone resurrects a complete woolly mammoth, but we can try to infer by doing experiments in the laboratory,” he said. Lynch and his colleagues are now identifying candidates for other mammoth genes to functionally test as well as planning experiments to study mammoth proteins in elephant cells.
While his efforts are targeted toward understanding the molecular basis of evolution, Lynch acknowledges that the high-quality sequencing and analysis of woolly mammoth genomes can serve as a functional blueprint for efforts to “de-extinct” the mammoth.
“Eventually we’ll be technically able to do it. But the question is: if you’re technically able to do something, should you do it?” he said. “I personally think no. Mammoths are extinct and the environment in which they lived has changed. There are many animals on the edge of extinction that we should be helping instead.”
Reference:
Vincent J. Lynch, Oscar C. Bedoya-Reina, Aakrosh Ratan, Michael Sulak, Daniela I. Drautz-Moses, George H. Perry, Webb Miller, Stephan C. Schuster. Elephantid Genomes Reveal the Molecular Bases of Woolly Mammoth Adaptations to the Arctic. Cell Reports, 2015 DOI: 10.1016/j.celrep.2015.06.027
Graphic shows how the combination of hill-slope erosion and precipitation-generated runoff over geological time create a landscape of orderly ridges and valleys. Credit: Courtesy of Joshua Roering
University of Oregon geologists have seen ridges and valleys form in real time and — even though the work was a fast-forwarded operation done in a laboratory setting — they now have an idea of how climate change may impact landscapes.
On a basic-science front, the findings, which appear in the July 3 issue of the journal Science, provide a long-sought answer to why some landscape features appear so orderly, with distinct and evenly spaced valleys and ridges.
Picture the Painted Hills near John Day, Oregon, the Colorado Plateau, the badlands of Montana and South Dakota, and even portions of the Coastal Range between Eugene and Florence, Oregon. These watersheds are masterpieces that nature has formed over geological timescales, said the UO’s Joshua J. Roering.
The regularity of hill and valley landforms, he said, is reached after a long tug-of-war between erosion driven by runoff, which influences how rivers cut their paths in valley floors, and soil movement on hillsides caused by disturbances from such things as burrowing gophers, tree roots, digging ants and frost.
The National Science Foundation-funded project (EAR 1252177) is part of a growing effort in geomorphology — the study of the origin and evolution of many landscape features — to understand how soil processes at work on hillsides compete with water runoff in the formation of valley floors.
Put simply, runoff processes carve valleys while soil movement on hill slopes tends to fill them. The relative vigor of these competing forces determines the spacing of hills and valleys and the degree of drainage dissection. “Hill-slope processes help determine valley density and the way valleys and ridges form,” Roering said. “These networks are climate dependent.”
Over the course of five 20-hour experiments conducted in small sandboxes, UO doctoral student Kristin E. Sweeney, the study’s lead author, extruded crystalline silica to represent uplift due to tectonic forces. To induce erosion, she used mist from 42 nozzles to create precipitation-driven runoff and 625 blunt needles that fired periodic bursts of large water drops to mimic natural disturbances that occur on hill slopes. Each experiment showed how the processes, acting together, converted flat plains into ridges and valleys.
“In our experiments we were able to dictate the processes involved and observe the landscapes that arise,” Sweeney said. “We were able to directly control the various processes. Previous research has only attempted to replicate channel processes — what the rivers do. We essentially started from scratch, working to see the movement of sediment slopes in a realistic way.
“Ridges and valleys are part of a fundamental landscape pattern that people easily recognize,” she said. “From an airplane, you look down and you see watersheds, you see valleys, and they tend to have very regular spacing. Explaining this pattern is a fundamental question in geomorphology.”
The study’s three-member team also included Christopher Ellis, senior research associate at the University of Minnesota’s St. Anthony Falls Laboratory where the experiments were conducted. The team spent more than a year developing a workable methodology to study the sediment transfer processes.
The study confirms earlier work using mathematical computations and actual landscape measurements by Taylor Perron of the Massachusetts Institute of Technology and published in the journal Nature in July 2009. The UO study provides the first physical documentation of the processes involved.
“The contribution of hill slopes to drainage basin formation has not been widely appreciated,” Roering said. “The more water on landscapes, the more vegetation, the more varmints and more life that is out there doing hill slope work. If you make things drier you tend to decrease the vigor of hill-slope processes and drainage networks should reflect that.”
Reference:
K. E. Sweeney, J. J. Roering, C. Ellis. Experimental evidence for hillslope control of landscape scale. Science, 2015 DOI: 10.1126/science.aab0017
Note: The above post is reprinted from materials provided by University of Oregon. The original item was written by Jim Barlow.
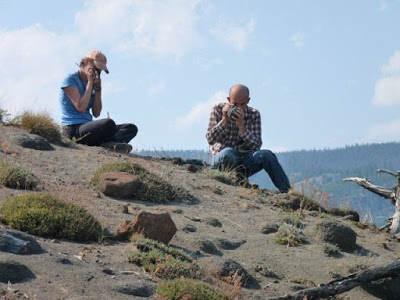
ASU professor Christy Till strives to better understand the potential for future eruptions at Yellowstone volcano by studying those in the recent past. She and paper co-author Jorge Vazquez examine Yellowstone lavas in the field. Credit: Naomi Thompson
We’ve long known that beneath the scenic landscapes of Yellowstone National Park sleeps a supervolcano with a giant chamber of hot, partly molten rock below it.
Though it hasn’t risen from slumber in nearly 70,000 years, many wonder when Yellowstone volcano will awaken and erupt again. According to new research at Arizona State University, there may be a way to predict when that happens.
While geological processes don’t follow a schedule, petrologist Christy Till, a professor in ASU’s School of Earth and Space Exploration, has produced one way to estimate when Yellowstone might erupt again.
“We find that the last time Yellowstone erupted after sitting dormant for a long time, the eruption was triggered within 10 months of new magma moving into the base of the volcano, while other times it erupted closer to the 10 year mark,” says Till.
The new study, published Wednesday in the journal Geology, is based on examinations of the volcano’s distant past combined with advanced microanalytical techniques. Till and her colleagues were the first to use NanoSIMS ion probe measurements to document very sharp chemical concentration gradients in magma crystals, which allow a calculation of the timescale between reheating and eruption for the magma.
This does not mean that Yellowstone will erupt in 10 months, or even 10 years. The countdown clock starts ticking when there is evidence of magma moving into the crust. If that happens, there will be some notice as Yellowstone is monitored by numerous instruments that can detect precursors to eruptions such as earthquake swarms caused by magma moving beneath the surface.
And if history is a good predictor of the future, the next eruption won’t be cataclysmic.
Geologic evidence suggests that Yellowstone has produced three enormous eruptions within the past 2.1 million years, but these are not the only type of eruptions that can occur. Volcanologists say there have been more than 23 smaller eruptions at Yellowstone since the last major eruption approximately 640,000 years ago. The most recent small eruption occurred approximately 70,000 years ago.
If a magma doesn’t erupt, it will sit in the crust and slowly cool, forming crystals. The magma will sit in that state — mostly crystals with a tiny amount of liquid magma — for a very long time. Over thousands of years, the last little bit of this magma will crystallize unless it becomes reheated and reignites another eruption.
For Till and her colleagues, the question was, “How quickly can you reheat a cooled magma chamber and get it to erupt?”
Till collected samples from lava flows and analyzed the crystals in them with the NanoSIMS. The crystals from the magma chamber grow zones like tree rings, which allow a reconstruction of their history and changes in their environment through time.
“Our results suggest an eruption at the beginning of Yellowstone’s most recent volcanic cycle was triggered within 10 months after reheating of a mostly crystallized magma reservoir following a 220,000-year period of volcanic quiescence,” says Till. “A similarly energetic reheating of Yellowstone’s current sub-surface magma bodies could end approximately 70,000 years of volcanic repose and lead to a future eruption over similar timescales.”
Reference:
Christy B. Till, Jorge A. Vazquez, and Jeremy W. Boyce. Months between rejuvenation and volcanic eruption at Yellowstone caldera, Wyoming. Geology, July 1, 2015 DOI: 10.1130/G36862.1
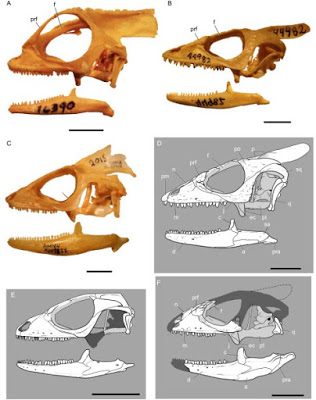
Photographs (A-C) and line drawings (D-F) of the skulls of selected corytophanid species in left lateral view. (A) Corytophanes cristatus (AMNH R 16390), (B) Laemanctus serratus (photograph; AMNH R 44982), (C) Basiliscus vittatus (AMNH R 147832), (D) Laemanctus serratus (line drawing), (E) Geiseltaliellus maarius, and (F) Babibasiliscus alxi taxon nov. (UWBM 89090). Note that it is unclear whether Babibasiliscus alxi taxon nov. had a parietal crest. Reconstructed areas are represented as semi-opaque areas and/or dotted lines. Scale bars equal 10mm. Credit: Conrad JL.; PLoS ONE, 2015 DOI: 10.1371/journal.pone.0127900
A newly-discovered, 48-million-year-old fossil, known as a “Jesus lizard” for its ability to walk on water, may provide insight into how climate change may affect tropical species, according to a study published July 1 in the open-access journal PLOS ONE by Jack Conrad from American Museum of Natural History.
Modern relatives of the Jesus lizard live in an area stretching from central Mexico to northern Colombia, flourishing in the higher temperatures found at the equator. Members of various animal, plant, fungal, and other clades currently confined to the tropics or subtropical areas are often found in fossil records at mid-to-high latitudes from warm periods in Earth history.
The 48-million-year-old fossil, recovered from the Bridger Formation in Wyoming, is the first description of a new species, named Babibasiliscus alxi by the author, and may represent the earliest clear member of the Jesus lizard group, Corytophanidae. This group, which includes iguanas and chameleons, remains poorly understood, due to the small number of fossils available for study.
The author suggests Babibasilscus alxi was likely active during the day and spent a lot of time in trees. A ridge of bone on the skull gave it an angry look while providing shade for its eyes. Each small tooth had three points suitable for eating snakes, lizards, fish, insects and plants, but with a fairly large cheekbone, the lizard may have enjoyed larger prey items as well.
The author suggests that the two-foot long casquehead lizard Babibasiliscus alxi, may have skimmed the surfaces of lush, watery habitats in Wyoming, which at the time probably had a climate matching today’s tropics.
“Given our current period of global climate fluctuation, looking to the fossil record offers an important opportunity to observe what is possible,” said Jack Conrad, “and may give us an idea of what to expect from our dynamic Earth.”
Reference:
Conrad JL. A New Eocene Casquehead Lizard (Reptilia, Corytophanidae) from North America. PLoS ONE, 2015 DOI: 10.1371/journal.pone.0127900
Note: The above post is reprinted from materials provided by PLOS.
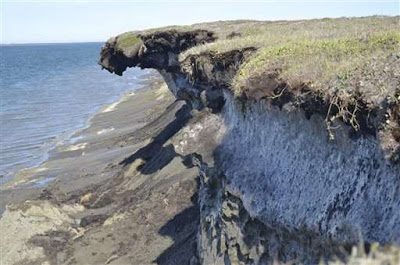
This July 6, 2011 photo, provided by the U.S. Geological Survey shows erosion along the northern Alaska coast in Barter Island, Alaska. Erosion is eating away at Alaska’s northern coast at some of the highest rates in the nation, threatening habitat and infrastructure, according to a new report published Wednesday, July 1, 2015. Credit: Ben Jones/U.S. Geological Survey via AP
Erosion is eating away at Alaska’s northern coast at some of the highest rates in the nation, threatening habitat and infrastructure, according to a new report published Wednesday.
The U.S. Geological Survey study looked at more than 50 years of data and found an average yearly shoreline change of 1.4 meters—or more than 4 1/2 feet—taking both beach erosion and expansion into account. Extreme cases showed an annual difference of more than 60 feet (18.3 meters).
“Probably the take-home message is that the north coast of Alaska is predominantly erosional—84 percent of the coast is eroding,” USGS geologist Ann Gibbs said Wednesday.
The report provides baseline information for an area studied far less than other parts of the country, Gibbs said. The new study looked at nearly 995 miles of the coast between Alaska’s icy Cape and the Canada border.
The study is part of an ongoing assessment of the nation’s shoreline. None of the studies address climate change.
Gibbs, the lead author in the study, said there is no national erosion average from the previous studies, but most places showed shoreline changes of less than 1 meter per year, and a bit higher in Gulf states like Mississippi and Louisiana. Extreme shoreline changes in Louisiana were as high as 22 feet (6.7 meters) per year, she said.
Still to be studied in the national project are Alaska’s western and southern coast, as well as the Great Lakes area on the mainland.
The erosion in northern Alaska tends to occur only in the few warmer months in the summers, Gibbs said.
Walt Audi has witnessed much of the shoreline changes himself as a 51-year resident of the far north village of Kaktovik, which lies within the Arctic National Wildlife Refuge about 640 miles (1,030 kilometers) north of Anchorage. As far as he’s concerned, climate change is to blame.
These days, Audi said, at the height of summer he can look out at the ocean and there’s no ice as far as he can see.
The 76-year-old owner of a local hotel, Audi remembers the old days when supply barges sometimes couldn’t come in to deliver goods because of thick summer shore ice. That served an important purpose in protecting the coastline, he said.
“That kept the waves from crashing in as bad as they are now,” he said.
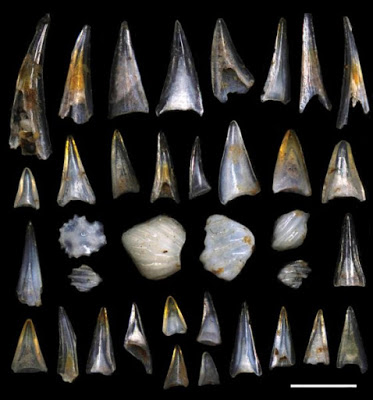
An assortment of Early Cenozoic ichthyoliths. Credit: Elizabeth Sibert with Yale University
A pair of paleobiologists from Scripps Institution of Oceanography, UC San Diego have determined that the world’s most numerous and diverse vertebrates ¬- ray-finned fishes — began their ecological dominance of the oceans 66 million years ago, aided by the mass extinction event that killed off dinosaurs.
Scripps graduate student Elizabeth Sibert and Professor Richard Norris analyzed the microscopic teeth of fishes found in sediment cores around the world and found that the abundance of ray-finned fish teeth began to explode in the aftermath of the mass die-off of species, which was triggered by an asteroid strike in the Yucatan Peninsula. Scientists refer to this episode as the Cretaceous-Paleogene (K/Pg) extinction event.
Ninety-nine percent of all fish species in the world — from goldfish to tuna and salmon — are classified as ray-finned fishes. They are defined as species with bony skeletal structures and have teeth that are well preserved in deep ocean mud. Sharks, in contrast, have cartilaginous skeletons and are represented by both teeth and mineralized scales, also known as denticles, in marine sediments.
“We find that the extinction event marked an ecological turning point for the pelagic marine vertebrates,” write the authors in the study. “The K/Pg extinction appears to have been a major driver in the rise of ray-finned fishes and the reason that they are dominant in the open oceans today.”
The breakthrough for the researchers in reaching their conclusion came through their focus on fossilized teeth and shark scales. In cores from numerous ocean basins, they found that while the numbers of sharks remained steady before and after the extinction event, the ratio of ray-finned fish teeth to shark teeth and scales gradually rose, first doubling then becoming eight times more abundant 24 million years after the extinction event. Now there are 30,000 ray-finned fish species in the ocean, making this class the most numerically diverse and ecologically dominant among all vertebrates on land or in the ocean.
Scientists had known that the main diversification of ray-finned fishes had happened generally between 100 million and 50 million years ago.
“The diversification of fish had never been tied to any particular event. What we found is that the mass extinction is actually where fish really took off in abundance and variety,” said Sibert, who is the recipient of an NSF Graduate Research Fellowship. “What’s neat about what we found is that when the asteroid hit, it completely flipped how the oceans worked. The extinction changed who the major players were.”
Sibert and Norris believe that some key changes in the oceans might have helped ray-finned fishes along. Large marine reptiles disappeared during the mass extinction, as did the ammonites, an ancient cephalopod group similar to the chambered nautilus. Those species, the researchers believe, had been either predators of ray-finned fishes or competitors with them for resources.
“What’s amazing,” said Norris, “is how quickly fish double, then triple in relative abundance to sharks after the extinction, suggesting that fish were released from predation or competition by the extinction of other groups of marine life.”
Sibert noted that before the extinction event, ray-finned fishes existed in a state of relative ecological insignificance, just like mammals on land.
“Mammals evolved 250 million years ago but didn’t become really important until after the mass extinction. Ray-finned fishes have the same kind of story,” said Sibert. “The lineage has been around for hundreds of millions of years, but without the mass extinction event 66 million years ago, it is very likely that the oceans wouldn’t be dominated by the fish we see today.”
Reference:
Elizabeth C. Sibert, Richard D. Norris. New Age of Fishes initiated by the Cretaceous−Paleogene mass extinction. Proceedings of the National Academy of Sciences, 2015; 201504985 DOI: 10.1073/pnas.1504985112
Note: The above post is reprinted from materials provided by University of California – San Diego. The original item was written by Robert Monroe.
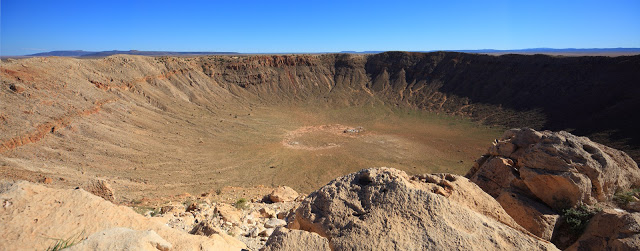
The meteor crater in Arizona, USA, with a diameter of 1.2 kilometers, is the most well-known impact crater. There must still be many undiscovered craters in this size category – but they are older and much less well preserved.
The geologists Prof. Dr. Stefan Hergarten and Prof. Dr. Thomas Kenkmann from the Institute of Earth and Environmental Sciences of the University of Freiburg have published the world’s first study on the question of how many meteorite craters there should be on the Earth’s surface. A total of 188 have been confirmed so far, and 340 are still awaiting discovery according to the results of a probability calculation presented by the two researchers in the journal Earth and Planetary Science Letters.
Meteorite impacts have shaped the development of the Earth and life repeatedly in the past. The extinction of the dinosaurs, for instance, is thought to have been brought on by a mega-collision at the end of the Cretaceous period. But how many traces of large and small impacts have survived the test of time? In comparison to the more than 300,000 impact craters on Mars, the mere 188 confirmed craters on Earth seem almost negligible. Moreover, 60 of them are buried under sediments. Advances in remote sensing have not led to the expected boom in crater discoveries: An average of only one to two meteorite craters are discovered per year, most of them already heavily eroded.
The probability of a meteorite impact on Earth is not fundamentally different than on Mars. However, the Earth’s surface changes much more quickly. As a result, the craters remain visible for a much shorter period of time, meaning that many less of them are detectible today. “The main challenge of the study was to estimate the long-term effect of erosion, which causes craters to disappear over time,” says Hergarten. The life span of a crater depends on the rate of erosion and its size. Large craters can achieve a life span of several 100 million years, depending on the region in which they are located. On the other hand, large impacts are much rarer than small impacts. The solution was to compare the amount of confirmed craters of different sizes, calculate the expected frequency of the impacts on the basis of the known probabilities, and combine this information to infer the rates of erosion.
“A surprising, initially sobering finding we made was that there are not many craters of above six kilometers in diameter left to discover on the Earth’s surface,” reports Hergarten. In the case of smaller craters, on the other hand, the scientists found the current list to be far from complete: Around 90 craters with a diameter of one to six kilometers and a further 250 with a diameter of 250 to 1000 meters are still awaiting discovery. While there are undoubtedly still a number undiscovered large craters buried deep under sediments, they are much more difficult to detect and confirm.
Reference:
S. Hergarten, T. Kenkmann. The number of impact craters on Earth: Any room for further discoveries? Earth and Planetary Science Letters, 2015; 425: 187 DOI: 10.1016/j.epsl.2015.06.009
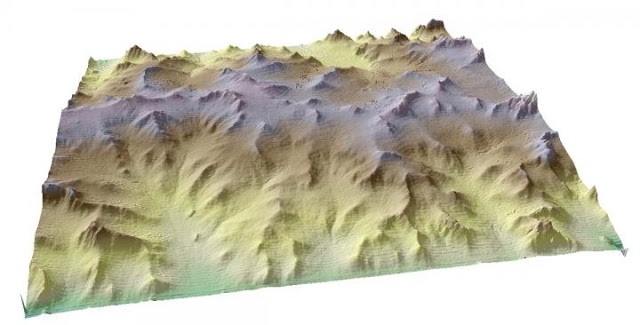
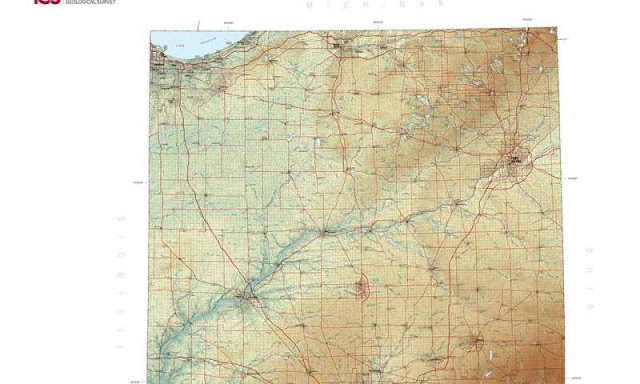
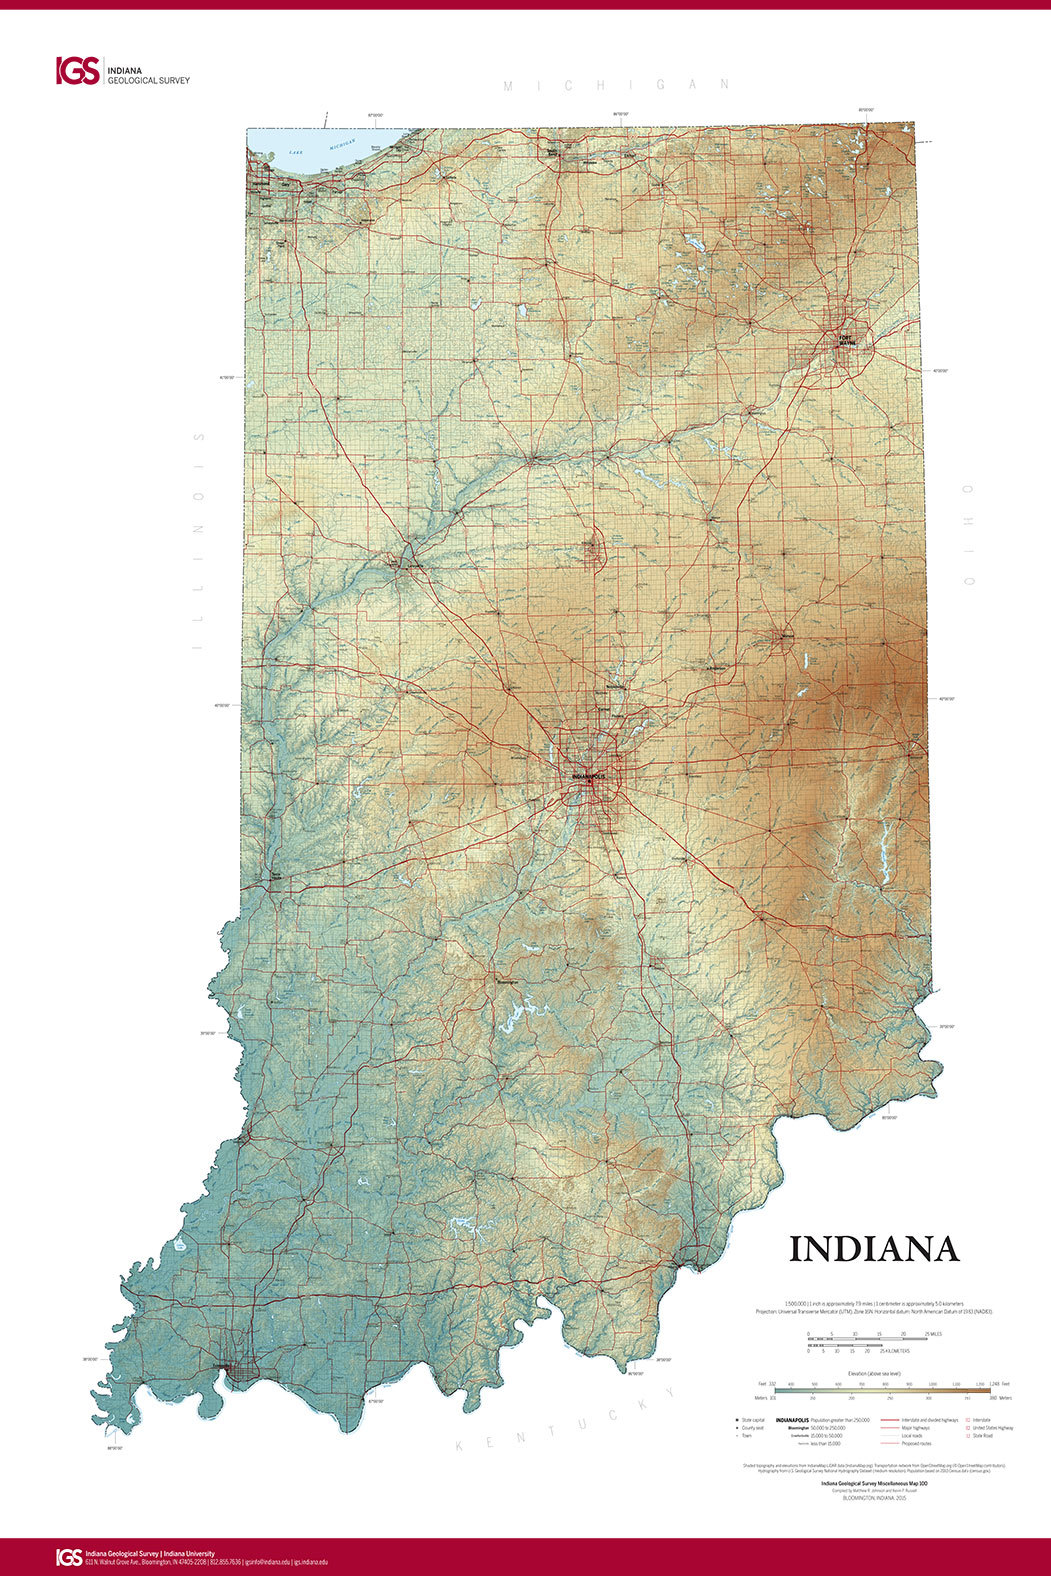
A new state map from the Indiana Geological Survey features the latest digital technology using high-resolution elevation data.
The Indiana Geological Survey has published a new state map that features the latest digital technology using high-resolution elevation data. The map was prepared using lidar data—light detection and ranging—collected by specially equipped aircraft flying over the entire state.
The lidar data were acquired over a three-year period beginning in 2011 and, following a rigorous process of quality control to ensure their accuracy, the digital data were made available to geographic information system technologists in January 2014.
“Maps must be accurate to be useful, but they can also be beautiful,” said Matt Johnson, Indiana Geological Survey head cartographer, who is one of the compilers of the new map.
The shaded-relief map, titled “Indiana,” is printed in full color on high-quality poster paper and measures 28 by 42 inches. It is a 1:500,000-scale map (1 inch on the map equals 7.89 miles) that provides a highly detailed depiction of the diverse landscapes of Indiana.
Included are highways and roads; lakes, rivers and streams; county seats; and population data. Elevations are represented by color, and this, in combination with relief-shading techniques, gives the map a three-dimensional look.
From across the room, one can easily see the incised landscape of the Wabash Valley or, in the northeastern part of the state, the subtle moraines left by retreating glaciers of the Ice Age. Closer up, in the southern part of the state, the details of the uplands and river bottoms become readily apparent.
“Indiana is one of only eight states nationwide that has complete lidar coverage, and it is the only state that has made this information accessible to the public in this format,” said Indiana State Geologist John Steinmetz. “This map contains information to support decision-making where topographic features are of critical importance. It will also facilitate conversations among legislators and stakeholders regarding the importance of timely and high-quality data acquisition.”
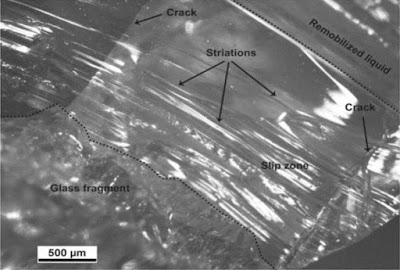
Photograph of the slip zone in plane view. Credit: University of Liverpool
A new discovery in the study of fault slip seeks to redefine our understanding of how melt-bearing faults behave, say scientists at the University of Liverpool.
Geoscientists have used friction experiments to investigate the processes of fault slip. Fault slip occurs in many natural environments – including during earthquakes – when large stress build-ups are rapidly released as two sliding tectonic plates grinds together.
In this process a large amount of the energy released can be converted to heat, that leads to frictional melting. Frictional melts, when cooled, preserve in the rock-record as pseudotachylytes; but their influence is much greater than just this.
As Professor Lavallée and co-workers have demonstrated, the flow properties of the frictional melt helps control fault slip.
Inadequate analyses
The researchers, from the University’s School of Environmental Sciences, warn of the inadequacy of simple Newtonian viscous analyses to describe molten rock along faults, and instead call for the more realistic application of viscoelastic theory.
Melt may be considered a liquid, which is able to undergo a glass transition, as a result of changing temperature and/ or strain-rate. This catastrophic transition allows the melt to either flow or fracture, according to the fault slip conditions.
Professor Lavallée said: “Even once frictional melt forms, slip can continue as if there was no melt; if the slip rate is fast enough the melt behaves as a solid.”
Using slip analysis models, the researchers describe the conditions that result in either viscous remobilisation or fracture of the melt, a description which will be of great use in the understanding of fault slip in melt-bearing slip zones.
Implications
Professor Lavallée added: “This new description of fault slip is not just important for our understanding of earthquake fault rheology, it has far reaching implications for magma transport in volcanic eruptions, for landslide and sector collapse instabilities, and within material sciences; namely for the glass and ceramic industries.”
Reference:
Yan Lavalléea, Takehiro Hirose, Jackie E. Kendrick, Kai-Uwe Hess, and Donald B. Dingwell. Fault rheology beyond frictional melting, Yan Lavallée, PNAS, DOI: 10.1073/pnas.1413608112
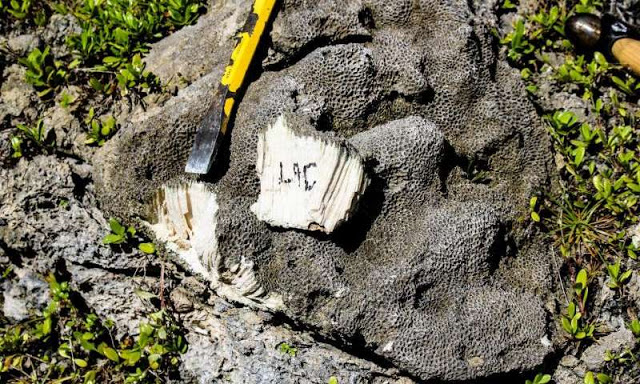
Weathering and moss can make uplifted blend into the background like rocks. Underneath the exterior layer the coral remains a bright white from calcium carbonate, the primary compound of coral skeletons. Credit: Kaustubh Thirumalai
Researchers have found that parts of the western Solomon Islands, a region thought to be free of large earthquakes until an 8.1 magnitude quake devastated the area in 2007, have a long history of big seismic events.
The findings, published online in Nature Communications on Tuesday, suggest that future large earthquakes will occur, but predicting when is difficult because of the complex environment at the interface of the tectonic plates.
The team, led by researchers at The University of Texas Austin, analyzed corals for the study. The coral, in addition to providing a record of when large earthquakes happened during the past 3,000 years, helped provide insight into the relationship between earthquakes and more gradual geological processes, such as tectonic plate convergence and island building through uplift.
“We’re using corals to bridge this gap between earthquakes and long-term deformation, how the land evolves,” said lead researcher Kaustubh Thirumalai, a doctoral student at the University of Texas Institute for Geophysics (UTIG), a research unit within the Jackson School of Geosciences.
The 2007 event was the only large earthquake recorded in 100 years of monitoring the region that started with British colonization in the 1900s. While studying uplifted coral at multiple sites along the eastern coast of the island of Ranongga the researchers found evidence for six earthquakes in the region during the past 3,000 years, with some being as large as or larger than the 2007 earthquake.
“This just shows the importance of paleoseismology and paleogeodesy,” Thirumalai said. “If we have 100 years of instrumental data saying there’s no big earthquakes here, but we have paleo-records that say we’ve had something like five giant ones in the last few thousand years, that gives you a different perspective on hazards and risk assessment.”
During an earthquake, land near its epicenter can be lifted as much as several meters. When the land is shallow-water seafloor, such as it is around the islands, corals can be lifted out of the water with it. The air kills the soft polyps that form coral, leaving behind their network of skeletons and giving the uplifted corals a rock-like appearance.
Uplifted coral make good records for earthquakes because they record the time an earthquake occurs and help estimate how strong it was. The coral’s time of death, which can be deduced through a chemical analysis similar to carbon dating, shows when the earthquake occurred, while the amount of uplift present in the land where the coral was found gives clues about its strength.
“If we have multiple corals going back in time, and we can date them very precisely, we can go from one earthquake, to many earthquakes, to thousands of years of deformation of the land,” Thirumalai said.
The UTIG research team comprised Thirumalai, Frederick Taylor, Luc Lavier, Cliff Frohlich and Laura Wallace. They collaborated with scientists from National Taiwan University, including Chuan-Chou “River” Shen, an expert in coral dating, and researchers from the Chinese Academy of Science; the Department of Mines, Energy and Water Resources in the Solomon Islands; and locals who live on Ranongga Island.
The earthquakes in the region are a result of plate tectonic motion near the island; only four kilometers offshore the Pacific Plate starts to subduct beneath the Australian Plate. A theory of island building says that uplifts during earthquakes are one of the main drivers of land creation and uprising.
However, the earthquake record suggested by the corals was not enough to account for the measured rate of tectonic convergence. This suggests that other geological processes besides those that directly cause earthquakes play an important role in tectonic plate movement and uplift of the islands.
Learning the detailed relationship between earthquakes and these forces will take more research, said Thirumalai. But this study has shown uplifted coral are important geological tools.
Data collected during a rapid-response mission to study uplifted corals in the wake of the 2007 earthquake served an important role in the research, Thirumalai said. The mission, which Taylor led and the Jackson School funded, provided data that served as a benchmark for analyzing the strength of earthquakes that happened before 2007.
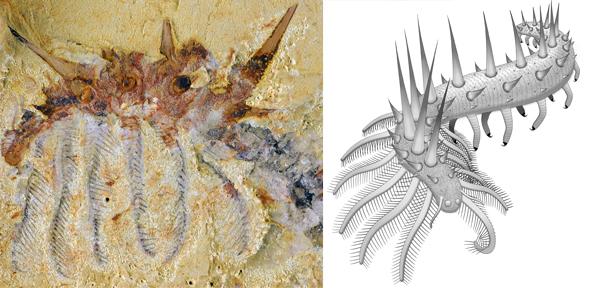
Collinsium ciliosum, a Collins’ monster-type lobopodian from the early Cambrian Xiaoshiba biota of China. Credit: Jie Yang
A newly-identified species of spike-covered worm with legs, which lived 500 million years ago, was one of the first animals on Earth to develop armour for protection.
A new species of ‘super-armoured’ worm, a bizarre, spike-covered creature which ate by filtering nutrients out of seawater with its feather-like front legs, has been identified by palaeontologists. The creature, which lived about half a billion years ago, was one of the first animals on Earth to develop armour to protect itself from predators and to use such a specialised mode of feeding.
The creature, belonging to a poorly understood group of early animals, is also a prime example of the broad variety of form and function seen in the early evolutionary history of a modern group of animals that, today, are rather homogenous. The results, from researchers at the University of Cambridge and Yunnan University in China, are published today (29 June) in the journal PNAS.
The creature has been named Collinsium ciliosum, or Hairy Collins’ Monster, named for the palaeontologist Desmond Collins, who discovered and first illustrated a similar Canadian fossil in the 1980s. The newly-identified species lived in what is now China during the Cambrian explosion, a period of rapid evolutionary development around half a billion years ago, when most major animal groups first appear in the fossil record.
A detailed analysis of its form and evolutionary relationships indicates that the Chinese Collins’ Monster is a distant early ancestor of modern velvet worms, or onychophorans, a small group of squishy animals resembling legged worms that live primarily in tropical forests around the world.
“Modern velvet worms are all pretty similar in terms of their general body organisation and not that exciting in terms of their lifestyle,” said Dr Javier Ortega-Hernández of Cambridge’s Department of Earth Sciences, one of the paper’s lead authors. “But during the Cambrian, the distant relatives of velvet worms were stunningly diverse and came in a surprising variety of bizarre shapes and sizes.”
The pattern of diverse ancestors leading to relatively unvaried modern relatives has been observed in other groups in the fossil record, including sea lilies (crinoids) and lamp shells (brachiopods). However, this is the first time that this evolutionary pattern has been observed in a mostly soft-bodied group.
Ortega-Hernández and his colleagues identified a remarkably well-preserved fossil from southern China, which included details of the full body organisation, the digestive tract, even down to a delicate coat of hair-like structures on the front end. Their analysis found it to be a new species — an eccentric ancestor of an otherwise straight-laced group.
The Chinese Collins’ Monster had a soft and squishy body, six pairs of feather-like front legs, and nine pairs of rear legs ending in claws. Since the clawed rear legs were not well-suited for walking along the muddy ocean floor, it is likely that Collinsium eked out an existence by clinging onto sponges or other hard substances by its back claws, while sieving out its food with its feathery front legs. Some modern animals, including bamboo shrimp, feed in a similar way, capturing passing nutrients with their fan-like forearms.
Given its sedentary lifestyle and soft body, the Chinese Collins’ Monster would have been a sitting duck for any predators, so it developed an impressive defence mechanism: as many as 72 sharp and pointy spikes of various sizes covering its body, making it one of the earliest soft-bodied animals to develop armour for protection.
The Chinese Collins’ Monster resembles Hallucigenia, another otherworldly Cambrian fossil, albeit one which has been the subject of much more study.
“Both creatures are lobopodians, or legged worms, but the Collins’ Monster sort of looks like Hallucigenia on steroids,” said Ortega-Hernández. “It had much heavier armour protecting its body, with up to five pointy spines per pair of legs, as opposed to Hallucigenia’s two. Unlike Hallucigenia, the limbs at the front of Collins’ Monster’s body were also covered with fine brushes or bristles that were used for a specialised type of feeding from the water column.”
The spines along Collinsium’s back had a cone-in-cone construction, similar to Russian nesting dolls. This same construction has also been observed in the closely-related Hallucigenia and the claws in the legs of velvet worms, making both Collinsium and Hallucigenia distant ancestors of modern onychophorans. According to Ortega-Hernández, “There are at least four more species with close family ties to the Collins’ Monster, which collectively form a group known as Luolishaniidae. Fossils of these creatures are hard to come by and mostly fragmentary, so the discovery of Collinsium greatly improves our understanding of these bizarre organisms.”
The fossil was found in the Xiaoshiba deposit in southern China, a site which is less-explored than the larger Chengjiang deposit nearby, but has turned up fascinating and well-preserved specimens from this key period in Earth’s history.
“Animals during the Cambrian were incredibly diverse, with lots of interesting behaviours and modes of living,” said Ortega-Hernández. “The Chinese Collins’ Monster was one of these evolutionary ‘experiments’ — one which ultimately failed as they have no living direct ancestors — but it’s amazing to see how specialised many animals were hundreds of millions of years ago. At its core, the study of the fossil record seeks answers about the evolution of life on Earth that can only be found in deep time. All the major biological events responsible for shaping the world we inhabit, such as the origin of life, the early diversification of animals, or the establishment of the modern biosphere, are intimately linked to the complex geological history of our planet.”
The research was funded by the National Natural Science Foundation of China, Emmanuel College, Cambridge, and the Templeton World Charity Foundation.
Reference:
Yang, J et al. A super-armoured lobopodian from the Cambrian of China and early disparity in the evolution of Onychophora. PNAS, 2015 DOI: 10.1073/pnas.1505596112
Note: The above post is reprinted from materials provided by University of Cambridge. The original story is licensed under a Creative Commons Licence.
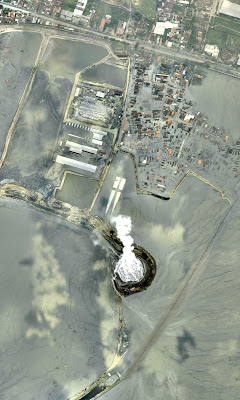
This is a satellite image of the Lusi mud volcano and the buried city of Sidoarjo in March 2007. The image covers approximately 1200 by 600 meters. Credit: Lapindo Brantas
New research led by the University of Adelaide hopes to close the debate on whether a major mud volcano disaster in Indonesia was triggered by an earthquake or had human-made origins.
A mud volcano suddenly opened up in the city of Sidoarjo in East Java, Indonesia, in May 2006. Nine years later the eruption continues — having buried more than 6.5km2 of the city in up to 40m of mud and displacing almost 40,000 people. Costs of the disaster are estimated at over US$2.7 billion.
Results of new research published today in correspondence in the journal Nature Geoscience directly address the ongoing controversy over the cause of the disaster, says lead author Dr Mark Tingay, Adjunct Associate Professor with the University of Adelaide’s Australian School of Petroleum.
“There has been intense debate over the cause of the mud volcano ever since it erupted,” Adjunct Associate Professor Tingay says.
“Some researchers argue that the volcano was human-made and resulted from a drilling accident (a blowout) in a nearby gas well. Others have argued that it was a natural event that was remotely triggered by a large earthquake that occurred 250km away and two days previously. There has been no scientific consensus about this, and it’s a very hot topic politically in Indonesia.
“Our new research essentially disproves all existing earthquake-triggering models and, in my opinion, puts the matter to rest,” he says.
The study by Adjunct Associate Professor Tingay and colleagues in the US (Portland University; University of California, Berkeley) and UK (Newcastle University) is the first to use actual physical data collected in the days before and after the earthquake, rather than models and comparisons.
“The earthquake-trigger theory proposes that seismic shaking induced liquefaction of a clay layer at the disaster location. Clay liquefaction is always associated with extensive gas release, and it is this large gas release that has been argued to have helped the mud flow upwards and erupt on the surface. However, we examined precise and continuous subsurface gas measurements from the adjacent well and show that there was no gas release following the earthquake,” Adjunct Associate Professor Tingay says.
“The rocks showed no response to the earthquake, indicating that the earthquake could not have been responsible for the mud flow disaster. Furthermore, the measurements highlight that the onset of underground activity preceding the mud eruption only started when the drilling ‘kick’ occurred, strongly suggesting that the disaster was initiated by a drilling accident.
“We also use gas signatures from different rocks and the mud eruption itself to ‘fingerprint’ the initial source of erupting fluids. We demonstrate that erupting fluids were initially sourced from a deep formation, which is only predicted to occur in the drilling-trigger hypothesis. Taken together, our data strongly supports a human-made trigger. We hope this closes the debate on whether an earthquake caused this unique disaster,” he says.
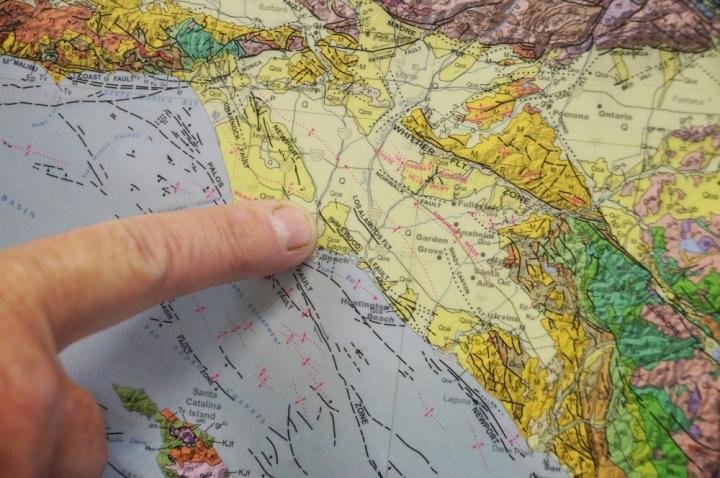
The Newport-Inglewood fault was responsible for the 4.9 magnitude Inglewood earthquake in 1920 and the 6.4 magnitude Long Beach earthquake in 1933. Credit: Sonia Fernandez
UC Santa Barbara geologist Jim Boles has found evidence of helium leakage from Earth’s mantle along a 30-mile stretch of the Newport-Inglewood Fault Zone in the Los Angeles Basin. Using samples of casing gas from two dozen oil wells ranging from LA’s Westside to Newport Beach in Orange County, Boles discovered that more than one-third of the sites — some of the deepest ones — show evidence of high levels of helium-3 (3He).
Considered primordial, 3He is a vestige of the Big Bang. Its only terrestrial source is the mantle. Leakage of 3He suggests that the Newport-Inglewood fault is deeper than scientists previously thought. Boles’s findings appear in Geochemistry, Geophysics, Geosystems (G-Cubed), an electronic journal of the American Geophysical Union and the Geochemical Society.
“The results are unexpected for the area, because the LA Basin is different from where most mantle helium anomalies occur,” said Boles, professor emeritus in UCSB’s Department of Earth Science. “The Newport-Inglewood fault appears to sit on a 30-million-year-old subduction zone, so it is surprising that it maintains a significant pathway through the crust.”
When Boles and his co-authors analyzed the 24 gas samples, they found that high levels of 3He inversely correlate with carbon dioxide (CO2), which Boles noted acts as a carrier gas for 3He. An analysis showed that the CO2 was also from the mantle, confirming leakage from deep inside Earth.
Blueschist found at the bottom of nearby deep wells indicates that the Newport-Inglewood fault is an ancient subduction zone — where two tectonic plates collide — even though its location is more than 40 miles west of the current plate boundary of the San Andreas Fault System. Found 20 miles down, blueschist is a metamorphic rock only revealed when regurgitated to the surface via geologic upheaval.
“About 30 million years ago, the Pacific plate was colliding with the North American plate, which created a subduction zone at the Newport-Inglewood fault,” Boles explained. “Then somehow that intersection jumped clear over to the present San Andreas Fault, although how this occurred is really not known. This paper shows that the mantle is leaking more at the Newport-Inglewood fault zone than at the San Andreas Fault, which is a new discovery.”
The study’s findings contradict a scientific hypothesis that supports the existence of a major décollement — a low-angle thrust fault — below the surface of the LA Basin. “We show that the Newport-Inglewood fault is not only deep-seated but also directly or indirectly connected with the mantle,” Boles said.
“If the décollement existed, it would have to cross the Newport-Inglewood fault zone, which isn’t likely,” he added. “Our findings indicate that the Newport-Inglewood fault is a lot more important than previously thought, but time will tell what the true importance of all this is.”
Study co-authors include Grant Garven of Tufts University; Hilario Camacho of Occidental Oil and Gas Corp.; and John Lupton of the National Oceanic and Atmospheric Administration’s Pacific Marine Environmental Laboratory.
This research was supported by the U.S. Department of Energy’s Office of Science and Office of Basic Energy Sciences and by the NOAA Pacific Marine Environmental Laboratory.
Reference:
J. R. Boles, G. Garven, H. Camacho, J. E. Lupton. Mantle helium along the Newport-Inglewood fault zone, Los Angeles basin, California-A leaking paleo-subduction zone. Geochemistry, Geophysics, Geosystems, 2015; DOI: 10.1002/2015GC005951
Note: The above post is reprinted from materials provided by University of California – Santa Barbara. The original item was written by Julie Cohen.
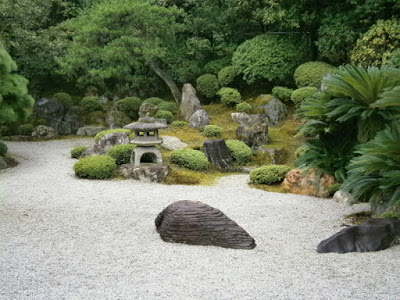
Japanese Garden in Kyoto, a very visible way in which humans ‘Anthropocize’ the biosphere. Credit: University of Leicester
Human beings are pushing the planet in an entirely new direction with revolutionary implications for its life, a new study by researchers at the University of Leicester has suggested.
The research team led by Professor Mark Williams from the University of Leicester’s Department of Geology has published their findings in a new paper entitled ‘The Anthropocene Biosphere’ in The Anthropocene Review.
Professor Jan Zalasiewicz from the University of Leicester’s Department of Geology who was involved in the study explained the research: “We are used to seeing headlines daily about environmental crises: global warming, ocean acidification, pollution of all kinds, looming extinctions. These changes are advancing so rapidly, that the concept that we are living in a new geological period of time, the Anthropocene Epoch — proposed by the Nobel Prize-winning atmospheric chemist Paul Crutzen — is now in wide currency, with new and distinctive rock strata being formed that will persist far into the future.
“But what is really new about this chapter in Earth history, the one we’re living through? Episodes of global warming, ocean acidification and mass extinction have all happened before, well before humans arrived on the planet. We wanted to see if there was something different about what is happening now.”
The team examined what makes the Anthropocene special and different from previous crises in Earth’s history. They identified four key changes:
The homogenization of species around the world through mass, human-instigated species invasions — nothing on this global scale has happened before
One species, Homo sapiens, is now in effect the top predator on land and in the sea, and has commandeered for its use over a quarter of global biological productivity. There has never been a single species of such reach and power previously
There is growing direction of evolution of other species by Homo sapiens
There is growing interaction of the biosphere with the ‘technosphere’ — a concept pioneered by one of the team members, Professor Peter Haff of Duke University — the sum total of all human-made manufactured machines and objects, and the systems that control them
In total, the team suggests that these changes represent a planetary transformation as fundamental as the one that saw the evolution of the photosynthetic microbes which oxygenated the planet 2.4 billion years ago, or that saw the transition from a microbial Earth to one dominated by multicellular organisms half a billion years ago.
Professor Williams added: “We think of major changes to the biosphere as the big extinction events, like that which finished off the dinosaurs at the end of the Cretaceous Period. But the changes happening to the biosphere today may be much more significant, and uniquely are driven by the actions of one species, humans.”
Reference:
M. Williams, J. Zalasiewicz, P. Haff, C. Schwagerl, A. D. Barnosky, E. C. Ellis. The Anthropocene biosphere. The Anthropocene Review, 2015; DOI: 10.1177/2053019615591020
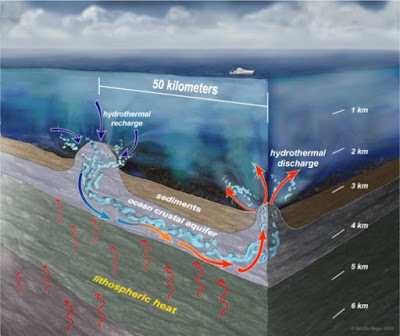
Studies by Andrew Fisher and colleagues have shown that seamounts provide conduits through which enormous quantities of water flow between the ocean and the rocks beneath the seafloor. Credit: Courtesy of Nicolle Rager
Vast quantities of ocean water circulate through the seafloor, flowing through the volcanic rock of the upper oceanic crust. A new study by scientists at UC Santa Cruz, published June 26 in Nature Communications, explains what drives this global process and how the flow is sustained.
About 25 percent of the heat that flows out of the Earth’s interior is transferred to the oceans through this process, according to Andrew Fisher, professor of Earth and planetary sciences at UC Santa Cruz and coauthor of the study. Much of the fluid flow and heat transfer occurs through thousands of extinct underwater volcanoes (called seamounts) and other locations where porous volcanic rock is exposed at the seafloor.
Fisher led an international team of scientists that in the early 2000s discovered the first field site where this process could be tracked from fluid inflow to outflow, in the northeastern Pacific Ocean. In a 2003 paper published in Nature, Fisher and others reported that bottom seawater entered into one seamount, traveled horizontally through the crust, gaining heat and reacting with crustal rocks, then discharged into the ocean through another seamount more than 50 kilometers away.
‘Ever since we discovered a place where these processes occur, we have been trying to understand what drives the fluid flow, what it looks like, and what determines the flow direction,’ Fisher said.
For the new study, first author Dustin Winslow, a UCSC Ph.D. candidate who graduated this month, developed the first three-dimensional computer models showing how the process works. The models reveal a ‘hydrothermal siphon’ driven by heat loss from deep in the Earth and the flow of cold seawater down into the crust and of warmed water up out of the crust.
‘Dustin’s models provide the best, most realistic view of these systems to date, opening a window into a hidden realm of water, rock, and life,’ Fisher said.
The models show that water tends to enter the crust (‘recharge’) through seamounts where fluid flow is easiest due to favorable rock properties and larger seamount size. Water tends to discharge where fluid flow is more difficult due to less favorable rock properties or smaller seamount size. This finding is consistent with field observations suggesting that smaller seamounts are favored as sites of hydrothermal discharge.
‘This modeling result was surprising initially, and we had to run many simulations to convince ourselves that it made sense,’ Winslow said. ‘We also found that models set up to flow in the opposite direction would spontaneously flip so that discharge occurred through less transmissive seamounts. This seems to be fundamental to explaining how these systems are sustained.’
Winslow’s project was funded by the U.S. National Science Foundation through a graduate fellowship and as part of the Center for Dark Energy Biosphere Investigations (C-DEBI). UCSC is a partner in C-DEBI, which is headquartered at the University of Southern California.
Reference:
Dustin M. Winslow, Andrew T. Fisher. Sustainability and dynamics of outcrop-to-outcrop hydrothermal circulation. Nature Communications, 2015; 6: 7567 DOI: 10.1038/ncomms8567
Note: The above post is reprinted from materials provided by University of California – Santa Cruz. The original item was written by Tim Stephens.
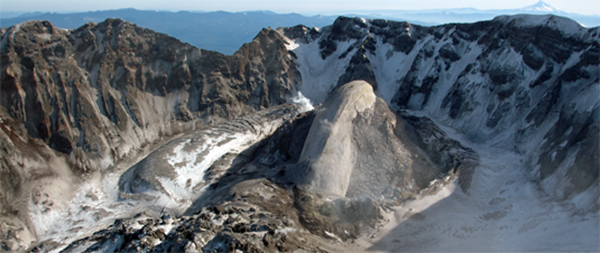
Mount St. Helen Credit: USGS Cascades Volcano Observatory
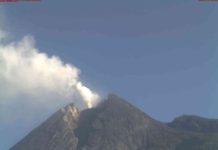
The massive eruption of Mt. St. Helens 35 years ago is one of the largest ever seen in North America. LMU volcanologists now report a retrospective analysis of salts leached from the ash deposited by the volcano on that occasion.
As a consequence of the 1980 eruption of Mt. St. Helens, in the state of Washington, USA, a large area of the Pacific Northwest was covered in volcanic ash. Volcanologists of the LMU group of Professor Donald Dingwell have now carried out a comprehensive review of data reported in several studies of the salt content on this ash. The results, which appear in the “Bulletin of Volcanology” reveal that the range of salt concentrations is more complex than hitherto assumed.
Due to interactions between the ash and the gases released during the eruption, salt crystals formed on the surfaces of the ash particles in the plume. In order to assess the impact of these salts on vegetation and groundwater, the amounts and composition of the salts must be determined. Direct measurements on the salts themselves are difficult but, since the salts are water-soluble, they can be leached from the ash and analyzed in solution. “Several published studies have described the spatial and temporal variability of the salt composition of volcanic deposits around Mt. St. Helens and proposed mechanisms for the interactions between gas and ash in the plume that can account for it,” says Dr. Paul Ayris, first author on the new paper. “The 1980 blast at Mt. St. Helens is the best characterized volcanic eruption in history. Studies of this eruption have laid the foundation for our current understanding of the chemical reactions that occurred in the plume. But now, 35 years later, we wanted to view the eruption from our modern perspective.”
Many of the studies devoted to these salts were based on relatively modest datasets and, as the new study highlights, could not capture the range of natural variability and the full complexity of the ash deposited over a wide region. The authors of the new study have therefore collated data from many studies and reanalyzed them, with a view to characterize the spatial distribution and relative abundances of sulphate and chloride salts in the ash deposits around the volcano. The findings reveal that the spatial distribution of salts is considerably more complex than previously thought. “This more detailed picture of the variation in the salts found in these deposits is compatible with the known chemical and physical properties of the ash deposits, and helps us validate our present understanding of the plume,” says Ayris. “The study therefore represents a significant contribution, and provides a basis for the development of theoretical models that enable us to forecast the impact of ash falls on the environment more accurately, on the scale of forests, farmland or gardens.”
Reference:
“Spatial analysis of Mount St. Helens tephra leachate compositions: implications for future sampling strategies.” Bulletin of Volcanology. DOI: 10.1007/s00445-015-0945-8
Spanish settlement of the Middle Rio Grande Valley in New Mexico changed the way people lived, but a new paper in the journal “The Holocene” by UNM Assistant Professor of Anthropology Emily Jones, suggests the change did not come quickly.
“The Columbian Exchange and landscapes of the Middle Rio Grande Valley, AD 1300-1900” is an examination of the impact of Spanish colonization including what people were eating, and an indication of what animals and plants were abundant in the area.
When the Spanish expeditions came to the Middle Rio Grande Valley in 1598 to establish residence, they found inhabited villages and long standing agricultural practices. The Spanish colonists brought seeds, plant cuttings and domestic livestock with them and use of the plants and animals were readily adopted by the Native Americans.
But Jones says animal bones from archeological sites suggest no immediate major impact on the landscape.
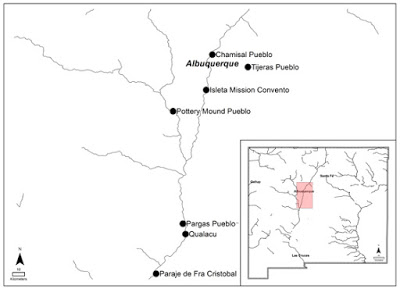
Jones’ research focuses on the “Columbian Exchange” or the transformation of landscapes that came with contact between the old and new world. For this paper she examined archeological faunal materials from a number of historic pueblos, missions and villages – essentially the bones left if the trash heaps to determine the animal portion of historic people’s diets.
Jones found significant amounts of wild game (pronghorn, deer and rabbits) alongside domestic animals up through the late 19th century, suggesting hunting was a major part of life through that time.
“I was expecting to see a turnover in the mammals people ate – a change from wild mammals to introduced domesticates, like sheep, goats and cattle – relatively early in the 17th or early 18th century. You would start with wild fauna which would then be mostly replaced by things like sheep, and goats and cattle,” she said. “What I actually found was that this change doesn’t seem to occur until very late in the game in the late 19th and early 20th century.”
The date on mammals have implications about how vegetation may have changed with Spanish colonization. There has been some debate as to when overgrazing became a problem in the Middle Rio Grande Valley – whether it occurred soon after Spanish colonists brought sheet and cattle in 1598 or if livestock populations took some time to make an impact.
Jones’ data may suggest that widespread overgrazing of the landscape did not occur until the time that rail travel brought many more people into the Middle Rio Grande Valley in the late 19th century – a time when other invasive species such as tumbleweeds also became a problem.
“To me the Columbian exchange was an incredible event. It shaped the world we live in now, causing environments in very different parts of the world to look more similar to each other,” Jones said. “This research project is situated in the larger question of when did that change take place and how – was it gradual or quick? To me, this question is really cool.”
Reference:
“The ‘Columbian Exchange’ and landscapes of the Middle Rio Grande Valley, AD 1300–1900.” The Holocene 0959683615588375, first published on June 3, 2015 DOI: 10.1177/0959683615588375