Home Blog Page 189

Optical approach offers faster, less expensive method for carbon dating

Optical approach offers faster-GeologyPage
A new spectroscopic technique offers ultra-sensitive optical detection of radiocarbon dioxide. The approach shows promise as a measurement tool in many fields, including carbon dating and greenhouse gas detection. Credit: Saverio Bartalini, CNR

Researchers from Istituto Nazionale di Ottica (INO), within Consiglio Nazionale delle Ricerche (CNR), Italy have demonstrated a new compact spectroscopic instrument that offers a highly sensitive optical method for detecting radiocarbon dioxide concentration, which can be used to carbon date fossils and archaeological artifacts.

The instrument, which uses a new approach called saturated-absorption cavity ring-down (SCAR), is described in The Optical Society’s journal for high impact research, Optica. SCAR offers significant time and cost savings compared to the standard approach for carbon dating and could be useful for a host of other applications such as measuring emissions from fossil fuels or certifying the amount of biogenic content in biofuels.

Faster, cheaper carbon dating

Current carbon dating processes require researchers to send a sample to a large facility with an accelerator mass spectrometer and then wait several weeks to get results back. Accelerator mass spectrometry measures the amount of carbon-14, or radiocarbon, present in a sample, which can be used to calculate its age. Around the world, only about 100 facilities house this equipment.

“Accelerator mass spectroscopy can be used to carbon date bones, wood, fabrics or anything of biological origin, pinpointing its age of up to 50,000 years ago,” said Iacopo Galli, a member of the research team. “Using our new technique, we can do something similar but with a lower cost and with a faster delivery time for the results.”

The researchers report that their SCAR instrument can detect radiocarbon dioxide concentration with a precision of 0.4 percent, which approaches the 0.2 percent precision of the best accelerator mass spectrometers. The new technique can deliver results in just two hours, with each test costing about half what it would if conducted using an accelerator mass spectrometer.

The researchers estimate the SCAR instrument is about 100 times smaller and 10 times cheaper than the instrumentation required for accelerator mass spectrometry. Its size and cost could decrease even more once the instrument is converted from its current tabletop version to a more portable commercial prototype.

“With a portable instrument, direct measurements could be conducted on-site, with results returned in a very short time,” Galli said. “This could revolutionize the approach that archaeologists use for carbon dating because they would not have to send sensitive samples away to a lab and wait weeks for a result.”

Improving the environment

The researcher team is also exploring several applications tied to the environment. For example, radiocarbon dioxide concentration measurements can be used to distinguish carbon dioxide created by burning fossil fuels from other sources of carbon dioxide in the atmosphere.

“SCAR instruments could be installed at local facilities across a region to take measurements in different places at the same time, to determine the most important pollution sites,” said Davide Mazzotti, a member of the research team. An initiative supporting carbon pricing was recently announced in December 2015 at the United Nations Conference on Climate Change, suggesting the demand for accurate local pollution-tracking technology could increase in the future. A device such as this could offer a way to tie a monetary cost, or tax, to pollution.

“We developed a very general spectroscopic technique and showed that it can be used to detect radiocarbon dioxide,” said Giovanni Giusfredi, a member of the research team. “In principle, we can use our apparatus to detect many other molecules such as methane, nitrous oxide and other greenhouse gases or chemicals of interest for national security or forensics.”

How it works

The SCAR device detects radiocarbon levels by measuring how laser light interacts with the carbon dioxide that is produced when a given sample is burned. For analysis, the carbon dioxide from a burnt sample is placed into the instrument’s vacuum measurement chamber. There, a light beam emitted from a quantum cascade laser at 4.5 microns — an ideal wavelength for sensitive gas detection — interacts with the carbon dioxide inside a 1-meter-long optical cavity with highly reflective mirrors on each end.

As the light repeatedly bounces between the mirrors, the radiocarbon molecules in the cavity absorb some of the light. The length of time it takes for the light to decay from its initial intensity is used to calculate the concentration of radiocarbon in the gas mixture in the cavity. The highly reflective mirrors create an effective path longer than 5 kilometers for interactions between the light and the gas sample. Even if the absorption is small for a single pass, thousands of passes provide enough absorption to detect even trace amounts of radiocarbon.

“Although the instrument is relatively simple, the performance obtained by our system is a result of many years of studying of the physics of the various optical components,” Giusfredi said. “Our group collaborated with other research groups in the U.S., Japan and Switzerland for the theoretical analysis and to study quantum cascade lasers.”

The researchers are continuing to refine their instrument and explore new applications. One of their next steps is to conduct SCAR analyses of samples that are significant to various fields, such as archaeological artifacts and biofuels, and directly compare these measurements with accelerator mass spectrometry results from the same samples.

Reference:
Iacopo Galli, Saverio Bartalini, Riccardo Ballerini, Marco Barucci, Pablo Cancio, Marco De Pas, Giovanni Giusfredi, Davide Mazzotti, Naota Akikusa, Paolo De Natale. Spectroscopic detection of radiocarbon dioxide at parts-per-quadrillion sensitivity. Optica, 2016; 3 (4): 385 DOI: 10.1364/optica.3.000385

Note: The above post is reprinted from materials provided by The Optical Society.

Geothermal heat contributes to Greenland ice melt

Geothermal heat contributes-GeologyPage
imagix/Shutterstock

An international team that includes University of Montana researcher Jesse Johnson has learned that the Earth’s internal heat enhances rapid ice flow and subglacial melting in Greenland.

Johnson, a UM computer science professor and ice-sheet modeler, helped discover that about half of the ice-covered area in north-central Greenland rests on a thawed bed and that the meltwater is routed to the ocean through a dense hydrological network beneath the ice.

The work was published in the April 2016 issue of Nature Geoscience. “The strength of this paper is that many different lines of reasoning about data lead to the same conclusion,” Johnson said. “I was able to demonstrate that the ice velocities observed by satellite are nearly impossible to explain without the geothermal anomaly discovered here. Glaciologists have long suspected the anomaly exists, but this work quantifies its location and degree and explains why it is there.”

Johnson collaborated with a group led by Irina Rogozhina and Alexey Petrunin from the GFZ German Research Centre for Geosciences. The research has for the first time proved a strong coupling between the processes deep in the Earth’s interior with ice flow dynamics.

Deep under the Greenland Ice Sheet are regions of intense geothermal heat originating in the distant geological past. This heat causes Greenland’s ice to melt from below and flow rapidly. The new study identifies a west-to-east zone of northern Greenland having anomalously high heat.

Johnson said this anomaly explains observations from radar and ice core drilling data of widespread melting beneath the ice sheet and increased sliding at the base of the ice that drives the rapid ice flow over a distance of 750 kilometers from the summit area of the Greenland ice sheet to the North Atlantic Ocean.

The North Atlantic Ocean is an area of active plate tectonics. Between 35 million and 85 million years ago, tectonic processes moved Greenland over an area of abnormally hot mantle material now responsible for the volcanic activity of Iceland. The mantle material heated and thinned Greenland’s crust at depth, producing a strong geothermal anomaly that spans a quarter of the land area of Greenland.

“This ancient and sustained source of heat has created a region having warmer, softer ice and abundant subglacial meltwater, lubricating the base of the ice and making it flow rapidly,” Johnson said.

“The geothermal anomaly which resulted from the Icelandic mantle-plume tens of millions of years ago is an important motor for today’s hydrology under the ice sheet and for the high flow-rate of the ice,” Rogozhina said. “This in turn broadly influences the dynamic behavior of ice masses and must be included in studies of the future response to climate change.”

These secrets of Greenland’s past – hidden by an ice sheet as much as 3 kilometers deep – are now revealed by researchers using an innovative combination of computer models and satellite, airborne and in-situ data. The location and orientation of the zone of elevated geothermal heat flow corresponds to where Greenland moved over Iceland’s mantle plume and provides an independent test for models of the formation of the North Atlantic ocean, revitalizing a three-decades-long debate.

Johnson said the study demonstrates an unexpected link between the deep geothermal history of the Earth and ice sheet dynamics. It shows that the controls on ice sheet dynamics span a huge range of timescales, from the month-by-month changes of the ice cover to the multimillion-year epochs over which the Earth’s mantle and tectonic plates evolve.

Note: The above post is reprinted from materials provided by The University of Montana.

Mohs Hardness Scale

Mohs scale of mineral hardness-GeologyPage

Mohs scale

The Mohs scale of mineral hardness is a qualitative ordinal scale that characterizes the scratch resistance of different minerals through the ability of a harder material to scratch a softer material. It was created by the German geologist and mineralogist Friedrich Mohs in 1812 and is one of several material science definitions of hardness, some of which are more quantitative.

About Hardness Tests

The hardness test developed by Friedrich Mohs was the first known test to assess resistance of a material to scratching. It is a very simple but inexact comparative test. Perhaps its simplicity has enabled it to become the most widely used hardness test.

Since the Mohs Scale was developed in 1812, many different hardness tests have been invented. These include tests by Brinell, Knoop, Rockwell, Shore and Vickers. Each of these tests uses a tiny “indenter” that is applied to the material being tested with a carefully measured amount of force. Then the size or the depth of the indentation and the amount of force are used to calculate a hardness value.

Why are there so many different hardness tests? The type of test used is determined by the size, shape and other characteristics of the specimens being tested. Although these tests are quite different from the Mohs test there is some correlation between them.

Usage

Despite its simplicity and lack of precision, the Mohs scale is highly relevant for field geologists, who use the scale to roughly identify minerals using scratch kits. The Mohs scale hardness of minerals can be commonly found in reference sheets. Reference materials may be expected to have a uniform Mohs hardness.

The Mineral Hardness Scale

The mineral hardness scale of Mohs is based on the ability of one natural mineral sample to visibly scratch another mineral. All different minerals are the samples of matter used by Mohs. Minerals are naturally found pure substances. Rocks consist of one or more minerals.

Diamonds are at the top of the scale as the hardest known naturally occurring substance when designing the scale. A material’s hardness is measured against the scale by finding the hardest material that can scratch the given material and/or the softest material that can scratch the given material.

“Scratching” a material for Mohs scale purposes means creating visible to the naked eye non – elastic dislocations. Materials lower on the Mohs scale can often create microscopic, non – elastic dislocations on materials with a higher number of Mohs. While these microscopic dislocations are permanent and sometimes detrimental to the structural integrity of the harder material, for determining a Mohs scale number, they are not considered “scratches.”

Mohs Hardness Scale


Mohs Hardness Scale
Mineral
Hardness
Talc
1
Gypsum
2
Calcite
3
Fluorite
4
Apatite
5
Orthoclase
6
Quartz
7
Topaz
8
Corundum
9
Diamond
10


Mohs Hardness of Common Minerals

Alphabetical
Mineral
Mohs Hardness
Anhydrite 3 to 3.5
Apatite 5
Arsenopyrite 5.5 to 6
Augite 5.5 to 6
Azurite 3.5 to 4
Barite 2.5 to 3.5
Bauxite 1 to 3
Beryl 7.5 to 8
Biotite 2.5 to 3
Bornite 3 to 3.25
Calcite 3
Cassiterite 6 to 7
Chalcocite 2.5 to 3
Chalcopyrite 3.5 to 4
Chlorite 2 to 2.5
Chromite 5.5 to 6
Chrysoberyl 8.5
Cinnabar 2 to 2.5
Copper 2.5 to 3
Cordierite 7 to 7.5
Corundum 9
Cuprite 3.5 to 4
Diamond 10
Diopside 5.5 to 6.5
Dolomite 3.5 to 4
Enstatite 5 to 6
Epidote 6 to 7
Fluorite 4
Galena 2.5 to 2.75
Garnet 6.5 to 7.5
Glauconite 2
Gold 2.5 to 3
Graphite 1 to 2
Gypsum 1.5 to 2
Halite 2 to 2.5
Hematite 5 to 6.5
Hornblende 5 to 6
Ilmenite 5 to 6
Jadeite 6.5 to 7
Kyanite 4.5 to 5 or 7
Limonite 1 to 5
Magnesite 3.5 to 5
Magnetite 5 to 6.5
Malachite 3.5 to 4
Marcasite 6 to 7.5
Molybdenite 1 to 2
Monazite 5 to 5.5
Muscovite 2 to 3
Nepheline 5.5 to 6
Nephrite 5 to 6
Olivine 6.5 to 7
Orthoclase 6 to 6.5
Plagioclase 6 to 6.5
Prehnite 6 to 6.5
Pyrite 6 to 6.5
Pyrophyllite 1 to 2
Pyrrhotite 3.5 to 4.5
Quartz 7
Rhodochrosite 3.5 to 4
Rhodonite 5.5 to 6.5
Rutile 6 to 6.5
Serpentine 3 to 5
Siderite 3.5 to 4.5
Sillimanite 6.5 to 7.5
Silver 2.5 to 3
Sodalite 5.5 to 6
Sphalerite 3.5 to 4
Spinel 7.5 to 8
Spodumene 6.5 to 7
Staurolite 7 to 7.5
Sulfur 1.5 to 2.5
Sylvite 2
Talc 1
Titanite 5 to 5.5
Topaz 8
Tourmaline 7 to 7.5
Turquoise 5 to 6
Uraninite 5 to 6
Witherite 3 to 3.5
Wollastonite 4.5 to 5.5
Zircon 7.5
Zoisite 6 to 7
Decreasing Hardness
Mineral
Mohs Hardness
Diamond 10
Corundum 9
Chrysoberyl 8.5
Topaz 8
Beryl 7.5 to 8
Spinel 7.5 to 8
Zircon 7.5
Cordierite 7 to 7.5
Staurolite 7 to 7.5
Tourmaline 7 to 7.5
Quartz 7
Garnet 6.5 to 7.5
Jadeite 6.5 to 7
Sillimanite 6.5 to 7.5
Olivine 6.5 to 7
Spodumene 6.5 to 7
Marcasite 6 to 7.5
Cassiterite 6 to 7
Epidote 6 to 7
Zoisite 6 to 7
Orthoclase 6 to 6.5
Plagioclase 6 to 6.5
Prehnite 6 to 6.5
Pyrite 6 to 6.5
Rutile 6 to 6.5
Diopside 5.5 to 6.5
Rhodonite 5.5 to 6.5
Arsenopyrite 5.5 to 6
Augite 5.5 to 6
Chromite 5.5 to 6
Hematite 5.5 to 6.5
Nepheline 5.5 to 6
Sodalite 5.5 to 6
Magnetite 5 to 6.5
Enstatite 5 to 6
Hornblende 5 to 6
Ilmenite 5 to 6
Nephrite 5 to 6
Turquoise 5 to 6
Uraninite 5 to 6
Monazite 5 to 5.5
Titanite 5 to 5.5
Apatite 5
Wollastonite 4.5 to 5.5
Kyanite 4.5 to 5 or 7
Fluorite 4
Magnesite 3.5 to 5
Pyrrhotite 3.5 to 4.5
Siderite 3.5 to 4.5
Azurite 3.5 to 4
Chalcopyrite 3.5 to 4
Cuprite 3.5 to 4
Dolomite 3.5 to 4
Malachite 3.5 to 4
Rhodochrosite 3.5 to 4
Sphalerite 3.5 to 4
Serpentine 3 to 5
Anhydrite 3 to 3.5
Witherite 3 to 3.5
Bornite 3 to 3.25
Calcite 3
Barite 2.5 to 3.5
Biotite 2.5 to 3
Chalcocite 2.5 to 3
Copper 2.5 to 3
Gold 2.5 to 3
Silver 2.5 to 3
Galena 2.5 to 2.75
Muscovite 2 to 3
Chlorite 2 to 2.5
Cinnabar 2 to 2.5
Halite 2 to 2.5
Glauconite 2
Sylvite 2
Sulfur 1.5 to 2.5
Gypsum 1.5 to 2
Limonite 1 to 5
Bauxite 1 to 3
Graphite 1 to 2
Molybdenite 1 to 2
Pyrophyllite 1 to 2
Talc 1


Mohs Hardness of Common Objects
Fingernail
2 to 2.5
Copper
3
Nail
4
Glass
5.5
Knife blade
5 to 6.5
Steel file
6.5
Streak plate
6.5 to 7
Quartz
7


Reference:
Wikipedia: Mohs scale of mineral hardness

Massive Ancient Tectonic Slab Found Below the Indian Ocean

Massive Ancient Tectonic Slab-GeologyPage
Seismic wave velocity structure in the deep Earth revealed through seismic tomography. Earthquakes generate seismic energy near their epicenters (yellow markers), and the energy is recorded at seismic stations around the world (red markers). Seismic waves (depicted as yellow rays emanating from an earthquake beneath Spain) are disrupted as they travel through fast (blue) and slow (red) structures in the Earth. By mapping these anomalous structures on a global scale, researchers have uncovered a previously unidentified tectonic plate that sank into Earth’s mantle more than 130 million years ago beneath the southern Indian Ocean. Credit: Nathan Simmons, using MATLAB.

A team of researchers recently discovered an ancient relic hidden within Earth: a tectonic plate resting beneath the southern Indian Ocean. Scientists have found other tectonic plates that sank below Eurasia and North America, but here Simmons et al. describe the unique structure of this newly discovered slab, which they named the Southeast Indian Slab (SEIS).

The slab has at least one feature scientists have rarely seen before: It maintains its slab-like structure all the way from the upper mantle near Earth’s crust down to the region where the mantle meets the planet’s superheated core. The Farallon plate beneath North America is a well-known example of this—but it was expected to exist and sank much more recently than the SEIS. In addition, not only does the SEIS traverse the entire mantle, but it also becomes more vertical along one end, so much so that it stands almost vertically between the crust and core along the eastern edge, whereas the western portion is more horizontal.

Researchers can make out structures beneath Earth’s crust by examining the speed at which seismic waves generated by earthquakes and similar Earth-shattering events—known as P and S waves—travel through Earth. Here the researchers used wave data from 12,607 seismic events dating back to the 1960s, collected by 7783 seismic stations around the world, to develop the model that identified the ancient slab.

Once this tectonic slab was identified, the team looked at the region’s tectonic history over millions of years to determine where and when this plate was on the surface. They determined that the slab was once along the eastern portion of the early supercontinent of Gondwana. Then, sometime during the Triassic or Jurassic period, which stretched from 250 million years ago to 145 million years ago, the slab plunged underneath another plate. They further concluded that the subduction, or the sinking of the Southeast Indian Slab beneath another plate, terminated around 130 to 140 million years ago in the Mesozoic era, around the same time that the tectonic plates under eastern Gondwana began to separate and split up the continent.

Tectonic plates usually sink down into the mantle at a rate of about 1 centimeter per year or more; they don’t necessarily melt but instead bunch up at the base of the mantle and eventually assimilate or become undetectable as their temperature increases. However, if the researchers accurately estimated the timing of their newly discovered slab’s subduction, this slab must have stalled in a transition zone before descending deeper down into the mantle, allowing the slab to persist in the mantle longer than any other known plate.

Reference:
N. A. Simmons, S. C. Myers, G. Johannesson, E. Matzel, S. P. Grand. Evidence for long-lived subduction of an ancient tectonic plate beneath the southern Indian Ocean. DOI:10.1002/2015GL066237

Note: The above post is reprinted from materials provided by Eos-American Geophysical Union. The original article was written by Cody Sullivan.

240-million-year-old fossils indicate how dinosaurs grew from hatchlings to adults

240-million-year-old fossils indicate-GeologyPage
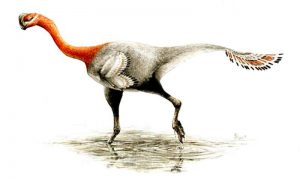
In this artist’s rendering of the Asilisaurus kongwe, the animal is shown as it would walk and move about. The stripes are artistic license, although the animal’s ‘proto-feathers’ are likely. ‘We have good reason to think they probably had some sort of simple feather-like structures … but we haven’t found evidence of this yet,” said Christopher Griffin, a geoscience graduate student at Virginia Tech. Credit: Painting by Andrey Atuchin

Paleontologists at Virginia Tech have found that muscle-scarred fossil leg bones of one of the closest cousins of dinosaurs that lived approximately 240 million years ago can shine new light on a large unknown: How early dinosaurs grew from hatchlings to adults.

Published this month in the Journal of Vertebrate Paleontology, the findings are surprising: dinosaurs and their close relatives had much more variation in growth patterns then ever expected, and this variation does not appear to be related to differences between males and females.

Lead author Christopher Griffin, a geosciences master’s student in the College of Science, focused his study on muscle scars etched into the fossil bones of the Asilisaurus kongwe, a dinosaur cousin that lived roughly 10 million years earlier than the oldest known dinosaurs.

“Variation in muscle scars were thought to indicate sexual difference in early dinosaurs, but we know that in many modern animals these features are related to growth, not sex,” said Griffin of Redding, California. “Because of this, we thought that similar variations that we saw in Asilisaurus would not turn out to split into two groups, which would be evidence for a sex difference, and instead be more on a spectrum. As we looked at more Asilisaurus fossils of different sizes, because we had such a great sample size, we found this to be supported: with a large sample size, they don’t split into two clean groups.”

Added Sterling Nesbitt, study co-author and an assistant professor with the Virginia Tech Department of Geosciences: “The earliest dinosaurs grew just like their closest relatives, and there are very few features that make dinosaurs unique from their closest relatives.”

Asilisaurus lived during the Triassic Period, roughly 240 million years ago in present-day Africa. With four legs and a long tail, the animal was about the size of a Labrador retriever, and likely maxed at 65 pounds, according to previous studies of the animal. Its exterior skin appearance remains unknown.

Fossils of Asilisaurus kongwe — a combination of Swahili and Greek works meaning “ancient ancestor reptile” — are vital because a large number of specimens were found, largely intact and varying in size and age. Such findings are so rare that paleontologists have struggled with understanding how the first dinosaurs grew, as most species of early dinosaur are known from only a handful of fossils.

The Asilisaurus fossils initially were discovered during a 2007 expedition in southern Tanzania, with additional field excursions taking place for the next eight years.

The length of the field excursions and the number of specimens of fossils resulted in several smaller individual specimens appearing to be more mature than larger finds, and individuals of the same size appeared to be at different stages of growth.

In studying the anatomy and bone tissue of Asilisaurus and how each changed during growth, Griffin and Nesbitt found the although these individual animals lived in roughly the same location at the same time, they grew differently. Griffin compared this finding to any modern family with siblings and cousins differing in height or body mass, for instance, one brother smallish, and another taller; one naturally muscular, another prone to thinness.

Griffin and Nesbitt studied bone scars on the Asilisaurus leg bones, focusing on spots where muscles and tendons attach to bone.

The more mature an individual was at death, the larger its bone scars appeared. As with any animal or person, an individual skeleton goes from possessing few scars to possessing many during life, with scars appearing in a particular order as the age of the individual increases.

Findings show that except for the smallest and largest individuals, which are the least and most mature, size is a poor predictor of skeletal maturity in Asilisaurus, and therefore likely in early dinosaurs as well.

Further, similar differences in early dinosaurs had been thought to represent a difference in sex, with more “mature” individuals representing one sex and more “immature” individuals representing another.

“Our study includes more individuals and more bone scars, and with this increase in sample size we found that individuals fall on a trajectory that is more similar to maturity difference than sexual difference,” added Griffin. “This suggests that similar variation in bone scars in early dinosaurs is variation in growth, not male and female difference. Because this variation appears to be widespread among early dinosaurs and their closest relatives, it is likely that high variation in growth between individuals characterized the most recent common ancestor of Asilisaurus and all dinosaurs.”

Griffin’s initial work on Asilisaurus began when he was a Cedarville (Ohio) University undergraduate intern at the Field Museum of Natural History in Chicago. Although he did not participate in the 2007-2015 Tanzanian digs, Griffin, along with Nesbitt, studied fossils from those efforts. Nesbitt participated and led one of the field excursions in which Asilisaurus specimens were collected.

Asilisaurus is part of a group of reptiles, the silesaurids, that are close cousins of dinosaurs. Asilisaurus grew similarly to living crocodilians in that both possess differences between individuals in growth patterns.

Yet that growth was much faster in Asilisaurus, closer to the growth rate of birds, rather than living crocodiles. As with dinosaurs, living birds are considered a close living relative of Asilisaurus.

Griffin used a computer program to virtually reconstruct growth sequences derived from bone scar evidence, and then painstakingly sliced upper leg bone Asilisaurus fossil samples into cross-sections. He studied the microscope-thin slivers of bone tissue microstructures, determining each specimen’s relative age and pace of its growth.

“I’m fascinated by how much we can learn about the past through animals that are so unlike anything that we have today, and how that can help us understand how today’s world came to be the way it is,” he said.

Funding for the study came from the National Science Foundation’s Research Experience for Undergraduates program and was supported by Virginia Tech.

Reference:
C. T. Griffin, Sterling J. Nesbitt. The femoral ontogeny and long bone histology of the Middle Triassic (?late Anisian) dinosauriformAsilisaurus kongweand implications for the growth of early dinosaurs. Journal of Vertebrate Paleontology, 2016; e1111224 DOI: 10.1080/02724634.2016.1111224

Note: The above post is reprinted from materials provided by Virginia Tech.

Early Mars bombardment likely enhanced life-supporting habitat

Early Mars bombardment likely-GeologyPage
Ancient impacts on Mars likely enhanced climate conditions for life. Credit: NASA

The bombardment of Mars some 4 billion years ago by comets and asteroids as large as West Virginia likely enhanced climate conditions enough to make the planet more conducive to life, at least for a time, says a new University of Colorado Boulder study.

CU-Boulder Professor Stephen Mojzsis said if early Mars was as barren and cold as it is today, massive asteroid and comet impacts would have produced enough heat to melt subsurface ice. The impacts would have produced regional hydrothermal systems on Mars similar to those in Yellowstone National Park, which today harbor chemically powered microbes, some of which can survive boiling in hot springs or inhabiting water acidic enough to dissolve nails.

Scientists have long known there was once running water on Mars, as evidenced by ancient river valleys, deltas and parts of lake beds, said Mojzsis. In addition to producing hydrothermal regions in portions of Mars’ fractured and melted crust, a massive impact could have temporarily increased the planet’s atmospheric pressure, periodically heating Mars up enough to “re-start” a dormant water cycle.

“This study shows the ancient bombardment of Mars by comets and asteroids would have been greatly beneficial to life there, if life was present,” said Mojzsis, a professor in the geological sciences department. “But up to now we have no convincing evidence life ever existed there, so we don’t know if early Mars was a crucible of life or a haven for life.”

Published in Earth and Planetary Science Letters, the study was conducted by Mojzsis and Oleg Abramov, a researcher at the U.S. Geological Survey in Flagstaff, Arizona and a former CU-Boulder research scientist under Mojzsis.

Much of the action on Mars occurred during a period known as the Late Heavy Bombardment about 3.9 billion years ago when the developing solar system was a shooting gallery of comets, asteroids, moons and planets. Unlike Earth, which has been “resurfaced” time and again by erosion and plate tectonics, heavy cratering is still evident on Mercury, Earth’s moon and Mars, Mojzsis said.

Mojzsis and Abramov used the Janus supercomputer cluster at the University of Colorado Computing facility for some of the 3-D modeling used in the study. They looked at temperatures beneath millions of individual craters in their computer simulations to assess heating and cooling, as well as the effects of impacts on Mars from different angles and velocities. A single model comprising the whole surface of Mars took up to two weeks to run on the supercomputer cluster, said Mojzsis.

The study showed the heating of ancient Mars caused by individual asteroid collisions would likely have lasted only a few million years before the Red Planet – about one and one-half times the distance to the sun than Earth – defaulted to today’s cold and inhospitable conditions.

“None of the models we ran could keep Mars consistently warm over long periods,” said Mojzsis.

While Mars is believed to have spent most of its history in a cold state, Earth was likely habitable over almost its entire existence. A 2009 study by Mojzsis and Abramov showed that the Late Heavy Bombardment period in the inner solar system nearly 4 billion years ago did not have the firepower to extinguish potential early life on Earth and may have even given it a boost if it was present.

“What really saved the day for Earth was its oceans,” Mojzsis said. “In order to wipe out life here, the oceans would have had to have been boiled away. Those extreme conditions in that time period are beyond the realm of scientific possibility.”

The new Mars study was funded by NASA and the John Templeton Foundation. Mojzsis recently received an $800,000 grant from the Foundation for Applied Molecular Evolution in Alachua, Florida made possible by the Templeton Foundation to better understand early Earth and the beginning of life before about 4 billion years ago.

“Studies of Mars provide us with valuable information about our own place in the solar system,” he said. “Our next steps are to model similar bombardment on Mercury and Venus to better understand the evolution of the inner solar system and apply that knowledge to studies of planets around other stars.”

Mojzsis will meet with scientists from the California Institute of Technology and NASA’s Jet Propulsion Laboratory in Pasadena next month to discuss possible landing sites and research targets for the upcoming Mars 2020 rover mission. Mars 2020 will carry instruments to seek out past life or present life, hunt for habitable areas and demonstrate technologies for use on future robotic and human missions to Mars.

Note: The above post is reprinted from materials provided by University of Colorado at Boulder.

Sweet technique finds cause of sour oil and gas

Sweet technique finds-GeologyPage
This is an illustration of BIOCIDE 1. Credit: Illustration by Jason Gaspar/Rice University

In at least one — and probably many — oil and gas drilling operations, the use of biocides to prevent the souring of hydrocarbons wastes money and creates an unnecessary environmental burden, according to researchers at Rice University.

The Rice lab of environmental engineer Pedro Alvarez reported that soured hydrocarbons found in the Bakken Formation underneath the Northwest United States and Canada are caused by primarily geochemical reactions rather than microbial ones; the researchers questioned the need to pump costly biocides into the well to kill sulfide-producing microbes.

The team’s finding offers a way to cut costs at wellheads where biocides may be unnecessary while keeping them out of the environment, where they may promote the development of biocide-resistant bacteria, Alvarez said.

The research appears in the American Chemical Society journal Environment Science and Technology Letters.

Soured hydrocarbons are those with high concentrations of hydrogen sulfide gas. The hydrogen sulfide gives oil and natural gas the smell of rotten eggs, can be toxic to breathe and is highly corrosive. For this reason, the gas has to be removed from crude oil before it can be transported or refined.

Curtailing the use of biocides when the source of souring is not from microbes would reduce operation costs and mitigate potential impacts to microbial ecosystems, Alvarez said.

The Rice-led team set out to solve a long-standing puzzle over what in an individual formation makes hydrocarbons go sour. Either microbial life or the geochemical environment can catalyze the reaction, but engineers are rarely able to determine which is happening.

Alvarez and his co-authors developed an improved map of temperatures to about 2 miles below the surface in eight representative Bakken Formation fracture wells. They showed that downhole temperatures in the formation are equal to or exceed the upper known temperature limit — 252 degrees Fahrenheit — for microorganisms’ survival.

The team also analyzed isotopes of sulfur isolated from hydrogen sulfide taken from the wells. They found all of the isotopes tested suggested geochemical origins. Water samples from the same wells failed to yield DNA concentrations that would indicate the presence of microorganisms.

“The combination of temperature, sulfur isotope and microbial analyses makes scientific, environmental and financial sense,” said Jason Gaspar, a Rice graduate student and lead author of the paper. “Using our method, we could characterize hydrogen sulfide for dozens of wells in a given shale play for less than the cost of adding biocide to one well alone.”

Reference:
Jason Gaspar, Drew Davis, Carlos Camacho, and Pedro J. J. Alvarez, Biogenic versus Thermogenic H2S Source Determination in Bakken Wells: Considerations for Biocide Application. DOI: 10.1021/acs.estlett.6b00075

Note: The above post is reprinted from materials provided by Rice University.

US hands over looted dinosaur fossils to Mongolia

US hands over looted dinosaur-GeologyPage
People take pictures of Mongolian fossils before a Repatriation ceremony in New York on April 5, 2016

The United States on Tuesday handed back to Mongolia fossil remains of six species of dinosaur smuggled out of the country and impounded by agents in New York and Utah.

The largest item was the skull of an Alioramus, an exceptionally rare dinosaur believed to have roamed the Gobi Desert 66 to 70 million years ago.

A relative of the more widely known Tyrannosaurus, only two specimens are reported in scientific literature, both of them from Mongolia. US authorities described the fossil as the most complete Alioramus skull yet discovered.

The skull was confiscated by customs after being shipped from France with false papers claiming it was a cheap replica, US authorities said. The shipper later submitted forged Mongolian export documents, officials added.

Mongolia determined that fossils are national property in 1924, and their export is strictly forbidden.

Tuesday’s ceremony, hosted by the US attorney for Brooklyn, is the latest in a series of returns of fossils to Mongolia in recent years, including a Tarbosaurus bataar dating back 70 million years.

“We are proud of our role in restoring this rich paleontological heritage to the Mongolian people and taking these cultural treasures from the hands of looters and smugglers,” said Robert Capers, US attorney for Brooklyn.

Before Tuesday, 23 dinosaur fossils had been repatriated to Mongolia from the United States in the last three years, said Mongolia’s ambassador to the United States, Altangerel Bulgaa.

Mongolia paleontologist Bolortsetseg Minjin described the Alioramus as an extremely rare dinosaur and said only two specimens reported in the scientific literature, and both from Mongolia.

Note: The above post is reprinted from materials provided by AFP.

New type of dinosaur eggs found from Early Cretaceous of Gansu Province, China

New type of dinosaur eggs found-GeologyPage
Fig.1 Eggshells of Polyclonoolithus yangjiagouensis Credit: Image by XIE Junfang

Dinosaur eggs from the Lower Cretaceous are worldwide rare as compared to those from Upper Cretaceous deposits. In China, they were only reported in Liaoning Province. In a paper published in the latest issue of Vertebrata PalAsiatica, paleontologists described a new type of dinosaur eggs from the Lower Cretaceous Hekou Group in the Lanzhou-Minhe Basin, northwestern China, and established a new oogenus and a new oospecies, within a new oofamily. This finding has important implications for understanding the diversity and the geological and geographical distribution of Early Cretaceous dinosaur eggs in China, as well as the evolution of dinosaur eggshell structure.

The new specimen is an incomplete and highly fragmented egg, discovered in outcrops near the border of Yongjing and Lintao counties, in the central region of the Lower Cretaceous Lanzhou-Minhe Basin. The Lanzhou-Minhe Basin is located on the border of Gansu and Qinghai provinces, and represents a typical Mesozoic-Cenozoic intracontinental rift basin in western China. The Early Cretaceous outcrops in Gansu Province have yielded numerous dinosaur skeleton remains and tracks, but dinosaur eggs have not been reported so far.

The new oospecies, Polyclonoolithus yangjiagouensis, can be distinguished from other known dinosaur eggs by the combination of eggshell micro-features, such as branched eggshell units lacking a compact layer near the outer surface, interlocking or isolated multi-angular eggshell units as viewed in tangential sections, and irregular pore canals. Researchers attributed it to a new oofamily, Polyclonoolithidae.

“Dinosaur eggs from China largely come from the Late Cretaceous deposits, with occasional reports from the Early Cretaceous in Liaoning Province, northeastern China. The new discovery expands the geological and geographical distribution of the fossil record of dinosaur eggs in China and may reveal the origin of eggshell microstructures of spheroolithid eggs”, said Dr. ZHANG Shukang, corresponding author of the study at the Institute of Vertebrate Paleontology and Paleoanthropology (IVPP), Chinese Academy of Sciences.

“The new oofamily Polyclonoolithidae shares a close relationship with the oofamilies Dendroolithidae, Dictyoolithidae and Similifaveoloolithidae. It may represents a more basic type of dinosaur egg, which had been extinct in Late Cretaceous. The discovery of this new oofamily possibly indicates there is an unknown dinosaur egg fauna preserved in the Early Cretaceous deposits of China. It has the same eggshell formation mechanism as that of dendroolithid, dictyoolithid and faveoloolithid eggs, and shows some relationships with spheroolithid eggs. It may reveal the origin of eggshell microstructures of spheroolithid eggs”, said XIE Junfang, lead author of the study, Zhejiang Museum of Natural History, Hangzhou.

Fig.2 Eggshell microstructure of Polyclonoolithus yangjiagouensis. Credit: XIE Junfang

Reference:
New Type of Dinosaur Eggs Found from Early Cretaceous of Gansu Province, China. Vertebrata PalAsiatica

Note: The above post is reprinted from materials provided by Chinese Academy of Sciences.

Earth’s internal heat drives rapid ice flow, subglacial melting in Greenland

Earth's internal heat drives rapid -GeologyPage
Conceptual view of the interplay between the mantle and the Greenland Ice Sheet across the plume track Credit: A. Petrunin, GFZ

To understand Greenland’s ice of today researchers have to go far back into Earth’s history. The island’s lithosphere has hot depths which originate in its distant geological past and cause Greenland’s ice to rapidly flow and melt from below. An anomaly zone crosses Greenland from west to east where present-day flow of heat from Earth’s interior is elevated. With this anomaly, an international team of geoscientists led by Irina Rogozhina and Alexey Petrunin from the GFZ German Research Centre for Geosciences could explain observations from radar and ice core drilling data that indicate a widespread melting beneath the ice sheet and increased sliding at the base of the ice that drives the rapid ice flow over a distance of 750 kilometres from the summit area of the Greenland ice sheet to the North Atlantic Ocean.

The North Atlantic Ocean is an area of active plate tectonics. Between 80 and 35 million years ago tectonic processes moved Greenland over an area of abnormally hot mantle material that still today is responsible for the volcanic activity of Iceland. The mantle material heated and thinned Greenland at depth producing a strong geothermal anomaly that spans a quarter of the land area of Greenland. This ancient and long-lived source of heat has created a region where subglacial meltwater is abundant, lubricating the base of the ice and making it flow rapidly. The study indicates that about a half of the ice in north-central Greenland is resting on a thawed bed and that the meltwater is routed to the ocean through a dense hydrological network beneath the ice.

The team of geoscientists has now, for the first time, been able to prove strong coupling between processes deep in Earth’s interior with the flow dynamics and subglacial hydrology of large ice sheets: “The geothermal anomaly which resulted from the Icelandic mantle-plume tens of millions of years ago is an important motor for today’s hydrology under the ice sheet and for the high flow-rate of the ice,” explains Irina Rogozhina. “This, in turn, broadly influences the dynamic behavior of ice masses and must be included in studies of the future response to climate change.”

These secrets of Greenland’s past have been hidden by the 3 km thick ice sheet covering the landmass and are now revealed by the researchers using an innovative combination of computer models and data sets from seismology, gravity measurements, ice core drilling campaigns, radar sounding, as well as both airborne, satellite and ground-based measurements on the thickness of the ice cover. The location and orientation of the zone of elevated geothermal heat flow shows where Greenland moved over the Iceland mantle plume.

This unexpected link between hotspot history and ice sheet behavior shows that the influences on ice sheets span a huge range of timescales from the month by month changes of the ice cover to the multi-million year epochs over which Earth’s mantle and tectonic plates evolve. Besides this, the results of the study provide an independent test for models of the opening of the North Atlantic which after a three-decade-long debate still is not fully understood.

Reference:
Irina Rogozhina, Alexey G. Petrunin, Alan P. M. Vaughan, Bernhard Steinberger, Jesse V. Johnson, Mikhail K. Kaban, Reinhard Calov, Florian Rickers, Maik Thomas, Ivan Koulakov. Melting at the base of the Greenland ice sheet explained by Iceland hotspot history. Nature Geoscience, 2016; DOI: 10.1038/NGEO2689

Note: The above post is reprinted from materials provided by Helmholtz Centre Potsdam – GFZ German Research Centre for Geosciences.

Vibrations make large landslides flow like fluid

Vibrations make large landslides-GeologyPage
This 1994 landslide in Mesa County, Colorado contained 30 million cubic meters or rock and ran out for 2.8 miles. New research helps explain how these large slides are able to run out so far. Vibrations within large slides cause them to flow like a fluid. Credit: Jon White/Colorado Geological Survey

A new study may finally explain why some landslides travel much greater distances than scientists would normally expect. A team of researchers used a sophisticated computer model to show that vibrations generated by large slides can cause tons of rock to flow like a fluid, enabling the rocks to rumble across vast distances.

The research, by geoscientists at Brown University, Purdue University and the University of Southern California, is described in the Journal of Geophysical Research: Earth Surface.

The “runout” distance of most landslides — the distance debris travels once it reaches flat land — tends to be about twice the vertical distance that the slide falls. So if a slide breaks loose a half-mile vertically up a slope, it can be expected to run out about a mile. But “long-runout” landslides, also known as sturzstroms, are known to travel horizontal distances 10 to 20 times further than they fall, according to Brandon Johnson, an assistant professor of earth, environmental and planetary sciences at Brown and the new study’s lead author.

“There are a few examples where these slides have devastated towns, even when they were located at seemingly safe distances from a mountainside,” said Johnson, who started studying these slides as a student of Jay Melosh, distinguished professor of earth, atmospheric and planetary sciences and physics at Purdue University.

One such example was a slide in 1806 that slammed into the village of Goldau, Switzerland, and claimed nearly 500 lives.

“It has been known for more than a century that very large, dry landslides travel in a fluid-like manner, attaining speeds of more than 100 miles per hour, traveling tens to hundreds of kilometers from their sources and even climbing uphill as they overwhelm surprisingly large areas,” said Melosh, who was a part of the research team. “However, the mechanism by which these very dry piles of rock obtained their fluidity was a mystery.”

Scientists developed several initial hypotheses. Perhaps the slides were floating on a cushion of air, or perhaps they ran atop a layer of water or ice, which would lower the friction they encountered. But the fact that these types of landslides also occur on dry, airless bodies like the Moon cast doubt on those hypotheses.

In 1979, Melosh proposed a mechanism called “acoustic fluidization” to explain these long runouts. Slides of sufficient size, Melosh proposed, would generate vibrational waves that propagate through the rock debris. Those vibrations reduce the effect of friction acting on the slide, enabling it to travel further than smaller slides, which don’t generate as much vibration. The mechanism is similar to the way a car is more likely to slide if it’s bouncing down a bumpy road as opposed to rolling along a smooth one.

In 1995, Charles Campbell from the University of Southern California created a computer model that was able to replicate the behavior of long-runout slides using only the dynamic interactions between rocks. No special circumstances like water or air cushions were required. However, due to the limitations of computers at the time, he was unable to determine what mechanism was responsible for the behavior.

“The model showed that there was something about rocks, when you get a lot of them together, that causes them to slide out further than you expect,” Johnson said. “But it didn’t tell us what was actually happening to give us this lower friction.”

For this new study, Johnson was able to resurrect that model, tweak it a bit, and run it on a modern workstation to capture the dynamics in finer detail. The new model showed that, indeed, vibrations do reduce the effective friction acting on the slide.

The amount of friction acting on a slide depends in part on gravity pulling it downward. The same gravitational force that accelerates the slide as it moves downslope tends to slow it down when it reaches flat land. But the model showed that vibrational waves counteract the gravitational force for brief moments. The rocks tend to slide more when the vibration reduces the friction effect of the gravitational force. Because the vibrational waves affect different rocks in the slide at different times, the entire slide tends to move more like a fluid.

Those results of the new model are consistent with the acoustic fluidization idea that Melosh had proposed nearly 40 years ago, before computer power was adequate to confirm it.

“Campbell and I had a long-standing friendly rivalry and he did not believe my proposed acoustic fluidization mechanism could possibly explain his findings in the simulations,” Melosh said. “As a result of Brandon’s careful analysis of the interactions of the rock fragments in the simulations, we’ve now put to rest the debate, and it was a lot of fun for the three of us to work together.”

Ultimately, the researchers hope this work might be a step toward better predicting these types of potentially devastating landslides.

“I would suggest that understanding why these landslides run out so far is really is a first step to understanding when and where they might occur in the future,” Johnson said. “Our work suggests that all you need is enough volume to get these long runouts. This leads to the somewhat unsatisfying conclusion that these slides can happen nearly anywhere.”

The results may also help scientists understand other types of events. For example, acoustic fluidization might play a role in slippage along fault lines, which contributes to large earthquakes.

“This emergent phenomenon, arising from the simple interactions of individual particles, is likely at play whenever large movements of rock occur,” Johnson said.

Reference:
Brandon C. Johnson, Charles S. Campbell, H. Jay Melosh. The reduction of friction in long runout landslides as an emergent phenomenon. Journal of Geophysical Research: Earth Surface, 2016; DOI: 10.1002/2015JF003751

Note: The above post is reprinted from materials provided by Brown University.

Chasing after a prehistoric Kite Runner

Chasing after a prehistoric-GeologyPage
Aquilonifer spinosus, the Kite Runner, was an arthropod that lived about 430 million years ago. It carried its young in capsules or pouches tethered to its body. Credit: D. Briggs, D. Siveter, D. Siveter, M. Sutton, D. Legg

Scientists have discovered an ancient animal that carried its young in capsules tethered to the parent’s body like tiny, swirling kites. They’re naming it after “The Kite Runner,” the 2003 bestselling novel.

The miniscule creature, Aquilonifer spinosus, was an arthropod that lived about 430 million years ago. It grew to less than half an inch long, and there is only one known fossil of the animal, found in Herefordshire, England. Its name comes from “aquila,” which means eagle or kite, and the suffix “fer,” which means carry.

Researchers from Yale, Oxford, the University of Leicester, and Imperial College London described the new species in a paper published online the week of April 4 in the journal Proceedings of the National Academy of Sciences.

“Modern crustaceans employ a variety of strategies to protect their eggs and embryos from predators — attaching them to the limbs, holding them under the carapace, or enclosing them within a special pouch until they are old enough to be released — but this example is unique,” said lead author Derek Briggs, Yale’s G. Evelyn Hutchinson Professor of Geology and Geophysics and curator of invertebrate paleontology at the Yale Peabody Museum of Natural History. “Nothing is known today that attaches the young by threads to its upper surface.”

The Kite Runner fossil shows 10 juveniles, at different stages of development, connected to the adult. The researchers interpret this to mean that the adult postponed molting until the juveniles were old enough to hatch; otherwise, the juveniles would have been cast aside with the shed exoskeleton.

The adult specimen’s head is eyeless and covered by a shield-like structure, according to the researchers. It lived on the sea floor during the Silurian period with a variety of other animals including sponges, brachiopods, worms, snails and other mollusks, a sea spider, a horseshoe crab, various shrimp-like creatures, and a sea star. The juvenile pouches, attached to the adult by slender, flexible threads, look like flattened lemons.

Briggs said he and his colleagues considered the possibility that the juveniles were parasites feeding off a host, but decided it was unlikely because the attachment position would not be favorable for accessing nutrients.

“We have named it after the novel by Khalid Hosseini due to the fancied resemblance of the juveniles to kites,” Briggs said. “As the parent moved around, the juveniles would have looked like decorations or kites attached to it. It shows that arthropods evolved a variety of brooding strategies beyond those around today — perhaps this strategy was less successful and became extinct.”

The researchers were able to describe Aquilonifer spinosus in detail thanks to a virtual reconstruction. They reconstructed the animal and the attached juveniles by stacking digital images of fossil surfaces revealed by grinding away the fossil in tiny increments.

Co-authors of the paper were Derek Siveter of the University of Oxford and the Oxford University Museum of Natural History, David Siveter of the University of Leicester, Mark Sutton of Imperial College London, and David Legg of the Oxford University Museum of Natural History.

The Yale Peabody Museum of Natural History, the Natural Environmental Research Council, the John Fell Oxford University Press Fund, and the Leverhulme Trust supported the research.

Reference:
Derek E. G. Briggs, Derek J. Siveter, David J. Siveter, Mark D. Sutton, and David Legg. Tiny individuals attached to a new Silurian arthropod suggest a unique mode of brood care. PNAS, April 4, 2016 DOI: 10.1073/pnas.1600489113

Note: The above post is reprinted from materials provided by Yale University.

Earth Observatory of Singapore show that slow fault movements may indicate an impending earthquake

Earth Observatory of Singapore-GeologyPage
The Parkfield tremors.

Scientists from Nanyang Technological University (NTU Singapore) at its Earth Observatory of Singapore (EOS) have discovered a way to forecast earthquakes based on slow fault movements caused by moving sub layers of the earth.

Scientists believe that larger earthquakes are unlikely to occur following tremors or earthquakes below a Richter scale of two that are caused by small vibrations or slow fault movements such as those observed in the area of Parkfield along the San Andreas fault in California, USA.

However, the NTU team found that not only do these vibrations potentially point to an impending earthquake, they also discovered a discernible pattern to them.

“This discovery defied our understanding of how faults accumulate and release stress over time. These vibration patterns are caused by alternating slow and fast ruptures occurring on the same patch of a fault,” said Asst Prof Sylvain Barbot, from NTU’s Asian School of the Environment and an earth scientist at EOS.

“If only slow movements are detected, it does not mean that a large earthquake cannot happen there. On the contrary, the same area of the fault can rupture in a catastrophic earthquake,” he warned.

The study which has major significance on the prediction of earthquakes was led by Asst Prof Barbot’s PhD student, Miss Deepa Mele Veedu. It was published in Nature, one of the most prestigious scientific journals in the world.

Seismic hazards in the Southeast Asia region will probably come from an impending large earthquake in the Mentawai seismic gap in Sumatra, Indonesia – a current area of active monitoring and investigation.

EOS scientists have earlier pointed out a large earthquake may occur any time in this area southwest of Padang – the only place along a large fault where a big earthquake has not occurred in the past two centuries. The team’s latest findings could potentially be applied in the seismic monitoring of the area to help better forecast large earthquakes in the region.

EOS conducts fundamental research on earthquakes, volcanic eruptions, tsunamis and climate change in and around Southeast Asia, towards safer and more sustainable societies.

Reference:
Deepa Mele Veedu et al. The Parkfield tremors reveal slow and fast ruptures on the same asperity, Nature (2016). DOI: 10.1038/nature17190

Note: The above post is reprinted from materials provided by Nanyang Technological University.

Life history of ancient mammal relatives provides insight on survival tactics

Life history of ancient mammal-GeologyPage
A specimen of Lystrosaurus from the Albany Museum in Grahamstown, South Africa. Credit: Ken Angielczyk

Two hundred and fifty-two million years ago, a series of Siberian volcanoes erupted and sent the Earth into the greatest mass extinction of all time. As a result of this mass extinction, known as the Permo-Triassic Mass Extinction, billions of tons of carbon were propelled into the atmosphere, radically altering the Earth’s climate. Yet, some animals thrived in the aftermath and scientists now know why.

In a new study published in Scientific Reports, a team of international paleontologists, including postdoctoral scholar Adam Huttenlocker of the Natural History Museum of Utah at the University of Utah, demonstrate that ancient mammal relatives known as therapsids were suited to the drastic climate change by having shorter life expectancies and would have had a better chance of success by breeding at younger ages than their predecessors.

The research team studied growth patterns in therapsids from the South African Karoo Basin, a paleontologically significant area which preserves a wide range of fossils from the Permian to the Early Jurassic, or 300-180 million years ago.

By examining their bone microstructure before and after the extinction boundary, Huttenlocker and his colleagues were able to study how growth patterns in therapsids were affected by the extinction. By studying body size distributions in particularly abundant species from the Permian and Triassic, the team was able to interpret shifts in size class structure and in rates of survivorship.

In this study, special attention was paid to the genus Lystrosaurus because of its success in surviving the Permo-Triassic extinction; it dominated ecosystems across the globe for millions of years during the post-extinction recovery period, and makes up some 70-90% of the vertebrate fossils found in Early Triassic rocks in the Karoo.

“Therapsid fossils like Lystrosaurus are important because they teach us about the resilience of our own extinct relatives in the face of extinction, and provide clues to which traits confered success on lineages during this tubulent time. Lystrosaurus was particularly prolific, making it possible to build a large dataset and to sacrifice some specimens for histology to study the growth patterns recorded in its bones,” said Huttenlocker, one of the paper’s authors.

“Before the Permo-Triassic extinction, the famous therapsid Lystrosaurus had a life span of about 13 or 14 years based on the record of growth preserved in their bones,” said Field Museum paleontologist Ken Angielczyk, another one of the paper’s authors. “Yet, nearly all of the Lystrosaurus specimens we find from after the extinction are only 2¬-3 years old. This implies that they must have been breeding when they were still [relatively young] themselves.”

This adjustment in life history also meant a physical change for Lystrosaurus. Before the mass extinction, this creature would have been a couple meters long and weighed hundreds of pounds—about the size of a pygmy hippo. Post-extinction, its size dropped to that of a large dog, in large part due to its altered lifespan. Yet, these adaptations seemed to pay off for Lystrosaurus. Ecological simulations show that by breeding younger, Lystrosaurus could have increased its chance of survival by 40% in the unpredictable environments that existed in the aftermath of the extinction.

This change in breeding behavior is not isolated to ancient animals either. In the past century, the Atlantic cod has undergone a similar effect due to human interference. Industrial fishing has removed most large individuals from the population, shifting the average size of cod significantly downward. Likewise, the remaining individuals are forced to breed as early in their lives as possible. Similar shifts have also been demonstrated in African monitor lizards exploited by humans.

“Although it’s hard to see the effects in our daily lives, there is substantial evidence that we are in the middle of a sixth mass extinction right now. It has been predicted that half of mammal species could become extinct by the end of the next century if present patterns continue; that’s more than 1,000 times greater than previous estimates of natural extinctions, a trend not seen since the End-Permian or End-Cretaceous extinctions,” said Huttenlocker.

“With the world currently facing its sixth mass extinction, paleontological research helps us understand the world around us today,” said Angielczyk. “By studying how animals like Lystrosaurus adapted in the face of disaster, we can better predict how looming environmental changes may affect modern species.”

Reference:
Botha-Brink, J. D. Codron. A. K. Huttenlocker, K. D. Angielczyk, and M. Ruta. 2016. Breeding young as a survival strategy during Earth’s greatest mass extinction. Scientific Reports 6. DOI: 10.1038/srep24053

Note: The above post is reprinted from materials provided by University of Utah.

Alaska researchers improve their ‘hearing’ to detect volcanic eruptions

Alaska researchers improve-GeologyPage
Steam and gas plume rising from Alaska’s Cleveland Volcano in 2014. Credit: John Lyons/ Alaska Volcanic Observatory/ USGS

If a volcano explodes in the remote reaches of Alaska, will anyone hear it? Seismologists working in the state say yes—after using a refined set of methods that allows them to detect and locate the airwaves generated by a volcanic explosion on distant seismic networks.

In a study published online in the Bulletin of the Seismological Society of America, David Fee of the Alaska Volcanic Observatory and Wilson Alaska Technical Center and his colleagues used these techniques to examine the ground-coupled airwaves produced by recent eruptions at Cleveland, Veniaminof and Pavlof volcanoes in Alaska.

“This study shows how we can expand the use of seismic data by looking at the acoustic waves from volcanic explosions that are recorded on seismometers,” explained Fee. “The techniques we used provide an automated way to detect, locate, characterize, and monitor volcanic eruptions, particularly in remote, difficult-to-monitor regions like Alaska.”

“We now use these techniques operationally at the Alaska Volcano Observatory and plan to integrate them more in the future,” Fee added.

Ground-coupled airwaves or GCAs occur when an acoustic wave in the atmosphere impacts the earth’s surface, producing a ground wave that can be detected by seismometers. Volcanic explosions can produce these low-frequency acoustic waves, as well as events such as meteors entering the Earth’s atmosphere, and even chemical or nuclear explosions.

“Volcanic explosions can sometimes be difficult to detect seismically, but the GCA can provide unambiguous evidence that a volcano is erupting,” said Fee. “We can also use GCA to locate eruptive vents and identify changes in eruption style.”

Fee and his colleagues analyzed seismic data from networks installed and operated by the Alaska Volcanic Observatory in remote parts of Alaska and the Aleutian Islands, near volcanoes that had explosive activity between 2007 and 2015.

The researchers examined GCA signals from a May 2013 eruption on the Aleutian Arc’s Cleveland volcano, one of the most active but also one of the most remote volcanoes monitored by the observatory. Typically, eruptions from the volcano are detected by satellite fly-overs. But Fee and colleagues show that the May 2013 eruption sequence could be detected—and distinguished from a non-volcanic acoustic signal—by remote seismic networks.

GCA signals were detected from seismic networks around the Veniaminof and Pavlof volcanoes on the Alaskan Peninsula for eruptions taking place in 2007 and 2013. Using the signals, the researchers were able to confirm the location of active vents on Veniaminof and Pavlof. They were also able to distinguish between seismic and acoustic events on the networks, which can be helpful in determining whether the detected signals represent subsurface movement at a volcano or surface explosions that create acoustic waves. For Pavlof in particular, the scientists say in their paper, this distinction could help monitor the hazards produced during explosive degassing by the volcano.

Fee said both GCA signals and regular seismic signals are important for getting a complete picture of how a volcano is behaving. “Infrasound and GCA signals are most effective at telling you what is going on at the volcano at that moment, whether it is erupting or not, and what kind and how much material is coming out of the vent,” he said. “Seismic waves from volcanoes provide complementary information on what is going on in the subsurface and are often more effective at forecasting eruptions.”

Reference:
“Seismic envelope-based detection and location of ground-coupled airwaves from volcanoes in Alaska,” Bulletin of the Seismological Society of America, 2016.

Note: The above post is reprinted from materials provided by Seismological Society of America.
The Paria Mountains

The Paria Mountains
The Paria Mountains

Paria or Pahreah, is a ghost town on the Paria River in Grand Staircase-Escalante National Monument in central Kane County, Utah, United States. It was inhabited from 1870 to 1929, and later used as a filming location.

History

The area was first settled in 1865 by a Mormon group led by Peter Shirts. This early settlement was named Rockhouse, for Shirts’s strongly built sandstone house. After the end of the Black Hawk War in 1867 settlers began to arrive at a rapid pace. Farming produced good crops for several years, but irrigation was very difficult; each spring the surface runoff water was absorbed into the desert soil too quickly to properly water the fields. In 1870 the residents agreed to move the settlement. They divided in two groups; half the people went about 5 miles (8.0 km) upstream and founded the town of Pahreah.

In 1871, John D. Lee came to the Paria area, fleeing investigators of the Mountain Meadows massacre. He constructed a dam and irrigation ditches with the help of many locals and passersby, including members of John Wesley Powell’s second Colorado River expedition.

Pahreah grew through the 1870s, gaining a general store, a church, a number of sandstone houses, and many log houses. The population grew to 47 families. The town hit hard times in the 1880s, however. The Paria River flooded every year from 1883 to 1888, washing away fields and even some buildings. People started to move away. By 1892 there were only eight families left, but for some reason the town was granted a post office that year, under the name Paria. Not much changed until a small gold mining operation was established here in 1911. Within a year, that too was wiped out by flooding. The post office closed in 1914. A lone bachelor prospector held out until 1929, then Paria was empty.

Photos

Video

Note: The above post is reprinted from materials provided by Wikipedia.

Geologists Discover Origin of Earth’s Mysterious Black Diamonds

Geologists Discover Origin of-GeologyPage
Black, or carbonado, diamonds, came from outer space, geologists have discovered. Credit: Steve Haggerty

January 8, 2007ـــــ If indeed “a diamond is forever,” the most primitive origins of Earth’s so-called black diamonds were in deep, universal time, geologists have discovered. Black diamonds came from none other than interstellar space.

In a paper published online on December 20, 2006, in the journal Astrophysical Journal Letters, scientists Jozsef Garai and Stephen Haggerty of Florida International University, along with Case Western Reserve University researchers Sandeep Rekhi and Mark Chance, claim an extraterrestrial origin for the unique black diamonds, also called carbonado diamonds.

Infrared synchrotron radiation at Brookhaven National Laboratory was used to discover the diamonds’ source.

“Trace elements critical to an ‘ET’ origin are nitrogen and hydrogen,” said Haggerty. The presence of hydrogen in the carbonado diamonds indicates an origin in a hydrogen-rich interstellar space, he and colleagues believe.

The term carbonado was coined by the Portuguese in Brazil in the mid-18th century; it’s derived from its visual similarity to porous charcoal. Black diamonds are found only in Brazil and the Central African Republic.

“Conventional diamonds are mined from explosive volcanic rocks [kimberlites] that transport them from depths in excess of 100 kilometers to the Earth’s surface in a very short amount of time,” said Sonia Esperanca, program director in the National Science Foundation’s Division of Earth Sciences, which funded the research. “This process preserves the unique crystal structure that makes diamonds the hardest natural material known.”

From Australia to Siberia, from China to India, the geological settings of conventional diamonds are virtually identical, said Haggerty. None of them are compatible with the formation of black diamonds.

Approximately 600 tons of conventional diamonds have been mined, traded, polished and adorned since 1900. “But not a single black/carbonado diamond has been discovered in the world’s mining fields,” Haggerty said.

The new data support earlier research by Haggerty showing that carbonado diamonds formed in stellar supernovae explosions. Black diamonds were once the size of asteroids, a kilometer or more in diameter when they first landed on Earth.

Note: The above post is reprinted from materials provided by National Science Foundation.

Pavlof Volcano eruption without earthquakes?

Why did Pavlof Volcano erupt-GeologyPage
Cross-section of a stratovolcano with an open conduit system. Credit: Original figure by Lea Gardine

Pavlof Volcano began a new eruption on March 27 with little advance warning. Many people have asked why there were no earthquakes in the days prior, or for that matter why the maps continue to show no earthquakes at Pavlof even though it is erupting. After all, aren’t precursory earthquakes one of the primary tools we use in forecasting eruptions?

Pavlof is the odd, sneaky exception.

Pavlof is among the most frequently erupting volcanoes in North America, with recent eruptions in 2014, 2007, and 1996. When it began erupting again on Sunday afternoon, it gave very little lead time, and as of yet has not produced a single earthquake large enough to be detected on its dedicated seismic network — the detection threshold is less than magnitude 1.

Our partner organization, the Alaska Volcano Observatory, is busy tracking the activity with a variety of techniques, but so far earthquakes are not one of them. As I write, Pavlof still hasn’t even made it onto our Recent Volcano Seismicity chart.

To understand this, first consider why earthquakes so commonly DO accompany eruptions. Moving magma and gas through solid rock is not easy. To get magma to the surface usually requires blasting open new cracks to serve as pathways. As magma begins to swell in the earth, many volcanoes will literally bloat. They may expand and begin to crack. Some of these cracks occur off to the sides to relieve pressure. Others occur under the edifice and allow magma to creep upward. Each of these fractures creates an earthquake. These processes create the hundreds or thousands of earthquakes that precede most eruptions. Sometimes these earthquakes begin months before an eruption. Sometimes the lead-time may be just hours.

But Pavlof is a different beast. Pavlof is considered an “open system.” Its frequent eruptions and its style of magma are able to sometimes maintain a relatively open conduit system between eruptions. If the conduit doesn’t solidly freeze up after an eruption, then there is no need to clear out a new one. The mechanics of this are somewhat speculative but the data are pretty strong.

Three days of seismic records preceding the 2007 and the 2016 eruptions of Pavlof volcano / UAF

Pavlof recently erupted in late 2014. When it started up again the other day there was little in the way of precursory seismic indicators. It is easy to imagine this system reactivating with very little energy. As one of our staff, Helena B., put it, “Its cork already popped.”

By comparison, when Pavlof erupted in 2007, it had been quiet for more than a decade. Sure enough, the primary 2007 eruption was preceded by a day or two of early seismic indicators. It seems logical and plausible that more work was required to open the conduit that time.

That doesn’t mean that Pavlof isn’t making noise. Pumping magma through the conduit and spattering out the top vibrates the ground continuously — think of hissing radiator pipes. This seismic tremor is a strong signal with plenty of telltale eruption signatures. Tracking this tremor is a great indicator of how eruptions are changing. Thus far, Pavlof has transitioned from continuous eruption early on, to shutting down for many hours, to erupting through short pulsating bursts.

Who knows what the coming days hold. But once magma hits the surface, a lot of other observational techniques come into play. The atmospheric infrasound signature is clear hundreds of miles away. The satellite images of ash and hot ground are stunningly clear. And when weather permits, don’t underestimate the value of simple visual observations from the ground and air.

Pavlof is not the only sneaky volcano. Shishaldin Volcano,  about 90 miles to the west, often maintains a similarly open system and can ebb and flow without significant precursors. These volcanoes present a special monitoring challenge. Those of us in seismology relish the fact that, more often than not, we are the first to see the signs of a potential eruption. Volcanoes like Pavlof keep volcanologists humble.

Note: The above post is reprinted from materials provided by Alaska Earthquake Center.

Scientists shed light on powerful currents that create massive underwater canyons

Scientists shed light on powerful-GeologyPage
Recent research by Stanford scientists sheds light on the powerful ocean currents that carved the Monterey Canyon and other deep channels that extend hundreds of miles offshore. Credit: Monterey Bay Aquarium Research Institute

Through the use of mathematical models, Stanford researchers have better defined the powerful processes that carved some of the largest canyons on Earth, deep under the oceans.

Hidden off the central California coast is a gorge carved into the seafloor that rivals the Grand Canyon, its steep walls measuring nearly one mile from top to bottom. The Monterey Canyon is one of thousands of giant submarine canyons that crisscross the ocean floor.

Since the discovery of these features at the turn of the 19th century, scientists have hypothesized that turbidity currents – avalanche-like flows of rock, sand and silt suspended in water that can traverse hundreds of miles – eroded away the canyons and cut sinuous channels along the ocean floor. Supporting this hypothesis with direct measurement, however, has proven exceedingly difficult. Even the most robust monitoring equipment can’t survive currents strong enough to sculpt canyons in the seafloor.

A computer modeling effort from Stanford researchers, published in the Journal of Geophysical Research, could fill in the gaps in describing these powerful currents that, when they’re not creating some of the largest canyons on the planet, pose a significant risk to undersea telecommunications structures and oil rigs.

“There’s still an air of mystery about deep-ocean processes. We have better images of the surface of Mars than we do of our own seafloor,” said Miles Traer, the study’s lead author who conducted the work as a graduate student in Stanford’s School of Earth, Energy & Environmental Sciences. “How is it possible to have water flow through other water for such long distances while creating these huge features? Without direct measurements, that question has proven surprisingly difficult to answer, and it was one of the driving questions of our research.”

Unlike a river, turbidity currents don’t flow continuously; they seem to start suddenly, last for minutes to hours, and then stop. As they move, they mix with the surrounding sediment-free water along the upper boundary of the current. This mixing is one of the fundamental differences between turbidity currents and their on-land counterparts.

“Understanding this mixing is crucial when trying to predict where a turbidity current will go, how energetic it will be, how potentially damaging it will be, or where it will deposit large sandy reservoirs,” said George Hilley, co-author on the study and associate professor at Stanford’s School of Earth, Energy & Environmental Sciences. “To my knowledge, no one has ever measured the mixing process in the field, and yet it seems to control much of the flow physics.”

In the study, Traer and his colleagues found that the standard mathematical model for turbidity currents, which is commonly employed in risk assessments and petroleum exploration, may have improperly captured this important mixing process, called entrainment. Clear-water entrainment along the upper boundary of the flow effectively acts as a brake, slowing the turbidity current down while simultaneously thickening it.

Using the standard model, the researchers found that the simulated turbidity currents were either too thick, or too fast. This indicated that the simulated flows would either be too dilute to carve out the canyons, or too energetic and carve them out much faster than the geological evidence suggests.

“The entrainment process is incredibly difficult to capture in the lab because the scales are so different,” Traer said. “Our results suggest that the model used to describe the mixing process that was derived in the lab might be just one of many possible rules that apply depending on the scale of the flow.”

The discovery has many implications for the formation and duration of the turbidity currents that not only carved out the large canyons but also constructed meandering channels along the seafloor.

“The research suggests that there is a delicate balance that turbidity currents must maintain between erosion and entrainment,” Hilley said. “And our methods provide the groundwork to better capture the entrainment process and, in turn, better predict the patterns of erosion and deposition that create these massive features on the seafloor.”

Reference:
M. M. Traer et al. Simulating depth-averaged, one-dimensional turbidity current dynamics using natural topographies, Journal of Geophysical Research: Earth Surface (2015). DOI: 10.1002/2015JF003638

Note: The above post is reprinted from materials provided by Stanford University.

NASA, Japan make ASTER earth data available at no cost

NASA, Japan make ASTER -GeologyPage
In March 2016, ASTER captured the eruption of Nicaragua’s Momotombo volcano with its visible and thermal infrared bands. The ash plume is depicted by the visible bands in blue-gray; the thermal infrared bands show hot lava flows in yellow and the active summit crater in white. Vegetation is red. Credit: NASA/GSFC/METI/ERSDAC/JAROS, and U.S./Japan ASTER Science Team

Beginning today, all Earth imagery from a prolific Japanese remote sensing instrument operating aboard NASA’s Terra spacecraft since late 1999 is now available to users everywhere at no cost.

The public will have unlimited access to the complete 16-plus-year database for Japan’s Ministry of Economy, Trade and Industry (METI) Advanced Spaceborne Thermal Emission and Reflection Radiometer (ASTER) instrument, which images Earth to map and monitor the changing surface of our planet. ASTER’s database currently consists of more than 2.95 million individual scenes. The content ranges from massive scars across the Oklahoma landscape from an EF-5 tornado and the devastating aftermath of flooding in Pakistan, to volcanic eruptions in Iceland and wildfires in California.

Previously, users could access ASTER’s global digital topographic maps of Earth online at no cost, but paid METI a nominal fee to order other ASTER data products.

In announcing the change in policy, METI and NASA cited ASTER’s longevity and continued strong environmental monitoring capabilities. Launched in 1999, ASTER has far exceeded its five-year design life and will continue to operate for the foreseeable future as part of the suite of five Earth-observing instruments on Terra.

“We anticipate a dramatic increase in the number of users of our data, with new and exciting results to come,” said Michael Abrams, ASTER science team leader at NASA’s Jet Propulsion Laboratory in Pasadena, California, home to ASTER’s U.S. science team. ASTER data are processed into products using algorithms developed at JPL and the National Institute of Advanced Industrial Science and Technology (AIST) in Japan. A joint U.S./Japan science team validates and calibrates the instrument and data products.

ASTER is used to create detailed maps of land surface temperature, reflectance and elevation. The instrument acquires images in visible and thermal infrared wavelengths, with spatial resolutions ranging from about 50 to 300 feet (15 to 90 meters). ASTER data cover 99 percent of Earth’s landmass and span from 83 degrees north latitude to 83 degrees south. A single downward-looking ASTER scene covers an area on the ground measuring about 37-by-37 miles (60-by-60-kilometers).

ASTER uses its near-infrared spectral band and downward- and backward-viewing telescopes to create stereo-pair images, merging two slightly offset two-dimensional images to create the three-dimensional effect of depth. Each elevation measurement point in the data is 98 feet (30 meters) apart.

The broad spectral coverage and high spectral resolution of ASTER provide scientists in numerous disciplines with critical information for surface mapping and monitoring of dynamic conditions and changes over time. Example applications include monitoring glacial advances and retreats, monitoring potentially active volcanoes, identifying crop stress, determining cloud morphology and physical properties, evaluating wetlands, monitoring thermal pollution, monitoring coral reef degradation, mapping surface temperatures of soils and geology, and measuring surface heat balance.

ASTER data are now available via electronic download from NASA’s Land Processes Distributed Active Archive Center (LP DAAC) at the U.S. Geological Survey’s (USGS) Earth Resources Observation and Science Center in Sioux Falls, South Dakota, and from AIST. To access the data, visit: https://lpdaac.usgs.gov/dataset_discovery/aster or  https://gbank.gsj.jp/madas/

NASA uses the vantage point of space to increase our understanding of our home planet, improve lives and safeguard our future. NASA develops new ways to observe and study Earth’s interconnected natural systems with long-term data records. The agency freely shares this unique knowledge and works with institutions around the world to gain new insights into how our planet is changing.

For more information about ASTER, visit: http://asterweb.jpl.nasa.gov/

For more information on NASA’s Terra mission, visit: http://terra.nasa.gov

For more information about NASA’s Earth science activities, visit: http://www.nasa.gov/earth

Note: The above post is reprinted from materials provided by NASA.

Related Articles