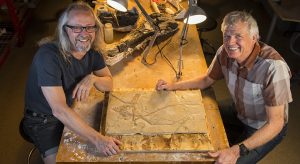
A new type of ichthyosaur, an extinct marine reptile alive at the same time as the dinosaurs, has been identified by a Manchester palaeontologist from a fossil found in an old quarry in Nottinghamshire.
Similar-shaped to dolphins and sharks, ichthyosaurs — often misidentified as ‘swimming dinosaurs’ — swam the seas of Earth for millions of years during the Triassic, Jurassic and Cretaceous periods. The Nottinghamshire fossil is from the earliest part of the Jurassic Period — 200 million years ago — and only a handful of ichthyosaur species are known from this period, making the discovery very significant. It is also the first time a species of this geological age has been found outside of Dorset and Somerset.
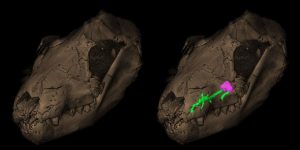
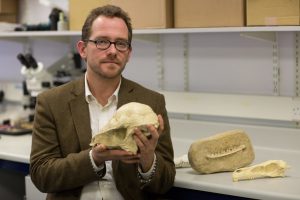
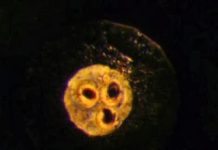
Dean Lomax, a Palaeontologist and Honorary Scientist at The University of Manchester, examined the specimen after seeing it on a visit to Leicester’s New Walk Museum, which acquired the fossil in 1951, and spotted some unusual features. The specimen is relatively complete, consisting of a partial skeleton including a skull, pectoral bones, limbs, pelvis bones, ribs and vertebrae. However, the bones are disorderly — it appears that the carcass ‘nosedived’ into the seabed before it became fossilised, which may have restricted previous study.
“When I first saw this specimen, I knew it was unusual,” said Dean. “It displays features in the bones — especially in the coracoid (part of the pectoral girdle) — that I had not seen before in Jurassic ichthyosaurs anywhere in the world. The specimen had never been published, so this rather unusual individual had been awaiting detailed examination.”
Dr Mark Evans, Palaeontologist and Curator of Natural Sciences at New Walk Museum, said: “Parts of the skeleton had previously been on long-term loan to ichthyosaur specialist and former museum curator Dr Robert Appleby, and had only returned to the museum in 2004 after he sadly passed away. He was clearly intrigued by the specimen, and although he worked on it for many years, he had identified it as a previously known species but never published his findings.”
Dean has named the new species Wahlisaurus massarae in honour of two palaeontologists (Professor Judy Massare and Bill Wahl) who have contributed significantly to the study of ichthyosaurs, and who first introduced Dean to studying them.
“Both Judy and Bill have been tremendous mentors for me. They have significantly contributed to palaeontology, especially the study of ichthyosaurs, and I cannot think of a better way to remember them by naming this new ichthyosaur in their honour. Their names will be set in stone forever, pun intended!”
The specimen is the first new genus of ichthyosaur from the British Early Jurassic to be described since 1986. Thousands of specimens from this time are known, and many of these have been examined — and continue to be re-examined in light of new knowledge and technologies. However, as the specimen is from a practically unknown location for the discovery of ichthyosaurs, any new discovery could be of real scientific significance. This new species is also important for our understanding of ichthyosaur species diversity, and their geographical distribution during the Early Jurassic.
Reference:
Dean R. Lomax. A new leptonectid ichthyosaur from the Lower Jurassic (Hettangian) of Nottinghamshire, England, UK, and the taxonomic usefulness of the ichthyosaurian coracoid. Journal of Systematic Palaeontology, 2016; 1 DOI: 10.1080/14772019.2016.1183149
Ludwig Maximilian University of Munich researchers have shown that volcanic lightning results from the discharge of static electricity accumulated by ash particles in the rising plume. Observations of such flashes could help to forecast the impact of volcanic eruptions.
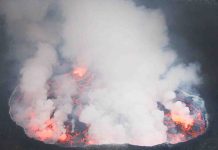
Mount Sakurajima on the Japanese island of Kyushu is one of the most active volcanoes in the world. The huge clouds of gas, ash and rock fragments which the volcano spews into the atmosphere during its highly explosive eruptive phases are often illuminated by volcanic lightning – a striking phenomenon that remains poorly understood. Volcanologist Corrado Cimarelli and his group in the Department of Earth and Environmental Sciences at LMU recently made a detailed study of the lightning flashes that accompany Sakurajima’s frequent outbursts.
The team now reports that friction generated by collisions between the ash particles in the turbulent jets that form the plume invests the particles with sufficient electrostatic charge to account for the lightning observed during eruptions. They also show that the frequency of the flashes varies with the amount of ash emitted during an eruption. This correlation suggests that monitoring of volcanic lightning could provide a means of determining the size distribution of the ash clouds released into the atmosphere during eruptions – and permit improved forecasting of their potential impact on air traffic. The findings appear in the journal Geophysical Research Letters, and the work is featured on the cover of the latest issue.
“We used video footage of eruptions of Sakurajima obtained with a high-speed camera as the basis for our study, and combined these images with measurements of changes in the electromagnetic field and with data recorded by acoustic sensors,” says Cimarelli. Analysis of the resulting data allowed the researchers to determine that volcanic lightning flashes are largely restricted to the lower levels of the plume, i.e., within a few hundred meters above the crater’s rim. In this region, particle fragmentation within the turbulent magma electrifies the rising ash particles, and the accumulated electrostatic charge is subsequently explosively discharged in the form of lightning. In contrast to normal lightning which originates at greater heights, volcanic lightning flashes do not require the presence of ice crystals as nucleation centers.
The researchers argue convincingly that monitoring of volcanic lightning would facilitate assessment of the overall impact of volcanic eruptions: “Independently of the size of the eruption, every episode of ash emission is associated with electrical discharges,” says Cimarelli. “This is a parameter that can be measured – from a distance of several kilometers away and under conditions of poor visibility – and it can be used as a proxy to estimate the total mass and the size distribution of the ash deposited in the atmosphere. This would enable us to rapidly assess the distribution of ash particles in the atmosphere and if necessary alert the aviation authorities.”
Reference:
C. Cimarelli et al. Multiparametric observation of volcanic lightning: Sakurajima Volcano, Japan, Geophysical Research Letters (2016). DOI: 10.1002/2015GL067445
Buildings in Kathmandu, Nepal damaged by the April 2015 Gorkha earthquake. Credit: Courtesy of Roger Bilham/CIRES
The Gorkha earthquake struck Nepal on April 25, 2015. It’s a part of the world that is prone to earthquakes, as the Indian plate makes its incremental, sticky descent beneath the Eurasian plate. The magnitude 7.8 jolt, which was very shallow (only 15 km underground), caused a tremendous amount of damage in Kathmandu. But it didn’t rupture the Earth’s surface, signifying that only part of the fault had slipped, below-ground.
In the following days, even the afterslip–post-earthquake movement–produced little surface evidence of continued movement. That meant only one of two things could be happening: either the part of the fault that hadn’t moved was experiencing a slow-slip event, a slow-motion earthquake, or it remained completely locked, accumulating further strain in that segment of the fault. A new research paper, out online from Nature Geoscience, finds it is likely the latter.
David Mencin, the lead author on that paper, is a graduate student with CIRES and the University of Colorado Boulder’s Department of Geological Sciences and a project manager with the geoscience non-profit UNAVCO. Following the earthquake, an international team of scientists quickly deployed a series of GPS receivers to monitor any movements. They also relied on InSAR–interferometric synthetic aperture radar–to look for changes to the Earth’s surface. They found there had been 70 mm (2.75 inches) of afterslip north of the rupture and about 25 mm (1 inch) of afterslip to the south of the rupture. But scientists estimate there’s about 3.5 meters (11.5 feet) worth of strain built into this fault, which those post-earthquake movements did nothing to alleviate.
“There was a clear lack of afterslip,” says Mencin. “That has implications for future great earthquakes, which can tap into this stored strain.”
CIRES Fellow Roger Bilham, a co-author on the study and Professor of Geological Sciences, got an early look at the fault zone when he took a helicopter flight over the area following the quake.
“Roger went out there immediately to search for a surface rupture,” says Mencin. “A newly formed 3.5 meter escarpment (upthrust) would have been obvious, even to the casual tourist.”
Historical earthquakes in the region–in 1803, 1833, 1905 and 1947–also failed to rupture the surface of the Himalayan frontal faults and they, too, experienced a lack of afterslip or large subsequent earthquakes. That, according to the team’s research, means there’s significant strain throughout the region.
“There’s no evidence that it will spontaneously rupture in another damaging earthquake,” says Bilham. “But the strain may fuel a future earthquake starting nearby. The entire Himalayan arc may host dozens of pockets of strain energy awaiting release in future great earthquakes.”
And this region remains vulnerable to earthquakes, not only because of its geography, but because of its architecture and development patterns. While this 2015 earthquake killed 8,000 people, left tens of thousands homeless and destroyed parts of Kathmandu, the amount of strain built up in the faults, if released suddenly, could do much more damage in this part of the world. That’s why Mencin and his colleagues are already at work on their next paper, which they hope might help identify patterns across the entire Himalayan front.
“We’re trying to understand the earthquake cycle in the Himalaya and understand how they happen,” says Mencin.
Reference:
Roger Bilham et al. Himalayan strain reservoir inferred from limited afterslip following the Gorkha earthquake. Nature Geoscience, June 2016 DOI: 10.1038/ngeo2734
Change in electrical conductivity of salt water in relation to temperature and pressure. It can be observed that electrical conductivity decreases with increasing temperature. Credit: Copyright NIMS
A joint research team consisting of Hiroshi Sakuma, senior researcher, Functional Geomaterials Group, Environment and Energy Materials Division, National Institute for Materials Science (NIMS), Japan, and Masahiro Ichiki, assistant professor, Graduate School of Science, Tohoku University, Japan, succeeded in theoretically determining the electrical conductivity of NaCl solution (salt water) in a high-temperature and high-pressure environment at ground depths ranging from 10 to 70 km.
By comparison with electrical conductivity data collected underground, the theoretical approach indicated the presence of salt water deep underground. This discovery may reinforce the theory that underground salt water influences the occurrence of earthquakes and volcanic eruptions.
It is commonly said that the presence of salt water in bedrock makes a fault prone to slide, influencing the occurrence of earthquakes, or decreases the melting points of rocks, influencing volcanic eruptions.
However, it is difficult to directly verify the presence of salt water through drilling surveys deep underground. Since liquids including salt water have electrical conductivity about six orders of magnitude higher than that of solids, surveys involving the measurement of electrical conductivity are often carried out to detect the presence of salt water. However, because the electrical conductivity of salt water under the high-temperature and high-pressure conditions occurring in such environments as crustal seismogenic zones is unknown, it had been impossible to associate electrical conductivity measurements with the presence of salt water.
The research team developed a molecular model to reproduce the supercritical state of water. Using the model, the team successfully calculated electrical conductivity of salt water with NaCl concentrations ranging from one-sixth to triple that in seawater at high temperature and high pressure (temperature: 673-2,000 K, pressure: 0.2-2 GPa), conditions that are difficult to simulate in experiments. These electrical conductivity data indicated that high electrical conductivity measured under the ground in the Tohoku region may be explained by the presence of salt water with salt concentrations equivalent to seawater.
In future studies, we will combine these results with the electromagnetic crustal observations across Japan to identify the presence of salt water deep underground where seismic and volcanic activities are high, as in subduction zones, and conduct research in order to understand the mechanism of the outbreak of earthquakes and volcanic eruption.
This research was conducted as a part of the projects “Geofluids: nature and dynamics of fluids in subduction zones,” (Grant-in-Aid for Scientific Research on New Academic Related Areas) and “Research on understanding supercritical fluid properties in crust through molecular dynamics calculation and its influence on earthquake occurrence,” (Grant-in-Aid for Challenging Exploratory Research) supported by the Ministry of Education, Culture, Sports, Science and Technology.
This research was published in the online version of Journal of Geophysical Research: Solid Earth, on January 20, 2016.
Reference:
Hiroshi Sakuma, Masahiro Ichiki. Electrical conductivity of NaCl-H2O fluid in the crust. Journal of Geophysical Research: Solid Earth, 2016; 121 (2): 577 DOI: 10.1002/2015JB012219
Basalt, the dominant volcanic rock along the Pacific Ocean’s “Ring of Fire,” is considered a melting product of the Earth’s mantle. On the left is vesicular basalt, in which dissolved gases formed bubbles as the magma decompressed. On the right is a magnesium-rich olivine crystal that formed inside the volcano, embedded in a fine-grained solid. Detailed chemical analyses found that magnesium in arc volcano basalt shows surprising traces of the descending ocean crust. Credit: Dennis Wise/University of Washington
Volcanoes are an explosive and mysterious process by which molten rock from Earth’s interior escapes back into the atmosphere. Why the volcano erupts — and where it draws its lava from — could help trace the lifecycle of materials that make up our planet.
New University of Washington research shows that a common type of volcano is not just spewing molten rock from the mantle, but contains elements that suggest something more complicated is drawing material out of the descending plate of Earth’s crust.
Geologists have long believed that solidified volcanic lava, or basalt, originates in the mantle, the molten rock just below the crust. But the new study uses detailed chemical analysis to find that the basalt’s magnesium — a shiny gray element that makes up about 40 percent of the mantle but is rare in the crust — does not look like that of the mantle, and shows a surprisingly large contribution from the crust. The paper was published the week of June 13 in the Proceedings of the National Academy of Sciences.
“Although the volcanic basalt was produced from the mantle, its magnesium signature is very similar to the crustal material,” said lead author Fang-Zhen Teng, a UW associate professor of Earth and space sciences. “The ocean-floor basalts are uniform in the type of magnesium they contain, and other geologists agree that on a global scale the mantle is uniform,” he said. “But now we found one type of the mantle is not.”
The study used rock samples from an inactive volcano on the Caribbean island of Martinique, a region where an ocean plate is slowly plunging, or subducting, beneath a continental plate. This situation creates an arc volcano, a common type of volcano that includes those along the Pacific Ocean’s “Ring of Fire.”
Researchers chose to study a volcano in the Caribbean partly because the Amazon River carries so much sediment from the rainforest to the seabed. One reason scientists want to pin down the makeup of volcanic material is to learn how much of the carbon-rich sediment from the surface gets carried deep in the Earth, and how much gets scraped off from the descending plate and reemerges into the planet’s atmosphere.
Analyzing the weight of magnesium atoms in the erupted basalt shows that they came not from the mantle, nor from the organic sediment scraped off during the slide, but directly from the descending oceanic crust. Yet the volcanic basalt lacks other components of the crust.
“The majority of the other ingredients are still like the mantle; the only difference is the magnesium. The question is: Why?” Teng said.
The authors hypothesize that at great depths, magnesium-rich water is squeezed from the rock that makes up Earth’s crust. As the fluid travels, the surrounding rock acts like a Brita filter that picks up the magnesium, transferring magnesium particles from the crust to the mantle just below the subduction zone.
“This is what we think is very exciting,” Teng said. “Most people think you add either crustal or mantle materials as a solid. Here we think the magnesium was added by a fluid.”
Fluids seem to play a role in seismic activity at subduction zones, Teng said, and having more clues to how those fluids travel deep in the Earth could help better understand processes such as volcanism and deep earthquakes.
He and co-author Yan Hu, a UW doctoral student in Earth and space sciences, plan to do follow-up studies on basalt rocks from the Cascade Mountains and other arc volcanoes to analyze their magnesium composition and see if this effect is widespread.
The other co-author is Catherine Chauvel at the University of Grenoble in France. The research was funded by the U.S. National Science Foundation and the French National Research Agency.
Note: The above post is reprinted from materials provided by University of Washington. The original item was written by Hannah Hickey.
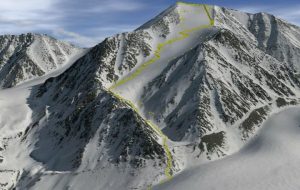
An annotaed 3-D view of the region. Credit: Stephen Livingstone
Researchers at the University of Sheffield have provided a unique glimpse into one of the least understood environments on Earth by revealing for the first time former subglacial lakes and their drainage routes beneath the North American ice sheets.
By investigating a very strange flat spot and associated channel in Alberta, Canada, which had no water in it, academics discovered the former existence of a lake trapped beneath an ice sheet during the last glaciation.
As this relict lake is no longer covered by many kilometres of ice, they were able to reconstruct what the lake would have looked like and how it drained from the landforms and sediments.
Their observations, published in the journal Nature Communications today (Monday 13 June 2016), suggest the lake existed as a shallow lens of water which repeatedly drained through channels cut into the bed.
The team’s results provide constraints for the modelling of similar subglacial lake drainages beneath the Antarctic and Greenland ice sheets. These are a crucial component of the subglacial hydrological system, able to store and rapidly drain large volumes of meltwater, but we do not know enough about the drainage process to fully understand their influence on ice flow.
Dr Stephen Livingstone, from the University’s Department of Geography and lead author of the paper, said: “We’ve seen these flat spots connected to relict channels in Canada, and are inferring these as former subglacial lakes and their drainage imprint. As ice no longer covers these relict lakes, our discovery has allowed us to reconstruct how the subglacial lakes would have looked and how they drained from the landforms and sediments. Our results provide key constraints for the investigation of modern subglacial lakes beneath the Antarctic and Greenland ice sheets.”
Reference:
Stephen J. Livingstone, Daniel J. Utting, Alastair Ruffell, Chris D. Clark, Steven Pawley, Nigel Atkinson, Andrew C. Fowler. Discovery of relict subglacial lakes and their geometry and mechanism of drainage. Nature Communications, 2016; 7: ncomms11767 DOI: 10.1038/NCOMMS11767
Measurements from satellite radar images of two giant West Texas sinkholes (dark black areas) shows the ground around them is sinking, including indications a potential new sinkhole is developing. The rates of east-west deformation of the ground (cm/year) are indicated in blue (eastward) and red (westward). Credit: Jin-woo Kim, SMU
Satellite radar images reveal ground movement of infamous sinkholes near Wink, Texas; suggest the two existing holes are expanding, and new ones are forming as nearby subsidence occurs at an alarming rate.
Residents of Wink and neighboring Kermit have grown accustomed to the two giant sinkholes that sit between their small West Texas towns.
But now radar images taken of the sinkholes by an orbiting space satellite reveal big changes may be on the horizon.
A new study by geophysicists at Southern Methodist University, Dallas, finds the massive sinkholes are unstable, with the ground around them subsiding, suggesting the holes could pose a bigger hazard sometime in the future.
The two sinkholes—about a mile apart—appear to be expanding. Additionally, areas around the existing sinkholes are unstable, with large areas of subsidence detected via satellite radar remote sensing.
That leaves the possibility that new sinkholes, or one giant sinkhole, may form, said geophysicists and study co-authors Zhong Lu, professor, Shuler-Foscue Chair, and Jin-Woo Kim research scientist, in the Roy M. Huffington Department of Earth Sciences at SMU.
“This area is heavily populated with oil and gas production equipment and installations, hazardous liquid pipelines, as well as two communities. The intrusion of freshwater to underground can dissolve the interbedded salt layers and accelerate the sinkhole collapse,” said Kim, who leads the SMU geophysical team reporting the findings. “A collapse could be catastrophic. Following our study, we are collecting more high-resolution satellite data over the sinkholes and neighboring regions to monitor further development and collapse.”
Lu and Kim reported the findings in the scientific journal Remote Sensing, in the article “Ongoing deformation of sinkholes in Wink, Texas, observed by time-series Sentinel-1A SAR Interferometry.”
The research was supported by the U.S. Geological Survey Land Remote Sensing Program, the NASA Earth Surface & Interior Program, and the Shuler-Foscue Endowment at Southern Methodist University.
Unstable ground linked to rising, falling groundwater
The sinkholes were originally caused by the area’s prolific oil and gas extraction, which peaked from 1926 to 1964. Wink Sink No. 1, near the Hendricks oil well 10-A, opened in 1980. Wink Sink No. 2, near Gulf WS-8 supply well, opened 22 years later in 2002.
It appears the area’s unstable ground now is linked to changing groundwater levels and dissolving minerals, say the scientists. A deep-seated salt bed underlies the area, part of the massive oil-rich Permian Basin of West Texas and southeastern New Mexico.
With the new data, the SMU geophysicists found a high correlation between groundwater level in the underlying Ogallala Aquifer and further sinking of the surface area during the summer months, influenced by successive roof failures in underlying cavities.
Satellite images and groundwater records indicate that when groundwater levels rise, the ground lifts. But the presence of that same groundwater then speeds the dissolving of the underground salt, which then causes the ground surface to subside.
Everything’s bigger in Texas, and the Wink sinkholes are no exception
Officials have fenced off the two sinkholes near Wink, a town of about 940 people, and Kermit, a town of about 6,000 people. The giant holes are notable features on the area’s vast plains, which are dotted mostly with oil pump jacks, storage facilities, occasional brush and mesquite trees.
Based on modeling of satellite image datasets, SMU’s researchers report that Wink Sink No. 1, which is closer to the town of Kermit, appears to be the most unstable. The smaller hole of the two, it has grown to 361 feet (110 meters) across—the length of a football field.
“Even though Wink No. 1 collapsed in 1980, its neighboring areas are still subsiding,” say the authors, “and the sinkhole continues to expand.” An oval-shaped deformation circling the sinkhole measures three-tenths of a mile (500 meters) wide and is subsiding up to 1.6 inches (4 centimeters) a year.
Wink Sink No. 2, which is nine-tenths of a mile south of No. 1 and which sits closer to the town of Wink, is the larger of the sinkholes. It varies from 670 feet to 900 feet across.
Wink No. 2 is not experiencing as much subsidence as Wink No. 1. However, its eastern side is collapsing and eroding westward at a rate of up to 1.2 inches (3 centimeters) a year.
“Wink No. 2 exhibits depression associated with the ongoing expansion of the underground cavity,” the authors report.
Some ground that doesn’t even border the edges of the two sinkholes is also subsiding, the scientists observed. An area more than half a mile (1 kilometer) northeast of No. 2 sank at a rate of 1.6 inches (4 centimeters) in just four months.
Ground northeast of sinkholes is subsiding, suggesting new ones forming
The largest rate of ground subsidence is not at either sinkhole, but at an area about seven-tenths of a mile (1.2 kilometers) northeast of No. 2. Ground there is subsiding at a rate of more than 5 inches (13 centimeters) a year.
It’s aerial extent, the researchers report, has also enlarged over the past eight years when a previous survey was done.
“The enlarged deformation could be an alarming precursor to the potential future development of hazards in the vicinity,” said the authors.
Additionally, ground along a road traveled by oil field vehicles, about a quarter mile (400 meters) directly north of No. 2, is subsiding about 1.2 inches (3 centimeters) a year.
Ground’s movement detected with radar technique
The satellite radar datasets were collected over five months between April 2015 and August 2015. With them, the geophysicists observed both two-dimension east-west deformation of the sinkholes, as well as vertical deformation.
The SMU scientists used a technique called interferometric synthetic aperture radar, or InSAR for short, to detect changes that aren’t visible to the naked eye.
“From 435 miles above the Earth’s surface, this InSAR technique allows us to measure inch-level subsidence on the ground. This is a monumental human achievement, and scientists will not stop endeavoring to improve this technique for more precise measurements,” said Lu, who is world-renowned for leading scientists in InSAR applications. Lu is a member of the Science Definition Team for the dedicated U.S. and Indian NASA-ISRO InSAR mission, set for launch in 2020 to study hazards and global environmental change.
InSAR accesses a series of images captured by a read-out radar instrument mounted on the orbiting satellite Sentinel-1A. Sentinel-1A was launched in April 2014 as part of the European Union’s Copernicus program.
Simply put, Sentinel-1A bounces a radar signal off the earth, then records the signal as it bounces back, delivering measurements. The measurements allow geophysicists to determine the distance from the satellite to the ground, revealing how features on the Earth’s surface change over time.
“Sinkhole formation has previously been unpredictable, but satellite remote sensing provides a great means to detect the expansion of the current sinkholes and possible development of new sinkholes,” said Kim. “Monitoring the sinkholes and modeling the rate of change can help predict potential sinkhole development.”
Sentinel-1A data were obtained from Sentinels Scientific Data Hub – Copernicus. Groundwater well data came from the Texas Water Development Board.
The calving front of the Jakobshavn Glacier in western Greenland. Credit: Jefferson Beck, NASA
An ancient basin hidden beneath the Greenland ice sheet, discovered by researchers at the University of Bristol, may help explain the location, size and velocity of Jakobshavn Isbræ, Greenland’s fastest flowing outlet glacier.
The research also provides an insight into what past river drainage looked like in Greenland, and what it could look like in the future as the ice sheet retreats.
Michael Cooper and colleagues from Bristol’s School of Geographical Sciences and Cabot Institute, and Imperial College London, studied the bedrock in Greenland using data collected mainly by NASA (through Operation Ice Bridge), as well as various researchers from the UK and Germany, over several decades. This data is collected by aircraft using ice penetrating radar, which bounces back off the bedrock underneath the ice (as ice is mostly transparent to radio waves at certain frequencies).
Mr Cooper said: “The drainage basin we discovered shows signs of being carved by ancient rivers, prior to the extensive glaciation of Greenland (i.e. before the Greenland Ice Sheet existed), rather than being carved by the movement of ice itself. It has been remarkably well preserved – and has not been eroded away by successive glaciations. The channel network has never been seen before by humans – it was last uncovered around 3.8 million years ago.”
The size of the drainage basin the team discovered is very large, at around 450,000 km2, and accounts for about 20 per cent of the total land area of Greenland (including islands).
This is comparable to the size of the Ohio River drainage basin, which is the largest tributary of the Mississippi. The channels the team mapped could more appropriately be called ‘canyons’, with relative depths of around 1,400 metres in places, and nearly 12km wide, all hidden underneath the ice.
As well as being an interesting discovery of great size, the channel network and basin was instrumental in influencing the flow of ice from the deep interior to the margin, both now and over several glacial cycles, as well as influencing the location and speed of the Jakobshavn ice stream.
Reference:
M. A. Cooper et al. Palaeofluvial landscape inheritance for Jakobshavn Isbrae catchment, Greenland, Geophysical Research Letters (2016). DOI: 10.1002/2016GL069458
Today, plant and animal biodiversity across the globe tends to be highest at the equator and diminishes as one moves to higher latitudes. This pattern, called the latitudinal diversity gradient, has not always existed, new research finds. Credit: Julie McMahon
It’s called the latitudinal diversity gradient, a phenomenon seen today in most plant and animal species around the world: Biodiversity decreases from the equator to higher latitudes. A new study of fossils representing 63 million of the past 65 million years reveals that—for North American mammals, at least—the modern LDG is the exception rather than the rule.
The findings, reported in the Proceedings of the National Academy of Sciences, point to the importance of not assuming that the way things are today is the way they’ve always been, the researchers say.
“The LDG says there are more species at the equator than at the poles,” said Jonathan Marcot, a University of Illinois animal biology professor who conducted the study with David Fox and Spencer Niebuhr of the University of Minnesota. “This has been considered a first-order pattern of biodiversity, meaning one of the most general patterns in ecology. You find it in mammals, you find it in birds, you find it in insects, you find it in plants, you find it in the ocean and you find it on land.”
It may seem obvious that more species can thrive in the relative warmth of lower latitudes, but that intuition about biodiversity may not always have been true, Marcot said. A warming planet does not necessarily lead to more diversity everywhere on the planet. It could just as easily lead to an expansion, or shifting, of individual species’ ranges, with no corresponding increase in the overall number of species, he said.
“If you go back a few thousand years ago, before we lost a lot of the large mammals that we had in North America, and probably for millions or tens of millions of years before this, we had horses in the higher latitudes, we had mammoths, we had rhinoceroses. Things that you find mostly in southern latitudes today, we had in northern latitudes as well,” Marcot said.
A 2011 study by Marcot, Fox and other colleagues looked at fossils of mammals from many latitudes in western North America between 58 million and 63 million years ago. As in the current study, they used the Paleobiology Database for information about the fossils, the latitudes at which they were found and their ages.
“It turns out the mammalian fossil record of North America is the best- or one of the best-sampled terrestrial records for this sort of analysis,” Marcot said.
That study found no evidence of a latitudinal diversity gradient for North American mammals at that time, only a few million years after the extinction of nonavian dinosaurs. A look at oxygen isotope ratios in the bones, which can be used to determine ancient temperatures, found evidence that the temperature gradient during that time period, the Paleocene, was similar to that of modern times.
“There was no biodiversity gradient back then as there is now,” Marcot said. “Our question in the new study was, when did it change and how did it change?”
To answer this, the team turned again to the fossil record, this time looking at 27,903 fossil occurrences in all latitudes of North America representing 63 million years of mammalian life—from the time of the dinosaur extinctions to 2 million years ago. They compared mammalian species diversity at every latitude and every time period for which sufficient data were available. They also analyzed diversity in relation to the record of temperature changes over the same time period.
“What we found is that for most of the time that we considered, from 65 million years ago to about 10 million years ago, there was no strong evidence for a gradient,” Marcot said. “There were roughly as many animal species in the northern parts of North America as there were in the southern regions.”
Between 10 million and 4 million years ago, “we start to see a strengthening of a gradient,” he said. “And finally, we found strong evidence for a negative gradient—that is, more species in the south than in the north—starting around 4 million years ago.”
The team also analyzed the gradient in relation to the record of temperature changes over the same time period and found “a statistically significant correlation between temperature and the diversity gradient, meaning that the colder it gets, the stronger the diversity gradient gets for North American mammals,” Marcot said.
The new findings point to the importance of not only studying living organisms but also considering the fossil record of past life and environments, Marcot said.
Humans can learn a lot from life on Earth today, he said. “But given how much we know climates have changed and species have changed, there’s no reason to suspect that the patterns we find today necessarily will have applied 10, 20 or 100 million years ago. If we understand what things were like then and what they’re like now, we can begin to understand how Earth is connected to life and how they change together.”
“The fossil record often amazes and intrigues us with the unusual and unexpected life forms we continue to discover, but it also harbors surprising large-scale patterns that are only evident from compilations of the data gathered from field sites by many generations of paleontologists,” Fox said. “And sometimes those patterns do not correspond at all to our expectations from the patterns exhibited by living organisms.”
Reference:
Late Cenozoic onset of the latitudinal diversity gradient of North American mammals, PNAS, DOI: 10.1073/pnas.1524750113
An LEM showing coastal response to a dome of dynamic uplift, as it moves across the landscape from left to right at two centimeters a year. The dome is centered in Panel C, in the lower lefthand corner. Credit: Image courtesy of Syracuse University
Robert Moucha, assistant professor of geophysics, and Gregory Ruetenik, a Ph.D. student in Earth sciences, have collaborated with Gregory Hoke, associate professor of Earth sciences, on a unique numerical modeling study that simulates changing terrain over millions of years. Their study shows that moderate changes in dynamic topography produce an erosional response in the form of increased sediment flux to continental margins (i.e., the rate of sediments supplied to margins by streams and rivers).
Their findings are the subject of an article in Terra Nova (Wiley Online Library, 2016), and have major implications for the study of geomorphology, geodynamics and climate.
“This kind of modeling contributes to our understanding of mantle convection,” says Moucha, referring to the process in which heat from inside Earth rises to the surface. “By drawing on elements of physics, chemistry and mathematics, we can infer how Earth’s surface evolution is affected by mantle convection and the interaction with various crust and surface processes, including the climate.”
Erosional response usually persists long after dynamic topography, and is dependent on the interplay of uplift rate, rock and soil erosion and initial topography.
Dynamic topography is the resulting surface deformation, characterized by long, low-amplitude, wave-length undulations, driven by convection in Earth’s mantle.
Because changes in dynamic topography occur over millions of years, geophysicists often rely on backward-in-time models to estimate global mantle flow and changes in dynamic topography. Evaluating these models, however, can be problematic.
“Comparing backward-in-time models of dynamic topography with observed offshore sedimentary records is challenging,” Moucha says. “The problem with this approach is that it’s difficult to deconvolve the observed record into contributions from changes in climate, tectonics and dynamic topography. As a result, we get disparities in our comparisons.”
To rectify the situation, Ruetenik and Moucha have constructed a landscape evolution model (LEM) that quantifies landscape responses to moderate changes in dynamic topography.
LEMs are nothing new — geophysicists have been using the grid-like programs since the ’90s to simulate fluvial and slope erosion — but Ruetenik and Moucha have taken enhanced computing to a new level. Their LEM uses advanced mathematical modeling to show how processes such as climate, erosion and uplift influence the formation of river systems and drainage areas over large continental scales and tens of millions years.
This is in contrast to traditional LEMs, which are designed for regional studies and periods between 10,000-100,000 years, and, thus, are unable to capture large-scale changes in dynamic topography.
“Our focus here was to characterize the erosional response to changes in dynamic topography, in terms of the sedimentary flux to continental margins,” Moucha says. “We also considered the effects of offshore sediment deposition and changes in precipitation.”
A versatile scientist in large-scale geophysics and geodynamics, Moucha is interested in the topography of Africa, Norway and the southwestern United States and in long-term sea-level change along the eastern coast of North America.
His new LEM utilizes a hypothetical continental that moves from east to west, across a 200-meter-high, 200-kilometer-wide dynamic topography dome. The purpose of the dome, he says, is to record erosion and sedimentation, as well as drainage basin evolution.
“We’ve found that moderate changes in dynamic topography modulated the erosional response of landscapes with pre-existing relief,” Moucha says. “This results in enhanced sediment flux that can persist for tens of millions of years, as the landscape re-equilibrates. The response is maximized when moderate changes [in dynamic topography] are long-lived and erodibility is high.”
He and Ruetenik also have found that the stream and river network is dependent on the direction of the wave of uplift sweeping across the landscape.
“Upstream propagation is more likely to reroute streams, whereas streams maintain their course when propagation is downstream,” Moucha says. “This kind of research provides a roadmap for understanding the tectonic evolution of our planet. It also creates a framework for integrating independent geophysical techniques with geological observations.”
Reference:
Gregory A. Ruetenik, Robert Moucha, Gregory D. Hoke. Landscape Response to Changes in Dynamic Topography. Terra Nova, 2016; DOI: 10.1111/ter.12220
Note: The above post is reprinted from materials provided by Syracuse University. The original item was written by Rob Enslin.
MDRS Expedition 143 Commander Paul Knightly walking through stands of Ericameria nauseosa and Epehdra viridis while wearing a simulated spacesuit. Credit: Paul C. Sokoloff; CC-BY 4.0
Future Martian explorers might not need to leave the Earth to prepare themselves for life on the Red Planet. The Mars Society have built an analogue research site in Utah, USA, which simulates the conditions on our neighbouring planet.
Practicing the methods needed to collect biological samples while wearing spacesuits, a team of Canadian scientists have studied the diverse local flora. Along with the lessons that one day will serve the first to conquer Mars, the researchers present an annotated checklist of the fungi, algae, cyanobacteria, lichens, and vascular plants from the station in their publication in the open-access journal Biodiversity Data Journal.
Located in the desert approximately 9 km outside of Hanksville, Utah, and about 10 km away from the Burpee Dinosaur Quarry, a recently described bone bed from the Jurassic Morrison Formation, the Mars Desert Research Station (MDRS) was constructed in 2002. Since then, it has been continuously visited by a wide range of researchers, including astrobiologists, soil scientists, journalists, engineers, and geologists.
Astrobiology, the study of the evolution and distribution of life throughout the universe, including the Earth, is a field increasingly represented at the MDRS. There, astrobiologists can take advantage of the extreme environment surrounding the station and seek life as if they were on Mars. To simulate the extraterrestrial conditions, the crew members even wear specially designed spacesuits so that they can practice standard field work activities with restricted vision and movement.
In their present research, the authors have identified and recorded 38 vascular plant species from 14 families, 13 lichen species from seven families, 6 algae taxa including both chlorophytes and cyanobacteria, and one fungal genus from the station and surrounding area. Living in such extreme environments, organisms such as fungi, lichens, algae, and cyanobacteria are of particular interest to astrobiologists as model systems in the search for life on Mars.
However, the authors note that there is still field work to be executed at the site, especially during the spring and the summer so that the complete local diversity of the area can be captured.
“While our present checklist is not an exhaustive inventory of the MDRS site,” they explain, “it can serve as a first-line reference for identifying vascular plants and lichens at the MDRS, and serves as a starting point for future floristic and ecological work at the station.”
Reference:
Paul Sokoloff, Colin Freebury, Paul Hamilton, Jeffery Saarela. The “Martian” flora: new collections of vascular plants, lichens, fungi, algae, and cyanobacteria from the Mars Desert Research Station, Utah. Biodiversity Data Journal, 2016; 4: e8176 DOI: 10.3897/BDJ.4.e8176
Note: The above post is reprinted from materials provided by Pensoft Publishers. The original story is licensed under a Creative Commons License.
Cave of the Crystals or Giant Crystal Cave is a cave connected to the Naica Mine 300 metres (980 ft) below the surface in Naica, Chihuahua, Mexico.
One of the world’s most spectacular geographical discoveries was the cave of giant crystals with its selenite crystals of a size never seen before. most of them measure six meters in length, with some of them reaching eleven meters. the temperature at this depth varies from 45°C to 50°C, while the percentage of humidity ranges from 90 to 100%, meaning that human beings cannot survive there for longer than two hours.
In the year 2000 at -300 m the Crystals’ cave was discovered. This cave is a true wonder of the underground world. It is one of the most spectacular geological and mineralogical discoveries ever made. It contains selenite mega crystals, some 11m in length and one meter thick. These are much larger than any crystals of this type ever found. The walls and particularly the floor of the cave are sprinkled with blocky single crystals that in some cases cluster to form a parallel aggregate.
Giant elongate selenite mega crystals, the biggest ever found on the planet, grow from some of these groups of blocky crystals or directly from the floor, and some criss-cross the cave from side to side. Most of the crystals are 6 meters long but several reach 11 m creating a natural scenario of unparalleled beauty, beyond imagination, an unreal dream world discovered by chance.
The cave’s temperature is 50ºC and 100% humidity, where man can survive only a few minutes. It will continue to be explored with new, specially designed gear, which allows the explorer to remain in the cave for almost one hour. The Crystals’ Cave gives us a glimpse into geological time, thanks to new space-age technology.
Exploring teams, film teams and scientists continue to risk their lives at these hellish temperatures, in order to document this gorgeous underground fantasy-land for future generations.
Formation of the crystals
Naica lies on an ancient fault above an underground magma chamber below the cave. The magma heated the ground water which was saturated with sulfide ions (S2−). Cool oxygenated surface water contacted the mineral saturated heated water, but the two did not mix due to the difference in their densities. The oxygen slowly diffused into the heated water and oxidized the sulfides (S2−) into sulfates (SO42−). The hydrated sulfate gypsum crystallized at an extremely slow rate of over the course of at least 500,000 years forming the enormous crystals found today. The key to this process is the slow diffusion of oxygen from the cool, low density surface water into the hot, high density ground water.
Discovery
In 1910 miners discovered a cavern beneath the Naica mine workings, the Cave of Swords (Spanish: Cueva de las Espadas). It is located at a depth of 120 m, above the Cave of Crystals, and contains spectacular, smaller (1 m long) crystals. It is speculated that at this level, transition temperatures may have fallen much more rapidly, leading to an end in the growth of the crystals.
Giant Crystal Cave was discovered in 2000 by miners excavating a new tunnel for the Industrias Peñoles mining company located in Naica, Mexico, while drilling through the Naica fault, which they were concerned would flood the mine. The mining complex in Naica contains substantial deposits of silver, zinc and lead.
The Cave of Crystals is a horseshoe-shaped cavity in limestone. Its floor is covered with perfectly faceted crystalline blocks. Huge crystal beams jut out from both the blocks and the floor. The caves are accessible today because the mining company’s pumping operations keep them clear of water. If the pumping were stopped, the caves would again be submerged in water. The crystals deteriorate in air, so the Naica Project is attempting to visually document the crystals before they deteriorate further.
Two other smaller caverns were also discovered in 2000, Queen’s Eye Cave and Candles Cave, and a further chamber was found in a drilling project in 2009. The new cave, named Ice Palace, is 150 m deep and is not flooded, but its crystal formations are much smaller, with small ‘cauliflower’ formations and fine, threadlike crystals. All of the caves discovered currently are: Cave of Crystals, Queen’s Eye, Candles Cave, Ice Palace and Cave of Swords.
Calcite tests of extinct species of planktonic foraminifera from the Eocene epoch (>34 million years) of Tanzania. The largest is less than a millimetre in size. Credit: Image courtesy of Paul N. Pearson, Cardiff University
The number of species that can exist on Earth depends on how the environment changes, according to new research led by the University of Southampton.
By analysing the fossil record of microscopic aquatic creatures called planktonic foraminifera, whose fossil remains now resemble miniaturised popcorn and date back millions of years, the research provided the first statistical evidence that environmental changes put a cap on species richness.
Lead author of the study, published in the journal Ecology Letters, Dr Thomas Ezard, an evolutionary ecologist at the University of Southampton, said: “While the idea of infinite species on a finite Earth is clearly fanciful, the relevance of upper limits to diversity is still a fractious debate amongst evolutionary biologists, ecologists and palaeontologists.
“We are the first to show statistically that this upper limit is environmentally dependent. It’s intuitive that a changing environment alters how many species we see — the spatial gradient of more species in the tropics than at the poles is pervasive evidence for its large-scale impact.
“However, analyses of how species numbers have changed over time have assumed that any limit has always been the same, even through periods of massive climate upheaval. Our data reject this idea of fixed rules for competition among species and instead show that the limit to the number of species that can co-exist on Earth is much more dynamic. Climate and geology are always changing, and the limit changes with them.”
While previous research typically focused individually on either biological, climate change or geological explanations, this new research examined the co-dependence of these factors on how species interact.
Looking at the fossil history of 210 evolutionary species of macroperforate planktonic foraminifera in the Cenozoic Era from 65 million years ago to the present, the study found that the number of species was almost certainly controlled by competition among themselves and probably kept within a finite upper limit.
Dr Ezard added: “We used mathematical models to reveal how environmental changes influence both the rate of diversification among species and how many species can co-exist at once. Our results suggest that the world is full of species, but that the precise fullness varies through time as environmental changes alter the outcome of competition among species.”
The study also involved Professor Andy Purvis from the Natural History Museum. He said: “Scientists have long argued that environmental changes are likely to impact the number of species that can co-exist on Earth, but the fossil record is usually too incomplete for powerful statistical testing. Microfossils — especially planktonic foraminifera — give us a record with almost no gaps. It’s this complete evolutionary history that lets us decide between these different hypotheses of how species interacted millions of years ago.”
Reference:
Thomas H. G. Ezard, Andy Purvis. Environmental changes define ecological limits to species richness and reveal the mode of macroevolutionary competition. Ecology Letters, 2016; DOI: 10.1111/ele.12626
A study of power plants in five states has found that metals and other toxic materials are able to leach out of the unlined pits in which coal ash is currently stored. These materials have been found in surface waters and shallow groundwater, and may be able to work their way to the deeper groundwater resources used for drinking water wells. Credit: Duke University
A Duke University study of coal ash ponds near 21 power plants in five Southeastern U.S. states has found evidence that nearby surface waters and groundwater are consistently and lastingly contaminated by the unlined ponds.
High levels of toxic heavy metals including arsenic and selenium were found in surface waters or groundwater at all of the sites tested. Concentrations of trace elements in 29 percent of the surface water samples exceeded EPA standards for drinking water and aquatic life.
“In all the investigated sites, we saw evidence of leaking,” said Avner Vengosh, a professor of geochemistry and water quality in Duke University’s Nicholas School of the Environment. “Some of the impacted water had high levels of contaminants.”
The study, which appears June 10 in the journal Environmental Science & Technology, did not test drinking water wells, but that will be the next phase of the research, Vengosh said.
During the summer and fall of 2015, the team sampled 39 surface water and seep samples from coal ash ponds at seven sites. They also analyzed water chemistry data from 156 shallow groundwater monitoring wells near coal ash ponds at 14 North Carolina power plants that had been compiled by the state’s Department of Environmental Quality.
Shallow wells — typically 30- to 50-feet deep — are not as deep as a drinking water well, which might be 100 to 300 feet. But there’s a potential the shallower contamination could flow deeper and affect drinking wells, Vengosh said.
Not only was the evidence of contamination widespread, it also appears to be persistent in the environment. Some of the sites studied have been retired and no new coal ash is being deposited there, but nearby surface waters, and in one case groundwater, were still being contaminated.
“The degree to which leakage affects the concentration of toxins in nearby waters varies because of several factors, including the nature of the coal ash, processes in the pond and the flow through the local soil,” said Jennie Harkness, a Ph.D. student at the Nicholas School and the lead author of this study.
While it is legally permitted for some coal ash ponds to release liquid effluents to nearby surface waters through regulated outfalls, the new data show that these ponds are also leaking in unpermitted ways. “Coal ash ponds pose risks to the environment and water resources,” Vengosh said.
The highest concentrations of dissolved metals and metalloids (manganese, vanadium, selenium, arsenic and molybdenum) were found in shallow wells near a retired ash-disposal site in Tennessee. The contaminated groundwater there had concentrations exceeding drinking water and aquatic life standards for cadmium, iron, nickel, lead, selenium and zinc.
Vengosh said it is reasonable to conclude from these findings that physically removing the coal ash ponds would leave “a legacy of contamination. You would still have a major issue to address the subsurface groundwater contamination. After decades of leaking, the impact has already happened.”
Reference:
“Evidence for Coal Ash Ponds Leaking in Southeastern United States,” Jennifer Harkness, Barry Sulkin and Avner Vengosh. Environmental Science and Technology, online June 10, 2016. DOI: 10.1021/acs.est.6b01727
Wahyoe Hantoro in Liang Luar Cave, Flores. Credit: Garry K. Smith
Scientists have found past El Niño oscillations in the Pacific Ocean may have amplified global climate fluctuations for hundreds of years at a time.
The team uncovered century-scale patterns in Pacific rainfall and temperature, and linked them with global climate changes in the past 2000 years.
For example, northern hemisphere warming and droughts between the years 950 and 1250 corresponded to an El Niño-like state in the Pacific, which switched to a La Niña-like pattern during a cold period between 1350 and 1900.
The new data will help scientists build more accurate models of future climate, said member of the research team, Alena Kimbrough, from The Australian National University.
“Our work is a significant piece in the grand puzzle. The tropics are a complicated, yet incredibly important region to global climate and it’s been great to untangle what’s happening,” said Ms Kimbrough, a PhD student at the ANU Research School of Earth Sciences.
“The current models struggle to reflect century-scale changes in the El Niño Southern Oscillation (ENSO).
“We’ve shown ENSO is an important part of the climate system that has influenced global temperatures and rainfall over the past millennium.”
The team measured trace elements and stable isotopes in stalagmites from the Indonesian island of Flores to reconstruct ancient rainfall, and compared it with records from East Asia and the central-eastern equatorial Pacific.
The El Niño Southern Oscillation is an irregular variation in winds and sea surface temperatures over the tropical eastern Pacific Ocean. In one extreme it brings high temperatures and drought to eastern Australia and Indonesia, and the opposite extreme, known as La Niña, heavy rainfall and storms.
“In the past decade or so the rise in global temperature had a brief reprieve, the so-called warming hiatus, which can be partly attributed to a persistent La Niña pattern over that period,” Ms Kimbrough said.
The new work found periods of predominantly El Niño-like patterns for several hundred years that alternate with La Niña patterns, impacting on global climate over the last 2000 years.
“Until we can model this lower-frequency behaviour in the tropical Pacific, one can only speculate on how the warming will play out over the next few decades,” said lead author Dr Michael Griffiths from William Paterson University, in the United States.
The international team of scientists was led by Dr Michael Griffiths of William Patterson University in New Jersey, along with PhD candidate Alena Kimbrough and Dr Michael Gagan at the ANU, Professor Wahyoe Hantoro of the Indonesian Institute of Sciences and colleagues at the University of Melbourne and the University of Arizona.
The research is published in Nature Communications.
Reference:
Michael L. Griffiths, Alena K. Kimbrough, Michael K. Gagan, Russell N. Drysdale, Julia E. Cole, Kathleen R. Johnson, Jian-Xin Zhao, Benjamin I. Cook, John C. Hellstrom, Wahyoe S. Hantoro. Western Pacific hydroclimate linked to global climate variability over the past two millennia. Nature Communications, 2016; 7: 11719 DOI: 10.1038/NCOMMS11719
A proposed perennial plate tectonic map. Present-day plate boundaries (white lines), with hidden ancient plate boundaries that may reactivate to control plate tectonics (yellow lines). Regions where mantle lithosphere heterogeneities have been located are given by yellow crosses. Credit: Russell Pysklywec, Philip Heron, Randell Stephenson
Super-computer modelling of Earth’s crust and upper-mantle suggests that ancient geologic events may have left deep ‘scars’ that can come to life to play a role in earthquakes, mountain formation, and other ongoing processes on our planet.
This changes the widespread view that only interactions at the boundaries between continent-sized tectonic plates could be responsible for such events.
A team of researchers from the University of Toronto and the University of Aberdeen have created models indicating that former plate boundaries may stay hidden deep beneath the Earth’s surface. These multi-million-year-old structures, situated at sites away from existing plate boundaries, may trigger changes in the structure and properties at the surface in the interior regions of continents.
“This is a potentially major revision to the fundamental idea of plate tectonics,” says lead author Philip Heron, a postdoctoral fellow in Russell Pysklywec’s research group in U of T’s Department of Earth Sciences. Their paper, “Lasting mantle scars lead to perennial plate tectonics,” appears in the June 10, 2016 edition of Nature Communications.
Heron and Pysklywec, together with University of Aberdeen geologist Randell Stephenson have even proposed a ‘perennial plate tectonic map’ of the Earth to help illustrate how ancient processes may have present-day implications.
“It’s based on the familiar global tectonic map that is taught starting in elementary school,” says Pysklywec, who is also chair of U of T’s Department of Earth Sciences. “What our models redefine and show on the map are dormant, hidden, ancient plate boundaries that could also be enduring or “perennial” sites of past and active plate tectonic activity.”
To demonstrate the dominating effects that anomalies below the Earth’s crust can have on shallow geological features, the researchers used U of T’s SciNet – home to Canada’s most powerful computer and one of the most powerful in the world- to make numerical models of the crust and upper-mantle into which they could introduce these scar-like anomalies.
The team essentially created an evolving “virtual Earth” to explore how such geodynamic models develop under different conditions.
“For these sorts of simulations, you need to go to a pretty high-resolution to understand what’s going on beneath the surface,” says Heron. “We modeled 1,500 kilometres across and 600 kilometres deep, but some parts of these structures could be just two or three kilometres wide. It is important to accurately resolve the smaller-scale stresses and strains.”
Using these models, the team found that different parts of the mantle below the Earth’s crust may control the folding, breaking, or flowing of the Earth’s crust within plates – in the form of mountain-building and seismic activity – when under compression.
In this way, the mantle structures dominate over shallower structures in the crust that had previously been seen as the main cause of such deformation within plates.
“The mantle is like the thermal engine of the planet and the crust is an eggshell above,” says Pysklywec. “We’re looking at the enigmatic and largely unexplored realm in the Earth where these two regions meet.”
“Most of the really big plate tectonic activity happens on the plate boundaries, like when India rammed into Asia to create the Himalayas or how the Atlantic opened to split North America from Europe,” says Heron. “But there are lots of things we couldn’t explain, like seismic activity and mountain-building away from plate boundaries in continent interiors.”
The research team believes their simulations show that these mantle anomalies are generated through ancient plate tectonic processes, such as the closing of ancient oceans, and can remain hidden at sites away from normal plate boundaries until reactivation generates tectonic folding, breaking, or flowing in plate interiors.
“Future exploration of what lies in the mantle beneath the crust may lead to further such discoveries on how our planet works, generating a greater understanding of how the past may affect our geologic future,” says Heron.
The research carries on the legacy of J. Tuzo Wilson, also a U of T scientist, and a legendary figure in geosciences who pioneered the idea of plate tectonics in the 1960’s.
“Plate tectonics is really the cornerstone of all geoscience,” says Pysklywec. “Ultimately, this information could even lead to ways to help better predict how and when earthquakes happen. It’s a key building block.”
Reference:
Philip J. Heron, Russell N. Pysklywec & Randell Stephenson. Lasting mantle scars lead to perennial plate tectonics. DOI:10.1038/ncomms11834
This image is of the crystal structure of the reconstructed trytophan synthase complex. Credit: Busch et al.
Researchers are resurrecting ancient bacterial protein complexes to determine how 3.5-billion-year-old cells functioned versus cells of today. Surprisingly, they are not that different, reports a study published June 9 in Cell Chemical Biology. Despite a popular hypothesis that primordial organisms had simple enzyme proteins, evidence suggests that bacteria around 500 million years after life began already had the sophisticated cellular machinery that exists today.
Fossils of 3.5-billion-year-old bacteria are not available, but scientists can reconstruct what their enzymes may have looked like based on phylogenetic trees of proteins from living bacteria. Comparing the amino acid sequences of more than 50 bacteria helped to computationally generate the sequences for the protein subunits of an enzyme complex that was very likely similar to that found in the bacteria’s last common ancestor. The researchers then produced this ancient enzyme complex to study its structure and function.
“There is a generally accepted theory (see bottom citation below) that states that very old enzymes were not as sophisticated as they are now,” says senior author Reinhard Sterner of the Institute of Biophysics and Physical Biochemistry at the University of Regensburg in Germany. “But we used the method of ancestral sequence reconstruction to go back as far as possible in evolutionary time to show that the tryptophan synthase complex from the last bacterial common ancestor was sophisticated–characterized by the high enzymatic activity and communication between subunits seen in modern enzyme complexes.”
“Our data and similar results that have been found by other people suggest that enzymes were already sophisticated 3.5 billion years ago, but this was a surprise because biological evolution started only about 4 billion years ago,” says co-author Rainer Merkl, also at Regensburg. “We conclude that in this very early phase of biological evolution–between 4 billion and 3.5 billion years ago–we probably have primitive enzymes with low efficiency, but this 500 million years was enough time for these enzymes to become fully sophisticated.”
What happened in that 500-million-year gap to place the evolutionary pressures on bacteria to make enzyme complexes is a mystery. Creating these structures is very difficult, as a complex involves multiple subunits that catalyze different reactions in isolation as well as in response to one another. Once formed, however, these complexes have not been seriously altered in billions of years of subsequent evolution, proving their efficiency.
Going forward, Sterner and his colleagues want to continue using the ancestral sequence reconstruction method to better understand the exact steps that led to the formation of the tryptophan synthase complex and its adaptation to specific habitats.
References:
Busch et al. Ancestral Tryptophan Synthase Reveals Functional Sophistication of Primordial Enzyme Complexes. Cell Chemical Biology, 2016 DOI: 10.1016/j.chembiol.2016.05.009
Section of rock core from the CO2 storage reservoir showing vesicular basalt with a well-defined fracture with calcium carbonate mineralization. Credit: Annette K. Mortensen.
An international team of scientists have found a potentially viable way to remove anthropogenic (caused or influenced by humans) carbon dioxide emissions from the atmosphere – turn it into rock.
The study, published today in Science, has shown for the first time that the greenhouse gas carbon dioxide (CO2) can be permanently and rapidly locked away from the atmosphere, by injecting it into volcanic bedrock. The CO2 reacts with the surrounding rock, forming environmentally benign minerals.
Measures to tackle the problem of increasing greenhouse gas emissions and resultant climate change are numerous. One approach is Carbon Capture and Storage (CCS), where CO2 is physically removed from the atmosphere and trapped underground. Geoengineers have long explored the possibility of sealing CO2 gas in voids underground, such as in abandoned oil and gas reservoirs, but these are susceptible to leakage. So attention has now turned to the mineralisation of carbon to permanently dispose of CO2.
Until now it was thought that this process would take several hundreds to thousands of years and is therefore not a practical option. But the current study – led by Columbia University, University of Iceland, University of Toulouse and Reykjavik Energy – has demonstrated that it can take as little as two years.
Lead author Dr Juerg Matter, Associate Professor in Geoengineering at the University of Southampton, says: “Our results show that between 95 and 98 per cent of the injected CO2 was mineralised over the period of less than two years, which is amazingly fast.”
The gas was injected into a deep well at the study site in Iceland. As a volcanic island, Iceland is made up of 90 per cent basalt, a rock rich in elements such as calcium, magnesium and iron that are required for carbon mineralisation. The CO2 is dissolved in water and carried down the well. On contact with the target storage rocks, at 400-800 metres under the ground, the solution quickly reacts with the surrounding basaltic rock, forming carbonate minerals.
“Carbonate minerals do not leak out of the ground, thus our newly developed method results in permanent and environmentally friendly storage of CO2 emissions,” says Dr Matter, who is also a member of the University’s Southampton Marine and Maritime Institute and Adjunct Senior Scientist at Lamont-Doherty Earth Observatory Columbia University. “On the other hand, basalt is one of the most common rock type on Earth, potentially providing one of the largest CO2 storage capacity.”
To monitor what was happening underground, the team also injected ‘tracers’, chemical compounds that literally trace the transport path and reactivity of the CO2. There were eight monitoring wells at the study site, where they could test how the chemical composition of the water had changed. The researchers discovered that by the time the groundwater had migrated to the monitoring wells, the concentration of the tracers – and therefore the CO2 – had diminished, indicating that mineralisation had occurred.
“Storing CO2 as carbonate minerals significantly enhances storage security which should improve public acceptance of Carbon Capture and Storage as a climate change mitigation technology,” says Dr Matter.
“The overall scale of our study was relatively small. So, the obvious next step for CarbFix is to upscale CO2 storage in basalt. This is currently happening at Reykjavik Energy’s Hellisheidi geothermal power plant, where up to 5,000 tonnes of CO2 per year are captured and stored in a basaltic reservoir.”
The investigation is part of the CarbFix project, a European Commission and U.S. Department of Energy funded programme to develop ways to store anthropogenic CO2 in basaltic rocks through field, laboratory and modelling studies.
A new tool will enable conservation experts to monitor the impact of climate change on the fabric of historic buildings and other heritage sites for up to a century at a time. Credit: Image courtesy of University of Lincoln
A new tool will enable conservation experts to monitor the impact of climate change on the fabric of historic buildings and other heritage sites for up to a century at a time.
The newly created Legacy Tool Indicator (LegIT) provides a means to assess continuously over timescales of up to a century indicators that a site might be vulnerable to the effects of climate change.
It combines known assessment methods already used by conservators — measurements from short-term exposure of fresh stone and studies of the weathering of historic gravestones — to track surface recession, salt crystallisation and biological growth.
It has been developed by researchers at the University of Lincoln, UK, and the Dublin Institute of Technology, Ireland, to enable the impact of climate change to be assessed for periods of between 30 and 100 years, a timescale referred to as the ‘climate change norm’ by meteorologists.
The tool has already been installed in five national monuments — including two World Heritage sites — in Éire which represent built heritage sites of high importance, as part of a pilot scheme to gather data. This was part-financed by the Department of Environment Heritage and Local Government of Ireland.
Dating back to the Megalithic to Post-Medieval periods (3,000BC to 1700AD), the historic sites were chosen to ensure different environmental conditions could be observed. The World Heritage site of Brú na Bóinne in County Meath and the monastery of Clonmacnoise in County Offaly are both rural, while the archaeological site of the Rock of Cashel in County Tipperary is semi-urban. The second World Heritage site, the rocky islands of Skellig Michael in County Kerry, is in an exposed coastal location, while Dublin Castle is urban.
The tool, which will monitor climate change at the sites for the next 100 years, is comprised of five 50mm3 cubes: four ‘reference’ cubes of historic brick, concrete, Peakmoor sandstone and Portland limestone, and one cube of stone specific to the location it is placed in. The reference cubes act as control samples for the site-specific stone and also allow comparisons between different locations. Each are attached to a stainless steel plate, and have been installed in discreet locations on the sites.
Researchers said the size of the cubes was chosen because they are likely to be more responsive to fluctuating temperature and moisture cycles than large blocks. This sensitivity to climatic influences should make the tool a good early indicator of surface weathering patterns.
LegIT is capable of gathering data without maintenance or management, and will eventually be degraded by the elements. It is this sacrificial aspect which means the tool can illustrate actual weathering as it occurs on heritage sites without costly upkeep.
Conservator Cathy Daly, from the School of History & Heritage at the University of Lincoln, developed the LegIT tool. She said: “In the cultural heritage sector the need for monitoring climate change on our heritage sites is widely agreed, yet there is a lack of consensus over what constitutes what constitutes effective and informative monitoring. This is due, at least in part, to the extended timescales involved.
“The hope and expectation is that the long-term data we can collect using this tool will allow trends and correlations to be determined. We want the LegIT to be a legacy in reality, not just in name, acting as a resource for conservators and heritage managers of the future.”
A summary of the technology behind the tool are published in the journal Heritage Science. Initial findings from the pilot study will be examined later this year.
Reference:
Cathy Daly. The design of a legacy indicator tool for measuring climate change related impacts on built heritage. Heritage Science, 2016; 4 (1) DOI: 10.1186/s40494-016-0088-z
Nambung National Park is a national park in the Wheatbelt region of Western Australia, 200 km northwest of Perth, Australia and 17 km south of the small coastal town of Cervantes. The park contains the Pinnacles Desert which is an area with thousands of limestone formations called pinnacles.
The park derives its name from an indigenous Australian word possibly meaning crooked or winding. The word was first used in 1938 when naming the Nambung River which flows into the park and disappears into a cave system within the limestone. The Yued people are the acknowledged traditional custodians of the land since before the arrival of Europeans.
Nambung National Park also contains beaches at Kangaroo Point and Hangover Bay, as well as coastal dunes and flowering plants in low heathland areas. A boardwalk in the northern area of the park at Lake Thetis allows visitors to view thrombolites which, like stromatolites, are structures built by micro-organisms, especially cyanobacteria. Some of the fossilized thrombolites have been dated to 3.6 billion years old. The Pinnacles Desert Discovery Centre features exhibits about the geology of the pinnacles formations and the cultural and natural heritage values of the area.
Geography
The park is bordered to the north by the Southern Beekeeper’s Nature Reserve and to the south by Wanagarren Nature Reserve. A large area of vacant Crown land is found along much of the eastern boundary while the Indian Ocean defines the park’s western boundary. Visitors can access the Pinnacles Desert from points north or south of Cervantes via the Indian Ocean Drive or via Cervantes Road from the east. The park is located 17 km south of Cervantes.
Geology
The Pinnacles Desert contains thousands of limestone pillars. The pillars are the weathered and eroded fragments of limestone beds composed of deposited marine organisms such as coral and molluscs. Some of the tallest pinnacles reach heights of up to 3.5m above the yellow sand base. The different types of formations include ones which are much taller than they are wide and resemble columns—suggesting the name of Pinnacles—while others are only a meter or so in height and width resembling short tombstones. A cross-bedding structure can be observed in many pinnacles where the angle of deposited sand changed suddenly due to changes in prevailing winds during formation of the limestone beds. Pinnacles with tops similar to mushrooms are created when the calcrete capping is harder than the limestone layer below it. The relatively softer lower layers weather and erode at a faster rate than the top layer leaving behind more material at the top of the pinnacle.