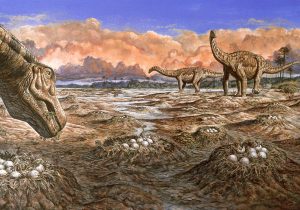
Sauropod dinosaurs at a shared nesting site in the Late Cretaceous. Artist: Mark Hallett. Source: “The Sauropods: Evolution and Paleobiology.” Kristina A. Curry Rogers and Jeffrey A. Wilson, eds. University of California Press, Berkeley, 2005.
Sauropod dinosaurs were the largest land-dwelling animals of all time, with highly elongated necks and tails that were held suspended above the ground.
Holding up such massive body parts would have placed huge stresses on the spine, especially at the flexible joints between the vertebrae. How was the sauropod skeleton able to bear such tremendous loads without causing injury or compromising mobility?
The structure of the neck joints may hold clues. It has long been recognized that sauropods had distinctive ball-and-socket vertebrae in their neck that fit together to create strong yet flexible joints. The ball of each joint always pointed away from the center of the body.
To understand the importance of such a consistent pattern, University of Michigan researchers built model ball-and-socket joints in the lab. Rubber molds were used to make epoxy models of the joints, with the ball facing either toward the body or away from it.
The epoxy allowed researchers to see where a joint was stressed when loaded with weights, increasing the risk of bone fractures. The researchers also measured the amount of weight needed to dislocate the joints.
They found that the orientation of the ball-and-socket joint did not affect the amount of stress on the joints or alter the risk of broken bones.
However, they also found that having the ball of the ball-and-socket joint facing away from the center of the body, as it is in sauropods, increased stability and made it much more difficult to dislocate the joint. When the vertebrae were positioned with the ball of the joint facing the center of the body, the joints failed sooner during weight-loading tests.
“We wanted to know whether there was an advantage to the pattern of having the ball facing away from the body, and whether this was important for the evolution of large size and long necks in sauropods,” said John Fronimos, who conducted the research as part of his doctoral dissertation in the U-M Department of Earth and Environmental Sciences.
“We found that this arrangement would have enabled sauropods to evolve longer and heavier necks and tails while avoiding catastrophic injury, all without needing to limit the motion of the neck or tail,” he said.
Fronimos is first author of a paper on the topic, “Polarity of concavo-convex intervertebral joints in the necks and tails of sauropod dinosaurs,” published online last month in the journal Paleobiology. The co-authors are Jeffrey Wilson and Tomasz Baumiller of the U-M Museum of Paleontology and the Department of Earth and Environmental Sciences.
Sauropod dinosaurs reached lengths of more than 100 feet and weighed up to 70 metric tons. Fossilized remains of sauropod dinosaurs have been found on every continent.
Fronimos said the team’s findings have applications beyond sauropods. Ball-and-socket joints in the shoulders and hips of other four-legged land animals also seem to be arranged for maximum stability, he said.
Reference:
John A. Fronimos, Jeffrey A. Wilson, Tomasz K. Baumiller. Polarity of concavo-convex intervertebral joints in the necks and tails of sauropod dinosaurs. Paleobiology, 2016; 1 DOI: 10.1017/pab.2016.16
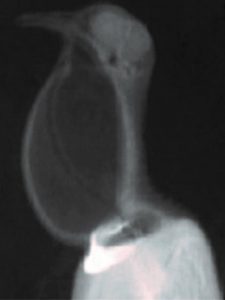
X-ray image of a ring dove (Streptopelia risoria) producing cooing sounds with a closed mouth. Credit: Tobias Riede
Dinosaurs are often depicted in movies as roaring ferociously, but it is likely that some dinosaurs mumbled or cooed with closed mouths, according to a study published online in the journal Evolution that will be in the August print edition.
The research examines the evolution of a specialized way birds emit sound — closed-mouth vocalization. The study emerges from a new collaboration, funded by a grant from the Gordon and Betty Moore Foundation, to understand the origin and evolution of the unique vocal organ of birds and the large array of sounds it can produce. Because birds descended from dinosaurs, the research may also shed light on how dinosaurs made sound.
Closed-mouth vocalizations are sounds that are emitted through the skin in the neck area while the beak is kept closed. To make them, birds typically push air that drives sound production into an esophageal pouch rather than exhale through the open beak. The coos of doves are an example of this behavior. Compared with sounds emitted through an open beak, closed-mouth vocalizations are often much quieter and lower in pitch. Birds making closed-mouth vocalizations usually do so only to attract mates or defend their territory. At other times, they emit sounds through an open mouth.
To understand when and how closed-mouth vocalization evolved, researchers with The University of Texas at Austin, Midwestern University in Arizona, Memorial University of Newfoundland and the University of Utah used a statistical approach to analyze the distribution of this vocal ability among birds and other reptilian groups. In total, the researchers identified 52 out of 208 investigated bird species that use closed-mouth vocalization.
“Looking at the distribution of closed-mouth vocalization in birds that are alive today could tell us how dinosaurs vocalized,” said Chad Eliason, a postdoctoral researcher at The University of Texas Jackson School of Geosciences and the study’s co-author. “Our results show that closed-mouth vocalization has evolved at least 16 times in archosaurs, a group that includes birds, dinosaurs and crocodiles.
Interestingly, only animals with a relatively large body size (about the size of a dove or larger) use closed-mouth vocalization behavior.”
Tobias Riede, a physiology professor at Midwestern University and the study’s first author, said the association with large bodies is a matter of physics.
“The inflation of an elastic cavity could present a size-dependent challenge,” Riede said. “The lung pressure required to inflate a cavity depends on the tension in the wall of the cavity, and this tension increases for smaller body sizes.”
Researchers still are not certain about how the ancestors of modern archosaurs vocalized. But the occurrence of closed-mouth vocalization across birds and crocodiles — the two surviving groups of archosaurs — indicates that closed-mouth vocalization can emerge in diverse archosaur species depending on behavioral or environmental circumstances, Riede said.
“A cool thing about this work is the demonstration that closed-mouth behavior evolved many times,” Riede said. “That suggests it can emerge fairly easily and be incorporated into mating displays.”
Because dinosaurs are members of the archosaur group, and many had large body sizes, it is likely that some dinosaurs made closed-mouthed vocalizations in a manner similar to birds today, perhaps during mating displays. However, at this point in time, no direct fossil evidence exists to reveal what dinosaurs sounded like.
Julia Clarke, a professor at the Jackson School of Geosciences and co-author, said the study offers clues.
“To make any kind of sense of what nonavian dinosaurs sounded like, we need to understand how living birds vocalize,” she said. “This makes for a very different Jurassic world. Not only were dinosaurs feathered, but they may have had bulging necks and made booming, closed-mouth sounds.”
Future research by this collaboration will integrate information from fossils, experimental physiology, gene expression and sound modeling to understand the sounds that extinct early avian species, and perhaps their dinosaur ancestors, produced.
Reference:
Tobias Riede, Chad Eliason, Edward H. Miller, Franz Goller andJulia Clarke. Coos, booms, and hoots: the evolution of closed-mouth vocal behavior in birds. DOI: 10.1111/evo.12988
New work by Italian geochemists seems to indicate that the current ground movement around one of the world’s most dangerous volcano systems may be due to gas pressure, and not because of a surge of volcanic magma. This work was recently presented at the Goldschmidt conference in Yokohama, Japan (30 June 2016).
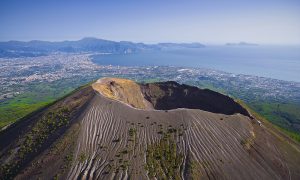
The Campi Flegrei (Phlegraean Fields), just across the Bay of Naples from the famous Vesuvius volcano, is amongst the most dangerous volcanos on Earth. In the past it has been capable of a “VEI 7” eruption (Volcanic Explosivity Index of 7, meaning that it has produced an explosive eruption even bigger than the famous Krakatoa eruption of 1883). However, this was around 40,000 years ago. The last eruption, “VEI 2” occurred in 1538 AD.
Because of the geological instability in the area, the land in this area can rise and fall by several metres over just a few years, a phenomenon known as Bradyseism. The last few years have seen the ground in the area begin to rise again, with a 38 cm rise recorded since late 2005. There have been worries that this may presage an eruption.
The last serious geological unrest in the area was in 1982-84, which saw ground levels rise by up to 1.8m. Most scientists think that the movement in this period was caused by mixed magmatic- hydrothermal activity (although some recent papers in the geochemical literature have suggested a major role for hydrothermal processes supported by deep magmatic gases, with pressurised water causing the land to rise). On the other hand, consensus exists that the current activity is caused by molten magma movement and accumulation under the Campi – which carries a greater risk of an eruption. Now however, a group of Geochemists from Second University of Naples and the Vesuvius Observatory think that the consensus has got it exactly the wrong way round.
Lead researcher, Professor Roberto Moretti (Seconda Università degli Studi di Napoli) commented:
“Everyone accepts the geochemical evidence that current activity has different causes to that of 1982-84. Most geochemists are now showing that the 1982-84 movement was caused by hydrothermal activity and the current activity is caused by magma, but we think that it’s exactly the other way round. We have checked geochemical records going back over more than 30 years, and our ongoing interpretation – looking at released gases and physical signals – seem to be consistent with current activity being hydrothermal, with the support of deep magmatic gases, rather than due to magma migration or growth of a shallow (3-4 km deep) magma chamber. We believe that this magma dynamics characterized the 1982-84 episode.
This is apparently better news, at least for now; activity in which magma moves upward and accumulates tends to be associated with an increased chance of an eruption. However the change from hydrothermal to magmatic activity can take place at any time, so we’re not in a position to say that everything is well under the Campi Flegrei. The Campi Flegrei is still a very volatile place. What it does show is the difficulty in interpreting the data, even from one of the most-studied volcanic areas in the world. Reconciling all of the data is a major issue, despite our efforts.
Achieving such a unique and consistent interpretation would probably require direct access to underground geochemical, geophysical and geochemical information in the areas of interest. However, there is still a debate over the safety of drilling in such a volatile area”.
Commenting, Professor Jon Blundy (University of Bristol) said:
“Interpreting the causes of ground movement at restless volcanoes is an enduring problem for volcanologists. Both hot gases (steam) and magma are candidate causes, but with quite different implications for future eruptive activity. Moretti and others make a compelling case for gas, rather than magma, as the cause of the latest bradyseisms at Campi Flegrei. Their methods could be used at other restless volcanoes where there is evidence of ground uplift”
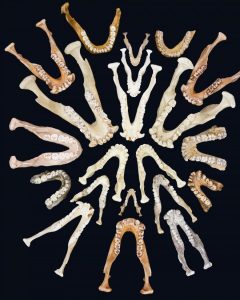
A collage of mandibles from extant and extinct Old World monkeys and apes that were included in the study. Credit: Leslea Hlusko, UC Berkeley
University of California, Berkeley paleontologists have identified distinctive features of primate teeth that allow them to track the evolution of our ape and monkey ancestors, shedding light on a mysterious increase in monkey species that occurred during a period of climate change 8 million years ago.
The inherited dental features will also help the researchers track down the genes that control tooth development, assisting scientists intent on regrowing rather than replacing teeth.
The features were discovered after detailed study of the shapes of molars and premolars inherited by baboons in a long-studied colony at the Southwest National Primate Research Center in San Antonio, Texas. Once it became clear that the relative lengths of the molars and premolars are an inherited trait much like eye color, the researchers measured these traits in the teeth of other primates, sifting through museum collections around the world.
The measurement data prove that the feature is inherited in a similar way in all primates — humans included — and varies across different species and genera in a way that mirrors the evolutionary relationships worked out earlier by analyzing bones and comparing genes.
“This shows that we can use the power of evolutionary history to unlock what is going on genetically in animals on whom you can’t experiment, such as humans,” said study leader Leslea Hlusko, a UC Berkeley associate professor of integrative biology. “We found two inherited traits, but identitying the traits is only the first step. We now have to figure out what the genome sequences are that underlie these traits, which will enable us to figure out what caused these evolutionary changes in dentition.”
Hlusko and her UC Berkeley colleagues — former postdoctoral fellow Christopher Schmitt, now at Boston University, and graduate students Tesla Monson and Marianne Brasil — along with Michael Mahaney of the University of Texas Rio Grande Valley in Brownsville, will publish their analysis next week in the Proceedings of the National Academy of Sciences.
The rise of monkeys and the decline of apes
When Hlusko and her colleagues looked at how the two newly identified traits changed in primates over the last 20 million years, they noticed an unusual shift in tooth shape at the same time apes began to die out and monkeys to proliferate. This took place about 8 million years ago, in the Miocene epoch, as Earth began to warm, the Mediterranean Sea dried up and Africa’s thick forests transitioned to grasslands and savannah. At the same time, numerous species of apes, which had lived across Africa and southern Europe, began to disappear, and monkeys evolved more lineages. Today there are 19 monkey genera, while apes have dwindled to only six: humans, chimpanzees, bonobos, gorillas, organutans and gibbons.
“If you go back into the Miocene, it was an ape world with essentially no or very few monkeys,” Hlusko said. “Now it is exactly the opposite: we have only a handful of apes and a whole lot of monkeys.”
The change in dentition suggests that monkeys took over a niche that apes previously occupied, though whether that was a dietary niche or had more to do with primate life cycle remains to be figured out, she said. Dentition can evolve not only because of changes in the types of food animals chew, but also as a result of changes in when and how they erupt during development.
“Monkeys moved into that ape niche, in terms of a dental pattern, but what exactly that means I don’t know yet,” said Hlusko, a member of UC Berkeley’s Human Evolution Research Center. “It may be something more complicated than just diet. Maybe it was the kind of food they ate at different stages of their lives, or it might have to do with the timing of major life history events that can influence the timing of tooth eruption, such as when they reached sexual maturity.”
Seeking simple inherited traits
Hlusko’s interest in the evolution of bones and teeth, and the genes that control them, comes out of her interest in paleontology and human origins. Over millions of years, our human and primate ancestors left a trail of teeth that she and other paleontologists have followed for clues to our evolutionary history.
Unfortunately, what is known about the 300 or more genes that control tooth development comes mostly from mouse studies, and their teeth are a lot different from those of primates, from which they diverged about 70 million years ago.
“Mice are a good model for understanding how teeth are made, but not a good model for understanding the finer details of how teeth evolved,” she said. “This is important from a dentistry perspective, because people are really interested in regenerating teeth so we don’t have to have fake teeth implanted into our jaws. To induce growth of a new one, however, it would be really useful to know how they grow naturally to begin with.”
In her search for genes important in dental development, Hlusko uses a classical quantitative genetics approach that applies the rules of heredity, discovered 150 years ago in Gregor Mendel’s studies of simple traits in peas, to not-so-simple traits like the sizes and shapes of teeth. Geneticists classify traits like tooth size and shape as “complex” because they are affected by DNA variations within many genes.
“Although biologically real, the individual effects of many of those genes, or variations within them, are quite small,” said Mahaney. “One of Hlusko’s goals is to detect and identify a few of these genes with major effects on variation in tooth size and shape in general. Such key genes likely would serve as signposts to biological pathways important to normal and disordered dental development.”
Several years ago, Hlusko used thousands of pedigreed mouse skeletons in UC Berkeley’s Museum of Vertebrate Zoology to show that the front of the mouth — the canines and incisors — is under totally separate genetic control from the back of the mouth — the molars and premolars. This means that, in adapting to changes in environment or diet, teeth in the front of the mouth can evolve independently of teeth in the back, or vice versa.
Now, with the help of 632 members of the baboon colony, she has found two measures of teeth in the back of the mouth that seem to be under the control of just a few genes. One is the ratio between the lengths of the third molar and the first molar; the other the ratio of the lengths of the second molar to the fourth premolar.
“Instead of thinking of each tooth as a separate unit, we found that the relative size of the first compared to last molar is an inherited trait, like earlobe attachment. The same goes for the relative size of the last premolar relative to the molars,” she said. “We’ve turned the dentition into simple traits, and from that, elucidated a major diversity shift in primate evolution. The next step is to look back to the genome and see if we can find the genes that underlie this.”
Based on measurements of teeth from 723 extant Old World monkeys from Africa and Asia — many of them measured by some 50 UC Berkeley undergraduate premed or predental students — she found that this group of monkeys also inherits the two traits as simply as eye color. When she looked further — measuring the teeth of 199 extant apes, 56 fossil Old World monkeys and 165 fossil apes — the pattern persisted. In all, the species she sampled represented 20 genera and 37 species of living and extinct monkeys and apes.
The analysis revealed that 20 million years ago, apes varied enormously in these dental traits. But monkeys began to evolve some of the same dental traits as apes, and replaced apes that had similar traits. Only a small number of apes with dental traits unlike today’s monkeys survived, including our ancestors.
“Only those apes with a specific range of dental features had a shot, and one of them was our ancestor,” she said. “That shift was an important first step in our lineage’s evolutionary history, and it set the stage for the evolution of standing up on two legs and pair bonding. And once you start pair bonding you open the door for all kinds of things, like extended childhood and more complex social interactions — all the kinds of things that humans do today.”
Hlusko has expanded her study to look at a broad range of mammal teeth — including many dire wolves from the La Brea tar pits in Los Angeles — to see whether these two traits are independently inherited in all animals.
The work was supported by the National Science Foundation. The Texas colony of Hamadryas baboons (Papio hamadryas) is funded in part by the National Institutes of Health.
Reference:
Leslea J. Hlusko, Christopher A. Schmitt, Tesla A. Monson, Marianne F. Brasil, and Michael C. Mahaney. The integration of quantitative genetics, paleontology, and neontology reveals genetic underpinnings of primate dental evolution. Proceedings of the National Academy of Sciences, 2016; DOI: 10.1073/pnas.1605901113
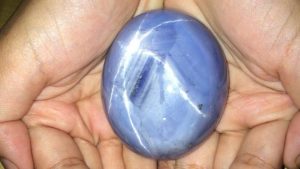
The blue star sapphire has been nicknamed The Star of Adam
News broke in Sri Lanka on New Year’s Day, of the discovery of the world’s largest known Blue Star Sapphire valued at a stunning US$ 100 million and hitting the scales at an incredible 1404.49 carats. The news spread like wild fire from Ratnapura, the City of Gems, where the stunning sapphire that has been named…… ‘The Star of Adam’ has dwarfed the next largest Blue Star Sapphire, a 1395 carat beauty on its own merit, once owned by the Guruge Brothers, but with its present ownership yet unknown.
The US$ 100 million cabochon-cut star sapphire flaunts a distinctly unique six-rayed beauty and is believed to have been mined at an undisclosed site, around August last year, between Ratnapura and Hatton, before it was sold to its current owner.
Speaking under the condition of anonymity the new owner of the stone said he bought it but never knew it would turn out to be the biggest star blue sapphire in the world.
He said the largest cut and polished blue star sapphire stone is in fact priceless, beyond the estimated US$ 100 million, and could only be sold to the highest bidder above that value. The authentication certificate obtained from the Gemology Institute of Colombo describes it as a 1404.49 carat star blue sapphire with a special note that it is the largest of its kind in the world. The proud but nervous owner of the stone said “when I purchased it many said I had paid an inordinately high price for it and should have settled for a sum at least 20 per cent below the price I paid.”
He said that even the seller did not know that it was the largest blue sapphire in the world.
“I was a bundle of nerves when I was told that it’s the biggest blue star sapphire in the world.”
The owner said it could fetch a fortune and is destined to be a priceless museum piece or a centre piece at an exhibition.
“It’s such a big stone that it and cannot set in any kind of jewellery” he said.
The owner’s international consultants have verified it and have no doubt that it is potentially the largest stone ever found and they themselves have shown a keen interest in purchasing it.
“I am not interested in selling it at the moment as it first needs international exposure,” he added.
He said that he named the stone ‘The Star of Adam’ based on the Muslim belief that Prophet Adam arrived in the bountiful land called Sri Lanka and when God discarded him from Paradise for eating ‘The Forbidden Fruit’ Adam lived on the slopes of the mountain now known in Sri Lanka as ‘Adam’s Peak’. The story goes that on this mountain he cried copiously and sought God’s forgiveness.
It is believed by some that it is these tears that became the resplendent gems in that region.
He also said that the Star of India, a grayish Blue Star Sapphire which was also mined in Sri Lanka and now housed in the American Museum of Natural History (AMNH) in New York weighs 563.35 carats. This gem was a donation to the AMNH by the exceedingly wealthy financier J.P. Morgan in the early 1900s.
He also said, the Star of Bombay weighing 182 carats, also of Sri Lankan origin, was gifted by the famous pre-World War II actor Douglas Fairbanks to his wife Mary Pickford. This gem lies in the Smithsonian National Museum of Natural History (SNMNH), Washington DC. Also at the SNMNH is the Star of Artaban, weighing 287 carats.
The Black Star of Queensland, from Australia, believed, until now, to have been the world’s largest star Sapphire, weighs 733 carats.
Of all the significantly large Star Sapphires mentioned above, only the Black Star of Queensland has a commercially valued price attached to it. The current owner, it is said, has set a negotiable price of US$ 88 million on the stone.
Given this fact, and considering the fact that the size of the Lankan ‘Star of Adam’ has very few close competitors, and also the fact that this gemstone is considered priceless, the current owner is yet to set a price tag on this exquisitely unique gem.
Note: The above post is reprinted from materials provided by ceylontoday.lk. The original article was written by Sulochana Ramiah Mohan.
Kyoto University researchers show that details about fault dip direction can be extracted from tsunami-borne electromagnetic fields. Such details may contribute to tsunami early warning systems that are more informative for residents of coastal areas. Credit: Eiri Ono/Kyoto University (K-CONNEX)
Could electromagnetic fields be used in tsunami early warning? New research shows that important focal parameters of tsunamigenic earthquakes — particularly fault dip direction — can be extracted from tsunami-borne EM fields.
“It’s been five years since we discovered that tsunamis generate EM fields,” says Hiroaki Toh, who led the Kyoto University study. “We’ve now demonstrated that tsunami-generated EM fields are a reliable and useful source of information for seismology,”
Tsunamis consist of large volumes of electrically conductive seawater, generating EM fields through the coupling of synchronous seawater motion with the Earth’s geomagnetic field. In a previous study, Toh’s team found that those tsunami-generated fields revealed information such as the height of the tsunami, its direction of travel, and its type (a rise wave or a backwash).
“This time we aimed to extract information about hypocenters of tsunamigenic earthquakes,” explains Toh.
Knowing the direction in which the fault dips could be helpful for tsunami early warning, as the direction sometimes determines whether a rise wave or a backwash hits a particular costal area.
“With backwash, residents of coastal areas get more time to evacuate. The real disaster is when rise waves come in your direction; you can’t afford to lose a single moment.”
“But fault dips are one of the most difficult characteristics to investigate. Even with modern techniques in seismology, seismic waves don’t always tell us the direction in which the fault is dipping. In these instances, we have to wait for aftershocks to occur and make inferences from them.”
Toh and former graduate student Issei Kawashima analyzed waves from a 2007 tsunami earthquake at the Kuril Trench, off the northeast coast of Hokkaido. With improvements to preexisting methods in calculating tsunamis’ phase velocity, they found that the fault dip lay to the southeast direction.
“EM fields have been measured on the ocean floor of the northwest Pacific since 2001,” says Toh. “This research further proves that EM fields from tsunamis are rich in information that can eventually be applied to global tsunami early warning.”
Reference:
Issei Kawashima, Hiroaki Toh. Tsunami-generated magnetic fields may constrain focal mechanisms of earthquakes. Scientific Reports, 2016; 6: 28603 DOI: 10.1038/srep28603
Note: The above post is reprinted from materials provided by Kyoto University.
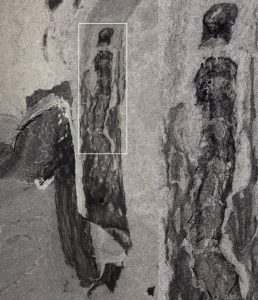
Detail of the Oesia fossil remains in margaretia ‘tube’. Credit: Karma Nanglu
The fossilised remnants of tube-like “dwellings” which housed a primitive type of prehistoric sea worm on the ocean floor have been identified in a new study.
According to researchers, the long, perforated tubes may have looked like narrow chimneys reaching up from the sea bed, and were made by a creature called Oesia, which lived a solitary existence inside them about 500 million years ago.
The findings emerge from a study undertaken by academics from Canada and the UK, in which they reassess fossils originally believed to have come from a type of seaweed called Margaretia. Instead, they found that these were the vestiges of tubular structures which protected these ancient worms.
The research, which is published in the journal BMC Biology, was carried out by academics from the Universities of Cambridge, Toronto and Montréal, and at the Royal Ontario Museum in Toronto.
Part of its importance is that it confirms Oesia was a primitive specimen from a group of creatures called hemichordates. These belong to a bigger group called deuterostomes, of which vertebrates (including humans) form a separate branch. By finding out more about these early creatures, researchers hope eventually to be able to identify and characterise a distant ancestor common to all deuterostomes, from sea worms to humans.
In particular, the research supports the increasingly common view that this ancestor was probably a “filter feeder,” which ate by sucking in water and straining out nutrients. Oesia was one such filter feeder, with gills down most of its body to expel water afterwards, and holes in the walls of its tubular home to let the water in and out.
Karma Nanglu, from the University of Toronto and the study’s lead author, said: “Hemichordates are central to our understanding of how deuterostomes evolved. Through them, we can get clues about the anatomy and lifestyle of the last common ancestor that we all share, and this adds further evidence to the hypothesis that the ancestor was a filter-feeder like Oesia.”
Professor Simon Conway Morris, from St John’s College, University of Cambridge and a co-author, said: “Oesia fossils are pretty enigmatic — they are very rare and until now we could not prove which group they belonged to. Now we know that they were primitive hemichordates — perhaps the most primitive of all.”
The study was possible thanks to the discovery of a rich source of fossilised remains near Marble Canyon, in the Canadian Rockies (Kootenay National Park, B.C.), which is run by Parks Canada.
“Marble Canyon is one of the most recently discovered fossil localities in the Burgess Shale, a geological formation known for its exceptional quality of fossil preservation,” said co-author Dr. Jean-Bernard Caron, Senior Curator of Invertebrate Palaeontology at the Royal Ontario Museum and Associate Professor at the University of Toronto. “Oesia has been known from an older Burgess Shale site for over 100 years, but the specimens from Marble Canyon are far more abundant and better preserved, giving us unprecedented details of the animal’s internal anatomy.”
The research establishes that Oesia was a rather phallic-shaped creature, similar to modern acorn worms with a proboscis, a collar, and a long trunk. Co-author Christopher B. Cameron, Associate Professor at the Université de Montréal said: “Acorn worms are notoriously sparse in the fossil record. Only a handful of fossil species have been described, making the recognition of such an ancient representative of the group particularly noteworthy.”
The average Oesia was about 53mm long, and rarely more than 10mm wide. Unusually, these worms had U-shaped gills running down most the length of their bodies to enable filter feeding. Gill slits seem to be a characteristic common to all deuterostomes; even humans have slits in their necks at an early stage in their embryonic development, and this is seen as evidence that all deuterostomes are related to a distant, common ancestor.
The researchers realised that Oesia must have lived in tubes because among the Marble Canyon finds there are dozens of examples where the fossil remains of the worm are found within those of Margaretia.
Since the 1920s, Margaretia has been classified as a type of algae, albeit one unlike any other known species from this period in prehistory. The direct association with Oesia explains why Margaretia looks so exotic: This was no seaweed, but rather a perforated tube-like structure that the worm inhabited.
The study suggests that in some cases these structures exceeded 50cm in height and that they were typically at least twice the width of the worm, giving it plenty of room. The ends were sealed off, making life inside a rather lonely experience. “Only single worms are found within tubes, suggesting a solitary mode of life,” Nanglu added.
At some point, the fossil record suggests that acorn worms underwent a transition, leaving their tubes and instead opting for a life under the sea bed. The study argues that as evolution gathered pace and more predators appeared on the scene, digging into the sea floor may simply have been a safer option. Certainly, modern-day acorn worms have adopted this lifestyle; rather than filter feeding they live in the sediment and eat nutrients within it.
“In its own depressing way this is a story of Darwinian competition,” Conway Morris explained. “The levels of competition and predation increased, life sped up and got harder, and animals had to protect themselves more. One way of doing this was to abandon life filter feeding in a tube, and instead to dig into the sediment and eat mud. Once there, they found a new niche and were able to make a perfectly good life for themselves.”
Reference:
Karma Nanglu, Jean-Bernard Caron, Simon Conway Morris, Christopher B. Cameron. Cambrian suspension-feeding tubicolous hemichordates. BMC Biology, 2016; 14 (1) DOI: 10.1186/s12915-016-0271-4
A volcano erupting on a small island in the Sub Antarctic is depositing ash over one of the world’s largest penguin colonies.
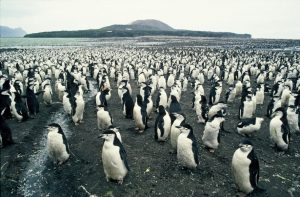
Zavodovski Island is a small island in the South Sandwich archipelago and its volcano Mt Curry has been erupting since March 2016. The island is home to over one million chinstrap penguins — the largest colony for this species in the world.
The island is part of the British Overseas Territory of South Georgia & the South Sandwich Islands and uninhabited. British Antarctic Survey (BAS) recently remapped this chain of volcanic islands and was alerted to a large (7.2) magnitude earthquake last month in the vicinity.
Researchers confirmed from satellite imagery that not one, but two volcanoes are erupting in the South Sandwich Islands. Mt Curry on Zavodovski Island to the north of the archipelago and Mt Sourabaya on Bristol Island to the south.
Following the earthquake, fishing vessels in the area licenced by the Government of South Georgia & the South Sandwich Islands, captured photos of the Zavodovski Island eruption. They show the main volcanic vent is on the western side of the island, but the prevailing wind is blowing the smoke and ash to the east, and depositing much of it on the lower slopes of the volcano. These are home to the chinstraps, closely packed in great numbers. In addition there are around 180,000 macaroni penguins.
Satellite images have confirmed that between one third and one half of the island has so far been covered in ash. At the time photos were taken, the adult chinstraps were moulting, shedding their old feathers for new ones and therefore unable to leave the island.
Geographer Dr Peter Fretwell from BAS who was involved in the remapping of the archipelago says:
“We don’t know what impact the ash will have on the penguins. If it has been heavy and widespread it may have a serious effect on the population. It’s impossible to say but two scientific expeditions are scheduled to visit the region from later this year and will try to assess the impact of the eruption.”
Penguin ecologist Mike Dunn from BAS says, “As the images were captured during the moult period for the chinstraps, the consequences could be very significant. When the penguins return to breed later in the year, it will be interesting to see what impact this event has on their numbers.”
Early life forms on Earth are likely to have mutated and evolved at much higher rates than they do today, suggests a new analysis from researchers at the University of North Carolina.
In a study published this week in the Proceedings of the National Academy of Sciences, Richard Wolfenden, PhD, and his colleagues found that the rate of a certain chemical change in DNA — a key driver of organisms’ spontaneous mutation rates and thus of evolution’s pace — increases extremely rapidly with temperature. Combining that finding with recent evidence that life arose when our planet was much warmer than it is now, the scientists concluded that the rate of spontaneous mutation was at least 4,000 times higher than it is today.
“At the higher temperatures that seem to have prevailed during the early phase of life, evolution was shaking the dice frantically,” said Wolfenden, Alumni Distinguished Professor of Biochemistry and Biophysics at the UNC School of Medicine.
A much faster pace of evolution means that species could have proliferated much more rapidly than they do now, affording the flora and fauna of Earth ample time to acquire their enormous diversity and complexity.
That issue — whether life could have evolved to its present level of complexity within the time available — has lingered ever since Darwin published his theory more than a century and a half ago. Throughout that debate, both skeptics and proponents of evolutionary theory have often assumed that evolution’s pace has stayed more or less constant over the eons.
The planet formed about 4.6 billion years ago from the cloud of dust and gas surrounding the early sun, and began as a hellish world of molten rock. It cooled until a crust condensed, and eventually, around 4.3 billion years ago, liquid brine began to fill the lower elevations, forming oceans.
“Recent evidence from rock samples in Australia indicates that life forms arose on Earth as early as 4.1 billion years ago — almost in the blink of an eye after the appearance of liquid oceans,” Wolfenden said.
At that time, the average temperature at Earth’s surface would have been near the boiling point of water — 100 degrees Celsius, about 75 degrees higher than today.
To get some idea of the effect of such a high temperatures on the rate of evolution, Wolfenden’s team examined a chemical reaction known as cytosine deamination, which occurs from time to time in all cells and may be the single most frequent cause of spontaneous DNA mutations.
In the deamination reaction, cytosine — the DNA base molecule known as “C” in the genetic code — loses an ammonia-like “amine” group of atoms. Deamination leads to the mutation of the cytosine into the DNA base thymine (“T” in the genetic code).
Wolfenden’s team experimentally determined the rates of spontaneous deamination at different temperatures for cytosine and several cytosine-related molecules. In collaboration with the UNC lab of Ronald Swanstrom, PhD, the Charles P. Postelle, Jr. Distinguished Professor of Biochemistry at UNC, the researchers also measured the rates of cytosine deaminations and spontaneous C-to-T mutations in single-stranded DNA from the HIV virus that causes AIDS. The results showed that the rates of cytosine deamination, for isolated molecules and for single-stranded DNA, rose very steeply as the temperature increased. The scientists then added the assumption that Earth’s surface temperature has itself changed exponentially — following Newton’s law of cooling — over the period in which life has existed.
“Cytosine-based mutations, when the temperature was near 100 degrees C, occurred at more than 4,000 times the modern rate,”Wolfenden said. “To me, that was surprising. I thought the ancient rate would be more rapid than the modern rate, but not that rapid.”
How could early life forms have coped with a high-temperature environment where their genetic material was being altered so rapidly?
“That question is still out there,” Wolfenden said. He noted, though, that there are microorganisms even now that normally live in hot springs or deep-sea thermal vents, and somehow survive and multiply at temperatures as high as 120 degrees C.
Originally, DNA was stabilized to some extent by the presence of a complementary strand of DNA, and as life forms evolved, they developed increasingly sophisticated mechanisms for repairing DNA damage.
“These findings give us some idea of the burden faced by primordial organisms before they evolved sophisticated systems for repair,” Wolfenden said. “And they offer another clue about how evolution kick-started the creation of the diverse world we see today.”
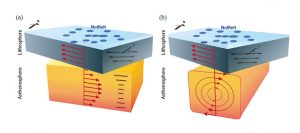
This illustration shows how (a) pressure gradient-driven flow and (b) density-driven small-scale convection could work in the asthenosphere. At the top, in blue, is the surface view showing the locations of the NoMelt seismometers. The red arrows indicated flow direction. Illustration Credit: Lin et al., 2016
A new study carried out on the floor of Pacific Ocean provides the most detailed view yet of how the earth’s mantle flows beneath the ocean’s tectonic plates. The findings, published in the journal Nature, appear to upend a common belief that the strongest deformation in the mantle is controlled by large-scale movement of the plates. Instead, the highest resolution imaging yet reveals smaller-scale processes at work that have more powerful effects.
By developing a better picture of the underlying engine of plate tectonics, scientists hope to gain a better understanding of the mechanisms that drive plate movement and influence related process, including those involving earthquakes and volcanoes.
When we look out at the earth, we see its rigid crust, a relatively thin layer of rock that makes up the continents and the ocean floor. The crust sits on tectonic plates that move slowly over time in a layer called the lithosphere. At the bottom of the plates, some 80 to 100 kilometers below the surface, the asthenosphere begins. Earth’s interior flows more easily in the asthenosphere, and convection here is believed to help drive plate tectonics, but how exactly that happens and what the boundary between the lithosphere and asthenosphere looks like isn’t clear.
To take a closer look at these processes, a team led by scientists from Columbia University’s Lamont-Doherty Earth Observatory installed an array of seismometers on the floor of the Pacific Ocean, near the center of the Pacific Plate. By recording seismic waves generated by earthquakes, they were able to look deep inside the earth and create images of the mantle’s flow, similar to the way a doctor images a broken bone.
Seismic waves move faster through flowing rock because the pressure deforms the crystals of olivine, a mineral common in the mantle, and stretches them in the same direction. By looking for faster seismic wave movement, scientists can map where the mantle is flowing today and where it has flowed in the past.
Three basic forces are believed to drive oceanic plate movement: plates are “pushed” away from mid-ocean ridges as new sea floor forms; plates are “pulled” as the oldest parts of the plate dive back into the earth at subduction zones; and convection within the asthenosphere helps ferry the plates along. If the dominant flow in the asthenosphere resulted solely from “ridge push” or “plate pull,” then the crystals just below the plate should align with the plate’s movement. The study finds, however, that the direction of the crystals doesn’t correlate with the apparent plate motion at any depth in the asthenosphere. Instead, the alignment of the crystals is strongest near the top of the lithosphere where new sea floor forms, weakest near the base of the plate, and then peaks in strength again about 250 kilometers below the surface, deep in the asthenosphere.
“If the main flow were the mantle being sheared by the plate above it, where the plate is just dragging everything with it, we would predict a fast direction that’s different than what we see,” said coauthor James Gaherty, a geophysicist at Lamont-Doherty. “Our data suggest that there are two other processes in the mantle that are stronger: one, the asthenosphere is clearly flowing on its own, but it’s deeper and smaller scale; and, two, seafloor spreading at the ridge produces a very strong lithospheric fabric that cannot be ignored.” Shearing probably does happen at the plate boundary, Gaherty said, but it is substantially weaker.
Donald Forsyth, a marine geophysicist at Brown University who was not involved in the new study, said, “These new results will force reconsideration of prevailing models of flow in the oceanic mantle.”
Looking at the entire upper mantle, the scientists found that the most powerful process causing rocks to flow happens in the upper part of the lithosphere as new sea floor is created at a mid-ocean ridge. As molten rock rises, only a fraction of the flowing rock squeezes up to the ridge. On either side, the pressure bends the excess rock 90 degrees so it pushes into the lithosphere parallel to the bottom of the crust. The flow solidifies as it cools, creating a record of sea floor spreading over millions of years.
This “corner flow” process was known, but the study brings it into greater focus, showing that it deforms the rock crystals to a depth of at least 50 kilometers into the lithosphere.
In the asthenosphere, the patterns suggest two potential flow scenarios, both providing evidence of convection channels that bottom out about 250 to 300 kilometers below the earth’s surface. In one scenario, differences in pressure drive the flow like squeezing toothpaste from a tube, causing rocks to flow east-to-west or west-to-east within the channel. The pressure difference could be caused by hot, partially molten rock piled up beneath mid-ocean ridges or beneath the cooling plates diving into the earth at subduction zones, the authors write. Another possible scenario is that small-scale convection is taking place within the channel as chunks of mantle cool and sink. High-resolution gravity measurements show changes over relatively small distances that could reflect small-scale convection.
“The fact that we observe smaller-scale processes that dominate upper-mantle deformation, that’s a big step forward. But it still leaves uncertain what those flow processes are. We need a wider set of observations from other regions,” Gaherty said.
The study is part of the NoMelt project, which was designed to explore the lithosphere-asthenosphere boundary at the center of an oceanic plate, far from the influence of melting at the ridge. The scientists believe the findings here are representative of the Pacific Basin and likely ocean basins around the world.
NoMelt is unique because of its location. Most studies use land-based seismometers at edge of the ocean that tend to highlight the motion of the plates over the asthenosphere because of its large scale and miss the smaller-scale processes. NoMelt’s ocean bottom seismometer array, with the assistance of Lamont’s seismic research ship the Marcus G. Langseth, recorded data from earthquakes and other seismic sources from the middle of the plate over the span of a year.
Reference:
Pei-Ying Patty Lin, James B. Gaherty, Ge Jin, John A. Collins, Daniel Lizarralde, Rob. L. Evans, Greg Hirth. High-resolution seismic constraints on flow dynamics in the oceanic asthenosphere. Nature, 2016; DOI: 10.1038/nature18012
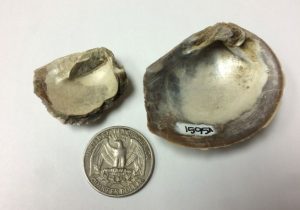
The preservation of Cretaceous mollusk fossils from Seymour Island is excellent, with shells preserving original mother-of-pearl material as in these two specimens of Eselaevitrigonia regina. Credit: Sierra V. Petersen
A new reconstruction of Antarctic ocean temperatures around the time the dinosaurs disappeared 66 million years ago supports the idea that one of the planet’s biggest mass extinctions was due to the combined effects of volcanic eruptions and an asteroid impact.
Two University of Michigan researchers and a Florida colleague found two abrupt warming spikes in ocean temperatures that coincide with two previously documented extinction pulses near the end of the Cretaceous Period. The first extinction pulse has been tied to massive volcanic eruptions in India, the second to the impact of an asteroid or comet on Mexico’s Yucatan Peninsula.
Both events were accompanied by warming episodes the U-M-led team found by analyzing the chemical composition of fossil shells using a recently developed technique called the carbonate clumped isotope paleothermometer.
The new technique, which avoids some of the pitfalls of previous methods, showed that Antarctic ocean temperatures jumped about 14 degrees Fahrenheit during the first of the two warming events, likely the result of massive amounts of heat-trapping carbon dioxide gas released from India’s Deccan Traps volcanic region. The second warming spike was smaller and occurred about 150,000 years later, around the time of the Chicxulub impact in the Yucatan.
“This new temperature record provides a direct link between the volcanism and impact events and the extinction pulses — that link being climate change,” said Sierra Petersen, a postdoctoral researcher in the U-M Department of Earth and Environmental Sciences.
“We find that the end-Cretaceous mass extinction was caused by a combination of the volcanism and meteorite impact, delivering a theoretical ‘one-two punch,'” said Petersen, first author of a paper scheduled for online publication July 5 in the journal Nature Communications.
The cause of the Cretaceous-Paleogene (KPg) mass extinction, which wiped out the non-avian dinosaurs and roughly three-quarters of the planet’s plant and animal species about 66 million years ago, has been debated for decades. Many scientists believe the extinction was caused by an asteroid impact; some think regional volcanism was to blame, and others suspect it was due to a combination of the two.
Recently, there’s been growing support for the so-called press-pulse mechanism. The “press” of gradual climatic change due to Deccan Traps volcanism was followed by the instantaneous, catastrophic “pulse” of the impact. Together, these events were responsible for the KPg extinction, according to the theory.
The new record of ancient Antarctic ocean temperatures provides strong support for the press-pulse extinction mechanism, Petersen said. Pre-impact climate warming due to volcanism “may have increased ecosystem stress, making the ecosystem more vulnerable to collapse when the meteorite hit,” concluded Petersen and co-authors Kyger Lohmann of U-M and Andrea Dutton of the University of Florida.
To create their new temperature record, which spans 3.5 million years at the end of the Cretaceous and the start of the Paleogene Period, the researchers analyzed the isotopic composition of 29 remarkably well-preserved shells of clam-like bivalves collected on Antarctica’s Seymour Island.
These mollusks lived 65.5-to-69 million years ago in a shallow coastal delta near the northern tip of the Antarctic Peninsula. At the time, the continent was likely covered by coniferous forest, unlike the giant ice sheet that is there today.
As the 2-to-5-inch-long bivalves grew, their shells incorporated atoms of the elements oxygen and carbon of slightly different masses, or isotopes, in ratios that reveal the temperature of the surrounding seawater.
The isotopic analysis showed that seawater temperatures in the Antarctic in the Late Cretaceous averaged about 46 degrees Fahrenheit, punctuated by two abrupt warming spikes.
“A previous study found that the end-Cretaceous extinction at this location occurred in two closely timed pulses,” Petersen said. “These two extinction pulses coincide with the two warming spikes we identified in our new temperature record, which each line up with one of the two ‘causal events.'”
Unlike previous methods, the clumped isotope paleothermometer technique does not rely on assumptions about the isotopic composition of seawater. Those assumptions thwarted previous attempts to link temperature change and ancient extinctions on Seymour Island.
Reference:
Sierra V. Petersen, Andrea Dutton & Kyger C. Lohmann. End-Cretaceous extinction in Antarctica linked to both Deccan volcanism and meteorite impact via climate change. Nature Communications, 2016 DOI: 10.1038/ncomms12079
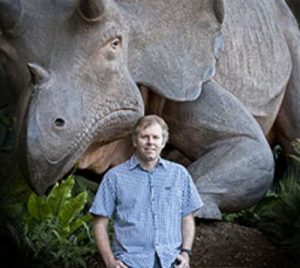
Dr Matthew Phillips. Credit: Image courtesy of Queensland University of Technology
QUT evolutionary biologist Dr Matthew Phillips used molecular dating from DNA sequences to challenge the dominant scientific theory that placental mammals diversified 20 million years before dinosaurs became extinct.
In a paper published in the journal Systematic Biology and delivered at the Society for Molecular Biology and Evolution Conference this week, Dr Phillips said biases in models of DNA evolution inflated estimates of when modern mammals, which were once no larger than a guinea pig, diversified and evolved into the animals familiar to us today.
“We can infer that some placental mammals did co-exist with dinosaurs,” he said.
“But for 20 years or so the current dominant theory has suggested that their diversification happened more than 80 million years ago, well before dinosaurs became extinct.
“It now appears that the major diversification of placental mammals closely followed the extinction of dinosaurs 66 million years ago, an event that would have opened up ecological space for mammals to evolve into.”
Dr Phillips said that for molecular dating to work, scientists had to calibrate the rate of DNA evolution with fossils of known age.
“I re-examined fossil calibrations, excluding those that were contentious or based on poorly resolved fossil placements and also fossil calibrations from within groups of very large or long-lived mammals, such as whales, for which parallel changes in the rate of DNA evolution in different lineages could distort dating estimates.
“When I took the remaining set of calibrations, the major diversification of placental mammals coincided with the extinction of dinosaurs,” Dr Phillips said.
“Fossil records have long indicated that the ancestors of many modern placental mammal groups can be traced back to the period immediately following the dinosaur extinction.
“But many scientists focused on DNA sequencing have brushed aside aspects of the fossil data, but when you minimise the potential biases in molecular dating you instead get a story that matches the fossil evidence.”
Dr Phillips is presenting these findings at the Society for Molecular Biology and Evolution Conference this week.
Reference:
Matthew J. Phillips. Geomolecular Dating and the Origin of Placental Mammals. Systematic Biology, 2016; 65 (3): 546 DOI: 10.1093/sysbio/syv115
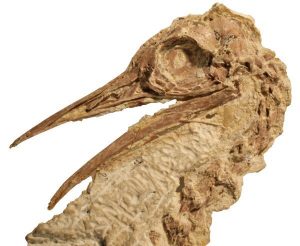
A Lithornithid skull from the Calciavis grandei fossil, found in Green River Formation of Wyoming. Credit: Sterling Nesbitt/Virginia Tech
Exceedingly well-preserved bird fossil specimens dating 50 million years represent a new species that is a previously unknown relative of the modern-day ostrich, according to a new paper co-authored by Sterling Nesbitt of Virginia Tech’s College of Science and part of the university’s Global Change Center.
The bird fossils were found more than a decade ago, completely intact with bones, feathers, and soft tissues in a former lake bed in Wyoming. Nesbitt cannot hide a grin as he calls the fossil a once-in-a-lifetime discovery for paleontologists.
“This is among one of the earliest well-represented bird species after the age of large dinosaurs,” said Nesbitt, an assistant professor in the Department of Geosciences.
“You can definitely appreciate how complete these fossil are,” added Nesbitt of the remains, the focus of a research paper co-authored by Nesbitt and newly published in the Bulletin of the American Museum of Natural History.
Some of the remains are now on display as part of the exhibit “Dinosaurs Among Us” at the New York-based history museum. The fossils Other specimens used in the study are kept by Chicago’s Field Museum of Natural History and the Wyoming Geological Survey.
The new species is named Calciavis grandei — with “calci” meaning “hard/stone,” and “avis” from the Latin for bird, and “grandei” in honor of famed paleontologist Lance Grande who has studied the fossil fish from the same ancient North American lake for decades.
The bird is believed to be roughly the size of a chicken, and similar to chickens, were mostly ground-dwelling, only flying in short bursts to escape predators.
Nesbitt began studying the fossil in 2009 whilst a postdoctoral researcher at the University of Texas at Austin’s Jackson School of Geosciences, under Professor Julia Clarke, whom Nesbitt considers an important mentor. Clarke co-authored the paper with Nesbitt, who joined Virginia Tech’s faculty in 2014.
The work was funded by two grants from the National Science Foundation’s Earth Sciences Directorate.
Two fossils of Calciavis dating from the Eocene epoch — roughly between 56 million and 30 million years ago — were found by fossil diggers within the Green River Formation in Wyoming, a hot bed for extinct fish. “These are spectacularly preserved fossils, one is a nearly complete skeleton covered with feather remains, the others are nearly are nearly as complete and some show soft tissue remains,” said Nesbitt.
“Fossil birds are rare,” added Nesbitt, adding that as bird bones are hollow, they are far more fragile than most mammal bones, and more likely to be crushed during fossilization. One of the fossilized birds in this rare case apparently was covered in mud soon after death.
The former lake in which the fossil was found is best known for producing scores of complete fish skeleton fossils, but other fossils such as other birds, plants, crocodilians, turtles, bats, and mammals from an ecosystem roughly 50 million years old.
Included in the extinct group of early Palaeognathae birds, the Lithornithidae, Nesbitt and Clarke call the bird a close relative of living ostriches, kiwis, and tinamous now living in the southern continents. After tropical forests disappeared in North America, Calciavis and other more tropical birds went extinct, said Nesbitt and Clarke.
“Relationships among species in this lineage of birds have been extremely contentious,” said Clarke. “We hope the detailed new anatomical data we provide will aid finding a resolution to this ongoing debate.”
“The new bird shows us that the bird group that includes the largest flightless birds of today had a much wider distribution and longer evolutionary history in North America,” Nesbitt said. “Back when Calciavis was alive, it lived in a tropical environment that was rich with tropical life and this is in stark contrast to the high-desert environment in Wyoming today.”
The Calciavis skeleton will be important to interpreting new bird fossils and other fossils from the Eocene epoch that were collected decades ago. “This spectacular specimen could be a ‘keystone’ that helps interpret much of the sparse fossil of birds that once lived in North America millions of years ago,” said Nesbitt.
Reference:
Nesbitt, Sterling J.; Clarke, Julia A. The anatomy and taxonomy of the exquisitely preserved Green River Formation (early Eocene) lithornithids (Aves) and the relationships of Lithornithidae. Bulletin of the American Museum of Natural History, 2016 DOI: 10.5531/sd.sp.25
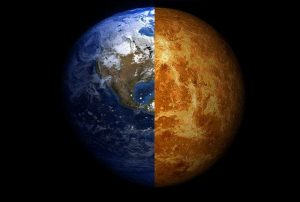
Minor evolutionary changes could have altered the fates of both Earth and Venus. Credit: Composite image by Arie Wilson Passwaters/Rice University
If conditions had been just a little different an eon ago, there might be plentiful life on Venus and none on Earth.
The idea isn’t so far-fetched, according to a hypothesis by Rice University scientists and their colleagues who published their thoughts on life-sustaining planets, the planets’ histories and the possibility of finding more in Astrobiology this month.
The researchers maintain that minor evolutionary changes could have altered the fates of both Earth and Venus in ways that scientists may soon be able to model through observation of other solar systems, particularly ones in the process of forming, according to Rice Earth scientist Adrian Lenardic.
The paper, he said, includes “a little bit about the philosophy of science as well as the science itself, and about how we might search in the future. It’s a bit of a different spin because we haven’t actually done the work, in terms of searching for signs of life outside our solar system, yet. It’s about how we go about doing the work.”
Lenardic and his colleagues suggested that habitable planets may lie outside the “Goldilocks zone” in extra-solar systems, and that planets farther from or closer to their suns than Earth may harbor the conditions necessary for life.
The Goldilocks zone has long been defined as the band of space around a star that is not too warm, not too cold, rocky and with the right conditions for maintaining surface water and a breathable atmosphere. But that description, which to date scientists have only been able to calibrate using observations from our own solar system, may be too limiting, Lenardic said.
“For a long time we’ve been living, effectively, in one experiment, our solar system,” he said, channeling his mentor, the late William Kaula. Kaula is considered the father of space geodetics, a system by which all the properties in a planetary system can be quantified. “Although the paper is about planets, in one way it’s about old issues that scientists have: the balance between chance and necessity, laws and contingencies, strict determinism and probability.
“But in another way, it asks whether, if you could run the experiment again, would it turn out like this solar system or not? For a long time, it was a purely philosophical question. Now that we’re observing solar systems and other planets around other stars, we can ask that as a scientific question.
“If we find a planet (in another solar system) sitting where Venus is that actually has signs of life, we’ll know that what we see in our solar system is not universal,” he said.
In expanding the notion of habitable zones, the researchers determined that life on Earth itself isn’t necessarily a given based on the Goldilocks concept. A nudge this way or that in the conditions that existed early in the planet’s formation may have made it inhospitable.
By extension, a similarly small variation could have changed the fortunes of Venus, Earth’s closest neighbor, preventing it from becoming a burning desert with an atmosphere poisonous to terrestrials.
The paper also questions the idea that plate tectonics is a critical reason Earth harbors life. “There’s debate about this, but the Earth in its earliest lifetimes, let’s say 2-3 billion years ago, would have looked for all intents and purposes like an alien planet,” Lenardic said. “We know the atmosphere was completely different, with no oxygen. There’s a debate that plate tectonics might not have been operative.
“Yet there’s no argument there was life then, even in this different a setting. The Earth itself could have transitioned between planetary states as it evolved. So we have to ask ourselves as we look at other planets, should we rule out an early Earth-like situation even if there’s no sign of oxygen and potentially a tectonic mode distinctly different from the one that operates on our planet at present?
“Habitability is an evolutionary variable,” he said. “Understanding how life and a planet co-evolve is something we need to think about.”
Lenardic is kicking his ideas into action, spending time this summer at conferences with the engineers designing future space telescopes. The right instruments will greatly enhance the ability to find, characterize and build a database of distant solar systems and their planets, and perhaps even find signs of life.
“There are things that are on the horizon that, when I was a student, it was crazy to even think about,” he said. “Our paper is in many ways about imagining, within the laws of physics, chemistry and biology, how things could be over a range of planets, not just the ones we currently have access to. Given that we will have access to more observations, it seems to me we should not limit our imagination as it leads to alternate hypothesis.”
Reference:
A. Lenardic, J.W. Crowley, A.M. Jellinek, M. Weller. The Solar System of Forking Paths: Bifurcations in Planetary Evolution and the Search for Life-Bearing Planets in Our Galaxy. Astrobiology, 2016; 16 (7): 551 DOI: 10.1089/ast.2015.1378
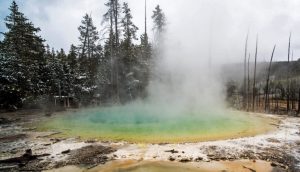
Cistern Spring in Yellowstone National Park is home to the elusive archaeon Nanopusillus acidilobi. Credit: ORNL
A microbial partnership thriving in an acidic hot spring in Yellowstone National Park has surrendered some of its lifestyle secrets to researchers at the Department of Energy’s Oak Ridge National Laboratory.
Mircea Podar of ORNL’s Biosciences Division led a team that isolated the archaeon Nanopusillus acidilobi, cultured these tiny microbes — just 100 to 300 billionths of a meter in size — and can now study how they interact with their host, another archaeon (Acidilobus). The relationships between these two organisms, detailed in a paper published in Nature Communications, can serve as a valuable model to study the evolution and mechanisms of more complex systems.
“This work demonstrates how organisms find ways to adapt and interact with specific organisms in a symbiotic or parasitic way to survive in hostile environments,” Podar said. “By integrating knowledge from genomics, proteomics and classical microbiology, we can culture wild organisms and sometimes manipulate them for practical applications that range from energy production to medicine.”
The Archaea domain consists of single-cell microorganisms that, like bacteria, have no cell nucleus or membrane-bound organelles, a sub-unit within a cell. These microbes have maintained an open environment-exposed cellular membrane, and Nanopusillus has developed a mechanism to acquire primary biosynthetic molecules from the host cell through cell-to-cell contact.
With habitats like hot pools in Yellowstone, the Nanopusillus acidilobi microbe has been particularly elusive, so this accomplishment is likely to create a stir.
One of the journal’s reviewers noted that the discovery and paper provide “new exciting insights into the microbial diversity with important phylogenetic implications and thus represents a very important contribution in the archaeal/microbial diversity field.”
Researchers also noted similarities between this microbe and its distant relative, the marine Nanoarchaeumm, which was cultured more than a decade ago. Through observations like this and by making comparisons over the years, scientists have been able to gain insight into structural and molecular properties of a host of novel groups of microbes.
This most recent accomplishment is especially satisfying, said Podar, who noted that it was a combination of diligence and chance and took several years.
“We discovered and cultured a novel organism from a group of organisms that people have been trying to get for over a decade, and in part that was due to prior genomic data we acquired from those organisms in Yellowstone,” Podar said, adding that the microbial system “abounds in unique, remarkable physiological and genomic features.”
Reference:
Louie Wurch, Richard J. Giannone, Bernard S. Belisle, Carolyn Swift, Sagar Utturkar, Robert L. Hettich, Anna-Louise Reysenbach, Mircea Podar. Genomics-informed isolation and characterization of a symbiotic Nanoarchaeota system from a terrestrial geothermal environment. Nature Communications, 2016; 7: 12115 DOI: 10.1038/ncomms12115
Reconstruction of the young, deformed Telmatosaurus individual, with the ameloblastoma just becoming visible on its lower left jaw Credit: Artwork by Mihai Dumbrava
The first-ever record of a tumourous facial swelling found in a fossil has been discovered in the jaw of the dwarf dinosaur Telmatosaurus transsylvanicus, a type of primitive duck-billed dinosaur known as a hadrosaur.
An international group of researchers, including Kate Acheson, a PhD student at the University of Southampton, have documented a type of non-cancerous facial tumour, which is found in humans, mammals and some modern reptiles, but never before encountered in fossil animals.
Kate said: “This discovery is the first ever described in the fossil record and the first to be thoroughly documented in a dwarf dinosaur. Telmatosaurus is known to be close to the root of the duck-billed dinosaur family tree, and the presence of such a deformity early in their evolution provides us with further evidence that the duck-billed dinosaurs were more prone to tumours than other dinosaurs.”
The hadrosaur fossil, estimated to be approximately 69-67 million years old, was discovered in the ‘Valley of the Dinosaurs’ in the UNESCO World Heritage Site, the Haţeg County Dinosaurs Geopark in Transylvania, western Romania.
“It was obvious that the fossil was deformed when it was found more than a decade ago but what caused the outgrowth remained unclear until now,” says Dr Zoltán Csiki-Sava of the University of Bucharest, Romania, who led the field trip which uncovered the fossil. “In order to investigate the outgrowth, our team was invited by SCANCO Medical AG in Switzerland to use their Micro-CT scanning facilities and to ‘peek’ un-intrusively inside the peculiar Telmatosaurus jawbone.”
The scans suggested that the dinosaur suffered from a condition known as an ‘ameloblastoma’, a tumourous, benign, non-cancerous growth known to afflict the jaws of humans and other mammals, and indeed some modern reptiles, too.
Dr Bruce Rothschild, from the Northeast Ohio Medical University and a worldwide expert in palaeopathology (the study of ancient diseases and injuries) who studied the Micro-CT scans, said: “The discovery of an ameloblastoma in a duck-billed dinosaur documents that we have more in common with dinosaurs than previously realised. We get the same neoplasias.”
“It was expected, due to the impoverished nature of the fauna, that our project to investigate diseases of the bone in the dwarf dinosaurs of the Haţeg County Dinosaurs Geopark would reveal some interesting results, but the discovery of a rare modern tumoural condition, and one that is so far unique in the fossil record, was a wonderful surprise,” explained Mihai Dumbravă, PhD student at Babeş-Bolyai University in Cluj-Napoca, Romania and lead author of the study, published in the journal Scientific Reports.
It is unlikely that the tumour caused the dinosaur any serious pain during its early stages of development, just as in humans with the same condition, but researchers can tell from its size that this particular dinosaur died before it reached adulthood. Since its preserved remains consist of only the two lower jaws, no one can ascertain its cause of death. The researchers were left wondering, nonetheless, whether the presence of the ameloblastoma could have contributed to its death.
“We know from modern examples that predators often attack a member of the herd that looks a little different or is even slightly disabled by a disease. The tumour in this dinosaur had not developed to its full extent at the moment it died, but it could have indirectly contributed to its early demise,” said Dr Zoltán Csiki-Sava.
“The particular make-up of the rocks allowed us to identify that this fossil was preserved near the channel of an ancient river. In a setting like this, it is extremely rare to find the complete specimen, and so it is almost impossible to determine the specific cause of death. One can only make an informed guess based upon the evidence we have,” added Kate Acheson.
The research involved an international group of researchers from the Babeş-Bolyai University (Romania), the Northeast Ohio Medical University (USA), Johns Hopkins University (USA), the University of Bucharest (Romania) and the University of Southampton (UK). It was made possible thanks to SCANCO Medical AG, CNCS grant PN-II-ID-PCE-2011-3-0381 and POSDRU grant 159/1.5/S/132400 and was also supported by the University of Bucharest, an institution that oversees the management of the Hațeg County Dinosaurs Geopark.
Reference:
Mihai D. Dumbravă, Bruce M. Rothschild, David B. Weishampel, Zoltán Csiki-Sava, Răzvan A. Andrei, Katharine A. Acheson, Vlad A. Codrea. A dinosaurian facial deformity and the first occurrence of ameloblastoma in the fossil record. Scientific Reports, 2016; 6: 29271 DOI: 10.1038/srep29271
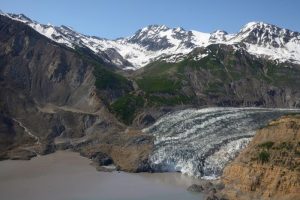
The landslide in Taan Fiord landed partly on the toe of Tyndall Glacier and largely in the water. Scientists are studying the geology and the shape of the fiord to better understand landslide and tsunami risks. Credit: Colin Stark
A 4,000-foot-high mountainside collapsed in Glacier Bay National Park this week in a massive landslide that spread debris for miles across the glacier below. It was a powerful reminder of the instability of the mountains in this part of Alaska and the risks that that instability creates. Just 10 miles away, the glacier ends in Johns Hopkins Inlet, a popular stop for cruise ships.
The sliding rock stopped a few miles short of the inlet this time. Last fall, when a similar-sized landslide landed directly in Alaska’s remote Taan Fiord, scientists discovered that it created a tsunami wave so large, the water swept 600 feet up the opposite side of the fiord, stripping away the trees.
“We have events like this maybe three to five times per year around the world, and Southeast Alaska is the global hotspot,” said geomorphologist Colin Stark, whose team at Columbia University’s Lamont-Doherty Earth Observatory discovered both the Glacier Bay and Taan Fiord landslides in seismic recordings. Stark is headed to Glacier Bay this coming week, and he took a team to Taan Fiord this spring and is returning in August to study how the landscape and geology affected the landslide and tsunami there. What the scientists learn from recent landslides can help assess landslide risks facing Southeast Alaska and other areas in the future.
Large landslides often go unnoticed in remote areas, but they shake the earth enough to create seismic waves that have been catching the attention of Stark, seismologist Göran Ekström and their colleagues at Lamont.
Stark and Ekström’s preliminary analysis of the Glacier Bay landslide, which had a 5.2 magnitude, suggests the collapse started at 8:21 a.m. local time on June 28, 2016, when a rock face estimated to have been about half a square mile in size collapsed on a high, steep slope. The rocky debris appears to have accelerated for almost a minute over about a mile and a quarter, Stark said. Once it hit the ice of Lamplugh Glacier, the debris kept sliding, pushing up snow and ice as it moved. A pilot who later landed near the end of the landslide, about six miles from the collapse site, found that the thickness of the debris there was more than twice the height of a man.
Once the clouds clear and satellite images become available, the scientists will be able to calculate the volume of the Glacier Bay collapse. From their seismic analysis, Stark and Ekström estimate the landslide to have been about 120 million metric tons – the equivalent of about 60 million mid-size SUVs tumbling down a mountainside.
Fragile landscapes
The Alaska coast is particularly fragile. The region is geologically active, with mountains being pushed up as tectonic plates move. It also is being eroded by glaciers. Glaciers once filled the valleys, and their weight packed glacial-marine sediment into rock that now makes up the valley walls. As the glaciers retreat, the ice that once buttressed the valley walls disappears, leaving rock faces that tend to be weak and prone to collapse.
In Taan Fiord, the scientists found evidence of other landslides in the past. The ice retreat has been quick there – as recently as 1961, Tyndall Glacier, now at the edge of the collapse site, had extended to the edge of Icy Bay, 15 miles down the fiord.
As the scientists and their colleagues zoomed in on images of Lamplugh Glacier and the inlet walls around Glacier Bay this week, they pointed out signs of past landslides there, as well.
“It’s pretty much the same geology. It’s just a matter of time and space when another landslide will strike,” Stark said. “The thing that really got me: If it just happened a bit further over, near the calving front, that would be a very bad thing. You can see in Google Earth – that’s a cruise ship right there. If the landslide had been closer, it likely would have dumped some debris in the inlet.”
What triggers giant landslides often isn’t clear. In his Alaska research, Stark has noticed that there tend to be more in warmer months, which may be related to warming temperatures or meltwater. Those are some of the questions his team hopes to start answering through their work in Taan Fiord this year.
The scientists have been studying the geology of the fiord and measuring the trim line along the edges where the tsunami wave stripped away the trees and scattered them like match sticks. Colleagues from other universities, the National Park Service, and U.S. Geological Survey are looking at other aspects, including the types of sediment carried by the tsunami wave and the influence of the shape of the fiord below the water line. Pat Lynett of the University of Southern California has been working on modeling how the fiord’s shape would have affected the behavior of the tsunami.
“Putting this in geological context is really important,” Stark said. “These walls are failing by the very nature of the process.”
Seismic wiggles
Stark and Ekström have been developing a technique for the past seven years that allows them to detect large landslides by picking out their signature in the stream of seismic data created by earthquakes and other activity around the world. The details they are able to extract could one day help governments sound tsunami warnings, help rescuers find landslide-struck villages faster, and warn of risks such as landslide-dammed rivers that could soon burst through.
While earthquakes tend to start abruptly, the seismic waves generated by a landslide start gradually, then accelerate as the mass moves down the mountain, and finally decelerate. The scientists and their colleagues in the Global CMT Project at Lamont work backwards from that data, using models of how seismic waves are generated and how they travel over the Earth’s surface, to determine the forces that were involved. Once the scientists estimate the landslide mass, they can determine the landslide’s acceleration and velocity, and from there they can determine its distance and motion.
Glacier Bay has had other spectacular landslides, including one in 2014 on Johns Hopkins Glacier. According to USGS reports, a large earthquake in 1958 triggered a landslide in Lituya Bay, on the coast, which generated a tsunami that killed two people in a fishing boat.
Gov. Jerry Brown has signed a 2016-17 state budget that provides $10 million to help launch a statewide earthquake early-warning system.
Although California passed a mandate in 2013 to create a statewide earthquake warning system, this is the first money appropriated by the state to make it a reality. The federal government has already provided $13.2 million to improve and test a prototype West Coast early-warning system, but this is much less than the $38 million in buildout costs and $16 million per year in operating costs needed to establish a fully functioning system serving California, Oregon and Washington.
“This is a key step toward the goal of a public earthquake early-warning system for the entire state,” said Richard Allen, director of the Berkeley Seismological Laboratory at UC Berkeley and one of the lead researchers on the project. “This funding will enable us to add more sensors to the seismic networks, making the warnings faster and enabling the system to reach more users.”
“This is an excellent beginning,” said state Sen. Jerry Hill, San Mateo and Santa Clara counties, who introduced funding legislation for the warning system earlier this year with Assemblyman Adam Gray, Merced, and state Sen. Robert Hertzberg, D-Van Nuys. “While we still have work to do to secure public-private partnership money to complete the build-out, this $10 million is a big boost.”
The $10 million is seed money from the Governor’s Office of Emergency Services. The funds will enable scientists and emergency preparedness experts from UC Berkeley, the U.S. Geological Survey and the California Institute of Technology to expand an early-warning prototype called ShakeAlert, which would provide advance warning of seconds to a minute before ground-shaking from a nearby earthquake. The funds will also be used for education, research, sustainable financing and other important project components.
Several pilot projects have been established around the state to beta-test ShakeAlert and the viability of the warning system, but ShakeAlert’s reach is limited by system distribution, strength and capabilities. Including station additions in the past year, ShakeAlert has just 538 sensors around the state and is available only to partners in the prototype project, such as the Bay Area Rapid Transit system. In contrast, the statewide earthquake early-warning system would need several thousand sensors throughout California to reliably notify the public.
“While the ShakeAlert project partners have been able to add some additional stations, this funding will enhance the buildout of the seismic networks to provide the best possible warnings for Californians,” said Allen, a professor of earth and planetary science.
Hill, Hertzberg and Gray took on the bipartisan effort after being approached by Allen and his team through UC Berkeley’s Office of Government and Community Relations, whose staff also briefed the governor’s staff about the need for a system to protect lives and property throughout the state.
The original mandate, SB 135, was authored by then-state Sen. Alex Padilla and signed into law in 2013. Padilla’s intent was that the system would be funded by public-private partnerships, but it became apparent that public funding would be needed to supplement any such partnerships. Cal OES has since worked with partner organizations from the California Integrated Seismic Network, the private sector, utilities, the Legislature and all levels of government to implement the system.
California is second only to Alaska when it comes to earthquake activity in the country, according to the USGS. About $3.5 billion, or 66 percent, of the monetary losses suffered from earthquakes in the U.S. each year occur in California, the Federal Emergency Management Agency says.
Seismologists agree that California is due for another “Big One.” The Uniform California Earthquake Rupture Forecast in 2015 said there is a 99.7 percent likelihood that an earthquake with a magnitude 6.7 or greater will occur in California in the next 30 years – and a 93 percent chance that an earthquake with a 7.0 magnitude or greater will occur.
“Funding programs that keep our constituents safer should be a top priority for the Legislature and the administration,” said Gray. “The earthquake early-warning system will protect property, mitigate systemic damage and above all save lives in the event of an earthquake. The $10 million that we worked so hard to get approved in the budget will certainly provide a much-needed kick-start to the program, but there is still plenty of work to be done.”
“We know it is coming — it’s just a matter of time — and the sooner we get the early-warning system up and running, the better,” said U.S. Rep. Adam Schiff, who represents Pasadena and Caltech and has led funding efforts for the warning system and earthquake preparedness at the federal level. “I hope today’s investment by California will encourage Oregon and Washington state to join the effort so we can build out the system along the entire West Coast.”
A ruby is a pink to blood-red colored gemstone, a variety of the mineral corundum (aluminium oxide). The red color is caused mainly by the presence of the element chromium. Its name comes from ruber, Latin for red. Other varieties of gem-quality corundum are called sapphires. Ruby is considered one of the four precious stones, together with sapphire, emerald and diamond.
Prices of rubies are primarily determined by color. The brightest and most valuable “red” called blood-red or “pigeon blood”, commands a large premium over other rubies of similar quality. After color follows clarity: similar to diamonds, a clear stone will command a premium, but a ruby without any needle-like rutile inclusions may indicate that the stone has been treated. Cut and carat (weight) are also an important factor in determining the price. Ruby is the traditional birthstone for July and is usually more pink than garnet, although some rhodolite garnets have a similar pinkish hue to most rubies. The world’s most expensive ruby is the Sunrise Ruby.
Natural occurrence
The Mogok Valley in Upper Myanmar (Burma) was for centuries the world’s main source for rubies. That region has produced some of the finest rubies ever mined, but in recent years very few good rubies have been found there. The very best color in Myanmar rubies is sometimes described as “pigeon’s blood.” In central Myanmar, the area of Mong Hsu began producing rubies during the 1990s and rapidly became the world’s main ruby mining area. The most recently found ruby deposit in Myanmar is in Namya (Namyazeik) located in the northern state of Kachin.
Rubies have historically been mined in Thailand, the Pailin and Samlout District of Cambodia, Burma, India, Afghanistan, Australia, Namibia, Colombia, Japan, Scotland, Brazil and in Pakistan. In Sri Lanka, lighter shades of rubies (often “pink sapphires”) are more commonly found. After the Second World War ruby deposits were found in Tanzania, Madagascar, Vietnam, Nepal, Tajikistan, and Pakistan.
A few rubies have been found in the U.S. states of Montana, North Carolina, South Carolina and Wyoming. While searching for aluminous schists in Wyoming, geologist Dan Hausel noted an association of vermiculite with ruby and sapphire and located six previously undocumented deposits.
More recently, large ruby deposits have been found under the receding ice shelf of Greenland.
Republic of Macedonia is the only country in mainland Europe to have naturally occurring rubies. They can mainly be found around the city of Prilep. Macedonian ruby has a unique raspberry color. The ruby is also included on the Macedonian Coat of Arms.
In 2002 rubies were found in the Waseges River area of Kenya. There are reports of a large deposit of rubies found in 2009 in Mozambique, in Nanhumbir in the Cabo Delgado district of Montepuez.
Spinel, another red gemstone, is sometimes found along with rubies in the same gem gravel or marble. Red spinel may be mistaken for ruby by those lacking experience with gems. However, the finest red spinels can have a value approaching that of the average ruby.
Vital to many modern technologies yet mined in few places, the ‘rare earth elements’ are in fact not that rare – they are just difficult to find in concentrations that make them economic to mine. Researchers from Cambridge University and the British Antarctic Survey (BAS) are investigating whether the remarkable properties of these materials can be used to track them down from the air.
Next time you use your mobile phone, spare a moment for the tiny yet vital ingredients that make this and many other technologies possible – the rare earth elements (REEs).
Used in computers, fibre optic cables, aircraft components and even the anti-counterfeiting system in euro notes, these materials are crucial for an estimated £3 trillion worth of industries, with demand set to increase over the coming decades.
Currently, more than 95% of the global demand for the REEs is met by a single mine in China. The security of the future supply of these 17 critical metals, which include neodymium, europium, terbium, dysprosium and yttrium, is a major concern for European governments, and the identification of potential REE resources outside China is seen as a high priority.
Over the past year, Drs Sally Gibson, Teal Riley and David Neave have been working together through a University of Cambridge–BAS Joint Innovation Project (see panel) on a remote sensing technique that could aid the identification of REEs in rocks anywhere in the world. The project brings together expertise in remote sensing, geochemistry and mineralogy from both institutes to take advantage of the properties that make the metals so special.
“Despite their name, the rare earth elements are not particularly rare and are as abundant in the Earth’s crust as elements such as copper and tin,” explains Riley from BAS. “However, to be extractable in an economic way, they need to be concentrated into veins or sediments.” It’s the identification of these concentrations that is critical for the future security of supply. REEs all have an atomic structure that causes them to react to photons of light through a series of electronic transitions. This gives them the magnetic and electrical properties for which they are prized in plasma TVs, wind turbines and electric car batteries. And it also means that for every photon of light they absorb, they reflect other photons in a unique way – it is this property that the researchers have latched onto as a means of tracking them down.
“The light they reflect is so specific that it’s like a fingerprint, one that we can capture using sensors that pick up light emissions,” explains Gibson, from Cambridge’s Department of Earth Sciences. “The difficulty, however, is that in naturally occurring rocks and minerals, the rare earth element emission spectra are mixed up with those of other elements. It’s like looking at overlapping fingerprints – the challenge was to work out how to tease these spectral fingerprints apart.”
Gibson has over 20 years’ experience investigating how REEs are generated during the melting of the Earth’s mantle. “Collective understanding of the geological make-up of the world is now good enough that we know where to look for these rocks – at sites of a certain type of past tectonic activity – but even then it’s difficult to find them.”
Riley is the head of the Geological Mapping Group at BAS – his job is to “map the unmapped” areas of the polar region to understand the geological evolution of the continent. Much of his work depends on being able to develop new ways of interrogating satellite- and aircraft-based remote sensing data. “It became a frustration that we could collect data and say generally what was on the ground but that we couldn’t define individual fingerprints, and so we developed the analytical tools to do this.”
Gibson and Neave gathered rocks containing REE-bearing minerals from around the world – sourced from mining companies, museum collections and universities. One such source was the Harker Collection housed in the University’s Sedgwick Museum of Earth Sciences. This collection contains specimens of minerals and rocks rich in REEs that were collected decades previously by geologists who were unaware of their economic importance.
Neave analysed the emission spectrum of each rock and related this to its gross and microscopic composition. From this information he began to untangle the individual fingerprints, resulting in what the researchers believe is the most comprehensive ‘spectral database’ of REEs in their natural state – in rocks.
The next goal is to use this spectral database as a reference source to track down deposits from the air. “Although data from aircraft is now good enough to be analysed in this way, we are waiting for new satellite missions such as the German Environmental Mapping and Analysis Program (EnMAP) to be launched in the next few years,” explains Riley.The plan would then be to carry out reconnaissance sweeps of the most likely terrains and explore the possibility of mining these areas. “Our hope is that this research will help to create an internationally unique and competitive capability to map these surprisingly common – yet difficult to find – materials,” adds Gibson.
Aurora Cambridge
The search for rare earth elements is one of a host of ongoing projects between the University and BAS. Like these, a new centre – Aurora Cambridge – will reflect the ethos that innovation developed for the Antarctic is transferable to a global setting.
Aurora Cambridge aims to generate new research and entrepreneurial activity focused on climate change and challenging environments through academic, business and policy partnerships. It will be located at BAS in Cambridge and has been funded by the National Environment Research Council with support from the University.
The building is due to open in 2017; however, 27 University of Cambridge–BAS Joint Innovation Projects are already under way with funding from the Higher Education Funding Council for England – including the development of mapping technologies for rare earth elements led by Drs Sally Gibson and Teal Riley.
Other projects include research on cold-adapted enzymes with potential applications in the biotech industries, remote sensing for conservation of seabirds and marine mammals, and the measurement of coastal vulnerability through sea-level rise. Many involve external industrial partners and other research institutions as well as researchers from BAS and 12 University departments.
“The collaborative projects demonstrate not only the importance of research technology to the Antarctic but also their transferability beyond its shores to a global setting,” explains BAS Director of Innovation Dr Beatrix Schlarb-Ridley. “The SPECTRO-ICE project, for instance, has brought scientists at BAS who are concerned with monitoring the atmosphere above the ice cap together with physicists and mathematicians who are working hard to avoid seeing the atmosphere in their study of the stars – both use similar techniques and need to operate advanced instruments at difficult locations.”
“This is just the beginning,” says BAS Director Professor Jane Francis. “The new innovation centre will help us to extend the range of fruitful partnerships with academia, business, policy makers and the third sector to create tangible benefits for society.”