Ocean. Researchers decipher the temperature indicator TEX86 and overcome a seeming weakness of global climate models. Credit: Copyright Michele Hogan
Scientists from the Alfred Wegener Institute Helmholtz Centre for Polar and Marine Research (AWI) have overcome a seeming weakness of global climate models. They had previously not been able to simulate the extreme warm period of the Eocene. One aspect of this era that particularly draws interests to climatologists: It was the only phase in recent history when greenhouse gas concentration was as high as researchers predict it to be for the future.
The AWI scientists have now found that the apparent model weakness is due to a misinterpretation of the temperature indicator TEX86. These molecules, which are produced by archaea do not record the surface temperature of the ancient ocean as expected, but rather the temperature of water depths up to 500 metres. In the current issue of the journal Nature Geoscience, the scientists report on this new finding which has now made it possible to correctly simulate the temperature distribution of the Eocene in climate models.
Climate scientists often hear the same complaint: How can climate models accurately predict the future of our planet if it is not even possible to correctly reproduce the climate of the past? One of the unsolved problems was that all previous attempts to simulate the extreme temperatures of the Eocene with climate models failed.
At that time, 49 to 55 million years ago, the carbon dioxide content of the air was likely more than 1000 ppm (parts per million) — i.e. at least two times the current greenhouse gas concentration. The earth warmed up so strongly that the icesheets on Greenland and Antarctica disappeared. Instead of ice crystals, palm trees grew there. “Until recently, we believed that the sea surface temperature near the North Pole at the time was 23 degrees Celsius; in Antarctica, it was believed to have been more than 30 degrees Celsius,” says Dr Thomas Laepple, climate researcher at the AWI Potsdam.
These temperature estimates were based on data from the climate indicator TEX86. This abbreviation stands for a ratio of specific organic compounds produced by archaea, depending on the water temperature in which they lived. “Archaea are unicellular organisms that can in part withstand surprisingly high ambient temperatures. The molecules of the organisms that were living at that time are still preserved in the sedimentary layers of the seafloor. They are one of our most important archives for warm climate conditions, but as we have seen, we decoded them wrongly in the past,” says Thomas Laepple.
He and his AWI colleague at the time, Sze Ling Ho, first had doubts about the interpretation of the TEX86 temperature indicator during a comparison of climate data from the most recent ice age. The scientists noticed that the TEX86 temperatures were far too cold compared to other geological evidence. “The discrepancy was so obvious that we started to review the TEX86 values of around 3,000 sediment samples from different ocean basins and from different epochs of the Earth. It soon became apparent that the average temperature change inferred from TEX86 was exaggerated, always and on all time scales, by one and a half to two times. The temperature it showed for cold periods was much too cold and the one for warm periods was much too warm,” explains geochemist Sze Ling Ho.
The cause of this pattern had to be of a fundamental nature, a suspicion that was confirmed upon closer analysis. “TEX86 had previously been interpreted as an indicator of sea surface temperature, in spite the fact that the archaea that produce TEX86 rarely directly live at the sea surface. Through the comparison with other climate archives, we have been able to constrain the depth in which the TEX86 signal is produced. We now assume that TEX86 represents the water temperature at a depth of up to 500 metres,” Sze Ling Ho explains.
At this water depth, the temperature difference between the tropical oceans and the polar seas is smaller than at the surface. This has direct consequences for climate reconstruction, since the information generated from the indicator is differently translated into temperature values. “In practice, the TEX86 extreme values need to be roughly halved in the climate reconstructions. Comparing the corrected temperatures with the models shows that they now reflect the climate of the Eocene in a realistic and physically consistent way,” explains Thomas Laepple.
However, we also have to correct our temperature-conception of the Eocene. Thomas Laepple: “The era remains the warmest period of the past 65 million years. The water temperatures that we assumed for the Arctic and Antarctica, though, were overstated by at least ten degrees Celsius. Now, we know that the water in the Southern Ocean had a temperature of about 20 to 25 degrees Celsius at that time. The region was therefore still warm enough for there to be palm trees sprouting on the beach.”
Reference:
Sze Ling Ho, Thomas Laepple. Flat meridional temperature gradient in the early Eocene in the subsurface rather than surface ocean. Nature Geoscience, 2016; DOI: 10.1038/NGEO2763
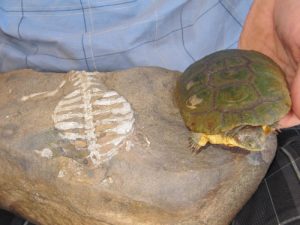
A recent study on the oldest proto turtle, Eunotosaurus (left), suggests the broadening of the ribs in turtles was initially an adaptation for burrowing to escape the extremely arid environment of South Africa 260 million years ago. Later the ribs were incorporated into the modern protective turtle shell as found in Pelusios (right). Credit: Luke Norton
It is common knowledge that the modern turtle shell is largely used for protection. No other living vertebrate has so drastically altered its body to form such an impenetrable protective structure as the turtle. However, a new study by an international group of paleontologists suggests that the broad ribbed proto shell on the earliest partially shelled fossil turtles was initially an adaptation, for burrowing underground, not for protection. Paleontologist Tyler Lyson from the Denver Museum of Nature & Science is among the scientists that helped make this discovery.
“Why the turtle shell evolved is a very Dr. Seuss-like question and the answer seems pretty obvious — it was for protection,” said Dr. Lyson, lead author of Fossorial Origin of the Turtle Shell, which was released today by Current Biology. But just like the bird feather did not initially evolve for flight, the earliest beginnings of the turtle shell was not for protection but rather for digging underground to escape the harsh South African environment where these early proto turtles lived.”
The early evolution of the turtle shell had long puzzled scientists. “We knew from both the fossil record and observing how the turtle shell develops in modern turtles that one of the first major changes toward a shell was the broadening of the ribs,” said Dr. Lyson. While distinctly broadened ribs may not seem like a significant modification, it has a serious impact on both breathing and speed in quadrupedal animals. Ribs are used to support the body during locomotion and play a crucial role in ventilating the lungs. Distinctly broadened ribs stiffen the torso, which shortens an animals stride length and slows it down, interfering with breathing.
“The integral role of ribs in both locomotion and breathing is likely why we don’t see much variation in the shape of ribs,” said Dr. Lyson. “Ribs are generally pretty boring bones. The ribs of whales, snakes, dinosaurs, humans, and pretty much all other animals look the same. Turtles are the one exception, where they are highly modified to form the majority of the shell.”
A big breakthrough came with the discovery of several specimens of the oldest (260- million-year-old) partially shelled proto turtle, Eunotosaurus africanus, from the Karoo Basin of South Africa. Several of these specimens were discovered by two of the study’s coauthors, Drs. Roger Smith and Bruce Rubidge from the University of Witwatersrand in Johannesburg. But the most important specimen was found by a then 8-year-old South African boy on his father’s farm in the Western Cape of South Africa. This specimen, which is about 15 cm long, comprises a well preserved skeleton together with the fully articulated hands and feet.
“I want to thank Kobus Snyman and shake his hand because without Kobus both finding the specimen and taking it to his local museum, the Fransie Pienaar Museum in Prince Albert, this study would not have been possible,” said Dr. Lyson.
Reference:
Tyler R. Lyson, Bruce S. Rubidge, Torsten M. Scheyer, Kevin de Queiroz, Emma R. Schachner, Roger M.H. Smith, Jennifer Botha-Brink, G.S. Bever. Fossorial Origin of the Turtle Shell. Current Biology, 2016; DOI: 10.1016/j.cub.2016.05.020
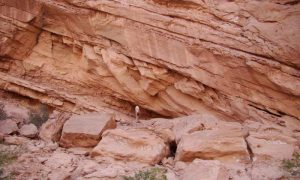
In the dry climate of the Andes rock is eroded at slow rates. The stratification makes tectonic processes visible. Credit: P. Val/University of Syracuse
An unprecedented record of erosion rates dating back millions of years shows a significant time-lag between tectonic uplift and maximum erosion rates in the Argentine Precordillera mountains. According to a new study by an international team of scientists, tectonic shortening and exhumation of rocks peaked between twelve and nine million years ago whereas the maximum erosional response is detected roughly seven million years ago, i.e. two million years later.
Incorporating these new findings into dynamic orogenic models is of high importance for predicting feedbacks between erosion and uplift, says GFZ scientist Hella Wittmann, co-author of the study in the upcoming issue of Earth and Planetary Science Letters. She adds: “Being able to quantify the erosional response to mountain building over long time scales opens new avenues in deciphering the feedbacks between tectonics and climate that interact to shape the landscape of our planet.”
Probing sandstone-outcrops in the foreland of the Argentine Precordillera, a team of scientists from Syracuse and Indiana universities, USA, and GFZ Potsdam, Germany, reconstructed the erosional history of the South-Central Andes at 30°S for the last eight million years. The scientists used a special form of Beryllium (10Be) and Aluminium (26Al) isotopes which are produced through cosmic radiation at a rate of only a few atoms per gram of material per year. Such cosmogenic nuclides form in the upper few meters of Earth’s surface. They accumulate over time once rocks are exposed to the surface. Measuring the amount of 10Be and 26Al in sediment or soil indicates the speed of erosion of the surface material – e.g. high amounts of 10Be are found in slowly eroding settings like old cratons, and few atoms are found in rapidly eroding settings like steep mountains.
Basically two ideas exist on how mountain building, through tectonic shortening, is connected with erosion: Models of orogenic-wedge dynamics predict an instantaneous response of erosion to pulses of rock uplift from isostatic compensation of mass fluxes, while stream-power based models predict a delayed response, because channel gradients are primarily controlled by the propagation of sharp changes in channel slopes (knickpoints) through the fluvial drainage network. Thus, the two-million year delay in the erosional response to tectonic shortening reflects the time necessary for an erosion wave to propagate through the fluvial network under the semi-arid conditions of the Precordillera where erosional efficiency is limited through low rates of precipitation.
Reference:
Pedro Val et al. Reconciling tectonic shortening, sedimentation and spatial patterns of erosion from 10Be paleo-erosion rates in the Argentine Precordillera, Earth and Planetary Science Letters (2016). DOI: 10.1016/j.epsl.2016.06.015
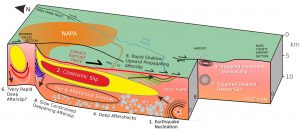
Schematic summary of research findings showing the sequence of slip behavior. Credit: UC Riverside
Preparation and good timing enabled Gareth Funning and a team of researchers to collect a unique data set following the 2014 South Napa earthquake that showed different parts of the fault, sometimes only a few kilometers apart, moved at different speeds and at different times.
Aided by GPS measurements made just weeks before the earthquake and data from a new radar satellite, the team found post-earthquake fault movement, known as afterslip, was concentrated in areas of loosely packed sediment. Areas where the fault passed through bedrock tended to slip more during the actual earthquake.
Sections of Highway 12, which runs through the earthquake zone, were broken during the initial 6.0 magnitude earthquake and were further damaged in the coming days due to afterslip. In some areas the afterslip damage exceeded the initial damage from the earthquake.
“No one has seen variability in afterslip like we saw,” said Funning, an associate professor of earth sciences at the University of California, Riverside. “This helps us address a big question: Can we use geology as a proxy for fault behavior? Our findings suggest there is a relationship between those two things.”
The findings could have significant implications for earthquake hazard models, and also for planning earthquake response. If geological information can give a guide to the likely extent of future earthquakes, better forecasts of earthquake damage will be possible. And if areas likely to experience afterslip can be identified in advance, it can be taken into account when building or repairing infrastructure that crosses those faults
California, in particular the Hayward and Calaveras Faults, which run along the east side of the San Francisco Bay, seems more susceptible to afterslip than other earthquake-prone regions throughout the world, Funning said.
The findings on the South Napa earthquake were recently published in paper, “Spatial variations in fault friction related to lithology from rupture and afterslip of the 2014 South Napa, California, earthquake,” in the journal Geophysical Research Letters.
Funning’s work in the region just north of San Francisco dates back to 2006, when he was a post-doctoral researcher at UC Berkeley and noticed the area wasn’t that well studied, at least compared to the central Bay Area.
He continued the research after he was hired at UC Riverside and received funding from the United States Geological Survey to conduct surveys using GPS sensors in earthquake prone areas throughout Marin, Napa, Sonoma, Mendocino and Lake counties.
He began the most recent survey in July 2014. When the South Napa earthquake struck on Aug. 24, 2014, he and three other researchers were in Upper Lake, CA in Lake County, about 70 miles north of the earthquake’s epicenter, making additional measurements.
The earthquake occurred at 3:20 a.m. By noon, Funning and the other researchers, Michael Floyd (a former post-doctoral researcher with Funning who is now a research scientist at the Massachusetts Institute of Technology), Jerlyn Swiatlowski (a graduate student working with Funning) and Kathryn Materna (a graduate student at UC Berkeley), had deployed additional GPS sensors in the earthquake zone in locations that they had, fortuitously, measured just seven weeks earlier.
In total, there were more than 20 GPS sensors set up by Funning’s team and scientists from the United States Geological Survey. They left the equipment out for four weeks following the earthquake.
They then combined the GPS sensor data with remote sensing data. The South Napa earthquake was the first major earthquake to be imaged by Sentinel-1A, a European radar imaging satellite launched in 2014 that provides higher resolution information than was previously available.
Reference:
Michael A. Floyd et al. Spatial variations in fault friction related to lithology from rupture and afterslip of the 2014 South Napa, California, earthquake, Geophysical Research Letters (2016). DOI: 10.1002/2016GL069428
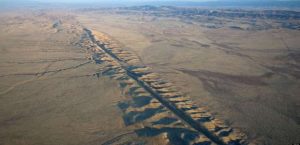
Aerial photo of the San Andreas Fault in the Carrizo Plain, northwest of Los Angeles. Credit: Wikipedia.
The gravitational tug between the sun and moon is not just a dance of high and low tides: It can also trigger a special kind of earthquake on the San Andreas Fault.
This phenomenon has fascinated scientists for years. Like sea levels, the surface of the Earth also goes up and down with the tides, flexing the crust and stressing the faults inside. Further study found that during certain phases of the tidal cycle, small tremors deep underground – known as low-frequency earthquakes – were more likely to occur.
“It’s kind of crazy, right? That the moon, when it’s pulling in the same direction that the fault is slipping, causes the fault to slip more – and faster,” said Nicholas van der Elst, a U.S. Geological Survey geophysicist and lead author of a new study on the subject published Monday in the Proceedings of the National Academy of Sciences. “What it shows is that the fault is super weak – much weaker than we would expect – given that there’s 20 miles of rock sitting on top of it.”
Studying how these low-frequency earthquakes respond to the tides can reveal new information about the San Andreas and what it might mean for larger earthquakes, researchers say. The data offer a window into deeper parts of the fault – as much as 20 miles underground – that would otherwise be inaccessible.
Scientists first discovered these deeper tremors on the fault about 10 years ago, along a particularly sensitive section in Parkfield, Calif., where the San Andreas transitions from its northern section, where it’s gently releasing tectonic energy, to its southern portion, which is locked and capable of producing a big one.
For his most recent study, Van der Elst and his team looked at about 81,000 low-frequency earthquakes from 2008 to 2015 along the Parkfield section of the fault and compared it to the two-week tidal cycle known as the “fortnightly tide.” They found that these earthquakes were most likely to occur during the waxing period, when the tide was getting bigger the fastest.
Like ocean tides, the strongest Earth tides occur when the sun and moon are aligned, and the weakest occur when they are 90 degrees apart. The same gravitational forces stretch and compress the Earth’s crust (though the rock moves less dramatically than seawater).
Some faults are more susceptible to tidal triggering than others, such as offshore faults like the Cascadia subduction zone off the Pacific Northwest coast, scientists said. Other characteristics of the fault, such as its orientation or how close it is to the Earth’s crust, also affect the tidal response.
It’s remarkable that the San Andreas even produces small earthquakes in response to tidal forces, researchers said, given that the fault is not oriented in a way that gets the full strength of the tides.
Low-frequency earthquakes – they’re called “low-frequency” for the rumbling sound that they make, not for their rate of occurrence – tend to have magnitudes less than 1.0 and occur about 15 to 30 kilometers (about 9 to 19 miles) below ground, nearing the deepest part of the crust where it transitions to the Earth’s mantle.
The significance here is less the earthquakes themselves, and more the information they’re giving scientists about the deeper parts of the fault, said USGS seismologist David Shelly, who helped write the new study.
“They tell us that the fault continues down below where the regular or typical earthquakes stop on the San Andreas, about 10 or 12 km (about 6 to 7 miles),” Shelly said. “And they tell us a lot of things about that deep part of the fault that before, we had no idea existed at all.”
They also show that this part of the San Andreas is creeping, or slowly moving, almost all the time. These low-frequency earthquakes, with the help of tidal forces, have essentially created a natural laboratory for scientists to keep tabs on the fault’s movement.
“It’s almost like having a lot of little creep meters embedded in the fault,” Shelly said. “We can use these low-frequency earthquakes as measurements of, at least in a relative sense, how much slip is happening at each little spot on the deep part of the fault where we see these events. When we don’t see them, we don’t know what’s happening; we don’t know whether it’s slipping silently or not slipping at all.”
The information is incredibly useful, he added. Whenever the deep part of the fault slips, the stress gets transferred to the shallow part of the fault.
“So if all of a sudden, we saw that the deep part of the fault was slipping a huge amount, it might be an indication that there was an increased chance of having an earthquake come at the shallower part of the fault,” he said.
By looking at how the rate of activity varied over a two-week tidal cycle, Van der Elst and Shelly found in their most recent study that the fault produced more low-frequency earthquakes if the tidal stress was larger than it was the day before.
It’s like the fault has an earthquake budget, Van der Elst explained. “If you used them up yesterday, you don’t have as many to trigger today. By actually measuring that, we get an estimate of what that stress budget is.”
Essentially, scientists now have a way to measure the fault’s recharge time in certain locations.
“Scientifically, it’s really cool, because we don’t have any other way to directly estimate that number – the rate at which stress is accumulating on the fault,” Van der Elst said. “This is another study that’s adding to our knowledge of how faults work in this transition.”
But, he added: “We don’t quite know yet what it’s going to mean in the long term, whether it’ll result in some sort of warning that an earthquake is coming. We’re going to have to monitor it for a lot longer.”
Reference:
Nicholas J. van der Elst et al. Fortnightly modulation of San Andreas tremor and low-frequency earthquakes, Proceedings of the National Academy of Sciences (2016). DOI: 10.1073/pnas.1524316113
Note: The above post is reprinted from materials provided by Los Angeles Times . The original article was written by Rosanna Xia.
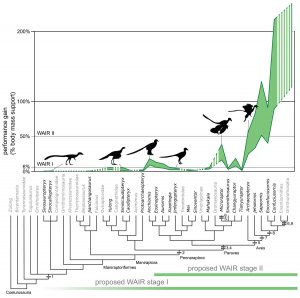
Evolution of WAIR performance. Estimated evolutionary ranges of WAIR stages I and II (Dial, 2003; Heers & Dial, 2012; Heers, Dial & Tobalske, 2014) are mapped over a phylogeny of selected Maniraptoriformes. Upper lines are for 90° flap angles and lower lines for 50° flap angles.
Research by post-doctoral fellow Alexander Dececchi challenges long-held hypotheses about how flight first developed in birds. Furthermore, his findings raise the question of why certain species developed wings long before they could fly.
Dr. Dececchi, a William E. White Post-Doctoral Fellow in the Department of Geological Sciences and Geological Engineering, used measurements from fossil records and data from modern birds to test the evolutionary explanation for the origin of birds. Dr. Dececchi and his colleagues determined that none of the previously predicted methods would have allowed pre-avian dinosaurs to take flight.
“By disproving the idea that the predicted models led to the development of flight, our research is a step towards determining how flight developed and whether it can evolve once or developed multiple times in different evolutionary lines,” he says.
Dr. Dececchi and his colleagues examined 45 specimens, representing 24 different non-avian theropod species, as well as five bird species. After determining some critical variables from the fossils — such as body mass and wing size — they used measurements from living birds to estimate wing beat, flap angle and muscular output.
These values were used to build a model for different behaviours linked to the origins of flight such as vertical leaping and wing-assisted incline running (WAIR) — a method of evasion for many ground-based modern birds that has become a favoured pathway towards the origin of flapping flight in the paleontological literature. They also tested if any species met the requirements to take-off from the ground and fly under their own power.
“We know the dimensions and we know how modern birds muscles and anatomy work,” Dr. Dececchi says. “Using our model, if a particular species doesn’t reach the minimum thresholds for function seen in the much more derived birds — such as the ability to take off or to generate a certain amount of power — it’s safe to say they would not have been able to perform these behaviours or fly.”
The researchers found that none of the behaviours met the criteria expected in the pathway models. In fact, they found that almost all the behaviours had little or no benefit, outside of those species which evolved right before the origin of birds. When looking at WAIR specifically — the method that has been touted as an explanation for some early wing adaptations — the researchers found that it only was possible in a handful of large winged, small bodied species such as Microraptor, but found no evidence to suggest its use was widespread.
Dr. Dececchi says that the group’s findings suggest that wings, even those with large or ornately coloured feathers, could have initially served different purposes rather than flying such as signaling or sexual selection before the development of flight.
Dr. Dececchi explains that the question of whether flight evolved once or multiple times in multiple evolutionary tracks is an ongoing topic of debate. Many of the species studied lived tens of millions of years and thousands of miles apart, with a last common ancestor that existed 50 or 100 million years earlier — leading researchers to wonder if flight evolved once but was lost, or if different species stumbled upon the same solution.
“There is some evidence that they evolved in parallel — there may be some differences in the details between how each taxon flew, but they tend to converge on these same answers,” says Dr. Dececchi. “That, to me, is one of the most exciting questions that has come out of the past few decades of work in theropods.”
Reference:
T. Alexander Dececchi, Hans C.E. Larsson, Michael B. Habib. The wings before the bird: an evaluation of flapping-based locomotory hypotheses in bird antecedents. PeerJ, 2016; 4: e2159 DOI: 10.7717/peerj.2159
Petrified wood is the name given to a special type of fossilized remains of terrestrial vegetation. It is the result of a tree or tree-like plants having completely transitioned to stone by the process of permineralization. All the organic materials have been replaced with minerals (mostly a silicate, such as quartz), while retaining the original structure of the stem tissue. Unlike other types of fossils which are typically impressions or compressions, petrified wood is a three-dimensional representation of the original organic material. The petrifaction process occurs underground, when wood becomes buried under sediment or volcanic ash and is initially preserved due to a lack of oxygen which inhibits aerobic decomposition. Mineral-laden water flowing through the covering material deposits minerals in the plant’s cells; as the plant’s lignin and cellulose decay, a stone mold forms in its place. The organic matter needs to become petrified before it decomposes completely. A forest where such material has petrified becomes known as a petrified forest.
How Does it Form?
Petrified wood is a fossil in which the organic remains have been replaced by minerals in the slow process of being replaced with stone. This petrification process generally results in a quartz chalcedony mineralization. Special rare conditions must be met in order for the fallen stem to be transformed into fossil wood or petrified wood. In general, the fallen plants get buried in an environment free of oxygen (anaerobic environment), which preserves the original plant structure and general appearance. The other conditions include a regular access to mineral rich water in contact with the tissues, replacing the organic plant structure with inorganic minerals. The end result is petrified wood, a plant, with its original basic structure in place, replaced by stone. Exotic minerals allow the red and green hues that can be seen in rarer specimens.
Where are their Locations?
Areas with a large number of petrified trees include:
Argentina – the Sarmiento Petrified Forest and Jaramillo Petrified Forest in Santa Cruz Province in the Argentine Patagonia have many trees that measure more than 3 m (10 ft) in diameter and 30 m (100 ft) long.
Australia – has deposits of petrified and opalised wood. Chinchilla, Queensland is famous for its ‘Chinchilla Red’.
Belgium – Geosite Goudberg near Hoegaarden.
Brazil:
1- Geopark of Paleorrota, there is a vast area with petrified trees.
2- Monumento Natural das Árvores Fossilizadas (Fossil Trees Natural Monument) in Tocantins: petrified forests of dicksoniaceae (specifically Psaronius and Tietea singularis) and arthropitys
3- Petrified forests of dicksoniaceae (specifically Psaronius and Tietea singularis) and arthropitys can also be found in the state of São Paulo
4- Floresta Fóssil de Teresina near Rio Poti, Piauí, Permian (around 280-270 million years ago).
Canada – in the badlands of southern Alberta; Petrified wood is the provincial stone of Alberta. Axel Heiberg Island in Nunavut has a large petrified forest. In and around the North Saskatchewan river, around the Edmonton area.
China – in the Junggar Basin of Xinjiang, northwest China government has issued a crackdown on collecting of this material, but large slabs and even large meeting tables have been made out of the colorful petrified wood.
Czech Republic, Nová Paka – The most famous locality on Permian-Carboniferous rocks in the Czech Republic.
Ecuador – Puyango Petrified Forest (es). One of the largest collections of petrified wood in the world.
Egypt – petrified forest in Cairo-Suez road, declared a national protectorate by the ministry of environment, also in the area of New Cairo at the Extension of Nasr city, El Qattamiyya, near El Maadi district, and Al Farafra oasis.
France – petrified forest in the village of Champclauson
Germany – the museum of natural history in Chemnitz has a collection of petrified trees, from the in situ Chemnitz Petrified Forest, found in the town since 1737.
Greece – Petrified Forest of Lesvos, at the western tip of the island of Lesbos, is possibly the largest of the petrified forests, covering an area of over 150 km² and declared a National Monument in 1985. Large, upright trunks complete with root systems can be found, as well as trunks up to 22 m in length.
India – a geological site known for its petrified wood Thiruvakkarai Village in Chennai, Tamil Nadu. The site is protected by the Geological Survey of India. Petrified wood covers a large area in this site. Petrified Wood has also been discovered in Dholavira in Kutch, Gujarat, dating back to 187-176 million years.
Indonesia – petrified wood covers several area in Banten and also in some part of Mount Halimun Salak National Park.
Italy:
1-Foresta fossile di Dunarobba, petrified forest near Avigliano Umbro, Umbria (Central Italy), age Piacenzian.
2- Foresta pietrificata di Zuri – Soddì, petrified forest near Soddì (Province of Oristano, Sardinia), age Chattian-Aquitanian.
Libya – Great Sand Sea – Hundreds of square miles of petrified trunks, branches and other debris mixed with Stone Age artifacts
Namibia – petrified forest of Damaraland
New Zealand:
1- Curio Bay on the Catlins coast contains many petrified wood examples.
2- Fossil Forest, Takapuna, Auckland, New Zealand
Saudi Arabia – petrified forest north of Riyadh
Thailand – Bantak Petrified Forest Park in Ban Tak District
Ukraine – petrified araucaria trunks near Druzhkivka
United Kingdom – many examples of petrified submerged forests can be found at low tide around the coast of England and Wales.
1- Fossil Grove, Glasgow, Scotland
2- Fossil Forest, Dorset, England
United States – petrified wood sites include:
1- Petrified Wood Park in Lemmon, South Dakota
2- Ginkgo/Wanapum State Park in Washington State
3- Petrified Forest National Park in Arizona
4- Petrified Forest (California) in California
5- Mississippi Petrified Forest in Flora, Mississippi
6- Florissant Fossil Beds National Monument near Florissant, Colorado
7- Yellowstone Petrified Forest and Gallatin Petrified Forest, Yellowstone National Park, Wyoming
8- The south unit of Theodore Roosevelt National Park outside Medora, North Dakota
9- Gilboa Fossil Forest, New York
10- Escalante Petrified Forest State Park in Utah
11- Agate Desert in the Upper Rogue River Valley near Medford, Oregon
Artificial petrified wood
Artificial petrified wood has been produced in a Washington laboratory. In the process, small cubes of pine are soaked in an acid bath for two days, then in a silica solution for another two. The product is then cooked at 1400 °C in an argon atmosphere for two hours. The result was silicon carbide ceramic which preserved the intricate cell structure of the wood.
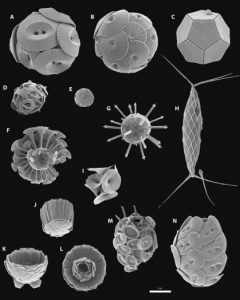
Emiliania huxleyi, the reference species for coccolithophore studies, is contrasted with a range of other species spanning the biodiversity of modern coccolithophores. All images are scanning electron micrographs of cells collected by seawater filtration from the open ocean. (A to N) Species illustrated: (A) Coccolithus pelagicus, (B) Calcidiscus leptoporus, (C) Braarudosphaera bigelowii, (D) Gephyrocapsa AQ53 oceanica, (E) E. huxleyi, (F) Discosphaera tubifera, (G) Rhabdosphaera spinifera, (H) Calciosolenia murrayi, (I) Umbellosphaera irregularis, (J) Gladiolithus flabellatus, (K and L) Florisphaera profunda, (M) Syracosphaera pulchra, and (N) Helicosphaera carteri. Scale bar, 5 mm. Credit: Fanny M. Monteiro et al. Sci Adv 2016;2:e1501822
An international research team has calculated the costs and benefits of calcification for phytoplankton and the impact of climate change on their important role in the world’s oceans.
Single-celled phytoplankton play an important role in marine biogeochemical cycling, in marine food webs and in the global climate system. Coccolithophores are a particular group that cover themselves with calcium carbonate shields, known as coccoliths. Some wrap themselves in an impenetrable coat of coccoliths, some make coccoliths in the form of sharp spikes, some use them as parasols against the sun and some form funnel-shaped light collectors..
But this requires a lot of energy — and the price for the artful armour could rise further due to global change. With the help of a new model, the researchers analysed the energetic costs and benefits of calcification. The results, published in the current issue of the journal Science Advances, suggest that the ecological niche for calcifying algae will become narrower in the future.
The study’s lead author, Dr Fanny Monteiro, lecturer and NERC research fellow from the school of Geographical Sciences at the University of Bristol, said: “Calcification in coccolithophores has high energy demand but brings multiple benefits enabling the currently observed diversity of their ecology and form.”
Professor Toby Tyrrell, Professor in Earth System Science at the University of Southampton and co-author of the study, added: “In the future ocean, the trade-off between changing ecological and physiological costs of calcification and their benefits will ultimately decide how this important group is affected by ocean acidification and global warming. There are signs that their distribution in the oceans is changing over time. If we understand better the costs and benefits of their distinguishing feature (coccoliths) then this should help us understand why their biogeography is shifting.”
To better understand the purpose of the elaborate armour and assess to what extent they will suffer the consequences of global change, researchers from Germany, Great Britain, France and the United States combined results from evolutionary history and cell biology studies, laboratory, field and modelling experiments.
“Presumably, the algae built their calcareous shells as a protection against predators. However, since the different structures had other benefits as well, a variety of forms was developed to make further use of these advantages,” explains Professor Ulf Riebesell, marine biologist at GEOMAR Helmholtz Centre for Ocean Research Kiel and co-author of the study.
So far, the high energetic costs have paid off: “Coccolithophorids have survived over 200 million years. But now it is questionable whether they are also able to withstand climate change,” says Professor Riebesell.
The 200 coccolithophore species produce up to ten per cent of the biomass in the oceans and keep the marine carbon cycle running. Stuck to their calcium carbonate platelets, organic matter sinks to the ocean floor — allowing surface layers to take up a new carbon dioxide from the atmosphere and process it.
Whether these unicellular multi-talented organisms will be able to fulfil their functions in the future, depends on how much extra energy they have to spend on calcification — and how their competitors in the food web react to ocean change. The amount of carbon dioxide dissolved in seawater is increasing due to fossil fuel emissions. This slightly stimulates photosynthesis.
On the other hand, the associated reduction in pH (ocean acidification) hampers calcification. “Compared to other planktonic organisms, coccolithophores will find themselves in a disadvantage. Their decline would also have an impact on the climate system,” says Dr Lennart Bach, second co-author of the study from GEOMAR. “Therefore, new model approaches such as ours are important in order to explore how increasing energy costs, as required for calcification, will pay off in the future.”
Reference:
F. M. Monteiro, L. T. Bach, C. Brownlee, P. Bown, R. E. M. Rickaby, A. J. Poulton, T. Tyrrell, L. Beaufort, S. Dutkiewicz, S. Gibbs, M. A. Gutowska, R. Lee, U. Riebesell, J. Young, A. Ridgwell. Why marine phytoplankton calcify. Science Advances, 2016; 2 (7): e1501822 DOI: 10.1126/sciadv.1501822
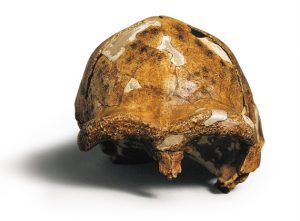
The reconstructed skull of Peking Man, the fossil that launched discussions of human origins in China. Credit: DeAgostini/Getty
On the outskirts of Beijing, a small limestone mountain named Dragon Bone Hill rises above the surrounding sprawl. Along the northern side, a path leads up to some fenced-off caves that draw 150,000 visitors each year, from schoolchildren to grey-haired pensioners. It was here, in 1929, that researchers discovered a nearly complete ancient skull that they determined was roughly half a million years old. Dubbed Peking Man, it was among the earliest human remains ever uncovered, and it helped to convince many researchers that humanity first evolved in Asia.
Since then, the central importance of Peking Man has faded. Although modern dating methods put the fossil even earlier—at up to 780,000 years old—the specimen has been eclipsed by discoveries in Africa that have yielded much older remains of ancient human relatives. Such finds have cemented Africa’s status as the cradle of humanity—the place from which modern humans and their predecessors spread around the globe—and relegated Asia to a kind of evolutionary cul-de-sac.
But the tale of Peking Man has haunted generations of Chinese researchers, who have struggled to understand its relationship to modern humans. “It’s a story without an ending,” says Wu Xinzhi, a palaeontologist at the Chinese Academy of Sciences’ Institute of Vertebrate Paleontology and Paleoanthropology (IVPP) in Beijing. They wonder whether the descendants of Peking Man and fellow members of the species Homo erectus died out or evolved into a more modern species, and whether they contributed to the gene pool of China today.
Keen to get to the bottom of its people’s ancestry, China has in the past decade stepped up its efforts to uncover evidence of early humans across the country. It is reanalysing old fossil finds and pouring tens of millions of dollars a year into excavations. And the government is setting up a US$1.1-million laboratory at the IVPP to extract and sequence ancient DNA.
The investment comes at a time when palaeoanthropologists across the globe are starting to pay more attention to Asian fossils and how they relate to other early hominins—creatures that are more closely related to humans than to chimps. Finds in China and other parts of Asia have made it clear that a dazzling variety of Homo species once roamed the continent. And they are challenging conventional ideas about the evolutionary history of humanity.
“Many Western scientists tend to see Asian fossils and artefacts through the prism of what was happening in Africa and Europe,” says Wu. Those other continents have historically drawn more attention in studies of human evolution because of the antiquity of fossil finds there, and because they are closer to major palaeoanthropology research institutions, he says. “But it’s increasingly clear that many Asian materials cannot fit into the traditional narrative of human evolution.”
Chris Stringer, a palaeoanthropologist at the Natural History Museum in London, agrees. “Asia has been a forgotten continent,” he says. “Its role in human evolution may have been largely under-appreciated.”
Evolving story
In its typical form, the story of Homo sapiens starts in Africa. The exact details vary from one telling to another, but the key characters and events generally remain the same. And the title is always ‘Out of Africa’.
In this standard view of human evolution, H. erectus first evolved there more than 2 million years ago (see ‘Two routes for human evolution’). Then, some time before 600,000 years ago, it gave rise to a new species: Homo heidelbergensis, the oldest remains of which have been found in Ethiopia. About 400,000 years ago, some members of H. heidelbergensis left Africa and split into two branches: one ventured into the Middle East and Europe, where it evolved into Neanderthals; the other went east, where members became Denisovans—a group first discovered in Siberia in 2010. The remaining population of H. heidelbergensis in Africa eventually evolved into our own species, H. sapiens, about 200,000 years ago. Then these early humans expanded their range to Eurasia 60,000 years ago, where they replaced local hominins with a minuscule amount of interbreeding.
A hallmark of H. heidelbergensis—the potential common ancestor of Neanderthals, Denisovans and modern humans—is that individuals have a mixture of primitive and modern features. Like more archaic lineages, H. heidelbergensis has a massive brow ridge and no chin. But it also resembles H. sapiens, with its smaller teeth and bigger braincase. Most researchers have viewed H. heidelbergensis—or something similar—as a transitional form between H. erectus and H. sapiens.
Unfortunately, fossil evidence from this period, the dawn of the human race, is scarce and often ambiguous. It is the least understood episode in human evolution, says Russell Ciochon, a palaeoanthropologist at the University of Iowa in Iowa City. “But it’s central to our understanding of humanity’s ultimate origin.”
The tale is further muddled by Chinese fossils analysed over the past four decades, which cast doubt over the linear progression from African H. erectus to modern humans. They show that, between roughly 900,000 and 125,000 years ago, east Asia was teeming with hominins endowed with features that would place them somewhere between H. erectus and H. sapiens, says Wu (see ‘Ancient human sites’).
“Those fossils are a big mystery,” says Ciochon. “They clearly represent more advanced species than H. erectus, but nobody knows what they are because they don’t seem to fit into any categories we know.”
The fossils’ transitional characteristics have prompted researchers such as Stringer to lump them with H. heidelbergensis. Because the oldest of these forms, two skulls uncovered in Yunxian in Hubei province, date back 900,000 years1, 2, Stringer even suggests that H. heidelbergensis might have originated in Asia and then spread to other continents.
But many researchers, including most Chinese palaeontologists, contend that the materials from China are different from European and African H. heidelbergensis fossils, despite some apparent similarities. One nearly complete skull unearthed at Dali in Shaanxi province and dated to 250,000 years ago, has a bigger braincase, a shorter face and a lower cheekbone than most H. heidelbergensis specimens3, suggesting that the species was more advanced.
Such transitional forms persisted for hundreds of thousands of years in China, until species appeared with such modern traits that some researchers have classified them as H. sapiens. One of the most recent of these is represented by two teeth and a lower jawbone, dating to about 100,000 years ago, unearthed in 2007 by IVPP palaeoanthropologist Liu Wu and his colleagues4. Discovered in Zhirendong, a cave in Guangxi province, the jaw has a classic modern-human appearance, but retains some archaic features of Peking Man, such as a more robust build and a less-protruding chin.
Most Chinese palaeontologists—and a few ardent supporters from the West—think that the transitional fossils are evidence that Peking Man was an ancestor of modern Asian people. In this model, known as multiregionalism or continuity with hybridization, hominins descended from H. erectus in Asia interbred with incoming groups from Africa and other parts of Eurasia, and their progeny gave rise to the ancestors of modern east Asians, says Wu.
Support for this idea also comes from artefacts in China. In Europe and Africa, stone tools changed markedly over time, but hominins in China used the same type of simple stone instruments from about 1.7 million years ago to 10,000 years ago. According to Gao Xing, an archaeologist at the IVPP, this suggests that local hominins evolved continuously, with little influence from outside populations.
Politics at play?
Some Western researchers suggest that there is a hint of nationalism in Chinese palaeontologists’ support for continuity. “The Chinese—they do not accept the idea that H. sapiens evolved in Africa,” says one researcher. “They want everything to come from China.”
Chinese researchers reject such allegations. “This has nothing to do with nationalism,” says Wu. It’s all about the evidence—the transitional fossils and archaeological artefacts, he says. “Everything points to continuous evolution in China from H. erectus to modern human.”
But the continuity-with-hybridization model is countered by overwhelming genetic data that point to Africa as the wellspring of modern humans. Studies of Chinese populations show that 97.4% of their genetic make-up is from ancestral modern humans from Africa, with the rest coming from extinct forms such as Neanderthals and Denisovans5. “If there had been significant contributions from Chinese H. erectus, they would show up in the genetic data,” says Li Hui, a population geneticist at Fudan University in Shanghai. Wu counters that the genetic contribution from archaic hominins in China could have been missed because no DNA has yet been recovered from them.
Many researchers say that there are ways to explain the existing Asian fossils without resorting to continuity with hybridization. The Zhirendong hominins, for instance, could represent an exodus of early modern humans from Africa between 120,000 and 80,000 years ago. Instead of remaining in the Levant in the Middle East, as was thought previously, these people could have expanded into east Asia, says Michael Petraglia, an archaeologist at the University of Oxford, UK.
Other evidence backs up this hypothesis: excavations at a cave in Daoxian in China’s Hunan province have yielded 47 fossil teeth so modern-looking that they could have come from the mouths of people today. But the fossils are at least 80,000 years old, and perhaps 120,000 years old, Liu and his colleagues reported last year6. “Those early migrants may have interbred with archaic populations along the way or in Asia, which could explain Zhirendong people’s primitive traits,” says Petraglia.
Another possibility is that some of the Chinese fossils, including the Dali skull, represent the mysterious Denisovans, a species identified from Siberian fossils that are more than 40,000 years old. Palaeontologists don’t know what the Denisovans looked like, but studies of DNA recovered from their teeth and bones indicate that this ancient population contributed to the genomes of modern humans, especially Australian Aborigines, Papua New Guineans and Polynesians—suggesting that Denisovans might have roamed Asia.
María Martinón-Torres, a palaeoanthropologist at University College London, is among those who proposed that some of the Chinese hominins were Denisovans. She worked with IVPP researchers on an analysis7, published last year, of a fossil assemblage uncovered at Xujiayao in Hebei province—including partial jaws and nine teeth dated to 125,000–100,000 years ago. The molar teeth are massive, with very robust roots and complex grooves, reminiscent of those from Denisovans, she says.
A third idea is even more radical. It emerged when Martinón-Torres and her colleagues compared more than 5,000 fossil teeth from around the world: the team found that Eurasian specimens are more similar to each other than to African ones8. That work and more recent interpretations of fossil skulls suggest that Eurasian hominins evolved separately from African ones for a long stretch of time. The researchers propose that the first hominins that left Africa 1.8 million years ago were the eventual source of modern humans. Their descendants mostly settled in the Middle East, where the climate was favourable, and then produced waves of transitional hominins that spread elsewhere. One Eurasian group went to Indonesia, another gave rise to Neanderthals and Denisovans, and a third ventured back into Africa and evolved into H. sapiens, which later spread throughout the world. In this model, modern humans evolved in Africa, but their immediate ancestor originated in the Middle East.
Not everybody is convinced. “Fossil interpretations are notoriously problematic,” says Svante Pääbo, a palaeogeneticist at the Max Planck Institute for Evolutionary Anthropology in Leipzig, Germany. But DNA from Eurasian fossils dating to the start of the human race could help to reveal which story—or combination—is correct. China is now making a push in that direction. Qiaomei Fu, a palaeogeneticist who did her PhD with Pääbo, returned home last year to establish a lab to extract and sequence ancient DNA at the IVPP. One of her immediate goals is to see whether some of the Chinese fossils belong to the mysterious Denisovan group. The prominent molar teeth from Xujiayao will be an early target. “I think we have a prime suspect here,” she says.
Fuzzy picture
Despite the different interpretations of the Chinese fossil record, everybody agrees that the evolutionary tale in Asia is much more interesting than people appreciated before. But the details remain fuzzy, because so few researchers have excavated in Asia.
When they have, the results have been startling. In 2003, a dig on Flores island in Indonesia turned up a diminutive hominin9, which researchers named Homo floresiensis and dubbed the hobbit. With its odd assortment of features, the creature still provokes debate about whether it is a dwarfed form of H. erectus or some more primitive lineage that made it all the way from Africa to southeast Asia and lived until as recently as 60,000 years ago. Last month, more surprises emerged from Flores, where researchers found the remains of a hobbit-like hominin in rocks about 700,000 years old10.
Recovering more fossils from all parts of Asia will clearly help to fill in the gaps. Many palaeoanthropologists also call for better access to existing materials. Most Chinese fossils—including some of the finest specimens, such as the Yunxian and Dali skulls—are accessible only to a handful of Chinese palaeontologists and their collaborators. “To make them available for general studies, with replicas or CT scans, would be fantastic,” says Stringer. Moreover, fossil sites should be dated much more rigorously, preferably by multiple methods, researchers say.
But all agree that Asia—the largest continent on Earth—has a lot more to offer in terms of unravelling the human story. “The centre of gravity,” says Petraglia, “is shifting eastward.”
Reference:
Jane Qiu. How China is rewriting the book on human origins, Nature (2016). DOI: 10.1038/535218a
Note: The above post is reprinted from materials provided by Nature. The original article was written by Jane Qiu.
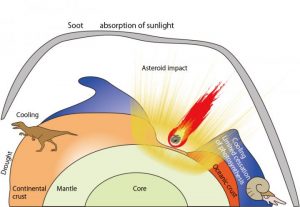
Global climate change caused by soot aerosol at the K-Pg boundary. Credit: Kunio Kaiho
A new hypothesis on the extinction of dinosaurs and ammonites at the end of the Cretaceous Period has been proposed by a research team from Tohoku University and the Japan Meteorological Agency’s Meteorological Research Institute.
The researchers believe that massive amounts of stratospheric soot ejected from rocks following the famous Chicxulub asteroid impact, caused global cooling, drought and limited cessation of photosynthesis in oceans. This, they say, could have been the process that led to the mass extinction of dinosaurs and ammonites.
The asteroid, also known as the Chicxulub impactor, hit Earth some 66 million years ago, causing a crater more than 180 km wide. It’s long been believed that that event triggered the mass extinction that led to the macroevolution of mammals and the appearance of humans.
Tohoku University Professor Kunio Kaiho and his team analyzed sedimentary organic molecules from two places – Haiti, which is near the impact site, and Spain, which is far. They found that the impact layer of both areas have the same composition of combusted organic molecules showing high energy. This, they believe, is the soot from the asteroid crash.
Soot is a strong, light-absorbing aerosol, and Kaiho’s team came by their hypothesis by calculating the amount of soot in the stratosphere estimating global climate changes caused by the stratospheric soot aerosols using a global climate model developed at the Meteorological Research Institute. The results are significant because they can explain the pattern of extinction and survival.
While it is widely accepted that the Chicxulub impact caused the mass extinction of dinosaurs and other life forms, researchers have been stumped by the process of how. In other words, they’d figured out the killer, but not the murder weapon.
Earlier theories had suggested that dust from the impact may have blocked the sun, or that sulphates may have contaminated the atmosphere. But researchers say it is unlikely that either phenomenon could have lasted long enough to have driven the extinction.
The new hypothesis raised by Kaiho’s team says that soot from hydrocarbons had caused a prolonged period of darkness which led to a drop in atmospheric temperature. The team found direct evidence of hydrocarbon soot in the impact layers and created models showing how this soot would have affected the climate.
According to their study, when the asteroid hit the oil-rich region of Chicxulub, a massive amount of soot was ejected which then spread globally. The soot aerosols caused colder climates at mid-high latitudes, and drought with milder cooling at low latitudes on land. This in turn led to the cessation of photosynthesis in oceans in the first two years, followed by surface-water cooling in oceans in subsequent years.
This rapid climate change is believed to be behind the loss of land and marine creatures over several years, suggesting that rapid global climate change can and did play a major role in driving extinction.
Kaiho’s team is studying other mass extinctions in the hopes of further understanding the processes behind them.
Reference:
Kunio Kaiho, Naga Oshima, Kouji Adachi, Yukimasa Adachi, Takuya Mizukami, Megumu Fujibayashi & Ryosuke Saito. Global climate change driven by soot at the K-Pg boundary as the cause of the mass extinction. DOI:10.1038/srep28427
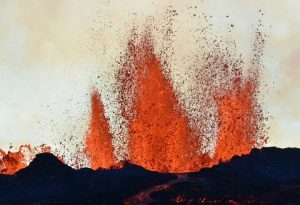
The Bardarbunga eruption on Iceland has broken many records. The event in 2014 was the strongest in Europe since more than 240 years. The hole it left behind, the so-called caldera, is the biggest caldera formation ever observed. And the event as such was studied in unprecedented detail by a team of international scientists, amongst them a group from the GFZ German Research Centre for Geosciences. Credit: GFZ German Research Centre for Geosciences
The Bárdarbunga eruption on Iceland has broken many records. The event in 2014 was the strongest in Europe since more than 240 years. The hole it left behind, the so-called caldera, is the biggest caldera formation ever observed. And the event as such was studied in unprecedented detail by a team of international scientists, amongst them a group from the GFZ German Research Centre for Geosciences. Together with lead author Magnus T. Gudmundsson from the University of Iceland, the team has now published its findings in the upcoming issue of Science.
From August 2014 to February 2015, the Bárdabunga caldera was formed in the centre of Iceland. Calderas are kettle-shaped volcanic structures with a diameter of one kilometer up to 100 kilometers. They form through the collapse of subterranean magma reservoirs during volcanic eruptions. Since their formation is not very frequent, knowledge of such calderas is scarce. As part of an international team, GFZ scientists from the section Physics of Earthquakes and Volcanoes documented the event in great detail. The scientists used satellite images, seismological and geochemical data, GPS data and modelling.
The process of subsidence was triggered by the lateral intrusion of magma from a reservoir 12 kilometers below the surface. The magma flowed for 45 kilometers along a subterranean path before erupting as a major lava flow northeast of the volcano. The subsidence was accompanied by 77 earthquakes reaching magnitudes larger than M 5.
In their study, the scientists show how the ice-filled subsidence bowl developed gradually over the course of six months to become eight by eleven kilometers wide and up to 65 meters deep. “With an area of 110 square kilometers, this is the largest caldera collapse ever monitored. The results provide the clearest picture yet of the onset and evolution of this enigmatic geological process,” says Dr. Eoghan Holohan, who led the modelling part of this work at the GFZ.
Dr. Sebastian Heimann (GFZ) investigated the mechanisms underlying the collapse using seismological methods. “The typical structure of seismic waves in volcanic eruptions can be used to infer the type of deformation directly above the magmatic chamber.” The result of his analysis indicates that steeply-dipping ring faults controlled the subsidence at depth.
Another surprise for the scientists was how the magma behaved within the canal beneath the surface. “Interestingly, the eruption site and the magma chamber were coupled hydraulically over 45 kilometers,” says Dr. Thomas Walter from the GFZ. He compares the effect to a hose pipe level. Tremors and seismic shocks at the eruption site propagated to the magma chamber at the other end and vice versa.
The chamber lies beneath Europe’s largest glacier, the Vatnajökull, and the caldera was filled with ice. Thomas Walter says: “The event was a blessing in disguise as the eruption could have happened directly beneath the ice. In that case, we’d have had a water vapour explosion with a volcanic ash cloud even bigger and longer lasting than the one that followed the eruption of Eyjafjallajökull in 2010.” For comparison: The Bárdabunga eruption blew out two cubic kilometers of volcanic material over the course of several months, nearly ten times more than the Eyjafjallajökull.
With the data they gathered, the geoscientists hope to gain deeper insights into the currently un-explored mechanisms of caldera formation. Eruptions connected to such processes can be far bigger than the observed Icelandic event. Catastrophic events can occur for instance at Yellowstone, USA, or in the Andes region. Exactly 200 years ago, the eruption of the Tambora volcano in Indonesia and the subsequent caldera formation lead to an atmospheric shock wave that could be measured globally as well as to a devastating tsunami. The volcanic aerosols and ash in the stratosphere brought the infamous “year without summer” in 1816.
Reference:
M. T. Gudmundsson, K. Jonsdottir, A. Hooper, E. P. Holohan, S. A. Halldorsson, B. G. Ofeigsson, S. Cesca, K. S. Vogfjord, F. Sigmundsson, T. Hognadottir, P. Einarsson, O. Sigmarsson, A. H. Jarosch, K. Jonasson, E. Magnusson, S. Hreinsdottir, M. Bagnardi, M. M. Parks, V. Hjorleifsdottir, F. Palsson, T. R. Walter, M. P. J. Schopfer, S. Heimann, H. I. Reynolds, S. Dumont, E. Bali, G. H. Gudfinnsson, T. Dahm, M. J. Roberts, M. Hensch, J. M. C. Belart, K. Spaans, S. Jakobsson, G. B. Gudmundsson, H. M. Fridriksdottir, V. Drouin, T. Durig, G. Athalgeirsdottir, M. S. Riishuus, G. B. M. Pedersen, T. van Boeckel, B. Oddsson, M. A. Pfeffer, S. Barsotti, B. Bergsson, A. Donovan, M. R. Burton, A. Aiuppa. Gradual caldera collapse at Bardarbunga volcano, Iceland, regulated by lateral magma outflow. Science, 2016; 353 (6296): aaf8988 DOI: 10.1126/science.aaf8988
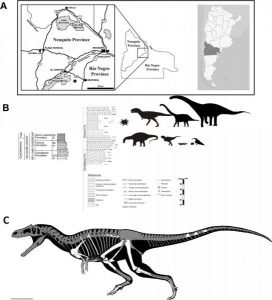
Life reconstruction of skeletal remains of Gualicho shinyae and stratigraphic and geographic details of the find. (A) Map of Rio Límay region of northern Patagonia, showing where the holotype of Gualicho shinyae was discovered (star) (B) Schematic stratigraphic column of lower part of Neuquén Group (Upper Cretaceous) strata exposed in the Neuquén Basin with approximate level at which the holotype of Gualicho shinyae was collected from the base of the Huincul Formation. See S1 Fig for excavation photos. (C) Skeletal reconstruction of Gualicho shinyae showing recovered elements in white and missing elements in grey shading. Credit: Apesteguia et al. (2016); Artwork by J. Gonzalez; CCAL
The discovery of a theropod dinosaur with Tyrannosaurus rex-like arms suggests that these unusual forelimbs may have evolved multiple times, according to a study published July 13, 2016 in the open-access journal PLOS ONE by Sebastián Apesteguía from the Universidad Maimónides, Argentina, and colleagues.
The Patagonian region of Argentina has previously proven to be rich in fossils from the Late Cretaceous epoch, which can teach us about the dinosaurs living there in this period. The authors of the present study examined a new Late Cretaceous dinosaur skeleton from the Huincul Formation in northern Patagonia and conducted phylogenetic analysis to determine its evolutionary history.
The dinosaur, which they named Gualicho shinyae, is a new theropod species which likely forms a sister taxon to the African dinosaur Deltadromeus. Although the skeleton was incomplete, the authors estimate that the dinosaur was likely a medium-sized slender predator weighing around a half ton, comparable to a polar bear. The analyzed skeleton shares many anatomical similarities with Deltadromeus. However, despite its overall size, the forelimbs were comparable in size to that of a human child’s, and the claws had just two digits (thumb and forefinger). These unusual arms are much more similar to those of the distantly related Tyrannosaurus rex (T. rex) than more closely-related species and may indicate that the forelimbs evolved independently on two branches of the evolutionary tree, rather than arising from a common short-armed ancestor.
Co-author Peter Makovicky notes: “Gualicho is kind of a mosaic dinosaur, it has features that you normally see in different kinds of theropods,” says corresponding author Peter Makovicky, The Field Museum’s Curator of Dinosaurs. “It’s really unusual — it’s different from the other carnivorous dinosaurs found in the same rock formation, and it doesn’t fit neatly into any category.”
It is not known why dinosaurs such as G. shinyae and T. rex had such disproportionately small forearms. Whilst this newly discovered dinosaur does not solve the mystery, it adds to evidence that the trait may have evolved independently numerous times. “By learning more about how reduced forelimbs evolved, we may be able to figure out why they evolved,” explains Peter Makovicky.
Reference:
Sebastián Apesteguía, Nathan D. Smith, Rubén Juárez Valieri, Peter J. Makovicky. An Unusual New Theropod with a Didactyl Manus from the Upper Cretaceous of Patagonia, Argentina. PLOS ONE, 2016; 11 (7): e0157793 DOI: 10.1371/journal.pone.0157793
Note: The above post is reprinted from materials provided by PLOS.
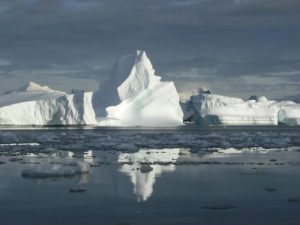
Icebergs calved off from the glaciers in Marguerite Bay, Antarctic Peninsula. Credit: Alison Cook
A new study has found for the first time that ocean warming is the primary cause of retreat of glaciers on the western Antarctic Peninsula. The Peninsula is one of the largest current contributors to sea-level rise and this new finding will enable researchers to make better predictions of ice loss from this region.
The research, by scientists at Swansea University and British Antarctic Survey, is published in the journal Science today (Friday, July 15). The study reports that glaciers flowing to the coast on the western side of the Peninsula show a distinct spatial correlation with ocean temperature patterns, with those in the south retreating rapidly but those in the north showing little change. Some 90% of the 674 glaciers in this region have retreated since records began in the 1940s.
Dr Alison Cook, who led the work at Swansea University, says: “Scientists know that ocean warming is affecting large glaciers elsewhere on the continent, but thought that atmospheric temperatures were the primary cause of all glacier changes on the Peninsula. We now know that’s not the case.
“The numerous glaciers on the Antarctic Peninsula give a key insight as to how environmental factors control ice behaviour on a wide scale. Almost all glaciers on the western side end in the sea, and we’ve been able to monitor changes in their ice fronts using images as far back as the 1940s. Glaciers here are extremely diverse and yet the changes in their frontal positions showed a strong regional pattern.
“We were keen to understand what was causing the differences, in particular why the glaciers in the north-west showed less retreat than those further South and why there was acceleration in retreat since the 1990s. The ocean temperature records have revealed the crucial link.”
The team studied ocean temperature measurements around the Peninsula stretching back several decades, alongside photography and satellite data of the 674 glaciers.
The north-south gradient of increasing glacier retreat was found to show a strong pattern with ocean temperatures, whereby water is cold in the north-west, and becomes progressively warmer at depths below 100m further south. Importantly, the warm water at mid-depths in the southerly region has been warming since as long ago as the 1990s, at the same time as the widespread acceleration in glacier retreat.
Co-author Professor Mike Meredith at British Antarctic Survey says: “These new findings demonstrate for the first time that the ocean plays a major role in controlling the stability of glaciers on the western Antarctic Peninsula.
“Where mid-depth waters from the deep ocean intrude onto the continental shelf and spread towards the coast, they bring heat that causes the glaciers to break up and melt. These waters have become warmer and moved to shallower depths in recent decades, causing glacier retreat to accelerate.”
Co-author Professor Tavi Murray, who leads the Glaciology Research Group at Swansea University, says: “The glaciers on the Antarctic Peninsula are changing rapidly — almost all of the Peninsula’s glaciers have retreated since the 1940s. We have known the region is a climate warming hotspot for a while, but we couldn’t explain what was causing the pattern of glacier change.
“This new study shows that a warmer ocean is the key to understanding the behaviour of glaciers on the Antarctic Peninsula. Currently the Peninsula makes one of the largest contributions to sea-level rise, which means understanding this link will improve predications of sea-level rise.”
Reference:
A. J. Cook, P. R. Holland, M. P. Meredith, T. Murray, A. Luckman, D. G. Vaughan. Ocean forcing of glacier retreat in the western Antarctic Peninsula. Science, 2016 DOI: 10.1126/science.aae0017
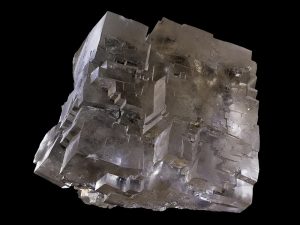
Halite from the Wieliczka Salt Mine, UNESCO World Heritage Site, Wieliczka, Malopolskie, Poland. Photo courtesy Didier Descouens, CC BY-SA.
A team of international scientists from China, France, Scotland, United States and led by Canadian Professors Nigel Blamey and Uwe Brand of Brock University in southern Ontario made a scientific breakthrough by measuring the oxygen content of Earth’s ancient atmosphere. They discovered that gases trapped by halite (rock salt) during crystallization may contain atmospheric gases, among them oxygen.
Oxygen is a key component in determining the origin and evolution of higher life forms that ultimately made Earth’s land and sea their home. The gases in inclusion of halite represent direct measurements of the ancient atmosphere, and can be used to calculate the dissolved oxygen content of past seawater and lay out the requirements for the evolution of higher life forms in the shallow and deep ocean.
This discovery has applications beyond the origin of life, to evaluating salt units as depositories for hazardous waste material, to tracking atmospheric changes in carbon dioxide and methane with climate change, to pinpointing the genesis of economic metal deposits, and application of this important scientific discovery to the search for life on extraterrestrial bodies.
Reference:
Paradigm shift in determining Neoproterozoic atmospheric oxygen
Nigel J.F. Blamey et al., Department of Earth Sciences, Brock University, 1812 Sir Isaac Brock Way, St Catharines, Ontario L2S 3A1, Canada. DOI: 10.1130/G37937.1
There has been a long debate about why dinosaurs were so successful. Say dinosaur, and most people think of the great flesh-eaters such as Tyrannosaurus rex, but the most successful dinosaurs were of course the plant-eaters.
A new study from the University of Bristol, led by Masters of Palaeobiology student Eddy Strickson, has presented clear evidence about how plant-eating dinosaurs evolved.
In the rich dinosaur deposits of North America, hundreds of skeletons of plant-eaters are found for every T. rex. But how did they survive and proliferate? Was it down to innovation or stimulus by plant evolution?
Eddy Strickson said: “The plant-eating ornithopods showed four evolutionary bursts; one in the middle of the Jurassic, and the other three in a cluster around 80 million years ago in the Late Cretaceous. This was down to innovation in their jaws and improved efficiency.”
Plants were evolving fast during the Mesozoic, with the rise of cycads, conifers, and especially the angiosperms or flowering plants in the Cretaceous. However, the evolution of ornithopod dinosaur jaws and teeth did not show any response to these changes in availability of plants.
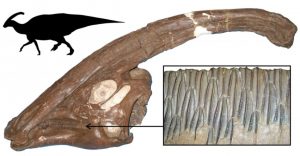
Dr Albert Prieto-Marquez, Research Associate in the School of Earth Sciences who co-led the research, said: “Some of the immensely successful duck-billed hadrosaurs of the Late Cretaceous might have been eating flowering plants, but their tooth wear patterns, and especially close study of their coprolites — that’s fossil poops — shows they were conifer specialists, designed to crush and digest the oily, tough needles and cones.”
Dr Tom Stubbs, another co-leader and Research Associate in Palaeobiology in the School of Earth Sciences: “Our work has been done using new methods of evolutionary analysis. Up to now, many evolutionary studies of this kind have been quite circumstantial, but we have been able to identify times of intensive evolution using objective, numerical methods.”
Over 150 million years, many hundreds of dinosaurs came and went, but in the end they all died out 66 million years ago. The new work helps confirm another recently published, and controversial, claim that most dinosaurs were already in decline 40 million years before the meteorite struck and finished them off.
Mike Benton, Professor of Vertebrate Palaeontology in the School of Earth Sciences, explained: “In other numerical work, we had found that nearly all dinosaurs showed a downturn about 100 million years ago, but the exceptions were two herbivore groups, the crested hadrosaurs and the horned ceratopsians. This study of dentition now confirms that hadrosaurs were bucking the overall downturn.”
The research is published today in Scientific Reports.
Reference:
Edward Strickson, Albert Prieto-Márquez, Michael J. Benton, Thomas L. Stubbs. Dynamics of dental evolution in ornithopod dinosaurs. Scientific Reports, 2016; 6: 28904 DOI: 10.1038/srep28904
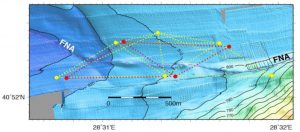
Layout of the network of acoustic transponders (French in red, German in yellow) in the Sea of Marmara, on either side of the submarine segment of the North Anatolian fault (NAF), whose assumed trace is shown by the dashed line. Credit: J-Y Royer / CNRS-UBO LDO
To monitor a segment of the North Anatolian seismic fault near Istanbul, an international team of researchers, in particular from CNRS and Université de Bretagne Occidentale, has installed a network of transponders on the floor of the Sea of Marmara. The aim is to measure motion of the sea floor on either side of this segment. The data collected during the first six months reveals that the fault is probably locked in the region of this segment, suggesting that there is a progressive build-up of energy that could be released suddenly. This could cause a major earthquake in the Istanbul area.
The study, carried out by a collaboration of researchers from France, Germany and Turkey, is published in Geophysical Research Letters.
The North Anatolian fault, which caused destructive earthquakes in Turkey in 1999, is comparable to the San Andreas fault in California. It marks the boundary between the Eurasian and Anatolian tectonic plates, which move relative to each other at a speed of around 2 cm per year. The behavior of one underwater segment of the fault, located a few tens of kilometers from Istanbul in the Sea of Marmara, particularly intrigues researchers, since there has apparently been no seismic activity there since the eighteenth century. How does this segment behave? Does it continuously creep? Does it regularly give way, occasionally causing small, low-magnitude quakes? Or is it locked, making it likely that it will one day rupture and cause a major earthquake?
Observing the motion of a submarine fault in situ over a period of several years is no easy matter. To meet this challenge, the researchers are testing an innovative underwater remote sensing method, using active, autonomous acoustic transponders remotely accessible from the sea surface. Placed on the sea floor on either side of the fault at a depth of 800 meters, the transponders take it in turns to interrogate each other in pairs, and measure the round-trip time of an acoustic signal between them.
These time lapses are then converted into distances between the transponders. The variation in these distances over time is used to detect motion of the sea floor and any deformation of the network of transponders, and thus infer the displacement of the fault. Specifically, a network of ten French and German transponders was set up during an initial sea cruise1 in October 2014. The first six months of data (travel time, temperature, pressure and stability)2 have confirmed that the system is performing well. Following calculations, the data show no significant motion of the monitored fault, within the network’s resolution limits. The distances between the transponders, which are between 350 and 1700 meters apart, are measured with a resolution of 1.5 to 2.5 mm. The segment is therefore probably locked or nearly locked, and is accumulating stress that could trigger an earthquake. However, it will be necessary to acquire data for several years in order to confirm this observation or show that this part of the fault has a more complex behavior.
Going beyond this specific demonstration, if this approach, known as acoustic seafloor geodesy, proves to be robust in the long term (in this case, three to five years are planned, within the limits of the autonomy of the batteries), it could be included within a permanent underwater observatory as an addition to other observations (seismology, gas bubble emission, etc) for in situ real-time monitoring of the activity of this particular fault, or of other active submarine faults elsewhere in the world.
The work was carried out by the Laboratoire Domaines Océaniques3 (LDO, CNRS/Université de Bretagne Occidentale), in collaboration with the Laboratoire Littoral Environnement et Sociétés (CNRS/Université de La Rochelle), GEOMAR (Kiel, Germany), Centre Européen de Recherche et d’Enseignement de Géosciences de l’Environnement (CNRS/Collège de France/AMU/IRD), the IFREMER’s Laboratoire Géosciences Marines, the Eurasian Institute of Earth Sciences at the Istanbul Technical University (Turkey), and the Kandilli Observatory and Earthquake Research Institute at Bogazici University, Istanbul. This paper is dedicated to the memory of the Principal Investigator of the project, Anne Deschamps, CNRS researcher at LDO, who passed away shortly after leading the successful deployment of the acoustic transponders.
Reference:
P. Sakic, H. Piété, V. Ballu, J.-Y. Royer, H. Kopp, D. Lange, F. Petersen, M. S. Özeren, S. Ergintav, L. Geli, P. Henry, A. Deschamps. No significant steady state surface creep along the North Anatolian Fault offshore Istanbul: Results of 6 months of seafloor acoustic ranging. Geophysical Research Letters, 2016; DOI: 10.1002/2016GL069600
Scientists still aren’t sure why T. rex had those absurdly small forelimbs, but apparently the look was all the rage in the Late Cretaceous. A newly-discovered dinosaur from Patagonia has similar short, two-fingered claws, even though it’s not closely related to the tyrannosaurs. Like Tyrannosaurus rex, the new Gualicho shinyae is a theropod, one of the two-legged, bird-like dinosaurs, but it’s on a different branch of the family tree, meaning that the unusual limbs evolved independently rather than arising from a common short-armed ancestor.
“Gualicho is kind of a mosaic dinosaur, it has features that you normally see in different kinds of theropods,” says corresponding author Peter Makovicky, The Field Museum’s Curator of Dinosaurs, who helped describe the new species in PLOS ONE. “It’s really unusual—it’s different from the other carnivorous dinosaurs found in the same rock formation, and it doesn’t fit neatly into any category.”
Gualicho is an allosaurid, a branch of medium-to-large carnivorous theropod dinosaurs. The skeleton discovered is incomplete, but scientists estimate that it was a medium-sized predator weighing around a thousand pounds, comparable to a polar bear. It’s very different from the other dinosaurs that lived near it; if anything, it looks most like Deltadromeus, a leggy, carnivorous dinosaur with slender arms found in Africa, which it appears to be closely related to.
Despite its large size, Gualicho’s forelimbs were the size of a human child’s, and like T. rex, it had just two digits (thumb and forefinger). While Gualicho doesn’t explain why so many theropods had reduced forelimbs, it adds to evidence that the trait evolved independently numerous times. “By learning more about how reduced forelimbs evolved, we may be able to figure out why they evolved,” explained Makovicky.
The dinosaur’s name hints at the story of its discovery during a joint expedition led by the authors in 2007 to the fossil-rich Huincul Formation of northern Patagonia. The species name shinyae honors the discoverer, Akiko Shinya, while the generic name Gualicho derives from Gualichu, a spirit revered by Patagonia’s Tehuelche people. The team joked about the “curse of Gualichu” when hit with bad luck during the expedition, like when they rolled a truck (everyone was okay, except for some cuts and bruises).
Akiko Shinya, The Field Museum’s chief fossil preparator for whom the new dinosaur is named, explains, “We found Gualicho at the very end of the expedition. Pete joked, ‘It’s the last day, you’d better find something good!’ And then I almost immediately was like, ‘Pete, I found something.’ I could tell right away that it was good.”
The paper describing the new species was published in PLOS ONE, and was contributed to by authors at the Universidad Maimónides in Argentina, the Dinosaur Institute at the Natural History Museum of Los Angeles County, and the Gobierno de la Provincia de Río Negro in Argentina.
1.5-million-year-old footprint shows that Homo erectus’ foot anatomies and mechanics were similar to ours. Credit: Kevin Hatala
Fossil bones and stone tools can tell us a lot about human evolution, but certain dynamic behaviours of our fossil ancestors — things like how they moved and how individuals interacted with one another — are incredibly difficult to deduce from these traditional forms of paleoanthropological data.
Researchers from the Max Planck Institute for Evolutionary Anthropology in Leipzig, along with an international team of collaborators, have recently discovered multiple assemblages of Homo erectus footprints in northern Kenya that provide unique opportunities to understand locomotor patterns and group structure through a form of data that directly records these dynamic behaviours. Using novel analytical techniques, they have demonstrated that these H. erectus footprints preserve evidence of a modern human style of walking and a group structure that is consistent with human-like social behaviours.
Habitual bipedal locomotion is a defining feature of modern humans compared with other primates, and the evolution of this behaviour in our clade would have had profound effects on the biologies of our fossil ancestors and relatives. However, there has been much debate over when and how a human-like bipedal gait first emerged in the hominin clade, largely because of disagreements over how to indirectly infer biomechanics from skeletal morphologies. Likewise, certain aspects of group structure and social behaviour distinguish humans from other primates and almost certainly emerged through major evolutionary events, yet there has been no consensus on how to detect aspects of group behaviour in the fossil or archaeological records.
In 2009, a set of 1.5-million-year-old hominin footprints was discovered at a site near the town of Ileret, Kenya. Continued work in this region by scientists from the Max Planck Institute for Evolutionary Anthropology, and an international team of collaborators, has revealed a hominin trace fossil discovery of unprecedented scale for this time period — five distinct sites that preserve a total of 97 tracks created by at least 20 different presumed Homo erectus individuals. Using an experimental approach, the researchers have found that the shapes of these footprints are indistinguishable from those of modern habitually barefoot people, most likely reflecting similar foot anatomies and similar foot mechanics. “Our analyses of these footprints provide some of the only direct evidence to support the common assumption that at least one of our fossil relatives at 1.5 million years ago walked in much the same way as we do today,” says Kevin Hatala, of the Max Planck Institute for Evolutionary Anthropology and The George Washington University.
Based on experimentally derived estimates of body mass from the Ileret hominin tracks, the researchers have also inferred the sexes of the multiple individuals who walked across footprint surfaces and, for the two most expansive excavated surfaces, developed hypotheses regarding the structure of these H. erectus groups. At each of these sites there is evidence of several adult males, implying some level of tolerance and possibly cooperation between them. Cooperation between males underlies many of the social behaviours that distinguish modern humans from other primates. “It isn’t shocking that we find evidence of mutual tolerance and perhaps cooperation between males in a hominin that lived 1.5 million years ago, especially Homo erectus, but this is our first chance to see what appears to be a direct glimpse of this behavioural dynamic in deep time,” says Hatala.
Reference:
Kevin G. Hatala, Neil T. Roach, Kelly R. Ostrofsky, Roshna E. Wunderlich, Heather L. Dingwall, Brian A. Villmoare, David J. Green, John W. K. Harris, David R. Braun, Brian G. Richmond. Footprints reveal direct evidence of group behavior and locomotion in Homo erectus. Scientific Reports, 2016; 6: 28766 DOI: 10.1038/srep28766
This tiny insect, similar to a “walking stick,” abandoned the mushroom it had probably been nibbling on and left its exoskeleton, or skin behind about 50 million years ago to avoid being entombed in this amber fossil. Credit: George Poinar, Jr., courtesy of Oregon State University
Thousands of insects, plants and other life forms have been found trapped in ancient amber deposits, but a new discovery shows a rarity of a different type – the one that got away.
In a piece of Baltic amber about 50 million years old, research has uncovered an exoskeleton similar to that of a modern-day “walking stick” – evidence of an insect that literally was frightened out of its skin, and made its way to freedom just as it was about to become forever entombed by oozing tree sap.
The unusual piece also reveals the first mushroom that’s ever been found in Baltic amber, along with a mammalian hair that was left behind. In its entirety, the amber piece offers a little docudrama of life, fear and hasty escape in the ecology of an ancient subtropical forest.
The findings were just published in Fungal Biology by George Poinar, Jr., a researcher in in the College of Science at Oregon State University and an international expert in ancient life forms found in amber.
“From what we can see in this fossil, a tiny mushroom was bitten off, probably by a rodent, at the base of a tree,” Poinar said. “An insect, similar to a walking stick, was probably also trying to feed on the mushroom. It appears to have immediately jumped out of its skin and escaped, just as tree sap flowed over the remaining exoskeleton and a hair left behind by the fleeing rodent.”
Plants, insects and other material found in amber deposits, Poinar said, always offer details about ancient ecosystems. But on rare occasions such as this, they also show the interactions and ecology between different life forms. They are invaluable in helping scientists to reconstruct the nature of ecosystems in the distant past.
In this case, the amber came from near the Baltic Sea in what’s now Germany, Poland, Russia and Scandinavia. It was formed, beginning as a viscous tree sap, in a large subtropical coniferous forest across much of northern Europe that lasted about 10 million years.
In a climate much warmer than exists there today, the early angiosperms, or flowering plants, were starting to displace the gymnosperms, or cone-bearing evergreens that had previously been dominant. Dinosaurs had gone extinct a few million years before, and mammals were beginning to diversify.
“The tiny insect in this fossil was a phasmid, one of the kinds of insects that uses its shape to resemble sticks or leaves as a type of camouflage,” Poinar said.
“It would have shed its skin repeatedly before reaching adulthood, in a short lifespan of a couple months. In this case, the ability to quickly get out of its skin, along with being smart enough to see a problem coming, saved its life.”
The exoskeleton seen in the amber is extremely fresh and shows filaments that would have disappeared if it had been shed very long before being covered by amber, Poinar said.
This particular insect species is now extinct, as is the mushroom in the fossil, Poinar said. Although mushrooms have been found in fossils from other regions of the world, this is the first specimen to be identified in Baltic amber, and represents both a new genus and species.
The Baltic amber deposits are the largest in the world, have been famous for thousands of years and continue to be mined today. Amber from the mines were traded by Roman caravans, later taken over by Teutonic knights and are known around the world for the huge volume of semi-precious stones they produce.
Reference:
George Poinar, A gilled mushroom, Gerontomyces lepidotus gen. et sp. nov. (Basidiomycota: Agaricales), in Baltic amber, Fungal Biology (2016). DOI: 10.1016/j.funbio.2016.06.008
Bangladesh, Myanmar and eastern India (all near top) are bisected by an extension of the tectonic boundary that ruptured under the Indian Ocean in 2004, killing some 230,000 people. Known quakes along the boundary’s southern end are shown in different colors; the black sections nearer the top have not ruptured in historic times, but new research suggests they could. Credit: Michael Steckler/Lamont-Doherty Earth Observatory
A huge earthquake may be building beneath Bangladesh, the most densely populated nation on earth. Scientists say they have new evidence of increasing strain there, where two tectonic plates underlie the world’s largest river delta. They estimate that at least 140 million people in the region could be affected if the boundary ruptures; the destruction could come not only from the direct results of shaking, but changes in the courses of great rivers, and in the level of land already perilously close to sea level.
The newly identified threat is a subduction zone, where one section of earth’s crust, or a tectonic plate, is slowly thrusting under another. All of earth’s biggest known earthquakes occur along such zones; these include the Indian Ocean quake and tsunami that killed some 230,000 people in 2004, and the 2011 Tohoku quake and tsunami off Japan, which swept away more than 20,000 and caused the Fukushima nuclear disaster. Up to now, all known such zones were only under the ocean; this one appears to be entirely under the land, which greatly multiplies the threat. The findings appear in this week’s issue of Nature Geoscience.
Subduction-zone quakes generally occur where plates of heavy ocean crust slowly dive offshore beneath the lighter rocks of adjoining continents, or under other parts of the seafloor. Sometimes sections get stuck against each other over years or centuries, and then finally slip, moving the earth. Scientists knew of the plate boundary in and around Bangladesh, but many assumed it to be sliding only horizontally near the surface, where it sometimes causes fairly large, but less damaging earthquakes in areas that are not as densely populated. However, the authors of the new research say movements on the surface over the past decade show that subduction is taking place below, and that part of the plate juncture is locked and loading up with stress. They are not forecasting an imminent great earthquake, but say it is an “underappreciated hazard.”
“Some of us have long suspected this hazard, but we didn’t have the data and a model,” said lead author Michael Steckler, a geophysicist at Columbia University’s Lamont-Doherty Earth Observatory. “Now we have the data and a model, and we can estimate the size.” He said strain between the plates has been building for at least 400 years — the span of reliable historical records, which lack reports of any mega-quake. When an inevitable release comes, the shaking is likely to be larger than 8.2, and could reach a magnitude of 9, similar to the largest known modern quakes, said Steckler. “We don’t know how long it will take to build up steam, because we don’t know how long it was since the last one,” he said. We can’t say it’s imminent or another 500 years. But we can definitely see it building.”
The newly identified zone is an extension of the same tectonic boundary that caused the 2004 Indian Ocean undersea quake, some 1,300 miles south. As the boundary reaches southeast Asia, the complexity of the motions along it multiply, and scientists do not completely understand all of them. But basically, they say, a giant plate comprising India and much of the Indian Ocean has been thrusting northeasterly into Asia for tens of millions of years. This collision has caused the Himalayas to rise to the north, bringing events like the 2015 Nepal quake that killed 8,000 people. Bangladesh, India’s neighbor, lies on the far eastern edge of this plate, but pressure from the collision seems to be warping Asia clockwise around the top of Bangladesh, ending up largely in the next country over, Myanmar. This wraparound arrangement has resulted in a crazy quilt of faults and quakes in and around Bangladesh. Among the largest, a 1762 subduction-zone quake near the southern coast killed at least 700 people. This January, a magnitude 6.7 event in adjoining eastern India killed more than 20. There have been dozens of large quakes in between, but the assumption was that no actual subduction was taking place under Bangladesh itself, seeming to insulate the region from a truly gigantic one. The new study undercuts this idea.
Starting in 2003, U.S. and Bangladeshi researchers set up about two dozen ground-positioning (GPS) instruments linked to satellites, capable of tracking tiny ground motions. Ten years of data now show that eastern Bangladesh and a bit of eastern India are pushing diagonally into western Myanmar at a rapid clip — 46 millimeters per year, or about 1.8 inches. Combined with existing GPS data from India and Myanmar, the measurements show that much of the resulting strain has been taken up by several known, slowly moving surface faults in Myanmar and India. But the rest of the movement — about 17 millimeters, or two-thirds of an inch per year — is shortening the distance from Myanmar to Bangladesh. This has been going on for a long time, and the results are clearly visible: neatly parallel north-south ranges of mountains draping the landscape, like a carpet being shoved against a wall. The researchers interpret the shortening pattern to mean that subduction is taking place below, and that a huge zone — about 250 kilometers by 250 kilometers, more than 24,000 square miles — is locked and building pressure, just a few miles below the surface. The zone includes Bangladesh’s densely packed capital of Dhaka, a megalopolis of more than 15 million.
Steckler says that, assuming fairly steady motion over the last 400 years, enough strain has built for the zone to jump horizontally by about 5.5 meters, or 18 feet, if the stress is released all at once. If strain has been building longer, it could be up to 30 meters, or almost 100 feet. The land would also move vertically, to a lesser extent. This is the worst-case scenario; in the best case, only part would slip, and the quake would be smaller and farther from Dhaka, said Steckler.
In any case, Bangladesh and eastern India sit atop a landscape vulnerable even to moderate earthquakes: the vast delta of the Ganges and Brahmaputra rivers. This is basically a pile of mud as deep as 12 miles, washed from the Himalayas to the coast, covering the subduction zone. In a quake, this low-lying substrate would magnify the shaking like gelatin, and liquefy in many places, sucking in buildings, roads and people, said study coauthor Syed Humayun Akhter, a geologist at Dhaka University. The great rivers — 10 miles across in places — could jump their banks and switch course, drowning everything in the way; there is in fact evidence that such switches have happened in previous centuries.
Akhter says that fast-growing, poor Bangladesh is unprepared; no building codes existed before 1993, and even now, shoddy new construction flouts regulations. Past quake damages and deaths are no indicator of what could happen now, he said; population and infrastructure have grown so fast that even fairly moderate events like those of past centuries could be mega-disasters. “Bangladesh is overpopulated everywhere,” he said. “All the natural gas fields, heavy industries and electric power plants are located close to potential earthquakes, and they are likely to be destroyed. In Dhaka, the catastrophic picture will be beyond our imagination, and could even lead to abandonment of the city.”
Roger Bilham, a geophysicist at the University of Colorado who has studied the region but was not involved in the new paper, said its “data are unassailable, the interpretation is sound.” Bilham said the research “ties an enormous amount of structural interaction together. We have seen in recent history only modest seismicity responding to those interactions. The Indian subcontinent is effectively being pushed into a tight corner.”
Susan Hough, a U.S. Geological Survey seismologist who also studies the region and was not involved in the study, said that in recent years, “we’ve been surprised by big earthquakes that have not been witnessed during historical times, or witnessed so long ago, they were forgotten. Studies like this are critical for identifying those zones.”
Scientists in Bangladesh and neighboring countries continue to assess the hazards. James Ni, a seismologist at New Mexico State University, said he and colleagues hope to deploy 70 seismometers across Myanmar in 2017, to get a better image of the apparently subducting slab. “We don’t have a good idea of its geometry, we don’t know how far it goes down,” said Ni. He said that if the study authors are right, and the slab is building strain, a quake would probably turn urban areas in eastern India “into ruins,” and effects likely would extend into Myanmar and beyond. “We need more data,” he said.
The other authors of the study are Dhiman Ranjan Mondal of the City University of New York; Leonardo Seeber, Jonathan Gale and Michael Howe of Lamont-Doherty Earth Observatory; and Lujia Feng and Emma Hill of Singapore’s Nanyang Technological University. The research was supported by the U.S. National Science Foundation.
Video
Reference:
Michael S. Steckler, Dhiman Ranjan Mondal, Syed Humayun Akhter, Leonardo Seeber, Lujia Feng, Jonathan Gale, Emma M. Hill & Michael Howe. Locked and loading megathrust linked to active subduction beneath the Indo-Burman Ranges. Nature Geoscience, 2016; DOI: 10.1038/ngeo2760