Home Blog Page 162

What dinosaurs’ colour patterns say about their habitat

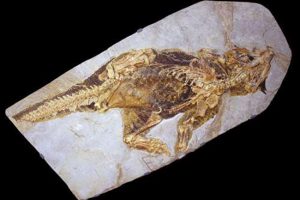
Psittacosaurus, early Cretaceous (120 million years old), preserving skin with colour patterns, Senckenberg Museum, Frankfurt, Germany. Credit: Jakob Vinther and Robert Nicholls
Psittacosaurus, early Cretaceous (120 million years old), preserving skin with colour patterns, Senckenberg Museum, Frankfurt, Germany.
Credit: Jakob Vinther and Robert Nicholls

After reconstructing the colour patterns of a well-preserved dinosaur from China, researchers from the University of Bristol have found that the long-lost species Psittacosaurus (meaning “parrot lizard”, a reference to its parrot-like beak) was light on its underside and darker on top.

This colour pattern, known as countershading, is a common form of camouflage in modern animals.

The study published today in Current Biology led the researchers to conclude that Psittacosaurus most likely lived in an environment with diffuse light, such as in a forest, and has produced the most life-like reconstruction of a dinosaur ever created.

Dr Jakob Vinther from the Schools of Earth Sciences and Biological Sciences, said: “The fossil, which is on public display at the Senckenberg Museum of Natural History in Germany, preserves clear countershading, which has been shown to function by counter-illuminating shadows on a body, thus making an animal appear optically flat to the eye of the beholder.”

Behavioural ecologist Professor Innes Cuthill from the School of Biological Sciences, added: “By reconstructing a life-size 3D model, we were able to not only see how the patterns of shading changed over the body, but also that it matched the sort of camouflage which would work best in a forested environment.”

Countershading most likely served to protect Psittacosaurus – an early relative of the triceratop – against predators that use patterns of shadow on an object to determine shape, just as humans do.

Dr Vinther realised that structures previously thought to be artifacts or dead bacteria in fossilized feathers were actually “melanosomes”, small structures that carry melanin pigments found in the feathers and skin of many animals.

In some well-preserved specimens, such as the Psittacosaurus the researchers worked on in the new study, it’s possible to make out the patterns of preserved melanin without the aid of a microscope.

Professor Innes and colleagues at Bristol had also been exploring the distribution of countershading in modern animals. But it was no easy matter to apply the same principles to an extinct animal that had been crushed flat and fossilized.

To explore this idea further they teamed up with local palaeoartist, Bob Nicholls in order to reconstruct the remarkable fossil in to a physical model which, they say, is the most scientifically accurate life-size model of a dinosaur with its real color patterns.

Days of careful studies of the fossil, taking measurements of the bones, studying the preserved scales and the pigment patterns, with input on muscle structure from Bristol palaeontologists Professor Emily Rayfield and Dr Stephan Lautenschlager, led to months of careful modelling of the dinosaur.

Bob Nicholls said: “Our Psittacosaurus was reconstructed from the inside-out. There are thousands of scales, all different shapes and sizes, and many of them are only partially pigmented.  It was a painstaking process but we now have the best suggestion as to what this dinosaur really looked like.”

In order to investigate what environment the psittacosaur had evolved to live in, Dr Vinther, Bob Nicholls and Professor Cuthill took another cast of the model and painted it all grey.

They then placed it in the Cretaceous plant section of Bristol Botanic Garden and photographed it under an open sky and underneath trees to see how the shadow was cast under those conditions.

By comparing the shadow to the pattern in the fossil they could then predict what environment the psittacosaur lived in.

Dr Vinther said: “We predicted that the psittacosaur must have lived in a forest. This demonstrates that fossil colour patterns can provide not only a better picture of what extinct animals looked like, but they can also give new clues about extinct ecologies and habitats.

“We were amazed to see how well these color patterns actually worked to camouflage this little dinosaur.”

Psittacosaurus, which Professor Cuthill describes as “both weird and cute, with horns on either side of its head and long bristles on its tail” lived in the early Cretaceous of China and has been found in the same rock strata where many feathered dinosaurs have been found.

Those deposits also include evidence for a forest environment based on plant and wood fossils.

The researchers say that they’d now like to explore other types of camouflage in fossils and to use this evidence in understanding how predators could perceive the environment and to understand their role in shaping evolution and biodiversity.

Reference:
Vinther, J., Nicholls, R., Lautenschlager, S., Pittman, M., Kaye, T. G., Rayfield, E., Mayr, G. and Cuthill, I. C. 2016. 3D Camouflage in an Ornithischian Dinosaur. Current Biology. DOI: 10.1016/j.cub.2016.06.065

Note: The above post is reprinted from materials provided by University of Bristol.
Study Finds Earthquakes Can Trigger Near-Instantaneous Aftershocks on Different Faults

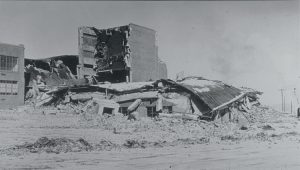
A photograph of damage to Helena High School, which collapsed following a major aftershock from the 1935 magnitude 6.2 earthquake near Helena, Montana. Credit: NOAA National Geophysical Data Center

According to a new study by scientists at Scripps Institution of Oceanography at the University of California San Diego, a large earthquake on one fault can trigger large aftershocks on separate faults within just a few minutes. These findings have important implications for earthquake hazard prone regions like California where ruptures on complex fault systems may cascade and lead to mega-earthquakes.

In the study, published in the Sept. 9 issue of the journal Science, Scripps geophysicist Peter Shearer and Scripps graduate student Wenyuan Fan discovered 48 previously unidentified large aftershocks from 2004 to 2015 that occurred within seconds to minutes after magnitude 7 to 8 earthquakes on faults adjacent to the mainshock ruptures.

In one instance along the Sundra arc subduction zone, where the magnitude 9 Sumatra-Andaman mega-earthquake occurred off the coast of Indonesia in 2004, a magnitude 7 quake triggered two large aftershocks over 200 kilometers (124 miles) away. These aftershocks miles away reveal that stress can be transferred almost instantaneously by the passing seismic waves from one fault to another within the earthquake fault system.

“The results are particularly important because of their seismic hazard implications for complex fault systems, like California,” said Fan, the lead author of the study. “By studying this type of triggering, we might be able to forecast hosting faults for large earthquakes.”

Large earthquakes often cause aftershock sequences that can last for months. Scientists generally believe that most aftershocks are triggered by stress changes caused by the permanent movement of the fault during the main seismic event, and mainly occur near the mainshock rupture where these stress changes are largest. The new findings show that large early aftershocks can also be triggered by seismic wave transients, where the locations of the main quake and the aftershock may not be directly connected.

“Multiple fault system interactions are not fully considered in seismic hazard analyses, and this study might motivate future modeling efforts to account for these effects,” said Shearer, the senior author of the study.

The National Science Foundation funded the study.

Note: The above post is reprinted from materials provided by University of California, San Diego.

Pacific Ocean’s response to greenhouse gases could extend California drought for centuries

UCLA professor Glen MacDonald studies sediment samples, like the one shown here from an unrelated study, looking for clues about prehistoric climate conditions. Credit: John Vande Wege/UCLA
UCLA professor Glen MacDonald studies sediment samples, like the one shown here from an unrelated study, looking for clues about prehistoric climate conditions.
Credit: John Vande Wege/UCLA

Clues from prehistoric droughts and arid periods in California show that today’s increasing greenhouse gas levels could lock the state into drought for centuries, according to a study led by UCLA professor Glen MacDonald.

The study, published today in the Nature journal Scientific Reports, looked at how natural climatic forces contributed to centuries-long and even millennia-long periods of dryness in California during the past 10,000 years. These phenomena — sun spots, a slightly different earth orbit, a decrease in volcanic activity — intermittently warmed the region through a process called radiative forcing, and recently have been joined by a new force: greenhouse gases.

As long as warming forces like greenhouse gases are present, the resulting radiative forcing can extend drought-like conditions more or less indefinitely, said MacDonald, a distinguished professor of geography and of ecology and evolutionary biology.

“Radiative forcing in the past appears to have had catastrophic effects in extending droughts,” said MacDonald, an international authority on drought and climate change. “When you have arid periods that persist for 60 years, as we did in the 12th century, or for millennia, as we did from 6,000 to 1,000 B.C., that’s not really a ‘drought.’ That aridity is the new normal.”

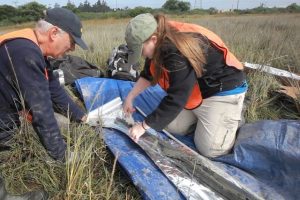
Researchers tracked California’s historic and prehistoric climate and water conditions by taking a sediment core in the Sierra Nevada mountains. They pulled a 2-inch-wide, 10-foot-deep cylinder of sediment from the bottom of Kirman Lake and analyzed it in third-of-an-inch sections, creating the most detailed and continuous paleoenvironmental record of California.

The team correlated their findings with other studies of California climate history, and for the first time, united all the studies and cross-referenced them with histories of the Pacific Ocean’s temperature taken from marine sediment cores and other sources.

What they found was not only that periods of increased radiative forcing could produce drought-like conditions that extended indefinitely, but that these conditions were closely tied to prolonged changes in Pacific Ocean surface temperatures.

Changes in ocean temperatures are linked to El Niño and La Niña conditions, which increase and decrease precipitation in California. Until now, no one had the long, detailed record of California’s dry periods needed to show that that aridity went hand-in-hand with changes in the prehistoric climate records of the Pacific Ocean, MacDonald said.

“Climate models today have a challenging time predicting what will happen with Pacific sea-surface temperatures in the face of climate change, and we hope that our research can improve that,” he added.

The researchers chose Kirman Lake in central-eastern California for its sensitivity to climate changes and its stable geologic history. Today, it’s a small, freshwater lake full of trout and about 16 feet deep, with a small marsh at one edge.

The team found evidence though that through the millennia Kirman Lake has grown more and less salty, dried until it was exclusively marshland and refilled again. All the while, sediment accumulated on the lake’s bottom, forming a record of lake conditions, the changing climate and the surrounding environment.

The research team spent years analyzing the core sample, which revealed California’s history layer by layer:

  • charcoal deposits indicate when wildfires were more prevalent.
  • layers of fossilized pollen shows eras of more pine trees or drier sagebrush.
  • shells from mollusks indicate times of deeper water.
  • single-celled algae and molecules of carbon and nitrogen give clues to the lake’s depth and
  • salinity, and the abundance or waning of plant and animal life.

From 6,000 to 1,000 B.C., during a time geologists refer to as the mid-Holocene, the core sample captures a 5,000-year dry period in California that has been seen in less detail through other paleoenvironmental records. This arid period is linked to a slight variation in Earth’s orbit that increased the amount of solar energy received by the Northern Hemisphere in the summer months. California was warm and dry, while marine sediment records show the Pacific was in a La Niña-like state, likely reducing precipitation.

A similar dry period was seen from about 950 to 1250 B.C., a time known as the medieval climate anomaly. Increased radiative forcing and warming at this time is connected to decreased volcanic activity and increased sunspots. Again, La Niña appears to have reigned in the Pacific Ocean.

“We suspected we would see the millennia of aridity during the mid-Holocene at Kirman Lake, but we were surprised to see a very clear record of the medieval climate anomaly as well,” MacDonald said. “It was very cool to see the lake was sensitive on the scale of not just thousands of years, but also something that lasted just a few centuries.”

Even more exciting to the researchers was a brief shift in the record toward moister conditions around 2,200 B.C. In the middle of thousands of years of mid-Holocene dryness, Kirman Lake suddenly became moister again, MacDonald said, while simultaneously the Pacific Ocean record switched to more El Niño-like conditions.

“This change at 2,200 B.C. was a global phenomenon,” MacDonald said. “It’s associated with the collapse of the Old Kingdom in Egypt. It’s linked to the decline of the Akkadian Empire in Mesopotamia and similar Bronze Age societal disruptions in India and China. It was amazing to find evidence of it in our own backyard.”

That blip in the record was a reminder that El Niño and La Niña weather patterns have global repercussions. It also confirmed the accuracy and sensitivity of Kirman Lake’s record, and the strong link between the ocean and California’s weather.

All this has consequences for California, the researchers said. Drought-like conditions can last indefinitely as long as increased warming, or radiative forcing, is present. And greenhouse gases are currently expected to increase.

“In a century or so, we might see a retreat of forest lands, and an expansion of sagebrush, grasslands and deserts,” MacDonald said. “We would expect temperatures to get higher, and rainfall and snowfall would decrease. Fire activity could increase, and lakes would get shallower, with some becoming marshy or drying up.”

California might remain an agricultural state, thanks to irrigation and engineering, though productivity might decrease and crops might change, said MacDonald, who emphasized that while the past is no guarantee of the future, in this case it does provide cause for concern.

“I think we would find a way to keep our cities going through prolonged drought, but we’re not going to engineer a way to conserve or preserve the ecosystems of the state,” MacDonald said. “We can’t save our huge expanses of oak woodlands, or our pine and fir forests, or high-elevation alpine ecosystems with irrigation projects like we might our orchards and gardens. I worry that we will see very different wildlands by the end of this century.”

Reference:
Glen M. MacDonald, Katrina A. Moser, Amy M. Bloom, Aaron P. Potito, David F. Porinchu, James R. Holmquist, Julia Hughes, Konstantine V. Kremenetski. Prolonged California aridity linked to climate warming and Pacific sea surface temperature. Scientific Reports, 2016; 6: 33325 DOI: 10.1038/srep33325

Note: The above post is reprinted from materials provided by UCLA. The original item was written by Alison Hewitt.

Taking a fault’s temperature

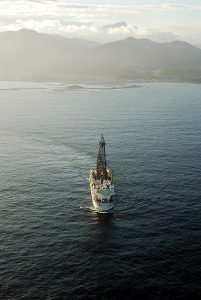
After the March 2011 Mw 9.0 Tohoku-oki Earthquake, the Deep-sea Drilling Vessel (D/V) Chikyu, seen here off-shore Japan, installed a sub-seafloor temperature observatory through the plate boundary fault as part of the Integrated Ocean Drilling Programs' Japan Trench Fast Drilling Project. Fulton and Brodsky present analysis of the observatory data to reveal signals interpreted to be the thermal signature of pulses of water squirting out of fractures in response to aftershocks on neighboring faults. The observation of interactions between faults during the aftermath of a major earthquake helps scientists gain a better understanding of the processes that control earthquake occurrence. See the open-access article, "In situ observations of earthquake-driven fluid pulses within the Japan Trench plate boundary fault zone," by Fulton and Brodsky. Click on the image for a larger version. Photo Credit: JAMSTEC/IODP.
After the March 2011 Mw 9.0 Tohoku-oki Earthquake, the Deep-sea Drilling Vessel (D/V) Chikyu, seen here off-shore Japan, installed a sub-seafloor temperature observatory through the plate boundary fault as part of the Integrated Ocean Drilling Programs’ Japan Trench Fast Drilling Project. Fulton and Brodsky present analysis of the observatory data to reveal signals interpreted to be the thermal signature of pulses of water squirting out of fractures in response to aftershocks on neighboring faults. The observation of interactions between faults during the aftermath of a major earthquake helps scientists gain a better understanding of the processes that control earthquake occurrence. See the open-access article, “In situ observations of earthquake-driven fluid pulses within the Japan Trench plate boundary fault zone,” by Fulton and Brodsky. Click on the image for a larger version. Photo Credit: JAMSTEC/IODP.

Ever think about taking a fault’s temperature? What would you learn? A unique experiment where temperature was continuously measured for nearly a year inside the fault that made the catastrophic 2011 magnitude 9.0 Japan Earthquake reveals the thermal signature of pulses of water squirting out of fractures in response to other earthquakes on neighboring faults.

The experiment required measurements more than 7 km (4.5 miles) beneath the sea surface in a borehole observatory stretching nearly a kilometer (more than a half mile) underground as part of the Integrated Ocean Drilling Program’s Japan Trench Fast Drilling Project.

The results illustrate how water pressure within fault zones, which influences the susceptibility of faults to slip, can be disturbed by earthquakes on other faults. The observation of interactions between faults during the aftermath of a major earthquake helps scientists gain a better understanding of the processes that control earthquake occurrence.

The research, supported by a grant from the Gordon and Betty Moore Foundation, was conducted by researchers from Texas A&M University and the University of California Santa Cruz.

Reference:
Patrick M. Fulton, Emily E. Brodsky. In situobservations of earthquake-driven fluid pulses within the Japan Trench plate boundary fault zone. Geology, 2016; G38034.1 DOI: 10.1130/G38034.1

Note: The above post is reprinted from materials provided by Geological Society of America.

For 20 million years, the diversity of large terrestrial mammals depended on plant growth

Skull of an extinct cave bear, Ursus spelaeus, from the Pleistocene [locality unknown]. Credit: © Collection of Senckenberg Research Institute and Natural History Museum, Frankfurt, Germany (collection number SMF M 8047), photo: Sven Tränkner
Skull of an extinct cave bear, Ursus spelaeus, from the Pleistocene [locality unknown].
Credit: © Collection of Senckenberg Research Institute and Natural History Museum, Frankfurt, Germany (collection number SMF M 8047), photo: Sven Tränkner
For more than 20 million years, the ups and downs of diversity in terrestrial large mammals were determined by primary production, i.e. net production of plant biomass. This pattern changed with the onset of the ice ages. The reason for this is likely the beginning of human impact on nature, according to a team led by Dr. Susanne Fritz at Senckenberg. The findings were published recently in the scientific journal “Proceedings of the National Academy of Science.” Based on 14,000 fossils, the scientists reconstructed the diversity of terrestrial large mammals and compared it with data on the biomass production of plants during the same time period.

Whether used as food, fire wood or fodder for domestic animals – mankind would not be able to survive without plants, and we use them in manifold ways. But what impact does this use have on the evolution of mammals? The answer can be found in a recent study that correlates the biomass of plant resources with the diversity of large mammals, i.e., the number of genera of ungulates, carnivores, apes and elephants. “For 20 million years, from the early Neogene approximately 23 million years ago until the Pleistocene started around 2 million years ago, this rule applied: The larger the amount of biomass produced by plants, the higher the diversity of terrestrial mammals that evolved. And of course, the reverse is true as well: A decrease in biomass production was accompanied by a decrease in the number of different mammals,” explains the study’s lead author, Dr. Susanne Fritz of the Senckenberg Biodiversity and Climate Research Centre.

Fritz and her team are the first to confirm this correlation on such a large spatial and temporal scale – for North America as well as for Europe. The onset of the ice ages (Pleistocene) put an end to this, as since then the species diversity in North America and Europe is correlated to other environmental conditions. This is the exact point in time when humans appeared on the scene in these regions and presumably began to extract biomass from the nutrient cycle. But the abrupt change in pattern also concurred with another event: Large mammals such as mammoths, cave bears and Saiga antelopes underwent a mass extinction in the study areas. Whether humans or climatic changes were responsible for this remains a controversial question to date.

“The diversity of mammal species in Europe and North America today is much lower than in the past. For example, Europe now hosts a mere 51 species of large mammals in 27 genera; 10 million years ago, there were 130 to 200 genera. As documented by our study, humans at least contributed to the fact that the diversity of species and genera was never able to recover after the mass extinction. Today, only Africa and Asia still host any significant numbers of large mammal species,” says Dr. Christian Hof, also a scientist at Senckenberg and the study’s co-author. Nowadays, humans extract up to 30 percent of the biomass from the global nutrient cycle – and the trend is rising. However, it is difficult to ultimately evaluate what this means for the future of speciation in large mammals.

“The farther back we travel back in the past, the fewer traces we find of the animals that lived in those days, which makes it difficult to directly compare correlations between the rather extensive time period we examined and the situation today. However, it is clear that in the world dominated by humans certain ecological ‘rules,’ such as the correlation between large mammal diversity and plant biomass, no longer apply in the same way as they used to do for millions of years. The consequences of the ever increasing human impact are therefore unique in geological history and difficult to predict,” Fritz sums up.

For the study, the scientists evaluated more than 14,000 fossils from North America and Europe. These fossils represent over 1,600 different species of large mammals from approximately 1,500 sites. They cover the period between 23 and 1.8 million years ago. The results were subsequently compared with data on the primary production of plants from the same time period, which could be deduced from fossilized plant remains. In terms of temporal extent, this constitutes the largest set of data analyzed in this context to date.

The study is an international collaboration project of researchers from the Senckenberg Society for Nature Research (Senckenberg Gesellschaft für Naturforschung), the Goethe University Frankfurt, the University of Helsinki (FIN), Brown University and Stony Brook University (USA), the University of Bristol (UK) and Leipzig University. A constituent workshop for all project participants was held at the Synthesis Center (sDiv) of the German Centre for Integrative Biodiversity Research Halle-Jena-Leipzig.

Reference:
Susanne A. Fritz, Jussi T. Eronen, Jan Schnitzler, Christian Hof, Christine M. Janis, Andreas Mulch, Katrin Böhning-Gaese, Catherine H. Graham. Twenty-million-year relationship between mammalian diversity and primary productivity. Proceedings of the National Academy of Sciences, 2016; 201602145 DOI: 10.1073/pnas.1602145113

Note: The above post is reprinted from materials provided by Senckenberg Research Institute and Natural History Museum.

New discovery shatters previous beliefs about Earth’s origin

Scientists have now demonstrated that Earth and other planetary objects that formed in the early years of the Solar System share similar chemical origins -- a finding at odds with accepted wisdom held by scientists for decades. Credit: Image courtesy of Image courtesy of Western University
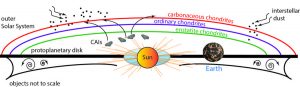
Scientists have now demonstrated that Earth and other planetary objects that formed in the early years of the Solar System share similar chemical origins — a finding at odds with accepted wisdom held by scientists for decades.
Credit: Image courtesy of Image courtesy of Western University

A new study led by Western University’s all-star cosmochemist Audrey Bouvier proves that the Earth and other planetary objects formed in the early years of the Solar System share similar chemical origins — a finding at odds with accepted wisdom held by scientists for decades.

The findings were published today by the journal Nature.

Bouvier, the Canada Research Chair (CRC) in Planetary Materials and an Isotope Cosmochemistry professor in Western’s Department of Earth Sciences, made the game-changing discovery in collaboration with Maud Boyet from the Magmas and Volcanoes Laboratory at Blaise Pascal University in Clermont-Ferrand, France.

With data uncovered through thermal ionization mass spectrometry, Bouvier and Boyet demonstrated that the Earth and other extraterrestrial objects share the same initial levels of Neodymium-142 (142Nd) — one of seven isotopes found in the chemical element neodymium — which is widely distributed in the Earth’s crust and most commonly used for magnets in commercial products like microphones and in-ear headphones.

In 2005, a small variation in 142Nd was detected between chondrites, which are stony meteorites considered essential building blocks of the Earth, and terrestrial rocks. These results were widely interpreted as an early differentiation of the interior of the Earth (including the crust and mantle) and these chondrites within the first 30 million years of its history.

These new results from Bouvier and Boyet show that these differences in 142Nd were in fact already present during the growth of Earth and not introduced later, as was previously believed.

“How the Earth was formed and what type of planetary materials were part of that formation are issues that have puzzled generations of scientists,” says Bouvier, Curator of the Western Meteorite Collection and also a principal investigator at Western’s Centre for Planetary Science and Exploration (CPSX). “And these new isotopic measurements of meteorites provide exciting answers to these questions about our origins and what made the Earth so special.”

By using vastly improved measurement techniques, Bouvier and Boyet deduced that different meteoritical objects found in the Solar System incorporated the elements neodymium (Nd) and samarium (Sm) but with slightly different isotopic compositions. These variations in stable isotopes also show that the Solar System was not uniform during its earliest times and that materials formed from previous generations of stars were incorporated in various proportions into the building blocks of planets.

This study was supported by the National Science Foundation, France-Canada Research Fund, the Natural Sciences and Engineering Research Council of Canada (NSERC) CRC and Discovery Grant programs, the Institute of Earth Sciences of the French National Center for Scientific Research (CNRS) and ClerVolc, the Clermont-Ferrand Centre for Volcano Research.

Reference:
A. Bouvier, M. Boyet. Primitive Solar System materials and Earth share a common initial 142Nd abundance. Nature, 2016; 537 (7620): 399 DOI: 10.1038/nature19351

Note: The above post is reprinted from materials provided by Western University.

Researchers identify oldest textile dyed indigo, reflecting scientific knowledge from 6,200 years ago

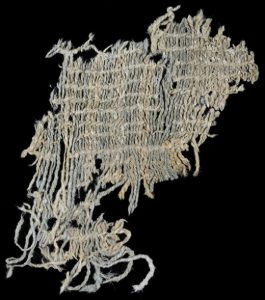
A George Washington University researcher has identified a 6,200-year-old indigo-blue fabric from Huaca, Peru, making it one of the oldest-known cotton textiles in the world and the oldest known textile decorated with indigo blue. Credit: Lauren Urana
A George Washington University researcher has identified a 6,200-year-old indigo-blue fabric from Huaca, Peru, making it one of the oldest-known cotton textiles in the world and the oldest known textile decorated with indigo blue.
Credit: Lauren Urana

A George Washington University researcher has identified a 6,200-year-old indigo-blue fabric from Huaca, Peru, making it one of the oldest-known cotton textiles in the world and the oldest known textile decorated with indigo blue.

The discovery marks the earliest use of indigo as a dye, a technically challenging color to produce. According to Jeffrey Splitstoser, lead author of a paper on the discovery and assistant research professor of anthropology at the George Washington University, the finding speaks to the sophisticated textile technology ancient Andean people developed 6,200 years ago.

“Some of the world’s most significant technological achievements were developed first in the New World,” said Dr. Splitstoser. “Many people, however, remain mostly unaware of the important technological contributions made by Native Americans, perhaps because so many of these technologies were replaced by European systems during the conquest. However, the fine fibers and sophisticated dyeing, spinning and weaving practices developed by ancient South Americans were quickly co-opted by Europeans.”

The textile was discovered during a 2009 excavation at Huaca Prieta, a desert area that offers nearly pristine archaeological preservation on the north coast of Peru. Experts believe the site was likely a temple where a variety of textiles and other offerings were placed, possibly as part of a ritual. The well-preserved artifacts give a glimpse into ancient civilization and lifestyle and offer an unexpected connection to the 21st century.

The development of indigo dye was critical for future trends in fashion, fabrics and textile arts, Splitstoser said.

“The cotton used in Huaca Prieta fabrics, Gossypium barbadense, is the same species grown today known as Egyptian cotton,” Dr. Splitstoser said. “And that’s not the only cotton connection we made in this excavation — we may well not have had blue jeans if it weren’t for the ancient South Americans.”

The textile is now in the Cao Museum collection in Peru. The paper, “Early Pre-Hispanic Use of Indigo Blue in Peru,” published in Science Advances on Sept. 14.

Reference:
Ana Claro et al. Early pre-Hispanic use of indigo blue in Peru. Science Advances, September 2016 DOI: 10.1126/sciadv.1501623

Note: The above post is reprinted from materials provided by George Washington University.

Surviving earth’s extremes: BYU research in the mountains of Antarctica

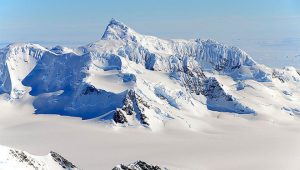
Antarctica's Alexander Island mountain range, snapped during a NASA research flight in October 2011. Credit: Michael Studinger, NASA.
Antarctica’s Alexander Island mountain range, snapped during a NASA research flight in October 2011.
Credit: Michael Studinger, NASA.

Here’s what it takes to conduct research in Antarctica if you’re BYU biologist Byron Adams:

  • Get on commercial plane, fly 20 hours 50 minutes to Christchurch, New Zealand. Eat, sleep.
  • Get on C-17 plane, fly 6 hours to McMurdo Station, Antarctica. Eat, sleep, sort gear.
  • Get on bush plane, fly 5 hours to a fuel cache in the middle of nowhere, Antarctica.
  • Deplane, dig up barrels of fuel, pump fuel.
  • Get back on bush plane, fly 5 more hours even further into the heart of Antarctica.
  • Climb several hundred yards in freezing temperatures to a summit in the Transantarctic
  • Mountains. Try to find out how microscopic creatures survived the ice age.

“Maybe they just survived frozen for 20,000 years—went into cryptobiosis and shut down until the Pleistocene [ice age] was over,” Adams said. “It’s still a mystery how life survived here. They did, but it’s still unsolved.”

Adams has spent many bone-chilling months in Antarctica trying to solve this riddle, digging up creatures like tardigrades, nematodes and rotifers to find out how they lasted. His latest work, published in Nature’s Scientific Reports, rules out one possible scenario.

Here’s the cliff notes version: During the last ice age, ice sheets were so expansive they covered the entire continent, making Antarctica unsuitable for terrestrial life. But biologist like Adams have found unique species of soil creatures native to Antarctica that somehow survived. Now he’s trying to find where they hid, or what they did to make it through the ice age.

And while his biological work in the coldest place on Earth is second to none, his efforts in getting there are equally impressive. The research he is publishing now started some 10 years ago with a grant proposal to the National Science Foundation.

Several complicated years later, Adams was finally granted 12 flights from McMurdo Station to locations where the tiny invertebrates might have hunkered down for the ice age. Although his grant proposal reviewed well, there were concerns about whether or not it was even possible to access these remote locations.

“I had to get a bunch of satellite imagery and talk to the pilots themselves and say, ‘Would you land me here?'” Adams said.

Turns out the pilots were willing, but the NSF was unsure. It wasn’t until Adams got access to flight photographs from the 1950s that he was able to convince the authorities that the planes could land safely.

“As it turns out, it was super easy,” Adams said. “The pilots would not only land on the glacier, they would fly their planes right up to the top where we needed to be. At one location we only had to walk about 50 feet to the sample areas.”

Walking only 50 feet was nice on both the researchers and the environment: “You walk some place and your footsteps will be there for 100 years. It’s the most pristine environment on the planet and all the damage that’s done is done by scientists. So we have to be very careful.”

Thus the strict rules on how many people can be there and how often they can be there, and the ban on the use of ground vehicles—no ATVs, not trucks, only helicopters.

Unfortunately, poor weather limited Adams to only three of the 12 approved flights, and only a few hours at each site. That was still enough time for Adams to collect sufficient soil for testing.

What he found was a bit disappointing: these potential “refugia,” or hideout spots for the tiny organisms, were not suitable for life. The locations had accumulated toxic levels of nitrogen because there was no plant life to consume the nitrogen.

“These habitats have basically sucked for like five million years,” Adams said. “If you were a little nematode worm, you wouldn’t survive on Brown’s Butte on the Beardmore region. You’re just not going to make it in those conditions.”

And so the search will go on. Adams will be back in Antarctica soon, probably during the summer months from December to February when the temperature stays in a relatively nice range of 18 to 33 degrees Fahrenheit.

Reference:
W. B. Lyons et al. The Soil Geochemistry in the Beardmore Glacier Region, Antarctica: Implications for Terrestrial Ecosystem History, Scientific Reports (2016). DOI: 10.1038/srep26189

Note: The above post is reprinted from materials provided by Brigham Young University.

Between a rock and a hard place: Biologists unearth sandstone-excavating bees

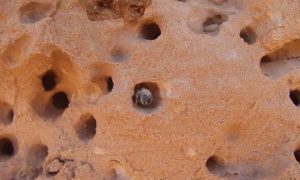
In south central Utah’s San Rafael Swell, a close-up of a bee of the species Anthophora pueblo in its sandstone nest. In the Sept. 12, 2016, issue of Current Biology, Utah State University biologists describe why the bees expend extra effort to excavate nests in the hard sandstone. Credit: Michael Orr, Utah State University

In the popular nursery story The Three Little Pigs, the prudent porker who builds his house of brick is chided by his pals, who choose much easier ways to construct their respective abodes. Only later in the cautionary tale does the reader discover the benefits of extra cost and effort in erecting shelter.

Utah State University entomologists have discovered a bee species with a similar, undeterred building drive in the unforgiving deserts of the American Southwest. According to the scientists’ findings, published Sept. 12, 2016, in Current Biology, tiny Anthophora pueblo goes to great effort to excavate nests in hard sandstone; eschewing weaker, easier-to-dig substrates and soils.

“Not much is known about this hard-to-find species and our first step was to confirm it actually prefers nesting in sandstone,” says Michael Orr, USU doctoral student in biology and lead author on the paper. “Once we confirmed this preference, the next step was to explore why the bees expend such tremendous effort and energy, limiting their ability to reproduce, to create these shelters.”

Additional authors on the paper are Terry Griswold, research entomologist with the USDA-ARS Pollinating Insects Research Unit at Utah State, USU biology professor James Pitts and retired USDA-ARS research entomologist Frank Parker.

Parker discovered bees nesting in sandstone nearly 40 years ago at two sites in Utah’s San Rafael Desert, collected samples of the nests and reared the inhabitants to emergence. But his work was stored away and largely untouched until Orr began examining the samples a few years ago and discovered five new nesting sites ranging from Ancestral Puebloan sandstone cliff dwellings at Colorado’s Mesa Verde and natural formations in southern Utah and California’s Death Valley.

“These bees are considered uncommon,” says Orr, who is the recipient of USU’s MacMahon Research Award. “As the bees use water to help excavate the sandstone, we found many sites by targeting areas near water.”

And longer examination of the bees revealed the benefits of the hard-earned homes in the xeric ecosystems.

“Sandstone is more durable than most other nesting options and any bees that do not emerge from these nests in a year are better protected,” Orr says. “Delayed emergence is a bet-hedging strategy for avoiding years with poor floral resources — especially useful in the drought-prone desert.”

Further, the tough, elevated shelters protect bees from erosion and sudden flash floods. They also help to control parasite build-up across years and may even deter growth of threatening microbes, he says.

“Because sandstone contains less organic matter than typical soils, we expect more microbes that make their own food, such as photosynthetic cyanobacteria,” Orr says. “These microbes would be less likely to invade bee nests.”

On his forays into the desert to study the bees, the USU student discovered the challenges of survival through his own experiences. Traveling over rocky roads in Death Valley, his vehicle bottomed out resulting in a broken oil pan. Mindful of his limited water supply, he “booked it out of there.”

“The desert is a hard place to live,” Orr says. “Anthophora pueblo has pioneered a suitable niche between a rock and a hard place.”

Reference:
Frank D. Parker et al. A new bee species that excavates sandstone nests. Current Biology, September 2016 DOI: 10.1016/j.cub.2016.08.001

Note: The above post is reprinted from materials provided by Utah State University.

Asphalt-based carbon-capture material advances

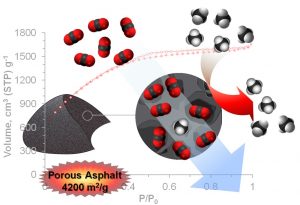
Rice University scientists have improved their asphalt-derived porous carbon's ability to capture carbon dioxide, a greenhouse gas, from natural gas. The capture material derived from untreated Gilsonite asphalt has a surface area of 4,200 square meters per gram. Credit: Almaz Jalilov/Rice University
Rice University scientists have improved their asphalt-derived porous carbon’s ability to capture carbon dioxide, a greenhouse gas, from natural gas. The capture material derived from untreated Gilsonite asphalt has a surface area of 4,200 square meters per gram.
Credit: Almaz Jalilov/Rice University

A Rice University laboratory has improved its method to turn plain asphalt into a porous material that can capture greenhouse gases from natural gas.

In research detailed this month in Advanced Energy Materials, Rice researchers showed that a new form of the material can sequester 154 percent of its weight in carbon dioxide at high pressures that are common at gas wellheads.

Raw natural gas typically contains between 2 and 10 percent carbon dioxide and other impurities, which must be removed before the gas can be sold. The cleanup process is complicated and expensive and most often involves flowing the gas through fluids called amines that can soak up and remove about 15 percent of their own weight in carbon dioxide. The amine process also requires a great deal of energy to recycle the fluids for further use.

“It’s a big energy sink,” said Rice chemist James Tour, whose lab developed a technique last year to turn asphalt into a tough, sponge-like substance that could be used in place of amines to remove carbon dioxide from natural gas as it was pumped from ocean wellheads.

Initial field tests in 2015 found that pressure at the wellhead made it possible for that asphalt material to adsorb, or soak up, 114 percent of its weight in carbon at ambient temperatures.

Tour said the new, improved asphalt sorbent is made in two steps from a less expensive form of asphalt, which makes it more practical for industry.

“This shows we can take the least expensive form of asphalt and make it into this very high surface area material to capture carbon dioxide,” Tour said. “Before, we could only use a very expensive form of asphalt that was not readily available.”

The lab heated a common type asphalt known as Gilsonite at ambient pressure to eliminate unneeded organic molecules, and then heated it again in the presence of potassium hydroxide for about 20 minutes to synthesize oxygen-enhanced porous carbon with a surface area of 4,200 square meters per gram, much higher than that of the previous material.

The Rice lab’s initial asphalt-based porous carbon collected carbon dioxide from gas streams under pressure at the wellhead and released it when the pressure was released. The carbon dioxide could then be repurposed or pumped back underground while the porous carbon could be reused immediately.

In the latest tests with its new material, Tours group showed its new sorbent could remove carbon dioxide at 54 bar pressure. One bar is roughly equal to atmospheric pressure at sea level, and the 54 bar measure in the latest experiments is characteristic of the pressure levels typically found at natural gas wellheads, Tour said.

Reference:
Almaz S. Jalilov, Yilun Li, Jian Tian, James M. Tour. Ultra-High Surface Area Activated Porous Asphalt for CO2Capture through Competitive Adsorption at High Pressures. Advanced Energy Materials, 2016; 1600693 DOI: 10.1002/aenm.201600693

Note: The above post is reprinted from materials provided by Rice University.

Westerly winds have blown across central Asia for at least 42 million years

westerly-winds-have-blown-geologypage
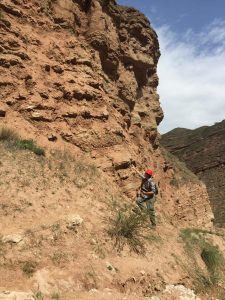
Alexis Licht points to sedimentary rock that contains layers of dust dating back to the Eocene. During that era, atmospheric carbon dioxide was three to four times higher than it is today. Credit: Alexis Licht/University of Washington

The gusting westerly winds that dominate the climate in central Asia, setting the pattern of dryness and location of central Asian deserts, have blown mostly unchanged for 42 million years. A University of Washington geologist led a team that has discovered a surprising resilience to one of the world’s dominant weather systems. The finding could help long-term climate forecasts, since it suggests these winds are likely to persist through radical climate shifts.

“So far, the most common way we had to reconstruct past wind patterns was using climate simulations, which are less accurate when you go far back in Earth’s history,” said Alexis Licht, a UW assistant professor of Earth and space sciences who is lead author of the paper published in August in Nature Communications. “Our study is one of the first to provide geological constraints on the wind patterns in deep time.”

Earlier studies of the Asian climate’s history used rocks from the Loess Plateau in northwestern China to show dust accumulation began 25 million to 22 million years ago and increased over time, especially over the past 3 million years. It had been believed that these rocks reflected the full history of central Asian deserts, linking them with the rise of the Tibetan Plateau and a planetwide cooling.

But Licht led previous research at the University of Arizona using much older rocks, dating back more than 40 million years, from northeastern Tibet. Dust in those rocks confirmed the region already was already parched during the Eocene epoch. This upended previous beliefs that the region’s climate at that time was more subtropical, with regional wind patterns brought more moisture from the tropics.

The new paper traces the origin of this central Asian dust using samples from the area around Xining, the largest city at the northeastern corner of the Tibetan Plateau. Chemical analyses show that the dust came from areas in western China and along the northern edge of the Tibetan Plateau, like today, and was carried by the same westerly winds.

“The origin of the dust hasn’t changed for the last 42 million years,” Licht said.

During the Eocene, the Tibetan Plateau and Himalayan Mountains were much lower, temperatures were hot, new mammal species were rapidly emerging, and Earth’s atmosphere contained three to four times more carbon dioxide than it does today.

“Neither Tibetan uplift nor the decrease in atmospheric carbon dioxide concentration since the Eocene seem to have changed the atmospheric pattern in central Asia,” Licht said. “Wind patterns are influenced by changes in Earth’s orbit over tens or hundreds of thousands of years, but over millions of years these wind patterns are very resilient.”

The study could help predict how climates and ecosystems might shift in the future.

“If we want to have an idea of Earth’s climate in 100 or 200 years, the Eocene is one of the best analogs, because it’s the last period when we had very high atmospheric carbon dioxide,” Licht said.

Results of the new study show that the wind’s strength and direction are fairly constant over central Asia, so the amount of rain in these dry zones depends mostly on the amount of moisture in the air, which varies with carbon dioxide levels and air temperature. The authors conclude that winds will likely remain constant, but global warming could affect rainfall through changes in the air’s moisture content.

“Understanding the mechanism of those winds is a first step to understand what controls rainfall and drought in this very wide area,” Licht said. “It also provides clues to how Asian circulation may change, since it suggests these westerly winds are a fundamental feature that have persisted for far longer than previously believed.”

Reference:
A. Licht, G. Dupont-Nivet, A. Pullen, P. Kapp, H. A. Abels, Z. Lai, Z. Guo, J. Abell, D. Giesler. Resilience of the Asian atmospheric circulation shown by Paleogene dust provenance. Nature Communications, 2016; 7: 12390 DOI: 10.1038/ncomms12390

Note: The above post is reprinted from materials provided by University of Washington. The original item was written by Hannah Hickey.

Satellite radar image analysis reveals that rifting in Iceland exhibits simultaneous horizontal and sideways movement

satellite-radar-image-analysis-reveals-that-geologypage
Satellite radar image analysis and computer modelling on recent data from Iceland have revealed that rifting events can trigger shearing on the surface alongside horizontal widening. Credit: 2016 KAUST

The separation of tectonic plates takes place over millions of years, often deep on the ocean floor. Geologists rarely get a chance to study these rift zones in detail leaving many unanswered questions about plate separation. Researchers at King Abdullah University of Science and Technology (KAUST), Saudi Arabia, used recent events in Iceland to gain unique insights into rifting processes and how magma interacts with the Earth’s surface.

In 2014, the largest volcanic eruption in Iceland in more than 200 years took place near the Bárðarbunga caldera. This event was of huge interest to Sigurjón Jónsson and Joël Ruch and their team from the University’s Physical Science and Engineering Division.

“This was an exciting opportunity to work with our fantastic multidisciplinary team on an active rifting event,” Ruch said. “However, so many other research teams were studying the same event that we needed to find a unique angle on the satellite radar and seismic data available. That way we would complement others’ work while potentially noticing something new.”

The team focused specifically on near-field deformation at the rift zone, examining how the surface altered as magma moved directly below—a complex interplay rarely seen (let alone investigated) on land.

“Led by team member Teng Wang, we created a novel program capable of translating satellite radar data into highly detailed maps of 3-D surface displacements,” explained Jónsson. “We used radar images of the rift zone from both before and after the eruption and compared them for changes in surface deformation.”

The team also modeled the path taken by the magma beneath the surface to create such deformation patterns. They found that the magma re-entered existing fractures under the ground from a previous eruption in 1797. This magma intrusion reactivated an existing graben, an area of land that sank as a result of faulting on each side, causing it to collapse further by around five meters. Over just a few days, the rift widened horizontally by about the same distance.

More surprisingly, the researchers found that faults at the graben border had also shifted sideways, showing for the first time that rifting events can trigger shearing, or sideways displacement, alongside a horizontal opening.

Jónsson’s team visited the site in Iceland while the eruption was ongoing to confirm their findings.

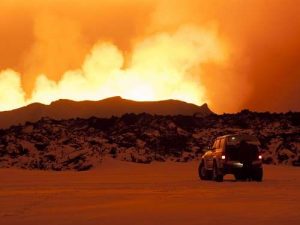
“Walking along the rift zone under red magmatic skies with snow underfoot was quite an experience,” added Ruch.

The researchers noted that the influence of preexisting fractures on magma movement and the insights into shearing should be considered in advanced computer modelling of rifting events.

Reference:
Joël Ruch et al. Oblique rift opening revealed by reoccurring magma injection in central Iceland, Nature Communications (2016). DOI: 10.1038/ncomms12352

Note: The above post is reprinted from materials provided by King Abdullah University of Science and Technology.

Ancient DNA traces extinct Caribbean ‘Island Murderer’ back to the dawn of mammals

ancient-dna-traces-extinct-caribbean-geologypage
The Solenodon taxa is the closest living relative to the extinct Nesophontes. Credit: Natural History Museum, London UK

From skeletal remains found among ancient owl pellets, a team of scientists has recovered the first ancient DNA of the extinct West Indian mammal Nesophontes, meaning “island murder.” They traced its evolutionary history back to the dawn of mammals 70 million years ago.

The authors, including Selina Brace, Jessica Thomas, Ian Barnes et al., published their findings in the advanced online edition of Molecular Biology and Evolution.

The insect-eating creature existed in the Caribbean islands until the 16th century when, perhaps, they were outcompeted as the first Spanish ships arrived—-introducing rats as stowaways. “Nesophontes was just one of the dozens of mammals that went extinct in the Caribbean during recent times,” said Professor Ian Barnes, Research Leader at London’s Natural History Museum.

Scientists used a 750-year-old specimen to generate many thousands of base pairs of DNA sequence data. This allowed the research team to uncover its evolutionary origins and finally resolve the relationships between its closest relatives, the insectivores, a group including shrews, hedgehogs and moles. Phylogenetic and divergence time scenarios clearly demonstrate that Nesophontes is a deeply distinct sister group to another group of living native Caribbean insectivores, the solenodons. The time of the split between these two correlates with an era when the northern Caribbean was formed of volcanic islands, well before the origins of the islands we see today.

Obtaining DNA from tropical fossils is notoriously difficult, and the team made use of the latest developments in ancient DNA technology to conduct the study.

“Once we’d dealt with the tiny size of the bone samples, the highly degraded state of the DNA, and the lack of any similar genomes to compare to, the analysis was a piece of cake,” said Natural History Museum scientist Dr. Selina Brace.

The findings will be of considerable interest for evolutionary biologists studying mammalian biogeography, and the significant role that humans may have played in a recent extinction.

Reference:
Selina Brace, Jessica A. Thomas, Love Dalén, Joachim Burger, Ross D. E. MacPhee, Ian Barnes and Samuel T. Turvey. Evolutionary history of the Nesophontidae, the last unplaced Recent mammal family. DOI: 10.1093/molbev/msw186

Note: The above post is reprinted from materials provided by Oxford University Press.

A look inside volcanic flows

a-look-inside-volcanic-flows-geologypage
Researchers created their own flows with 3,500 pounds of volcanic ash Credit: Massey University

An empty boiler house and 1.5 tons of thick volcanic ash have given researchers at New Zealand’s Massey University and Georgia Tech a look into the inner workings of pyroclastic flows in the largest-scale experiments of volcanic flows that have been conducted. They saw something they didn’t expect.

In a paper published last week by Nature Geoscience, the team describes two separate transport areas that have been well-studied: a non-turbulent underflow and a fully turbulent, ash cloud region at the top of the flow. But volcanic flows apparently have a previously unrecognized third zone where the currents meet.

“Inside this middle zone, the gas-particle mixture behaved fundamentally differently from the turbulent suspension cloud above and the particle-rich avalanche of pumice below,” said Massey’s Gert Lube. “These mesoscale turbulence clusters control how the internal structure and the damage potential of pyroclastic flows evolves during volcanic events.”

Pyroclastic flows, like the ones that covered Pompeii, are avalanches of fast-moving clouds of hot ash, rock and gas that are emitted during eruptions. They are responsible for 50 percent of volcanic fatalities every year.

“Our experiments allow us to better understand the physics of something we’ll never see: the inside of an actual volcanic flow,” said Massey’s Eric Breard, the lead author who will begin a postdoctoral fellowship at Georgia Tech in January. “By studying how quickly this mesoscale region grows, and how its dynamics change, it ultimately can tell us how dangerous the flows can be.”

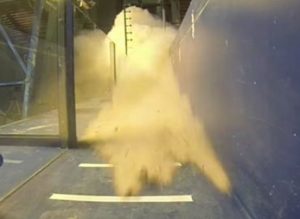
To create and measure the flows, the team used Massey’s one-of-a-kind eruption simulator. The team climbed a 12-meter tower in a repurposed boiler house and poured more than 3,500 pounds of pumice and ash down a 12-meter narrow chute. High-speed cameras recorded the flow while sensors captured the data.

“These experiments demonstrated that in the intermediate transition zone between the fully turbulent upper part of the flow and the underlying concentrated underflow, the energy from the largest scales of fluid motion is extracted by particles that almost exactly follow the fluid motion,” said co-author Josef Dufek, an associate professor at Georgia Tech. “This creates dendritic structures, or waves of particles, that slow the flow down, and provide the rate-limiting step for particles entering the underflow where they can cause the most damage.”

“This opens a new path toward reliable predictions of their motion, and will be particularly topical for hazard scientists and decision makers, because they will lead to major revisions of volcanic hazard forecasts and ultimately more effective measures for keeping people safe,” said Lube.

Video

Reference:
Eric C. P. Breard, Gert Lube, Jim R. Jones, Josef Dufek, Shane J. Cronin, Greg A. Valentine, Anja Moebis. Coupling of turbulent and non-turbulent flow regimes within pyroclastic density currents. Nature Geoscience, 2016; DOI: 10.1038/ngeo2794

Note: The above post is reprinted from materials provided by Georgia Institute of Technology. The original item was written by Ryan Willoughby.

Magma accumulation highlights growing threat from Japanese volcano

magma-accumulation-highlights-geologypage
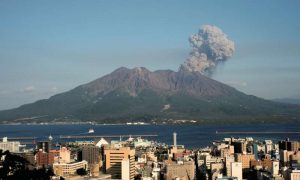
Sakurajima volcano with downtown Kagoshima in the foreground. Credit: Sakurajima Volcano Research Centre

A research team led by the University of Bristol has found magma build-up beneath Japan’s Aira caldera and Sakurajima volcano may indicate a growing threat to Kagoshima city and its 600,000 inhabitants.

The team was headed by Drs James Hickey and Joachim Gottsmann from the Volcanology Research Group at the School of Earth Sciences.

They studied surface deformation in and around the caldera and volcano to characterise the magma supply conditions, and how they can be used for eruption forecasting and hazard assessment. The study, in collaboration with the Sakurajima Volcano Research Centre, is published today in Scientific Reports. Aira caldera is a large, submerged crater in the southern part of Kyushu, Japan, caused by the violent explosion and subsequent collapse of a voluminous magma reservoir. The re-growth of this magma storage zone has been feeding Sakurajima volcano, which is located on the southern rim of the caldera.

Sakurajima is one of Japan’s most active volcanoes with small, localised eruptions nearly every day, but the history of the volcano is even more ferocious. In 1914, a large explosive eruption killed 58 people and caused widespread flooding in the adjacent city of Kagoshima as the ground subsided due to the withdrawal of magma from the subsurface.

Continued measurements of the ground movement since that eruption show that the whole area is uplifting. By combining recent GPS deformation measurements with other geophysical data and advanced 3D computer models, Dr Hickey and his co-authors were able to reconstruct the magma plumbing system beneath the caldera.

Their results show that magma is being supplied to the system at a faster rate than it is being erupted from Sakurajima volcano. This causes the ground to swell as the magma reservoir expands below the surface. A volume of 14 million m3 is supplied each year, equal to roughly 3.5 times the volume of Wembley stadium.

The excessive build-up of magma may indicate there is growing potential for a larger eruption. In particular, the deadly 1914 eruption was approximately 1.5 km3 in volume. From this time it would take roughly 130 years to save up enough magma for another eruption of a similar size. The authors were additionally able to place numerical constraints on the timing, mechanism and location of magma supply.

Lead-author Dr James Hickey (now at the University of Exeter) said: “These results were made possible by combining data from various monitoring methods and applying them to new numerical modelling techniques, moving away from older modelling methods that have been in use since the 1950s.

“This approach could help to improve eruption forecasting and hazard assessment at volcanoes worldwide. Sakurajima volcano was a particularly great place to develop this approach as there is genuine concern over the state of the volcano, which was particularly evident during a crisis in August 2015.”

He added: “By identifying a timeframe over which we may see an increase in the level of activity at the volcano our colleagues at the Sakurajima Volcano Research Centre can plan accordingly. The numerical constraints we were able to put on the magma supply conditions can also be used to assist with probabilistic and quantitative eruption forecasting.”

Co-author Dr Joachim Gottsmann said: “A thorough understanding of the rate and volume of magma supply and accumulation, and their thermomechanical controls, is essential for continued monitoring and eruption forecasting at Sakurajima volcano, and volcanoes worldwide.”

Dr Haruhisa Nakamichi, Associate Professor at the Disaster Prevention Research Institute, Kyoto University, and co-author, said: “It is already passed by 100 years since the 1914 eruption, less than 30 years is left until a next expected big eruption, Kagoshima city office has prepared new evacuation plans from Sakurajima, after experiences of evacuation of the crisis in August 2015.”

Reference:
‘Thermomechanical controls on magma supply and volcanic deformation: Application to Aira caldera, Japan’ by J. Hickey, J. Gottsmann, H. Nakamichi, and M. Iguchi, in Scientific Reports. www.nature.com/articles/srep32691

Note: The above post is reprinted from materials provided by University of Bristol.
Stalagmites in Indiana cave may record past earthquakes

Marengo Cave, a show cave in southern Indiana, displays numerous stalactites that have fallen in a preferred direction. Researchers are studying the stalactites for signs they were felled by seismic activity. Flowstone has "cemented" the stalactites in place. Credit: S.V. Panno
Marengo Cave, a show cave in southern Indiana, displays numerous stalactites that have fallen in a preferred direction. Researchers are studying the stalactites for signs they were felled by seismic activity. Flowstone has “cemented” the stalactites in place. Credit: S.V. Panno

Stalagmites rising from the floor of a cave in southern Indiana may contain traces of past earthquakes in the region, according to a report published September 13 in the Bulletin of the Seismological Society of America.

The rock formations in Donnehue’s Cave, and others like them in local caves, could help scientists better understand the history of ancient seismic events in the Wabash Valley fault system of the Midwestern United States, said Samuel Panno, a University of Illinois and Illinois State Geological Survey researcher.

However, the stalagmites also contain traces of past climate events such as glacial flooding, and the BSSA study by Panno and his colleagues demonstrates the importance of untangling climate and seismic effects on stalagmite growth.

Stalagmites grow on cave floors from the accumulation of minerals that are precipitated from mineral-laden waters that drip from a cave ceiling. During this process, small to large stalactites that hang like icicles on the cave ceiling grow in the same manner. Earthquakes can leave their mark on stalagmites by shifting the ground in a way that changes the flow of the drip feeding the stalagmite–closing a crack through which the drip flowed, for instance, or knocking down a stalactite that fed a stalagmite.

“Then when you take a stalagmite and slice it down its middle the long way and open it up like a book,” Panno explained, “you can see these shifts in the axis of its growth.”

Using a variety of dating techniques to determine the age of the stalagmite and any surrounding sediments, scientists can then pinpoint the timing of these growth shifts and compare them to the timing of known earthquakes in an area.

Among the four Donnehue stalagmites in the study, the research team found a twin stalagmite pair that had stopped growing around 100,000 years B.P. and then resumed growing at around 6000 years B.P., overlapping in time with a magnitude 7.1 to 7.3 earthquake in the area. Another younger stalagmite began growing around 1800 years B.P.–coinciding with a magnitude 6.2 earthquake–and showed later shifts in its growth axis that overlap with other seismic events in the nearby New Madrid Seismic Zone.

These older earthquakes are known from other studies of soil shaking triggered by earthquakes, called paleoliquefaction, in ancient sediments. But seismic signs contained within stalagmites could potentially extend the evidence for these historic and prehistoric earthquakes, Panno said.

“Most of the evidence for paleoearthquakes comes from liquefaction features that are fairly easy to date,” he noted. “The problem is that you are doing this in sediments that are usually on the order of several hundred to up to 20,000 years old, so to go beyond that, to get older and older earthquake signatures, we decided to look into caves.”

Stalagmite growth can also be affected by climate change, whether through drying up a drip source or through flooding that can block drip passages, or by smothering or dislodging growing stalagmites. Most of the stalagmites examined in the BSSA study were affected by climate-related events, Panno and his colleagues note.

For instance, some of the stalagmites show shifts in growth patterns that coincide with known episodes of flooding from the melting of glacial ice, and others contain thin layers of silt deposited by these floods. “We’re learning that you have to be really careful in where you sample these things, because the caves in southern Indiana, for example, tended to flood during the Pleistocene,” Panno said. “That flooding can move a stalagmite or knock down the stalactite feeding it and change its drip location.”

Panno is working with U.S. Geological Survey seismologist John Tinsley at other caves in the Midwestern U.S., including Indiana’s well-known tourist attraction Marengo Cave, to find other stalagmites, as well as related fallen stalactites that might bear signs of seismic history. They hope future studies will provide more solid evidence of how these formations could store information on the timing, magnitude and origin of past earthquake activity.

Note: The above post is reprinted from materials provided by Seismological Society of America.

Brain anatomy convergence between crocodylians and their epic carnivorous cousins, the phytosaurs

Credit: Stephan Lautenschlager et al.

If I ask you to think of a large, extinct carnivorous reptile, what do you think of? I’m gonna guess that pretty much all of you went straight for a T. rex, or if you’re a bit weird (or vegetarian), maybe a Stegosaurus.

But if you think back in time of when the dinosaurs were around, and especially when they were just getting kick-started, there were so many other bizarre and spectacular groups of animals around.

Let’s go back to the Late Triassic, around 230 to 200 million years ago. Earth was pretty different to how it was now – you wouldn’t recognise any of the modern groups we know so well like birds, mammals, and amphibians. The continents were in disguise too, collaborating to form the giant supercontinent Pangaea, which sat over the equator ready to rupture at any second (slash million years or so…)

One of these groups were called phytosaurs, and are hideously under-appreciated beasts. They were a group of large carnivores, closely related to the earliest dinosaurs and crocodiles. It has often been pointed out that they even look suspiciously similar to some modern crocodylians, such as gharials, as both share elongated, tooth-filled snouts. This snout form is known as a ‘longirostrine’ morphology.

But beyond this superficial similarity, we actually know very little about crocodylians and phytosaurs.

Research by Stefan Lautenschlager and Richard Butler aimed to change this by investigating the resemblance between phytosaurs and crocodylians in terms of the structure of their brain cases, research that has only recently become possible due to the wider application of CT scanning technology.

This method allows us to scan the fragile skulls of fossils, and reconstruct them as digital 3D images. From here, we can explore and compare their anatomy in details that was not possible beforehand, and opens up a whole new realm of research possibilities for palaeontologists.

What they found is that phytosaurs have a very unusual and near-unique endocranial anatomy (the endocranium is the basal part of the skull that surrounds the brain). They have a really elongate olfactory tract, which means that they probably had super-reptilian senses of smell. The general structure of the brain architecture was also arranged as a series of longitudinal segments, a very distinct feature for phytosaurs.

Rather neatly though, it seems that modern crocodilians and their ancestors, collectively known as Crocodyliformes, share this general endocranial morphology. Modern crocodylians, including Crocodylus and Alligator are similar, as are other longirostrine and now extinct species including Pholidosaurus and Cricosaurus. Like phytosaurs, these extinct species would have spent all or most of their time out to sea.

Differences between the endocranial structures in phytosaurs can likely be explained by differences in their sensory evolution, related to adaptations to different modes of life and behaviours. For example, we might expect that phytosaurs that spend more time in water have greater sensory adaptations towards detecting movement of prey in lakes and rivers.

We’re only just beginning to understand the ecology and evolution of phytosaurs, and this study provides an exciting new step. By comparing them with crocodylians, we gain an additional dimension by being able to look at how similar living, breathing relatives behave. This is so important for developing our collective understanding and vision of phytosaurs not as fossils, but as animals that were once real and alive.

Reference:
Stephan Lautenschlager et al. Neural and endocranial anatomy of Triassic phytosaurian reptiles and convergence with fossil and modern crocodylians, PeerJ (2016). DOI: 10.7717/peerj.2251

Note: The above post is reprinted from materials provided by Public Library of Science.

Reunion island volcano erupts in fiery display

Under the Champagne vineyards, ancient shells offer rare look at the past

under-the-champagne-vineyards-geologypage
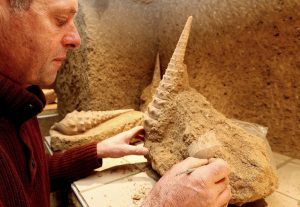
Patrice Legrand, a winegrower and amateur paleontologist, cleans shells in the Cave aux Coquillages (The seashells cave) in Fleury-la-Riviere (AFP Photo/Francois Nascimbeni)

In caves deep underground in France’s Champagne region lie thousands of shells that are 45 million years old, a site researchers describe as “rare and exceptional”—and which may have influenced the flavour of the local bubbly.

“It’s my paradise,” says Patrice Legrand, a champagne producer and owner of the “Cave aux Coquillages” or Shell Cave, in the Montagne de Reims regional park in northeastern France.

Legrand, 55, who is also an amateur paleontologist, acquired the vineyard in the early 1990s and set about excavating the caves, which are now open to the public.

Trapped in a thick layer of limestone, in around 250 metres (820 feet) of underground galeries, are thousands of shells that have been untouched since their sudden disappearance for reasons that are still unknown.

Apart from cephalopods and tiny seashells, some of them microscopic, which Legrand has painstakingly cleaned and catalogued, the star of the visit is undoubtedly the Campaniles giganteum—gastropods with spiral tube-shaped shells that are 40 to 60 centimeters (16 to 24 inches) long.

In the Lutetian age, or between 47.8 and 41.2 million years ago—and some 40 million years before the emergence of Homo Sapiens—”the Champagne region was covered by a warm sea and it enjoyed a tropical climate,” Legrand said in the winding galeries which are up to 28 metres (60 feet) underground.

“These are not fossils as such, as in reality they are not fossilised. The homogeneity of the calcified rock and the impermeable clay layer led to this conservation,” says Legrand, pointing to the shells, which are smooth inside and have a pearly sheen outside.

‘Link to champagne’

Legrand has catalogued some 300 species. And his work has attracted the attention of French and Belgian researchers.

“This site has given us a look at the past,” says Didier Merle of the Museum of Natural History in Paris, who has visited the site several times.

“It’s exceptional because you can find a large quantity of Campaniles giganteum. We have thus been able to better understand the evolution of the shellfish, the environment and the biodiversity of the era.”

He says there “are no longer many sites from this era due to urbanisation. This one is rare from the point of view of the geological heritage and we must preserve it.”

The caves, where ancient shells have replaced champagne bottles, attracted about 7,000 visitors last year.

In some places, the shells are stuck together in a tangled lump.

“You need patience when you find shells: you take them out in a block, it’s the best way not to damage them,” says Legrand, who has been excavating tirelessly since 1997, with the help of some basic tools such as an electric jackhammer.

“The Digger” as his neighbours call him, spends his days in the cool subterranean galeries like “a real kid” dazzled by the profusion of shells.

The shells are “inexhaustible, even frightening. I will never have time to dig them all out, I will leave them for future generations.”

Besides guided visits, tourists can receive tastings aimed at showing the link between the marine sediments, the vines and the champagnes of that particular part of the region, including the owner’s own Legrand Latour brand.

“Shells hold the marine iodine and only release it when it dissolves,” explains Legrand, who has developed a champagne with a low level of sugar that is specific to the region.

“And that goes very well with shellfish, like oysters,” he adds with a smile.

Note: The above post is reprinted from materials provided by AFP.

Incredible View for Mississippi River and Gulf of Mexico

The Dead Zone

The Gulf of Mexico hypoxic zone is a seasonal phenomena occurring in the northern Gulf of Mexico, from the mouth of the Mississippi River to beyond the Texas border.  It is more commonly referred to as the Gulf of Mexico Dead Zone, because oxygen levels within the zone are too low to support marine life.  The Dead Zone was first recorded in the early 1970’s. It originally occurred every two to three years, but now occurs annually.  In the summer of 1999 the Dead Zone reached its peak, encompassing 7,728 square miles.

Hypoxic conditions arise when dissolved oxygen levels in the water fall below two milligrams per liter of water, too low to sustain animal life in the bottom strata of the ocean. The Dead Zone forms each spring as the Mississippi and Atchafalaya Rivers empty into the Gulf, bringing nutrient rich waters that form a layer of fresh water above the existing salt water. It lasts until late August or September when it is broken up by hurricanes or tropical storms.  The nutrients provide favorable conditions for excessive growth of algae that utilize the water’s oxygen supply for respiration and when decomposing.

The Mississippi River Basin covers forty-one percent of the continental United States, contains forty-seven percent of the nation’s rural population, and fifty-two percent of U.S. farms.  The waste from this entire area drains into the Gulf of Mexico through the Mississippi River.  Included in this agricultural waste are phosphorus and nitrogen, the primary nutrient responsible for algal blooms in the Dead Zone.  Nitrogen and phosphorus were first used in fertilizers in the United States in the 1930s. Concentrations of nitrate and phosphate in the lower Mississippi have increased proportionately to levels of use of fertilizers by agriculture since the 1960s, when fertilizer use increased by over two million metric tons per year. Overall, nitrogen input to the Gulf from the Mississippi River Basin has increased between two and seven times over the past century.  In addition to agricultural waste, inadequately treated or untreated sewage and other urban pollution is also dumped into these waters.  Nitrogen is normally a limiting factor, meaning its restricted quantities limit plant growth and reproduction.  However, excessive amounts of nitrogen lead to eutrophication, the takeover of nutrient-rich surface water by phytoplankton or other plants.  If nutrient pollution is not greatly reduced, fish and shellfish may someday be permanently replaced by anaerobic bacteria.

The Dead Zone reappears every spring as conditions for algal blooms become more favorable.  Rivers carry greater quantities of water in the spring, along with greater quantities of dissolved nutrients, as the snow melts in northern areas and rainfall increases.  Sunlight also increases in intensity and duration during this period, accompanied by warmer weather and fewer storms, all of which encourage algal growth.  Decreasing storms in late spring and early summer result in calmer water, which prevents the bottom strata of low-oxygen water from mixing with oxygenated surface water.  Organisms living at greater depths, including most marine animals, cannot acquire necessary oxygen.  This timing is especially bad, as the summer months are a time of active reproduction by fish and benthic (bottom-dwelling) invertebrates.  In turn, the Dead Zone is broken up in late August or September by hurricanes or tropical storms.

As the fresh, nutrient-enriched water from the Mississippi and Atchafalaya Rivers spread across the Gulf waters, favorable conditions are created for the production of massive phytoplankton blooms.  A bloom is defined as an  “increased abundance of a species above background numbers in a specific geographic region”.  Incoming nutrients stimulate growth of phytoplankton at the surface, providing food for unicellular animals.  Planktonic remains and fecal matter from these organisms fall to the ocean floor, where they are eaten by bacteria, which consume excessive amounts of oxygen, creating eutrophic conditions.  Hypoxic waters appear normal on the surface, but on the bottom, they are covered with dead and distressed animal, and in extreme cases, layers of stinking, sulfur-oxidizing bacteria, which cause the sediment in these areas to turn black.  These hypoxic conditions cause food chain alterations, loss of biodiversity, and high aquatic species mortality.

Note: The above post is reprinted from materials provided by Tulane University.
Video Copyright © Marlin Magazine

Related Articles