Home Blog Page 163

Greenland ice is melting 7 percent faster than previously thought

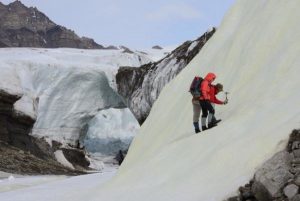
Researchers at The Ohio State University and their colleagues have discovered that the same hotspot that feeds Iceland's active volcanoes has been causing them to underestimate ice loss on Greenland. Credit: Photo of Zachariae Isbrae in northeast Greenland by Anders A Bjork, courtesy of The Ohio State
Researchers at The Ohio State University and their colleagues have discovered that the same hotspot that feeds Iceland’s active volcanoes has been causing them to underestimate ice loss on Greenland.
Credit: Photo of Zachariae Isbrae in northeast Greenland by Anders A Bjork, courtesy of The Ohio State

The same hotspot in Earth’s mantle that feeds Iceland’s active volcanoes has been playing a trick on the scientists who are trying to measure how much ice is melting on nearby Greenland.

According to a new study in the journal Science Advances, the hotspot softened the mantle rock beneath Greenland in a way that ultimately distorted their calculations for ice loss in the Greenland ice sheet. This caused them to underestimate the melting by about 20 gigatons (20 billion metric tons) per year.

That means Greenland did not lose about 2,500 gigatons of ice from 2003-2013 as scientists previously thought, but nearly 2,700 gigatons instead — a 7.6 percent difference, said study co-author Michael Bevis of The Ohio State University.

“It’s a fairly modest correction,” said Bevis, the Ohio Eminent Scholar in Geodynamics, professor of earth sciences at Ohio State and leader of GNET, the Greenland GPS Network.

“It doesn’t change our estimates of the total mass loss all over Greenland by that much, but it brings a more significant change to our understanding of where within the ice sheet that loss has happened, and where it is happening now.”

The Earth’s crust in that part of the world is slowly moving northwest, he explained, and 40 million years ago, parts of Greenland passed over an especially hot column of partially molten rock that now lies beneath Iceland. The hotspot softened the rock in its wake, lowering the viscosity of the mantle rocks along a path running deep below the surface of Greenland’s east coast.

During the last ice age, Greenland’s ice sheet was much larger than now, and its enormous weight caused Greenland’s crust to slowly sink into the softened mantle rock below. When large parts of the ice sheet melted at the end of the ice age, the weight of the ice sheet decreased, and the crust began to rebound. It is still rising, as mantle rock continues to flow inwards and upwards beneath Greenland.

The existence of mantle flow beneath Greenland is not a surprise in itself, Bevis said. When the Gravity Recovery and Climate Experiment (GRACE) satellites began measuring gravity signals around the world in 2002, scientists knew they would have to separate mass flow beneath the earth’s crust from changes in the mass of the overlying ice sheet.

“GRACE measures mass, period. It cannot tell the difference between ice mass and rock mass. So, inferring the ice mass change from the total mass change requires a model of all the mass flows within the earth. If that model is wrong, so is the ice mass change inferred from GRACE,” he explained.

Models of this rock flow depend on what researchers can glean about the viscosity of the mantle. The original models assumed a fairly typical mantle viscosity, but Greenland’s close encounter with the Iceland hot spot greatly changed the picture.

To the GNET team, the 7.6 percent discrepancy in overall ice loss is overshadowed by the fact that it concealed which parts of the ice sheet are most being affected by climate change. The new results reveal that the pattern of modern ice loss is similar to that which has prevailed since the end of the last ice age.

“This result is a detail, but it is an important detail,” Bevis continued. “By refining the spatial pattern of mass loss in the world’s second largest — and most unstable — ice sheet, and learning how that pattern has evolved, we are steadily increasing our understanding of ice loss processes, which will lead to better-informed projections of sea level rise.”

Computer models can give a good estimate of mantle flow and crustal uplift, he said, and GNET’s mission is to make those models better by providing direct observations of present-day crustal motion. That’s why the GNET team includes GRACE scientists and earth modelers as well as GPS experts and glaciologists.

The team used GPS to measure uplift in the crust all along Greenland’s coast. That’s when they discovered that two neighboring stations on the east coast were uplifting far more rapidly than standard models had predicted.

“We did not expect to see the anomalous uplift rates at the two stations that sit on the ‘track’ of the Iceland hot spot,” Bevis said. “We were shocked when we first saw them. Only afterwards did we make the connection.”

He added that the discovery holds big implications for measuring ice loss elsewhere in the world.

For instance, GNET has a sister network, ANET, that spans West Antarctica. It employs roughly similar numbers of GPS stations, but spread out over a vastly larger area. Unless more stations are added to ANET, anomalous rates of uplift may go undetected, Bevis cautioned, and analyses of GRACE data will lead to inaccurate estimates of ice loss in Antarctica.

The authors of the paper included Shfaquat A. Khan and Per Knudsen of the Technical University of Denmark; Ingo Sasgen and Veit Helm of the Helmholtz Centre for Polar and Marine Research; Tonie van Dam of the University of Luxembourg; Jonathan L. Bamber of the University of Bristol; John Wahr (now deceased) of the University of Colorado; Michael Willis of Cornell University; Kurt H. Kjaer and Anders A. Bjork of the University of Copenhagen; Bert Wouters and Peter Kuipers Munneke of Utrecht University; Beata Csatho of the University at Buffalo; Kevin Fleming of the GFZ German Research Center for Geosciences; and Andy Aschwanden of the University of Alaska Fairbanks.

GNET is an increasingly international project led by the USA, Denmark and Luxembourg. It is funded by the U.S. National Science Foundation and by the governments of the partner nations.

Reference:
Shfaqat A. Khan, Ingo Sasgen, Michael Bevis, Tonie Van Dam, Jonathan L. Bamber, John Wahr,†, Michael Willis, Kurt H. Kjær, Bert Wouters, Veit Helm, Beata Csatho, Kevin Fleming, Anders A. Bjørk, Andy Aschwanden, Per Knudsen and Peter Kuipers Munneke. Geodetic measurements reveal similarities between post–Last Glacial Maximum and present-day mass loss from the Greenland ice sheet. Science Advances, 2016 DOI: 10.1126/sciadv.1600931

Note: The above post is reprinted from materials provided by Ohio State University. The original item was written by Pam Frost Gorder.
Antarctic mystery solved?

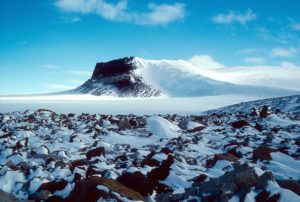
Sirius Group exposures near Mt. Fleming, Antarctica, circa 1986. The pattern of snow behind rocks shows the prevailing winds across the East Antarctic Ice Sheet. Credit: Reed Scherer, Northern Illinois University

Tiny ocean fossils distributed widely across rock surfaces in the Transantarctic Mountains point to the potential for a substantial rise in global sea levels under conditions of continued global warming, according to a new study.

The study, led by Northern Illinois University geologist Reed Scherer, indicates the massive East Antarctic Ice Sheet (EAIS) has a history of instability during ancient warm periods and could be vulnerable to significant retreat and partial collapse induced by future climate change. The EAIS is the world’s largest ice sheet and most significant player in potential sea-level rise.

The evidence is in the microscopic ocean fossils, known as diatoms, the researchers say.

For decades, scientists have been embroiled in a heated debate over how the diatoms, which were first discovered in the 1980s, became incorporated into the “Sirius Group,” a series of glacial sedimentary rocks exposed along the Transantarctic Mountains.

One group of scientists argued that the diatoms accumulated in a marine basin after ice sheet retreat and later, after it got much colder, were moved by the growing glaciers to the mountains. This interpretation suggested a dramatic retreat of the ice sheet between 3 million and 4.5 million years ago, during warm periods of the Pliocene Epoch. But other scientists contended the ice sheet remained stable for at least the past 5 million years, arguing that the diatoms were carried by the wind and deposited atop older sediments.

The new study, published Sept. 20, in Nature Communications, suggests that both sides were partially right and partially wrong — the ice sheet did retreat, and the wind did carry the diatoms.

Using sophisticated ice sheet and climate models, Scherer and colleagues found the ice sheet experienced a series of retreats and re-advances during the Pliocene warm periods, but the retreats were not as dramatic as some scientists earlier suggested. They were significant enough to uncover bays of open seawater in the Aurora and Wilkes basins, with conditions ripe for production of copious amounts of plankton diatoms.

But the retreat removed the weight of the ice, allowing previously submerged land strewn with diatoms to rise above sea level over the next few thousand years. Cyclonic winds then sent plumes of diatoms airborne, depositing them across the Transantarctic Mountains.

“The computer models indicate that the East Antarctic Ice Sheet retreated during the Pliocene by some 300 miles into the interior of East Antarctica,” Scherer said, adding that most of the West Antarctic Ice Sheet also disappeared. “So our findings indicate the Sirius diatoms were windblown, but they came from areas of reduced ice in East Antarctica, where extensive diatom-rich lands became exposed to the air.”

The Antarctic ice cap holds the majority of the world’s fresh water, and a substantial melting and retreat of the ice sheet in the future would result in raised sea levels, with devastating consequences for the world’s coastal regions.

“During certain intervals of Pliocene warmth, the sea level could have been as much as 75 feet higher than it is now,” Scherer said.

“The rise in atmospheric carbon dioxide from burning fossil fuel has now elevated the concentration to 400 parts per million, matching for the first time the levels of the warm Pliocene,” he added. “This makes the old debate about whether the ice sheet was notably smaller than it is now more relevant than ever.”

Models used for the research were developed by co-authors David Pollard of Pennsylvania State University and Robert M. DeConto of the University of Massachusetts.

“The question is always how quickly could sea levels rise, and we’re probably looking at several hundred years into the future before reaching a peak high that matches the Pliocene, but the problem of progressive sea-level rise is already upon us,” Scherer said. “The DeConto/Pollard models assume we continue to burn fossil fuels at the current pace. If we make improvements for the better, ice sheet reduction could be significantly delayed. We’d still have a problem, but we could keep the sea-level rise small and slow.”

The new research represents the first published study on the Sirius fossils that presents data directly related to or indicative of East Antarctic Ice Sheet thickness during the Pliocene.

“This latest work, together with other recent ice sheet modeling studies by DeConto and Pollard, clearly demonstrates the sensitivity of modern ice sheets to warming,” Scherer said. “No model is ever perfect, but these scientists use sophisticated physics and the latest data to produce atmospheric and ice models that are truly state-of-the-art, providing a picture of the past and glimpse into our future.”

Noted climate scientist Richard Alley, also of Penn State, rounds out the author list on the Nature Communications publication.

“This is another piece of a jigsaw puzzle that the community is rapidly putting together, and which appears to show that the ice sheets are more sensitive to warming than we had hoped,” Alley said. “If humans continue to warm the climate, we are likely to commit to large and perhaps rapid sea-level rise that could be very costly. No one piece of the puzzle shows this, but as they fit together, the picture is becoming clearer.”

The authors’ research was supported by funding from the National Science Foundation.

Reference:
Reed P. Scherer, Robert M. DeConto, David Pollard, Richard B. Alley. Windblown Pliocene diatoms and East Antarctic Ice Sheet retreat. Nature Communications, 2016; 7: 12957 DOI: 10.1038/ncomms12957

Note: The above post is reprinted from materials provided by Northern Illinois University.

Earthquakes, ‘Mars-quakes,’ and the possibility of life

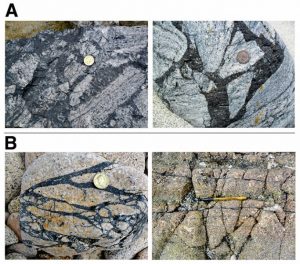
These pseudotachylites -- fine grained rocks -- are from the British Isles. Credit: Image courtesy of Yale University
These pseudotachylites — fine grained rocks — are from the British Isles. Credit: Image courtesy of Yale University

A new study shows that rocks formed by the grinding together of other rocks during earthquakes are rich in trapped hydrogen — a finding that suggests similar seismic activity on Mars may produce enough hydrogen to support life.

Researchers from Yale, the University of Aberdeen, and Brock University studied rock formations around active fault lines in the Outer Hebrides, off the coast of Scotland. Their analysis appears in the journal Astrobiology.

“Previous work has suggested that hydrogen is produced during earthquakes when rocks fracture and grind together. Our measurements suggest that enough hydrogen is produced to support the growth of microorganisms around active faults,” said Yale geologist Sean McMahon, first author of the study.

While humans and other animals get their energy mainly from the reaction between oxygen and sugar, bacteria use a wide array of alternative reactions to obtain energy. The oxidation of hydrogen gas, for example, generates enough energy for bacteria deep in the Earth’s subsurface.

“Mars is not very seismically active, but our work shows that ‘Marsquakes’ could produce enough hydrogen to support small populations of microorganisms, at least for short periods of time,” McMahon said. “This is just one part of the emerging picture of the habitability of the Martian subsurface, where other sources of energy for life may also be available. The best way to find evidence of life on Mars may be to examine rocks and minerals that formed deep underground around faults and fractures, which were later brought to the surface by erosion.”

Co-authors of the paper are John Parnell of the University of Aberdeen and Nigel Blamey of Brock University.

“NASA has plans to measure seismic activity on Mars during its 2018 InSight mission, and our data will make those measurements all the more interesting,” Parnell said.

Reference:
Sean McMahon, John Parnell, Nigel J.F. Blamey. Evidence for Seismogenic Hydrogen Gas, a Potential Microbial Energy Source on Earth and Mars. Astrobiology, 2016; 16 (9): 690 DOI: 10.1089/ast.2015.1405

Note: The above post is reprinted from materials provided by Yale University. The original item was written by Jim Shelton.

‘False’ biosignatures may complicate search for ancient life on Earth, other planets

Associate Professor Alexis Templeton and Dr. Stephen Grasby prospecting for sulfur biominerals in a yellow sulfur deposit forming on a glacier surface in the High Arctic. Credit: John Spear
Associate Professor Alexis Templeton and Dr. Stephen Grasby prospecting for sulfur biominerals in a yellow sulfur deposit forming on a glacier surface in the High Arctic.
Credit: John Spear

Self-assembling carbon microstructures created in a lab by University of Colorado Boulder researchers could provide new clues — and new cautions — in efforts to identify microbial life preserved in the fossil record, both on Earth and elsewhere in the solar system.

The geological search for ancient life frequently zeroes in on fossilized organic structures or biominerals that can serve as “biosignatures,” that survive in the rock record over extremely long time scales. Mineral elements such as sulfur are often formed through biological activity. Microbes can also produce a variety of telltale extracellular structures that resemble sheaths and stalks.

However, according to new findings published in the journal Nature Communications, carbon-sulfur microstructures that would be recognized today by some experts as biomaterials are capable of self-assembling under certain conditions, even without direct biological activity. These “false” biosignatures could potentially be misinterpreted as signs of biological activity due to their strong resemblance to microbial structures.

“Surprisingly, we found that we could create all sorts of biogenic-like materials that have the right shape, structure and chemistry to match natural materials we assume are produced biologically,” said Associate Professor Alexis Templeton of CU Boulder’s Department of Geological Sciences and senior author of the new study.

The study arose from field research in the Canadian High Arctic, where a team of scientists working with Templeton had identified sulfur-metabolizing organisms that live in shopping mall-sized mineral deposits that form on ice surfaces. Some of these sulfur deposits were returned to CU Boulder to determine whether they contained “biosignatures” that could be relevant to the search for life on Mars or Europa, one of Jupiter’s moons.

Templeton and CU-Boulder Research Associate Julie Cosmidis then set out to study the underlying mechanisms of biological sulfur mineral formation before realizing that some of the “extracellular structures” and associated sulfur minerals could be reproduced in the lab without any organisms present.

“It was very disconcerting- at first to see that the carbon-sulfur structures appear in our tests without biological activity, as they looked very microbial,” said Cosmidis, the lead study author.

“But the fact that these structures self-assemble makes their discovery even more exciting. They challenge our conception of what a biosignature is, and they can teach us about unexpected interactions between carbon and sulfur,” said Cosmidis.

The findings indicate that carbon-sulfur microstructures may no longer be surefire microbial indicators, but they are still useful for reconstructing environmental processes anywhere there is active sulfur cycling.

“We’re interested to learn how organisms mediate mineralization and commonly it is challenging to demonstrate that a mineral was produced by living organism,” said Templeton. “This research is another step forward in understanding fundamental self-assembly processes that are important to materials scientists, biologists and chemists alike.”

But while carbon-sulfur microstructures could confound efforts to identify ancient life, they may provide a roadmap to an entirely different innovation: Next-generation lithium-sulfur (Li-S) batteries.

Rechargeable Li-S batteries are considered to be a promising successor to the lithium-ion batteries that power most of today’s consumer electronics. Li-S batteries can contain up to five times the energy of lithium-ion batteries, but present a number of manufacturing hurdles that have yet to be overcome on a commercial scale.

The carbon-sulfur microstructures created in the new study, however, may solve one of the key challenges by encasing the sulfur in conductive carbon, potentially creating more electrically efficient Li-S batteries.

“We’re making materials that have the desired properties and we’re doing it by mimicking a natural environmental process,” said Templeton. “It’s a promising new pathway to battery design.”

Reference:
Julie Cosmidis, Alexis S. Templeton. Self-assembly of biomorphic carbon/sulfur microstructures in sulfidic environments. Nature Communications, 2016; 7: 12812 DOI: 10.1038/ncomms12812

Note: The above post is reprinted from materials provided by University of Colorado Boulder.
Lava flows in Pahoa 2014

This video was made to show at the Pahoa Transfer Station for schoolchildren visiting to see the new lava flows. It gives a brief history of what happened up though November 2014.

Study Seeks to Make Tsunamis Safer

Tsunami Evaculation Route

When an earthquake strikes a coastal area, it may just be the beginning of problems for nearby residents who must then seek higher ground in the event the shaking spawns a tsunami. Sacramento State Geography Professor Mathew Schmidtlein is part of a research effort aimed at giving those coastal residents a clearer path to safety.

The threat to a coastal community following an earthquake is not some longshot. More than 248,000 people have lost their lives in 155 tsunamis recorded worldwide over the last 12 years.

For the last five years, Schmidtlein and the study’s principal partner, Research Geographer Nathan Wood with the U.S. Geological Survey (USGS), have been looking at ways coastal residents can better protect themselves when a tsunami may be only minutes away.

Schmidtlein will present his team’s findings during the University’s first fall presentation in the STEM (Science, Technology, Engineering and Mathematics) series of lectures (csus.edu/nsm/successcenter). The free lecture will be presented at 6 p.m. Tuesday, Sept. 27, in the University Union, Redwood Room.

The team’s initial research expanded on previous work that created a model where the movements of individual evacuees were simulated, something like a computer game tracking what individuals might do in various scenarios.

That was a bit scenario-specific, and emergency managers were looking for something with more detail. “They essentially wanted a map that tells you how long it will take to get out of each area of a community,” Schmidtlein says.

Terrain is a major area of concern and the study looked at items such as what areas are impeded by overgrown vegetation, and how much time is added running over wet sand as compared to solid concrete. This information then is used to estimate the time needed to safely evacuate.

Demographics and the types of businesses in a given part of the community also have an impact on evacuations. For example, individuals at day care centers, retirement facilities, hospitals and tourist hotspots may face greater evacuation challenges than others.

Schmidtlein is especially proud of the real-life solutions the study can lead to. “It’s been gratifying to see people actually doing things with the research,” he says. “When you understand the relationship between how long it takes to evacuate and estimates of population, there are a number of things you can do with that.”

Mitigation measures may include keeping overgrown areas trimmed back or seeking easements through large swaths of private land to provide more direct routes to safety.

It also can determine what areas might be too far removed from safety and require a relatively new approach to tsunami protection: construction of a vertical evacuation structure, a building that will provide more immediate sanctuary above the flood waters. The first of its kind in the United States was built last year near Westport, Wash.

The tsunami project was funded by the USGS, and largely led by Schmidtlein and Wood. While it already has generated considerable information and guidelines, Schmidtlein says there’s more they can still do refining evacuation times.

“The hope is that the study results in something useful at the end,” he says. “And that’s what’s been most exciting.”

Video

Note: The above post is reprinted from materials provided by California State University, Sacramento.

Revealing Earth’s early secrets

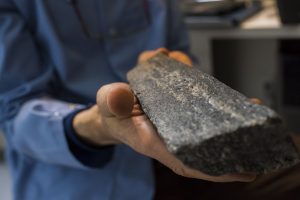
Samples of the world's oldest precisely dated rock Credit: Image courtesy of University of Alberta
Samples of the world’s oldest precisely dated rock
Credit: Image courtesy of University of Alberta

Addressing fundamental unknowns about the earliest history of Earth’s crust, scientists have precisely dated the world’s oldest rock unit at 4.02 billion years old. Driven by the University of Alberta, the findings suggest that early Earth was largely covered with an oceanic crust-like surface.

“It gives us important information about how the early continents formed,” says lead author Jesse Reimink. “Because it’s so far back in time, we have to grasp at every piece of evidence we can. We have very few data points with which to evaluate what was happening on Earth at this time.” In fact, only three locations worldwide exist with rocks or minerals older than 4 billion years old: one from Northern Quebec, mineral grains from Western Australia, and the rock formation from Canada’s Northwest Territories examined in this new study.

While it is well known that the oldest rocks formed prior to 4 billion years ago, the unique twist on Reimink’s rock is the presence of well-preserved grains of the mineral zircon, leaving no doubt about the date it formed. The sample in question was found during fieldwork by Reimink’s PhD supervisor, Tom Chacko, in an area roughly 300 kilometres north of Yellowknife. Reimink recently completed his PhD at the University of Alberta before starting a post-doctoral fellowship at the Carnegie Institute for Science in Washington, D.C.

Zircon provides rock-solid dating

“Zircons lock in not only the age but also other geochemical information that we’ve exploited in this paper,” Reimink continues. “Rocks and zircon together give us much more information than either on their own. Zircon retains its chemical signature and records age information that doesn’t get reset by later geological events, while the rock itself records chemical information that the zircon grains don’t.”

He explains that the chemistry of the rock itself looks like rocks that are forming today in modern Iceland, which is transitional between oceanic and continental crust. In fact, Iceland has been hypothesized as an analog for how continental crusts started to form.

“We examined the rock itself to analyze those chemical signatures to explore the way that the magma intrudes into the surrounding rock.” One signature in particular recorded the assimilation step of magma from Earth’s crust. “While the magma cooled, it simultaneously heated up and melted the rock around it, and we have evidence for that.”

Reimink says that the lack of signatures of continental crust in this rock, different from what the early continents were expected to look like, leads to more questions than answers. Reimink says one of the biggest challenges as a geologist is that as we travel back in time on Earth, the quantity and quality of available evidence decreases. “Earth is constantly recycling itself, the crust is being deformed or melted, and pre-history is being erased,” remarks Reimink.

“The presence of continents above water and exposed to the atmosphere has huge implications in atmospheric chemistry and the presence or absence of life. The amount of continents on Earth has a large chemical influence both on processes in the deep Earth (mantle and core) and at the Earth’s surface (atmosphere and biosphere). There are constant feedback loops between chemistry and geology. Though there are still a lot of unknowns, this is just one example that everything on Earth is intertwined.” “No evidence for Hadean continental crust within Earth’s oldest evolved rock unit” appears in the October issue of Nature Geoscience.

Reference:
J. R. Reimink, J. H. F. L. Davies, T. Chacko, R. A. Stern, L. M. Heaman, C. Sarkar, U. Schaltegger, R. A. Creaser, D. G. Pearson. No evidence for Hadean continental crust within Earth’s oldest evolved rock unit. Nature Geoscience, 2016; DOI: 10.1038/ngeo2786

Note: The above post is reprinted from materials provided by University of Alberta.

Exceptionally well-preserved fossil of complete mammoth skull raises questions

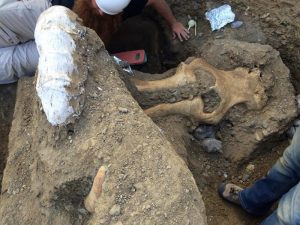
Rare mammoth fossil excavated at Channel Islands National Park. Credit: NPS
Rare mammoth fossil excavated at Channel Islands National Park.
Credit: NPS

This week a team of scientists unearthed an exceptionally well preserved fossil of a complete mammoth skull from an eroding stream bank on Santa Rosa Island within Channel Islands National Park.

The team, consisting of retired National Park Service archaeologist Don Morris, The Mammoth Site paleontologist Justin Wilkins and preparator Monica Bugbee, are fueled with questions about the find.

“This mammoth find is extremely rare and of high scientific importance. It appears to have been on the Channel Islands at the nearly same time as humans,” Wilkins said. “I have seen a lot of mammoth skulls and this is one of the best preserved I have ever seen.”

Geologists at the U.S. Geological Survey (USGS) have dated charcoal samples adjacent to the specimen to approximately 13,000 years. The dating is significant since this time period coincides with the age of Arlington Man, the oldest human skeletal remains in North America, also found on Santa Rosa Island.

The size of the specimen is unusual. It is not large enough to be readily identified as a Columbian mammoth and not small enough to definitively qualify as a pygmy mammoth. The scientists question whether the specimen could be a young Columbian mammoth or possibly an intermediate-sized mammoth.

Mammoths roamed the continent of North America approximately two million years ago, with Columbian mammoths appearing a million years later. It is believed that the Columbian mammoths migrated to the Channel Islands during the past two ice ages when sea levels were lower and the island land mass was closer to the mainland coast. Over time, descendants of the migrants downsized from approximately 14 feet to a six feet tall pygmy form, becoming an endemic species known as Mammuthus exilis.
The scientific team is particularly curious about the newly-discovered mammoth’s tusks. The right tusk protrudes 1.4 meters in a coil characteristic of an older mammal, while the shorter, sloped left tusk is more typical of a juvenile.

Upcoming measurements of the number, spacing, and thickness of the enamel plates on the specimen’s teeth will allow the scientists to age it within two years of its death. They foresee that the fossilized teeth of the mammoth will also clarify whether it is a pygmy or Columbian mammoth or, less likely, a transitional species.

USGS Geologist Dan Muhs speculates that this downsizing process from a Columbian mammoth to a pygmy could have occurred over just several thousands of years, a relatively short time span considering the drastic change in size. In 2013, Muhs found a pygmy mammoth tusk in a sea stack on the Santa Rosa Island coastline that dated to approximately 80,000 years.

“The discovery of this mammoth skull increases the probability that there were at least two migrations ofColumbian mammoths to the island — during the most recent ice age 10-30,000 years ago, as well as the previous glacial period that occurred about 150,000 years ago.” During his geologic investigations on the island’s marine terraces, Muhs also detected and recorded mammoth footprints, another rare find.

As the multidisciplinary scientific team uncovers the teeth and other parts of the mammoth they will “jacket” the specimen with burlap and plaster to protect it prior to transport by helicopter and boat to the mainland. The mammoth’s final destination will be the Santa Barbara Museum of Natural History, where it will be cleaned, preserved, studied, and curated for future public display.

Channel Islands National Park Superintendent Russel Galipeau said, “One of the purposes of the park is to provide scientific value. This project is a great example of a multidisciplinary collaboration to learn about the prehistory of the park.”

The mammoth specimen was first discovered in September 2014 by National Park Service biologist Peter Larramendy, who noticed an ivory tusk protruding from gravel sediment in the canyon wall while he was conducting a stream study.

Affectionately, the scientists have informally named the mammoth find Larry in recognition of Larramendy and their distinguished colleague, the late Larry Agenbroad, one of the world’s leading paleontologists.

Protecting Paleontological Resources

Paleontological resources at Channel Islands National Park, and particularly mammoth fossils, represent an important aspect of the scientific significance of the park. National Park Service policy guides the park to protect scientifically significant resources by collection or by on-site protection and stabilization. This mammoth skull is being collected, since it has eroded out of the stream bank and is at risk of being damaged.

Note: The above post is reprinted from materials provided by Channel Islands, National Park, California.

Diamonds help generate new record for static pressures for study

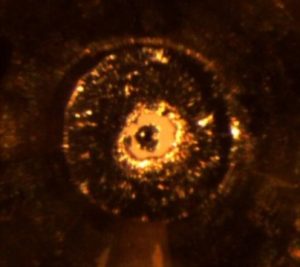
An international team working at the Advanced Photon Source at Argonne National Laboratory has devised a method for achieving static pressures vastly higher than any previously reached. Above: an image of a diamond anvil cell inside the pressure chamber. Traditionally, a diamond anvil cell works like a vice that squeezes the sample between two single-crystal diamonds to produce extreme pressure. In the new device, a miniscule ball of nano-crystalline diamonds sits atop each single-crystal diamond. As the diamonds are squeezed together, the load is transferred from the larger diamond to the nano-ball. This causes the nano-diamond balls to compress and actually get harder, allowing them to both generate and withstand extreme pressures. Credit: Image via Dubrovinskaia et al./Science
An international team working at the Advanced Photon Source at Argonne National Laboratory has devised a method for achieving static pressures vastly higher than any previously reached. Above: an image of a diamond anvil cell inside the pressure chamber. Traditionally, a diamond anvil cell works like a vice that squeezes the sample between two single-crystal diamonds to produce extreme pressure. In the new device, a miniscule ball of nano-crystalline diamonds sits atop each single-crystal diamond. As the diamonds are squeezed together, the load is transferred from the larger diamond to the nano-ball. This causes the nano-diamond balls to compress and actually get harder, allowing them to both generate and withstand extreme pressures.
Credit: Image via Dubrovinskaia et al./Science

Extraordinary things happen to ordinary materials when they are subjected to very high pressure and temperature. Sodium, a conductive metal in normal conditions, becomes a transparent insulator; gaseous hydrogen becomes a solid.

But generating the terapascal pressures — that’s ten million times the atmospheric pressure at Earth’s surface — needed to explore the most extreme conditions in the laboratory has been possible only with the use of shock waves, which generate the pressure for a very short time and then destroy samples. Now an international team working at the U.S. Department of Energy’ (DOE) Advanced Photon Source (APS), a DOE Office of Science User Facility at Argonne National Laboratory, has devised a method for achieving static pressures vastly higher than any previously reached.

“Achieving ultra-high pressures opens new horizons for a deeper understanding of matter,” said Leonid Dubrovinsky, a scientist at the University of Bayreuth, Germany, who was one of the developers of the new method. “It is of great importance for the fundamental sciences, for modeling the interior of giant planets and for the development of novel materials with unusual properties for technological applications.”

Using an innovative new device that employs transparent nano-crystalline diamonds developed for this application, Natalia Dubrovinskaia, who led the study, Dubrovinsky and collaborators achieved pressures almost 50 percent higher than the highest static pressure reached previously with standard single-stage diamond anvil cells.

“It is a huge step,” said Vitali Prakapenka, a scientist at the Center for Advanced Radiation Sources at the University of Chicago who worked on the experiments.

Dubrovinsky and colleagues designed a version of a double-stage diamond anvil cell typically used to generate high pressures. The traditional apparatus works like a vice that squeezes the sample between two single-crystal diamonds. In the new device, a miniscule ball of nano-crystalline diamonds sits atop each single-crystal diamond. As the diamonds are squeezed together, the load is transferred from the larger diamond to the nano-ball. The nano-diamond balls compress and actually get harder, allowing them to both generate and withstand extreme pressures.

The researchers further extended the capabilities of the apparatus by introducing a gasket assembly that acts as a secondary pressure chamber inside the cell, allowing them to work with gases and liquids as well as solids.

The transparency of the new nano-diamond balls opens the possibility for achieving high pressure and high temperature simultaneously. “We can shine the high power laser through the diamond anvil and through the nano-diamond as well, and heat the sample when it’s already pressurized,” said Prakapenka. “And we can then probe the sample properties in situ with synchrotron X-ray techniques.”

This ability to probe matter at ultra-high static pressures has important implications for understanding the physics and chemistry of materials. The most direct immediate application is to the study of the materials under tremendous pressure on the interiors of the giant planets. But Prakapenka suggests other possibilities.

“We can synthesize absolutely new materials with unique properties that we would never have predicted,” he said. “And we believe that there still exist some materials that we can synthesize only at high pressure, like superconductors, and then quench down, bring to ambient conditions and use. In this case it’s a very small amount — it’s only microns — but for the future application in nanorobotic technology, who knows.”

The group worked at the GeoSoilEnviro Consortium for Advanced Radiation Sources (GSECARS) beamline, which is operated by the University of Chicago at Sector 13 of the APS. The high intensity and energy of the APS’s X-ray beams were crucial for the experiments. “The beam should be intense enough to go through the diamond anvil and through the one- or two-micron sample and give you enough statistics to see diffraction from the sample,” said Prakapenka. “You need very high-intensity, high-energy X-rays to do that. It’s only possible at third-generation synchrotrons like APS.”

Also critical were GSECARS’s monochromator, optics and imaging systems, which bring the beam to the sample position, focus it down to a spot less than three microns and let the scientists see and analyze the sample in situ.

The paper, “Terapascal static pressure generation with ultrahigh yield strength nanodiamond,” was published July 20 in Science Advances.

Reference:
N. Dubrovinskaia, L. Dubrovinsky, N. A. Solopova, A. Abakumov, S. Turner, M. Hanfland, E. Bykova, M. Bykov, C. Prescher, V. B. Prakapenka, S. Petitgirard, I. Chuvashova, B. Gasharova, Y.-L. Mathis, P. Ershov, I. Snigireva, A. Snigirev. Terapascal static pressure generation with ultrahigh yield strength nanodiamond. Science Advances, 2016; 2 (7): e1600341 DOI: 10.1126/sciadv.1600341

Note: The above post is reprinted from materials provided by Argonne National Laboratory. The original item was written by Carla Reiter.

Tides stir up deep Atlantic Heat in the Arctic Ocean

Antarctic.jpg
Representative Image

Researchers have identified how warm Atlantic water that is flowing deep into the Arctic Ocean is mixing with colder waters above to contribute to sea-ice loss in the Arctic. The results, published this week in the journal Nature Geoscience, show that tidal flows in the Arctic are causing deep, warm water (originating from the Gulf Stream) to mix with cold, fresh water lying above, in turn contributing to melting the floating sea-ice.

Past research on how warm layers of ocean water mix with cold layers lying above has focused on turbulence driven by winds and waves, rather than on tidal mixing, since tidal flows around the Arctic Ocean are generally weak. However, direct measurements of turbulence from across the seasonally ice-free Arctic Ocean show that tidal motions interacting with steep sea bed slopes are in fact a major cause of vertical mixing.

Lead author, Tom Rippeth from Bangor University explains,

“Our oceans are not made up of one body of water, but contain waters of different temperatures and salinity, lying in different ‘layers’, so the Arctic Ocean is a bit like a jam sandwich, where the “bread” is the cold water layers above and below the “jam”, which is the warm, salty water that enters the Arctic from the Atlantic.  Sea-ice floating on the surface of the ocean is insulated from the heat of the Atlantic layer by the “top slice” of cold polar water.

“We studied the warm body of water from the Atlantic that represents the largest oceanic input of heat into the Arctic – it is four degrees Celsius warmer than the surrounding water, and it is the warmest it has been in nearly two thousand years. The top of the warm layer sits at depths between 40 and 200 m, and its heat slowly diffuses upwards into the cold, fresher water above, but sometimes this movement of heat can be greatly accelerated by turbulence which drives mixing. We have found that tides are producing significant amounts of turbulence over steep sea bed topography, and so are greatly enhancing the upward movement of heat in these regions.  In areas where tidal currents interact with steep sea bed slopes, this process causes mixing of the warmer waters with the over-lying colder waters, and this in turn can generate ‘hotspots’ for sea-ice melt or thinning.”

Sheldon Bacon, from the National Oceanography Centre, says,

“Arctic sea ice is likely to retreat further in coming decades, and if it does, interactions between the wind and ocean currents may strengthen. These mixing hotspots may then grow into other areas of the Arctic Ocean with steep sea bed slopes, resulting in further sea-ice retreat. We know that the Arctic is already warming faster than the rest of the planet, and other research conducted in the past few years is pointing to the impact of Arctic warming on mid-latitude weather, so the Arctic may have had a role in recent weather extremes in the US, UK and Europe. Therefore the importance of the discovery of this new mechanism for moving heat up towards the Arctic ocean surface lies in its potential to further enhance Arctic warming.”

Bangor University, the Norwegian Polar Institute (NPI) and the National Oceanography Centre (NOC) collaborated on four extensive Arctic research cruises covering the Arctic Ocean north of Svalbard, north of eastern and western Siberia, and in the Canada Basin. This was done by directly measuring turbulence around the Arctic Ocean and showing its direct correlation with tidal energy dissipation estimates made using satellite data.

The new research is part of the TEA-COSI consortium project (“The Environment of the Arctic:  Climate, Ocean, Sea Ice:  http://teacosi.org), led by Sheldon Bacon.  The project is a component of the Arctic Research Programme, a £15m programme to enhance the UK’s research effort in the Arctic, funded by the Natural Environment Research Council (NERC).

Reference:
Tom P. Rippeth, Ben J. Lincoln, Yueng-Djern Lenn, J. A. Mattias Green, Arild Sundfjord, Sheldon Bacon. Tide-mediated warming of Arctic halocline by Atlantic heat fluxes over rough topography. DOI:10.1038/ngeo2350

Note: The above post is reprinted from materials provided by Bangor University.

Giant algal bloom sheds light on formation of White Cliffs of Dover

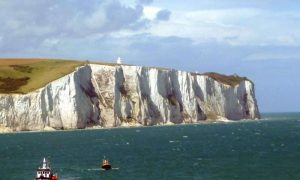
The White Cliffs of Dover have been a symbol of England at least since Roman times. New research is teaching scientists more about how this great structure came to be. Credit: Immanuel Giel, CC by 3.0 via Wikimedia Commons
The White Cliffs of Dover have been a symbol of England at least since Roman times. New research is teaching scientists more about how this great structure came to be.
Credit: Immanuel Giel, CC by 3.0 via Wikimedia Commons

A great algae bloom at the bottom of the world is teaching scientists more about how an iconic symbol of the United Kingdom came to be.

The White Cliffs of Dover span England’s southeastern coastline for 16 kilometers (10 miles) and reach as tall as 110 meters (350 feet) high. Facing the narrowest part of the English Channel, the cliffs have come to symbolize England since the time of Julius Caesar, often the first and last view travelers have of the country by sea.

The sheer cliffs are composed of white chalk, or calcite, made by coccolithophores – tiny, single-celled algae at the bottom of the marine food chain. Coccolithophores build hard, saucer-shaped calcite plates around themselves that sink and accumulate on the sea floor when the algae die, compacting and hardening into chalk. The White Cliffs’ chalk was laid down in a shallow sea above present-day England almost 100 million years ago and thrust upward by movements of the Earth’s crust.

Now, researchers outline in a new study the ocean conditions necessary for coccolithophores to flourish, conditions that likely allowed the White Cliffs to form nearly 100 million years ago. The new information comes from an unlikely source: a great bloom of coccolithophores in the Southern Ocean known as the Great Calcite Belt.

The new study, published in Global Biogeochemical Cycles, a journal of the American Geophysical Union, describes why the Great Calcite Belt exists and also clarifies coccolithophores’ role in the global carbon cycle.

The algae sequester carbon into their calcite plates but that process also increases concentrations of carbon dioxide in ocean water, according to William Balch, a biological oceanographer at Bigelow Laboratory for Ocean Sciences in East Boothbay, Maine, and lead author of the new study.

“The Great Calcite Belt is significant because this gigantic area of the ocean is full of these organisms that are fixing carbon,” Balch said.

Microscopic mirrors

Every year during the southern hemisphere’s summer, a ring of bright, reflective water encircles Antarctica. In 2011, Balch and his colleagues reported the highly reflective water was associated with a bloom of coccolithophores.

The algae act as microscopic mirrors: their calcite plates reflect light, brightening the ocean. The band of bright water in the Southern Ocean became known as the Great Calcite Belt.

“If you take the Earth and look at it upside down, it looks like a bullseye,” said Marlon Lewis, an oceanographer at Dalhousie University in Halifax, Nova Scotia who was not involved with the study. “But we didn’t know what it was and [Balch’s 2011 study] kind of nailed it.”

For the new study, Balch and his colleagues took two research cruises to the Southern Ocean in 2011 and 2012. They examined the belt’s water to determine what species of coccolithophores were present, how abundant they were and how they manage to outcompete other types of algae, such as large diatoms, in this area of ocean.

They found coccolithophores depend on concentrations of three key nutrients: nitrate, silicate, and iron. Diatoms need silicate to build glassy shells around themselves, so in areas where silicate was more abundant than nitrate, diatoms outcompeted coccolithophores. Coccolithophores, on the other hand, flourished where nitrate was more abundant than silicate. In these areas there was also enough iron for coccolithophores to thrive, but not enough for diatoms. Coccolithophores also grew better than most diatoms in low-iron regions, according to Balch.

Coccolithophores also flourish where different water masses diverge. At these boundaries, upwelling of deep water brings to the surface trace metals and nutrients coccolithophores need to survive, Balch said.

“These regions can be oases of fertilizer coming up to the surface for these plants,” he said.

The researchers also examined the role of coccolithophores in sequestering carbon. They found diatoms send more organic carbon to the deep ocean than coccolithophores do, but coccolithophores sequester carbon more efficiently.

Unexpectedly, formation of coccolithophores’ calcite plates releases carbon dioxide into the surrounding ocean water, according to the study. This effect on water chemistry may be more important to the global carbon cycle than their role in sending carbon more efficiently to the depths, Balch said.

A White Cliffs in the making?

The new study lays out the surface ocean conditions necessary for high concentrations of calcite plates from coccolithophores to form and sink to the sea floor, much as they did nearly 100 million years ago to form the White Cliffs of Dover.

But it is difficult to say whether the plates from the Great Calcite Belt will form chalk and produce a large structure like the Dover cliffs, according to Lewis. To build a Dover-like structure, many layers of calcite would need to be deposited on the seafloor over millions of years, he said.

According to Balch, there’s no guarantee this will happen, but a recent paper in the journal Geology shows calcite-rich sediments have been found directly under the Great Calcite Belt.

“While we don’t have the great cliffs of the Southern Ocean, there is solid evidence that the calcite is making it to the sea floor,” he said.

Reference:
William M. Balch et al. Factors regulating the Great Calcite Belt in the Southern Ocean and its biogeochemical significance, Global Biogeochemical Cycles (2016). DOI: 10.1002/2016GB005414

Adriana Dutkiewicz et al. Census of seafloor sediments in the world’s ocean, Geology (2015). DOI: 10.1130/G36883.1

Note: The above post is reprinted from materials provided by American Geophysical Union.

A quick step on hot lava

*** Do not try this! ***

*** This was done by a professional and only for demonstration purposes, to show how viscous the molten rock is ***

***Please consult with professional guides who are safety conscious if you are thinking about such a trip. Much of this new land is highly unstable and large chunks can fall into the ocean without warning, or you can be on top of an emptying lava tube and that can collapse. With the intense heat, sharp rocks and constantly changing lava flows, you can easily get trapped or hurt and thus should be careful and go with professional guides. ***

When the lava emerges from one of the vents at Kilauea, it comes out at 700 to 1,200 °C (1,292 to 2,192 °F), and begins to make its way to the path of least resistance.

This video shows how pressure applied to this dense material only causes a slight indentation. While this may not be surprising (it is liquid rock), I think that many people think of lava as more of a hot-watery-like substance. You would never fall into a lava lake the way you would a swimming pool, the molten rock is much more dense, so you would simply land on it, sink a little, and be burned.

Researchers Uncover Formation Mechanism of Giant Aktogai Cu Deposit

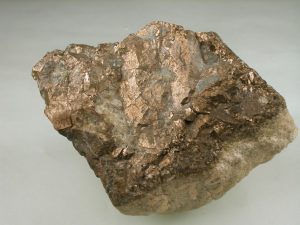
Prophyry Cu Ore Credit: Shibangchina
Prophyry Cu Ore
Credit: Shibangchina

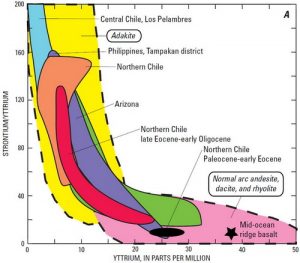
Porphyry Cu deposits are one of the world’s most valuable ore deposits providing around 75%, 50% and 20% of the world’s supply of copper, molydbenum and gold, respectively. Most ore-forming porphyries that are associated with large to giant oxidized porphyry Cu deposits at subduction zone have an affinity with high Sr/Y or adakitic rocks (Fig. 1), while barren or weakly mineralized granitoids typically have low Sr/Y features. However, the internal formations mechanisms remain poorly understood.

Associate Prof. CAO Mingjian, LI Guangming, Prof. QIN Kezhang, Institute of Geology and Geophysics, Chinese Academy of Sciences (IGGCAS), and other co-workers, have undertaken a geochronology, mineral chemistry and geochemistry study on pre-ore and ore-forming rocks to reveal the formation mechanisms at the Giant Aktogai porphyry Cu deposits. This work was published in American Journal of Science.

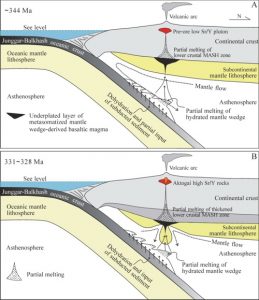
The zircon ages show that the pre-ore rocks and ore-forming porphyries formed at 344.7 and 327.7 to 331.4 Ma, respectively. Combed with previous ages (> 368 Ma), the arc-related magmatism continued for at least 40 Ma, indicating a long-lived subduction zone. Distinctly higher apatite SO3 content in the ore-forming porphyries and whole rock apatite saturation temperature relative to the pre-ore rocks suggest an increase in oxygen fugacity (fO2) and temperature during the petrogenesis of the ore-forming rocks.

Whole rock geochemistry indicates that the pre-ore rocks and ore-forming rocks have different geochemistry (low Sr/Y and high Sr/Y rocks, respectively), but both have similar isotopic (Sr-Nd-Pb-Hf-O) compositions. Very young whole rock Nd and zircon Hf model ages of 320 to 680 Ma indicate that they were come from the similar source ─ from a newly formed lower crust. They proposed that the pre-ore low Sr/Y rocks were probably formed by partial melting of normal thick juvenile lower crust under relatively reducing condition during subduction, while the high Sr/Y rocks were generated by partial melting of thickened, eclogitized and sulfide-rich juvenile lower crust under high oxidizing and temperature condition (Fig. 2).

This work confirms that highly oxidized and high Sr/Y rocks have higher mineralization potential than relatively reduced rocks with low Sr/Y ratios. In addition, the high oxygen fugacity conditions of high Sr/Y rocks might be the intermal mechanism of generating significant mineralization. Furthermore, long-lived subduction zones are potential regions to find large porphyry Cu deposit.

The study was done in collaboration with associate Prof. EVANS Noreen J.from Curtin University, Australia, and Prof. SEITMURATOVA Eleonora Yusupovha from K. Satpaev Institute of Geological Sciences, Kazakhstan.

The work was supported by National Natural Sciences Foundation of China (41402081, 41390444) and Special Fund for Scientific Research in the Public Interest of Ministry of Land and Resources of China (201411024-5).

Fig. 1. Plot of Yttrium versus Strontium for samples associated with giant porphyry Cu deposits from all over the world (image from Porphyry Copper Deposit Model, 2010).
Fig. 2. Schematic illustration showing the petrogeneticmodels for the pre-ore rocks and ore-forming high Sr/Y porphyries at the Aktogai deposit.

Reference:
Ming-Jian Cao, Guang-Ming Li, Ke-Zhang Qin, Noreen J. Evans and Eleonora Yusupovha Seitmuratova. Assessing the magmatic affinity and petrogenesis of granitoids at the giant Aktogai porphyry Cu deposit, Central Kazakhstan. DOI: 10.2475/07.2016.02

Note: The above post is reprinted from materials provided by Chinese Academy of Sciences.

World’s second-largest meteorite discovered in Argentina

The Campo del Cielo meteorite field where Gancedo was discovered translates to 'field of heaven' Credit: Ministerio de Gobierno/Facebook
The Campo del Cielo meteorite field where Gancedo was discovered translates to ‘field of heaven’
Credit: Ministerio de Gobierno/Facebook

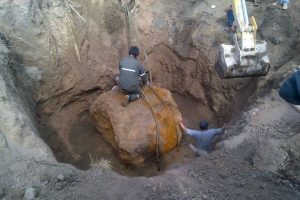
The second-largest meteorite ever found has been exhumed outside the small Argentinian town of Gancedo.

The 30-tonne rock, named after the town, was discovered on September 10 and dug up by an excavation team which was shocked by its massive size.

“While we hoped for weights above what had been registered, we did not expect it to exceed 30 tonnes,” Astronomy Association of Chaco president Mario Vesconi said.

It is believed to have crashed to earth about 4,000 years ago as part of an iron meteorite shower covering hundreds of square kilometres, 1,000km north-west of Buenos Aires at a site now known as Campo del Cielo.

The original asteroid is estimated to have weighed about 600 tonnes and entered Earth’s atmosphere at 14,000 kilometres per hour, where it broke up into a shower of smaller meteorites, according to Scientific American.

Many of the smaller meteorites have been stolen from Campo del Cielo by tourists collecting souvenirs and meteorite traffickers.

Scientists say Gancedo will be reweighed to get an exact measurement.

The largest meteorite ever discovered, called Hoba, crash-landed in Namibia about 80,000 years ago and weighed 66 tonnes.

Hoba was discovered in 1920 by a farmer ploughing his field with an ox.

It remains in place as it was too large to relocate.

Video

Top 10 Worst Tsunamis

Sumatra, Indonesia – 26 December 2004

Sumatra, Indonesia - 26 December 2004

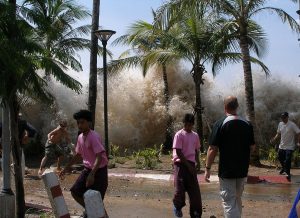
The 9.1 magnitude earthquake off the coast of Sumatra was estimated to occur at a depth of 30 km. The fault zone that caused the tsunami was roughly 1300 km long, vertically displacing the sea floor by several metres along that length. The ensuing tsunami was as tall as 50 m, reaching 5 km inland near Meubolah, Sumatra. This tsunami is also the most widely recorded, with nearly one thousand combined tide gauge and eyewitness measurements from around the world reporting a rise in wave height, including places in the US, the UK and Antarctica. An estimated US$10b of damages is attributed to the disaster, with around 230,000 people reported dead.

North Pacific Coast, Japan – 11 March 2011


North Pacific Coast, Japan - 11 March 2011

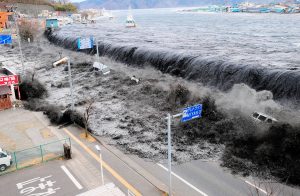
A powerful tsunami travelling 800km per hour with 10m-high waves swept over the east coast of Japan, killing more than 18,000 people. The tsunami was spawned by an 9.0 magnitude earthquake that reached depths of 24.4km- making it the fourth-largest earthquake ever recorded. Approximately 452,000 people were relocated to shelters, and still remain displaced from their destroyed homes. The violent shaking resulted in a nuclear emergency, in which the Fukushima Daiichi nuclear power plant began leaking radioactive steam. The World Bank estimates that it could take Japan up to five years to financially overcome the $235 billion damages.

Lisbon, Portugal – 1 November 1755

Lisbon 1755, from the archives of Art and History, Berlin

A magnitude 8.5 earthquake caused a series of three huge waves to strike various towns along the west coast of Portugal and southern Spain, up to 30 m high, in some places. The tsunami affected waves as far away as Carlisle Bay, Barbados, where waves were said to rise by 1.5 m. The earthquake and ensuing tsunami killed 60,000 in the Portugal, Morocco and Spain.

Krakatau, Indonesia – 27 August 1883

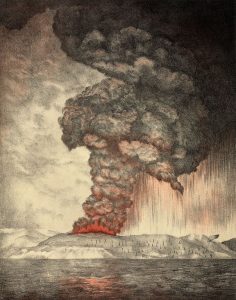
An 1888 lithograph of the 1883 eruption of Krakatoa.

This tsunami event is actually linked to the explosion of the Krakatau caldera volcano. Multiple waves as high as 37 m were propagated by the violent eruptions and demolished the towns of Anjer and Merak. The sea was reported to recede from the shore at Bombay, India and is said to have killed one person in Sri Lanka. This event killed around 40,000 people in total; however, as many as 2,000 deaths can be attributed directly to the volcanic eruptions, rather than the ensuing tsunami.

Enshunada Sea, Japan – 20 September 1498

Enshunada Sea, Japan - 20 September 1498

An earthquake, estimated to have been at least magnitude 8.3, caused tsunami waves along the coasts of Kii, Mikawa, Surugu, Izu and Sagami. The waves were powerful enough to breach a spit, which had previously separated Lake Hamana from the sea. There were reports of homes flooding and being swept away throughout the region, with a total of at least 31,000 people killed.

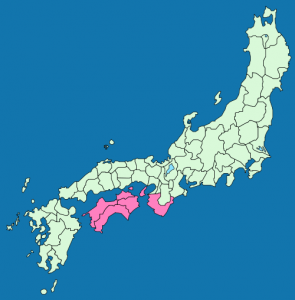
Nankaido, Japan – 28 October 1707

Nankaido, Japan - 28 October 1707

A magnitude 8.4 earthquake caused sea waves as high as 25 m to hammer into the Pacific coasts of Kyushyu, Shikoku and Honshin. Osaka was also damaged. A total of nearly 30,000 buildings were damaged in the affected regions and about 30,000 people were killed. It was reported that roughly a dozen large waves were counted between 3 pm and 4 pm, some of them extending several kilometres inland at Kochi.

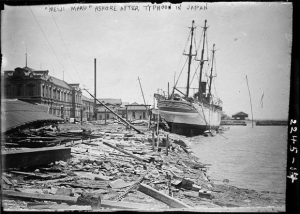
Sanriku, Japan – 15 June 1896

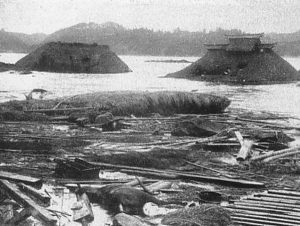
Sanriku Great Tsunami

This tsunami propagated after an estimated magnitude 7.6 earthquake occurred off the coast of Sanriku, Japan. The tsunami was reported at Shirahama to have reached a height of 38.2 m, causing damage to more than 11,000 homes and killing some 22,000 people. Reports have also been found that chronicle a corresponding tsunami hitting the east coast of China, killing around 4000 people and doing extensive damage to local crops.

Northern Chile – 13 August 1868

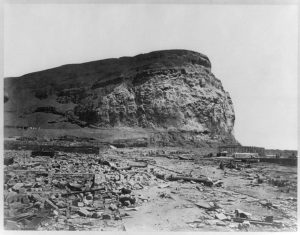
Arica after the earthquake (1868)

This tsunami event was caused by a series of two significant earthquakes, estimated at a magnitude of 8.5, off the coast of Arica, Peru (now Chile). The ensuing waves affected the entire Pacific Rim, with waves reported to be up to 21 m high, which lasted between two and three days. The Arica tsunami was registered by six tide gauges, as far off as Sydney, Australia. A total of 25,000 deaths and an estimated US$300 million in damages were caused by the tsunami and earthquakes combined along the Peru-Chile coast.

Ryuku Islands, Japan – 24 April 1771

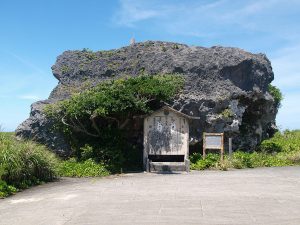
Obi-iwa, Shimoji Island, Miyakojima, Okinawa, Japan

A magnitude 7.4 earthquake is believed to have caused a tsunami that damaged a large number of islands in the region; however, the most serious damage was restricted to Ishigaki and Miyako Islands. It is commonly cited that the waves that struck Ishigaki Island was 85.4 m high, but it appears this is due to a confusion of the original Japanese measurements, and is more accurately estimated to have been around 11 to 15 m high. The tsunami destroyed a total of 3,137 homes, killing nearly 12,000 people in total.

Ise Bay, Japan – 18 January 1586

Ise Bay, Japan - 18 January 1586

The earthquake that caused the Ise Bay tsunami is best estimated as being of magnitude 8.2. The waves rose to a height of 6m, causing damage to a number of towns. The town of Nagahama experienced an outbreak of fire as the earthquake first occurred, destroying half the city. It is reported that the nearby Lake Biwa surged over the town, leaving no trace except for the castle. The Ise Bay tsunamis caused more than 8000 deaths and a large amount damage.

How To Make Bismuth Crystals At Home

Bismuth is non-toxic and has a number of very interesting properties. For best results I recommend using at least 4 or 5 pounds of bismuth for the surface crystallization method demonstrated in the video. The deeper the pool of bismuth is in the pan the better, because the crystals will have extra room to grow before they touch the bottom. The more you use the more impressive your results will be.

Some of you that are familiar with other forms of crystal formation may be thinking I gave bad advice when I state in the video that you can move the crystals as they grow. Usual crystal growth requires a very still solution with no movement, and a very slow cool down period. I did quite a lot of experimenting with this method and found that bismuth does not behave quite the same way. Once the crystals have begun forming it does not seem to matter if they are moved so long as they remain submerged. Further structured growth happens regardless of disturbance once there is a point to nucleate from.

You may also notice that I was not wearing gloves for a portion of the video, that was foolish of me. I was wearing eye protection the entire time. Leather gloves (not synthetic!) and lab goggles should always be worn in case of splashes or spills.

Best Astronomy Photos of 2016

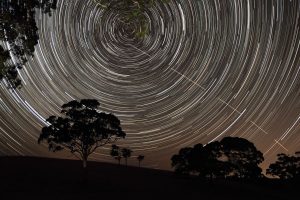
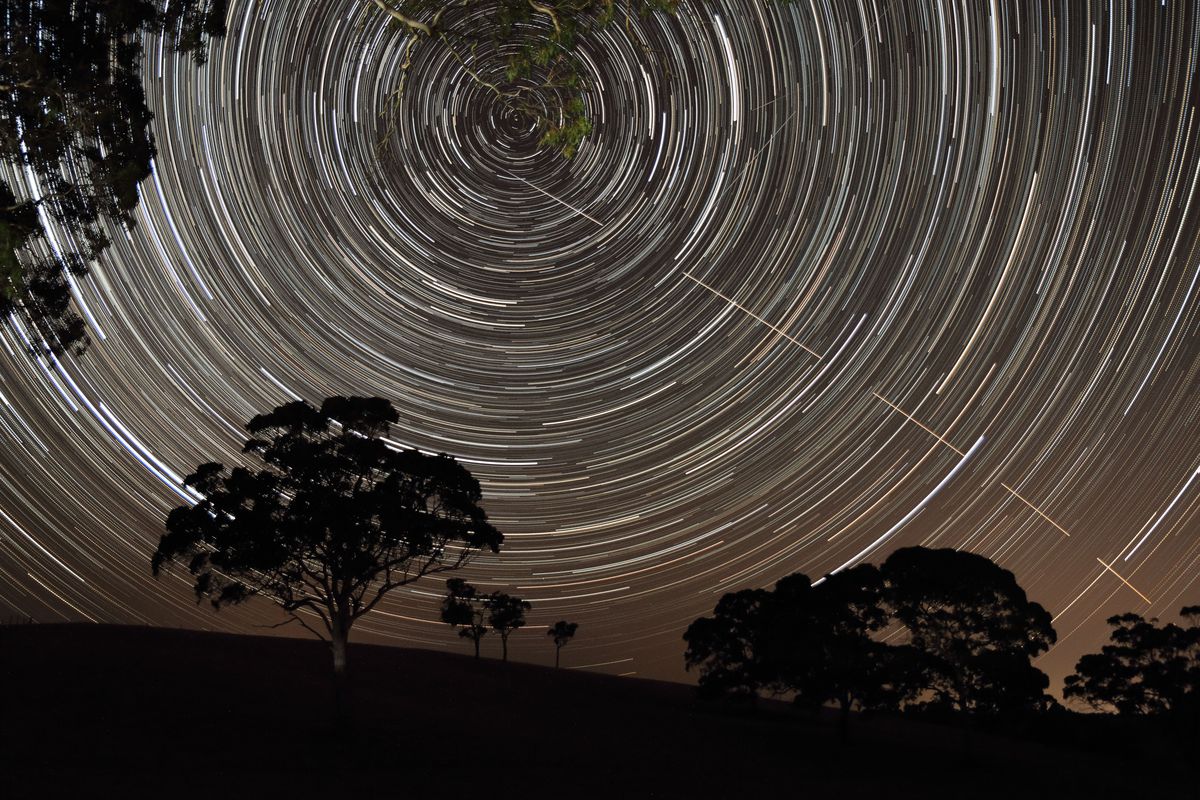
The International Space Station appears to pierce a path across the radiant, concentric star trails seemingly spinning over the silhouettes of the trees in Harrogate, South Australia. Highly Commended in the "Young Astronomy Photographer" category. Image: Scott Carnie-Bronca
The International Space Station appears to pierce a path across the radiant, concentric star trails seemingly spinning over the silhouettes of the trees in Harrogate, South Australia. Highly Commended in the “Young Astronomy Photographer” category. Image: Scott Carnie-Bronca

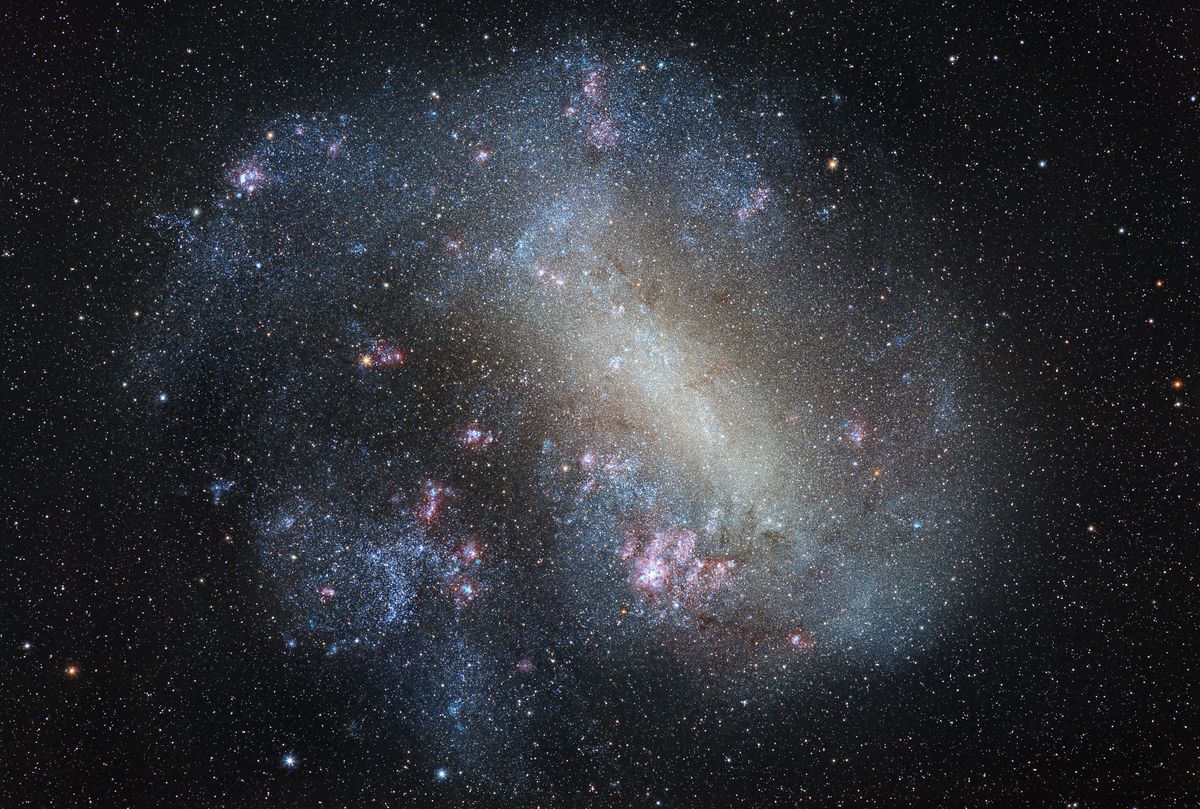
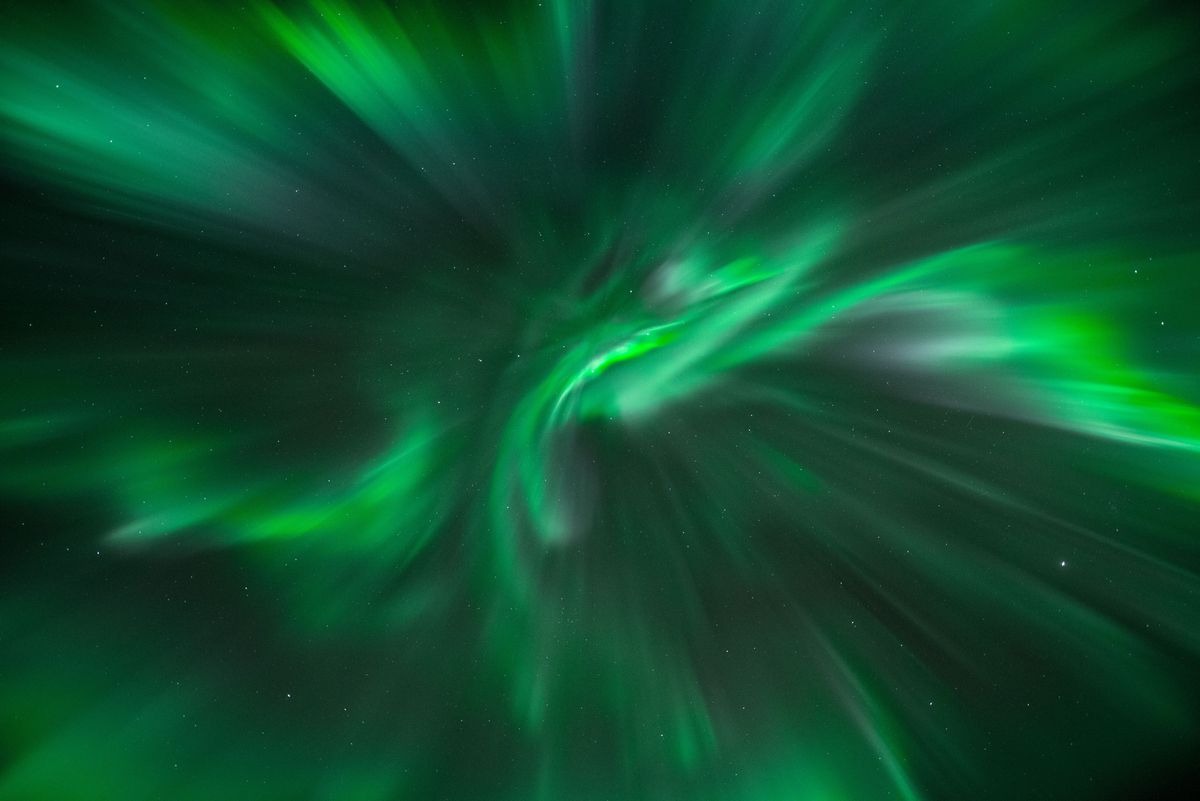
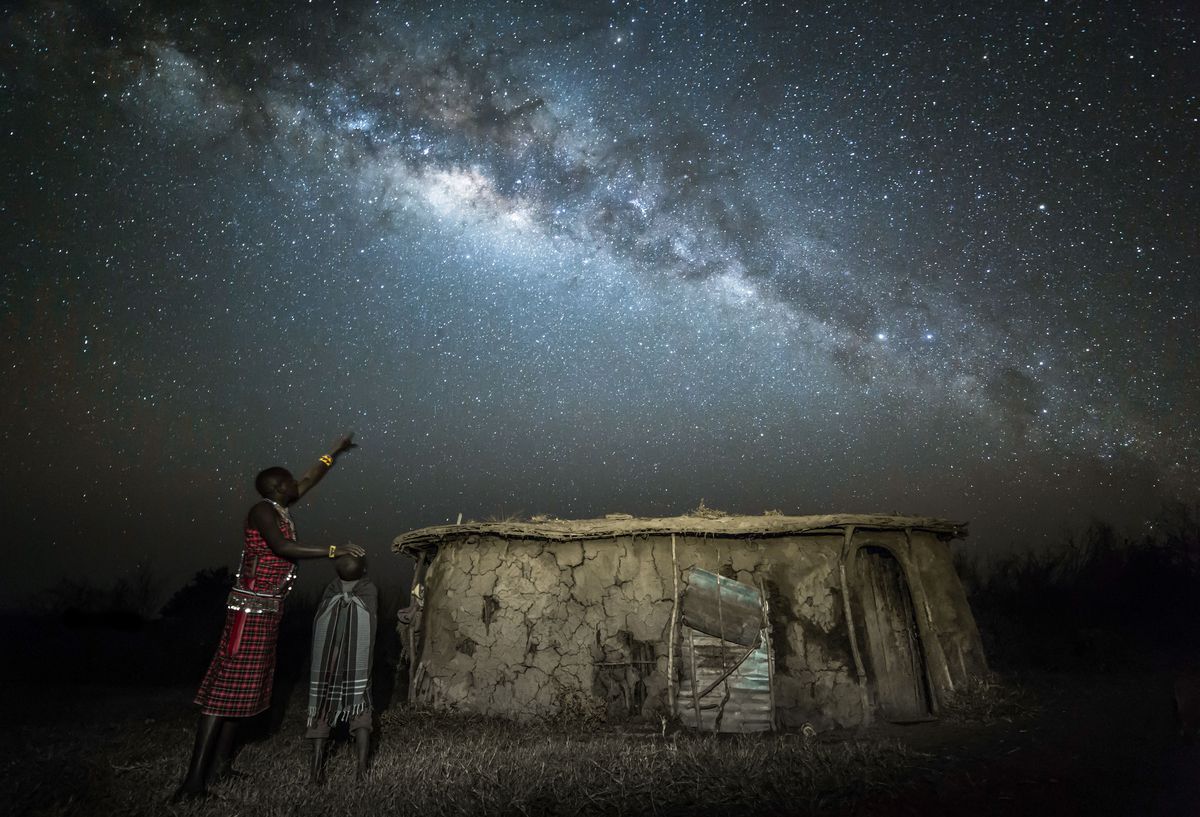
View the spectacular images by the 2016 Insight Astronomy Photographer of the Year winners for each category, the Young Competition, as well as our Robotic Scope prize and Sir Patrick Moore for Best Newcomer prize winners. These pictures capture all manner of celestial spectacles: moons, stars, planets, galaxies, nebulae and some of the great astronomical events of the last year.

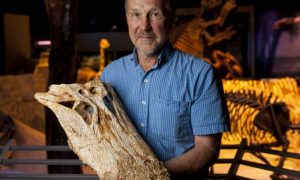
A reptilian anachronism: American alligator older than we thought

New study also shows it shared ancient Florida with giant crocodiles. Credit: Kristen Grace
New study also shows it shared ancient Florida with giant crocodiles.
Credit: Kristen Grace

From climate to the peninsula’s very shape, not much in Florida has stayed the same over the last 8 million years.

Except, it turns out, alligators.

While many of today’s top predators are more recent products of evolution, the modern American alligator is a reptile quite literally from another time. New University of Florida research shows these prehistoric-looking creatures have remained virtually untouched by major evolutionary change for at least 8 million years, and may be up to 6 million years older than previously thought. Besides some sharks and a handful of others, very few living vertebrate species have such a long duration in the fossil record with so little change.

“If we could step back in time 8 million years, you’d basically see the same animal crawling around then as you would see today in the Southeast. Even 30 million years ago, they didn’t look much different,” said Evan Whiting, a former UF undergraduate and the lead author of two studies published during summer 2016 in the Journal of Herpetology and Palaeogeography, Palaeoclimatology, Palaeoecology that document the alligator’s evolution – or lack thereof. “We were surprised to find fossil alligators from this deep in time that actually belong to the living species, rather than an extinct one.”

Whiting, now a doctoral student at the University of Minnesota, describes the alligator as a survivor, withstanding sea-level fluctuations and extreme changes in climate that would have caused some less-adaptive animals to rapidly change or go extinct. Whiting also discovered that early American alligators likely shared the Florida coastline with a 25-foot now-extinct giant crocodile.

In modern times, however, he said alligators face a threat that could hinder the scaly reptiles’ ability to thrive like nothing in their past—humans.

Despite their resilience and adaptability, alligators were nearly hunted to extinction in the early 20th century. The Endangered Species Act has significantly improved the number of alligators in the wild, but there are still ongoing encounters between humans and alligators that are not desirable for either species and, in many places, alligator habitats are being destroyed or humans are moving into them, Whiting said.

“The same traits that allowed alligators to remain virtually the same through numerous environmental changes over millions of years can become a bit of a problem when they try to adapt to humans,” Whiting said. “Their adaptive nature is why we have alligators in swimming pools or crawling around golf courses.”

Whiting hopes his research findings serve to inform the public that the alligator was here first, and we should act accordingly by preserving the animal’s wild populations and its environment. By providing a more complete evolutionary history of the alligator, his research provides the groundwork for conserving habitats where alligators have dominated for millions of years.

“If we know from the fossil record that alligators have thrived in certain types of habitats since deep in time, we know which habitats to focus conservation and management efforts on today,” Whiting said.

Study authors began re-thinking the alligator’s evolutionary history after Whiting examined an ancient alligator skull, originally thought to be an extinct species, unearthed in Marion County, Florida, and found it to be virtually identical to the iconic modern species. He compared the ancient skull with dozens of other fossils and modern skeletons to look at the whole genus and trace major changes, or the lack thereof, in alligator morphology.

Whiting also studied the carbon and oxygen compositions of the teeth of both ancient alligators and the 20- to 25-foot extinct crocodile Gavialosuchus americanus that once dominated the Florida coastline and died out about 5 million years ago for unknown reasons. The presence of alligator and Gavialosuchus fossils at several localities in north Florida suggest the two species may have coexisted in places near the coast, he said.

Analysis of the teeth suggests, however, that the giant croc was a marine reptile, which sought its prey in ocean waters, while alligators tended to hunt in freshwater and on land. That doesn’t mean alligators weren’t occasionally eaten by the monster crocs, though.

“Evan’s research shows alligators didn’t evolve in a vacuum with no other crocodilians around,” said co-author David Steadman, ornithology curator at the Florida Museum of Natural History at the University of Florida. “The gators we see today do not really compete with anything, but millions of years ago it was not only competing with another type of crocodilian, it was competing with a much larger one.”

Steadman said the presence of the ancient crocodile in Florida may have helped keep the alligators in freshwater habitats, though it appears alligators have always been most comfortable in freshwater.

While modern alligators do look prehistoric as they bake on sandbars along the Suwannee River or stroll down sidewalks on the UF campus, study authors said they are not somehow immune to evolution. On the contrary, they are the result of an incredibly ancient evolutionary line. The group they belong to, Crocodylia, has been around for at least 84 million years and has diverse ancestors dating as far back as the Triassic, more than 200 million years ago.

Other study co-authors were John Krigbaum with UF’s anthropology department and Kent Vliet with UF’s biology department.

Note: The above post is reprinted from materials provided by University of Florida.

What dinosaurs’ colour patterns say about their habitat

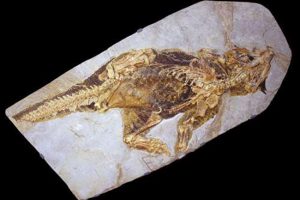
Psittacosaurus, early Cretaceous (120 million years old), preserving skin with colour patterns, Senckenberg Museum, Frankfurt, Germany. Credit: Jakob Vinther and Robert Nicholls
Psittacosaurus, early Cretaceous (120 million years old), preserving skin with colour patterns, Senckenberg Museum, Frankfurt, Germany.
Credit: Jakob Vinther and Robert Nicholls

After reconstructing the colour patterns of a well-preserved dinosaur from China, researchers from the University of Bristol have found that the long-lost species Psittacosaurus (meaning “parrot lizard”, a reference to its parrot-like beak) was light on its underside and darker on top.

This colour pattern, known as countershading, is a common form of camouflage in modern animals.

The study published today in Current Biology led the researchers to conclude that Psittacosaurus most likely lived in an environment with diffuse light, such as in a forest, and has produced the most life-like reconstruction of a dinosaur ever created.

Dr Jakob Vinther from the Schools of Earth Sciences and Biological Sciences, said: “The fossil, which is on public display at the Senckenberg Museum of Natural History in Germany, preserves clear countershading, which has been shown to function by counter-illuminating shadows on a body, thus making an animal appear optically flat to the eye of the beholder.”

Behavioural ecologist Professor Innes Cuthill from the School of Biological Sciences, added: “By reconstructing a life-size 3D model, we were able to not only see how the patterns of shading changed over the body, but also that it matched the sort of camouflage which would work best in a forested environment.”

Countershading most likely served to protect Psittacosaurus – an early relative of the triceratop – against predators that use patterns of shadow on an object to determine shape, just as humans do.

Dr Vinther realised that structures previously thought to be artifacts or dead bacteria in fossilized feathers were actually “melanosomes”, small structures that carry melanin pigments found in the feathers and skin of many animals.

In some well-preserved specimens, such as the Psittacosaurus the researchers worked on in the new study, it’s possible to make out the patterns of preserved melanin without the aid of a microscope.

Professor Innes and colleagues at Bristol had also been exploring the distribution of countershading in modern animals. But it was no easy matter to apply the same principles to an extinct animal that had been crushed flat and fossilized.

To explore this idea further they teamed up with local palaeoartist, Bob Nicholls in order to reconstruct the remarkable fossil in to a physical model which, they say, is the most scientifically accurate life-size model of a dinosaur with its real color patterns.

Days of careful studies of the fossil, taking measurements of the bones, studying the preserved scales and the pigment patterns, with input on muscle structure from Bristol palaeontologists Professor Emily Rayfield and Dr Stephan Lautenschlager, led to months of careful modelling of the dinosaur.

Bob Nicholls said: “Our Psittacosaurus was reconstructed from the inside-out. There are thousands of scales, all different shapes and sizes, and many of them are only partially pigmented.  It was a painstaking process but we now have the best suggestion as to what this dinosaur really looked like.”

In order to investigate what environment the psittacosaur had evolved to live in, Dr Vinther, Bob Nicholls and Professor Cuthill took another cast of the model and painted it all grey.

They then placed it in the Cretaceous plant section of Bristol Botanic Garden and photographed it under an open sky and underneath trees to see how the shadow was cast under those conditions.

By comparing the shadow to the pattern in the fossil they could then predict what environment the psittacosaur lived in.

Dr Vinther said: “We predicted that the psittacosaur must have lived in a forest. This demonstrates that fossil colour patterns can provide not only a better picture of what extinct animals looked like, but they can also give new clues about extinct ecologies and habitats.

“We were amazed to see how well these color patterns actually worked to camouflage this little dinosaur.”

Psittacosaurus, which Professor Cuthill describes as “both weird and cute, with horns on either side of its head and long bristles on its tail” lived in the early Cretaceous of China and has been found in the same rock strata where many feathered dinosaurs have been found.

Those deposits also include evidence for a forest environment based on plant and wood fossils.

The researchers say that they’d now like to explore other types of camouflage in fossils and to use this evidence in understanding how predators could perceive the environment and to understand their role in shaping evolution and biodiversity.

Reference:
Vinther, J., Nicholls, R., Lautenschlager, S., Pittman, M., Kaye, T. G., Rayfield, E., Mayr, G. and Cuthill, I. C. 2016. 3D Camouflage in an Ornithischian Dinosaur. Current Biology. DOI: 10.1016/j.cub.2016.06.065

Note: The above post is reprinted from materials provided by University of Bristol.

Study Finds Earthquakes Can Trigger Near-Instantaneous Aftershocks on Different Faults

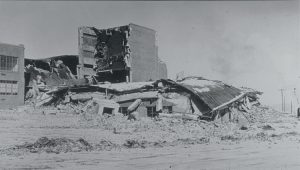
A photograph of damage to Helena High School, which collapsed following a major aftershock from the 1935 magnitude 6.2 earthquake near Helena, Montana. Credit: NOAA National Geophysical Data Center

According to a new study by scientists at Scripps Institution of Oceanography at the University of California San Diego, a large earthquake on one fault can trigger large aftershocks on separate faults within just a few minutes. These findings have important implications for earthquake hazard prone regions like California where ruptures on complex fault systems may cascade and lead to mega-earthquakes.

In the study, published in the Sept. 9 issue of the journal Science, Scripps geophysicist Peter Shearer and Scripps graduate student Wenyuan Fan discovered 48 previously unidentified large aftershocks from 2004 to 2015 that occurred within seconds to minutes after magnitude 7 to 8 earthquakes on faults adjacent to the mainshock ruptures.

In one instance along the Sundra arc subduction zone, where the magnitude 9 Sumatra-Andaman mega-earthquake occurred off the coast of Indonesia in 2004, a magnitude 7 quake triggered two large aftershocks over 200 kilometers (124 miles) away. These aftershocks miles away reveal that stress can be transferred almost instantaneously by the passing seismic waves from one fault to another within the earthquake fault system.

“The results are particularly important because of their seismic hazard implications for complex fault systems, like California,” said Fan, the lead author of the study. “By studying this type of triggering, we might be able to forecast hosting faults for large earthquakes.”

Large earthquakes often cause aftershock sequences that can last for months. Scientists generally believe that most aftershocks are triggered by stress changes caused by the permanent movement of the fault during the main seismic event, and mainly occur near the mainshock rupture where these stress changes are largest. The new findings show that large early aftershocks can also be triggered by seismic wave transients, where the locations of the main quake and the aftershock may not be directly connected.

“Multiple fault system interactions are not fully considered in seismic hazard analyses, and this study might motivate future modeling efforts to account for these effects,” said Shearer, the senior author of the study.

The National Science Foundation funded the study.

Note: The above post is reprinted from materials provided by University of California, San Diego.

MOST POPULAR

MORE ARTICLES