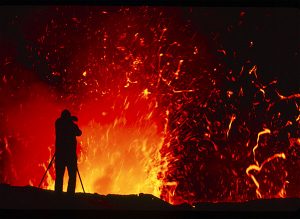
Mexico’s Colima Volcano increased its activity on Friday “Sep 30, 2016”, forcing the evacuation of several nearby communities.
Dramatic timelapse video captured part of Friday’s eruption.
Colima’s state government ordered the evacuation of La Becerrera and La Yerbabuena, while the state of Jalisco evacuated the town of Juan Barragan.
Earlier on Friday, authorities said the activity posed a threat to population, so they extended their exclusion area to a distance of 12 kilometres (7.5 miles) from the volcano’s crater.
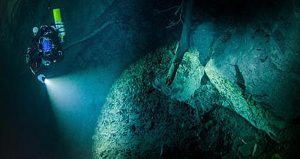
In this underwater photo taken Aug. 15, 2015 in the flooded Hranicka Propast, or Hranice Abyss, in the Czech Republic is seen Polish explorer Krzysztof Starnawski exploring the limestone abyss and preparing for deeper exploration with the use of a remotely-operated underwater robot, or ROV. On Sept. 27, 2016, the robot went to the record depth of 404 meters (1,325 feet) revealing the abyss to be the world’s deepest flooded cave, during the ‘Hranicka Propast – step beyond 400m’ expedition led by Starnawski and partly funded by the National Geographic. Credit: Krzysztof Starnawski of EXPEDITION via AP
A team of explorers say they’ve discovered that a cave in the eastern Czech Republic is the world’s deepest flooded fissure, going at least 404 meters (1,325 feet) deep.
Polish explorer Krzysztof Starnawski, who led the team, told The Associated Press on Friday that he felt like a “Columbus of the 21th century” to have made the discovery near the Czech town of Hranice.
Starnawski, 48, determined Tuesday that the flooded limestone Hranicka Propast, or Hranice Abyss, which divers, including him, have explored for decades in its upper parts, was at least 404 meters deep. He scuba dived to a narrow slot in the rock formation at 200 meters down, then sent a remotely operated underwater robot, or ROV, that went to the depth of 404 meters, or the length of its cord, but still did not hit the bottom.
In 2015, Starnawski himself passed through the slot and went to 265 meters down without reaching the cave’s bottom, which made him want to do more exploring. But after diving that far down, Starnawski had to spend over six hours in a decompression chamber, and decided he needed a robot instead.
Speaking on the phone from his home in Krakow, southern Poland, Starnawski said Tuesday’s discovery makes Hranice Abyss the world’s deepest known underwater cavity, beating the previous record-holder, a flooded sinkhole in Italy called Pozzo del Merro, by 12 meters (39 feet).
The Czech Speleological Society said it thinks the cave is even deeper and will yield additional records. When the robot was 404 meters deep “it was as deep as its rope could go, but the bottom was still nowhere in sight,” the society said
Diving in the cave is a challenge, because of its muddy areas and a water temperature of 15 degrees Celsius (59 degrees Fahrenheit). The water’s mineral composition also damages equipment and injures exposed skin, Starnawski said.
“But that is the only price to be paid for this discovery, and it was worth paying,” he said.
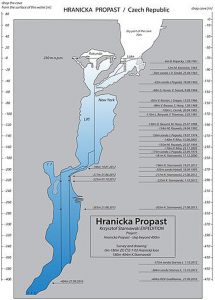
A cross-section map he made of the cave ends with question marks in an unexplored area where he believes the fissure goes deeper.
On Saturday, he plans to dive to 200 meters again to bring the robot back through the narrow passage. The device was made especially for the expedition and operated by a Polish firm, GRALmarine.
Starnawski said National Geographic, which first reported the discovery , covered some of the expedition’s cost.
This map made available to The Associated Press by Polish explorer Krzysztof Starnawski on Friday, Sept. 30, 2016, shows a cross-section of the flooded Hranicka Propast, or Hranice Abyss, in the Czech Republic that Starnawski’s Czech and Polish team recently revealed to be the world’s deepest known flooded cave. On Sept. 27, 2016, the team used a remotely-operated underwater robot, or ROV, to search for the cave’s bottom. It went to the record depth of 404 meters (1,325 feet) but still has not found the bottom, during the ‘Hranicka Propast – step beyond 400m’ expedition led by Starnawski and partly funded by the National Geographic. Credit: Krzysztof Starnawski Expedition via AP
Note: The above post is reprinted from materials provided by AP.
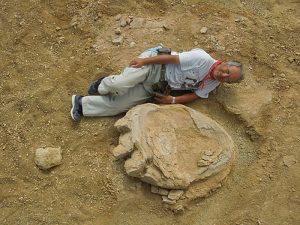
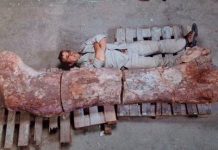
Okayama University of Science Professor Shinobu Ishigaki poses next to a dinosaur footprint in the Gobi Desert
One of the biggest dinosaur footprints ever recorded has been unearthed in the Gobi Desert, researchers said Friday, offering a fresh clue about the giant creatures that roamed the earth millions of years ago.
A joint Mongolian-Japanese expedition found the giant print, which measures 106 centimetres (42 inches) long and 77 centimetres wide.
One of several footprints discovered in the vast Mongolian desert, the huge fossil was discovered last month in a geologic layer formed between 70 million and 90 million years ago, researchers said.
It was naturally cast, as sand flowed into dents that had been left by the creature stomping on the once muddy ground.
The footprint is believed to have belonged to Titanosaur, a long-necked dinosaur, and could have been more than 30 metres long and 20 metres tall, according researchers.
“This is a very rare discovery as it’s a well-preserved fossil footprint that is more than a metre long with imprints of its claws,” said a statement issued by Okayama University of Science.
The Japanese university has been involved in the study with the Mongolian Academy of Science.
Note: The above post is reprinted from materials provided by AFP.
Geodynamic modelling relies on knowing the ‘viscosity’ or resistance to changing shape of Earth’s outer layers. Credit: Jiashun Hu, University of Illinois
Scientists have developed a method to estimate weakness in Earth’s outer layers which will help explain and predict volcanic activity and earthquakes.
Published in the journal Science today, the research describes a new model of Earth’s movement in the upper crust through to upper mantle (400km below the surface), allowing predictions at a much smaller scale than previously possible.
The research is a collaboration between researchers at the University of Illinois in the US and University of Adelaide in Australia.
Geodynamic modelling relies on knowing the ‘viscosity’ or resistance to changing shape of Earth’s outer layers.
“Producing realistic models of these movements has been difficult because the small scale variations in viscosity are often poorly known,” says co-author Dr Derrick Hasterok, from the University of Adelaide’s School of Physical Sciences.
“In essence, we’ve developed a method to estimate small scale (between one and 10 kilometer) variations of viscosity within the upper 400 km of Earth’s crust using surface-based electromagnetic imaging techniques.”
The resulting model allows the dramatic improvement of flow models which can be used to make predictions about the forces driving tectonic plate deformation and sources of potential seismic and volcanic activity.
“This method will aid our understanding of the processes happening that cause earthquakes and volcanic activity,” says Dr Hasterok. “We’ll be able to see why earthquakes and volcanoes have occurred in the past and look for places where this might potentially happen in the future.”
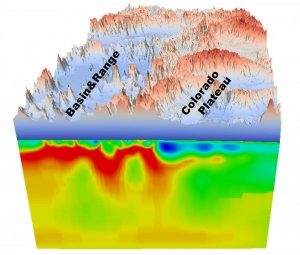
The method they have developed uses an electromagnetic imaging technique called magnetotellurics to estimate the electrical conductivity beneath Earth’s surface.
“The same factors which affect electrical conductivity ─ temperature, water content, and the presence of molten material (magma) ─ also affect the viscosity or strength. The hotter, wetter or more molten, the weaker the structure,” says lead author Dr Lijun Liu, from the University of Illinois.
“We’ve been able to look at processes operating beneath Earth’s surface at a much smaller scale than previous geodynamic modelling.”
The researchers used data from a magnetotelluric survery of western United States to show their model works. Currently there is a continent-wide project mapping the Australian upper mantle using the same electromagnetic technique, and the researchers believe applying this data to their new model will bring improved understanding of volcanic and earthquake activity along the southeastern and eastern coast of Australia.
Reference:
Lijun Liu, Derrick Hasterok. High-resolution lithosphere viscosity and dynamics revealed by magnetotelluric imaging. Science, September 2016 DOI: 10.1126/science.aaf6542
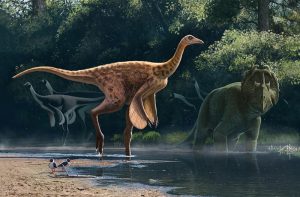
An international group of researchers led by Bradley McFeeters, currently a Ph.D. student at Carleton University in Ottawa, Canada, has announced the discovery of a new ostrich-mimic dinosaur, Rativates evadens, from the lower Dinosaur Park Formation near Dinosaur Provincial Park, Alberta. The new species lived about 76 million years ago during the Late Cretaceous Period. Research describing the new species is published online in the Journal of Vertebrate Paleontology.
Based on a partial skeleton collected by the Royal Ontario Museum in 1934 from badlands adjacent to what is now Dinosaur Provincial Park, Rativates (RAT-iv-ATE-eez) would have resembled a modern ostrich, but with long, fingered arms instead of wings, and a long tail. It would have been approximately 3.3 meters (11 feet) long, about 1.5 meters (5 feet) tall and weighed about 90 kilograms (200 pounds).
“Rativates was previously identified as another specimen of the more common ostrich-mimic dinosaur Struthiomimus altus, but lacks the key diagnostic characters of that species,” said McFeeters. “We can tell that it is a new species based on features of its skull, tail, pelvis and feet, including the shape of the long bones of the feet.”
Rativates (Latin ratis + vates) means “ratite (large flightless bird) foreteller” and alludes to the paradox of an ostrich mimic dinosaur existing before ostriches. The name evadens means to evade, in reference to this swift-footed dinosaur’s ability to evade predators in the Late Cretaceous, as well as its recognition as a new species 80 years following the discovery of the original fossil.
“The referral of fossils to the named species of ostrich mimic dinosaurs like Struthiomimus is complicated because many specimens are incomplete. The recognition of Rativates helps clear up these problems, and at the same time strengthens a connection between Canadian ornithomimids and their Asian cousins,” said co-author Dr. Michael Ryan, curator of vertebrate paleontology at The Cleveland Museum of Natural History, who was co-supervisor to the lead author.
Although it is a member of the carnivorous dinosaurs (Theropoda), ornithomimids such as Rativates lacked teeth and, similar to birds, had beaked mouths. They are believed to have been omnivorous, meaning they ate plants, insects and other small animals. Their long, powerful legs would have made them fast runners (like the Gallimimus in the original Jurassic Park movie), whether they were hunting prey or escaping from larger predators, like Gorgosaurus.
Although no skin impressions were found with the fossil, the closely related ornithomimid, Ornithomimus, also from Alberta, is known to have had a downy covering over most of its body. It may have had true feathers as well.
“We histologically thin-sectioned the femur of Rativates to analyze its growth and determined it was at least eight years old and nearly adult-sized at the time of death. This is only 80 percent as long, and half as massive as, the adult size of the closely related species Struthiomimus altus, that is estimated to have weighed approximately 175 kilograms (~385 pounds)”, said co-author Thomas Cullen, a Ph.D. candidate at the University of Toronto.
“This suggests that there are at least two differently-sized, but closely-related dinosaur species that lived together on the ancient landscape, similar to what we see today in the closely related predators like foxes, coyotes and wolves,” said McFeeters’ former co-supervisor and co-author Claudia Schröder-Adams, of the Department of Earth Sciences at Carleton University.
“Rativates is another exciting example of a new species of dinosaur being discovered among museum collections,” said Ryan. “These valuable collections allow modern researchers to build on the work of earlier scientists to advance what we know about the ancient Earth and provide new insights into evolution.”
Reference:
McFeeters, B., M. J. Ryan, C. Schröder-Adams, and T. M. Cullen. 2016. A new ornithomimid theropod from the Dinosaur Park Formation of Alberta, Canada. Journal of Vertebrate Paleontology. DOI: 10.1080/02724634.2016.1221415.
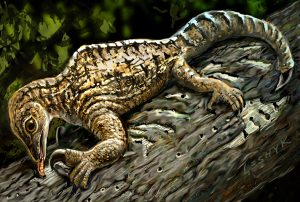
In this illustration set 212 million years ago in what is today New Mexico, a Drepanosaurus rips away tree bark with its massive claw and powerful arm. Credit: Painting by Victor Leshyk
Newly recovered fossils confirm that Drepanosaurus, a prehistoric cross between a chameleon and an anteater, was a small reptile with a fearsome finger. The second digit of its forelimb sported a massive claw.
Scientists analyzed 212-million-year-old Drepanosaurus arm fossils that were discovered at the Hayden Quarry in Ghost Ranch, New Mexico. The researchers describe their findings in a paper in the Sept. 29 edition of the journal Current Biology.
Drepanosaurus is neither a dinosaur nor a lizard. It is a one- to two-foot long reptile from an extinct group of animals called drepanosaurs, and shares a common ancestry with lizards, crocodiles, and dinosaurs. The only other known Drepanosaurus fossil was a badly crushed skeleton found in northern Italy more than 30 years ago.
“This animal stretches the bounds of what we think can evolve in the limbs of four-footed animals,” said Adam Pritchard, a postdoctoral researcher at Yale and first author of the study. “Ecologically, Drepanosaurus seems to be a sort of chameleon-anteater hybrid, which is really bizarre for the time. It possesses a totally unique forelimb.”
Four-limbed animals with a backbone are called tetrapods. In nearly all tetrapods, the forearm is made up of two, elongate and parallel bones — the radius and the ulna. These bones connect to a series of much shorter, wrist bones at the base of the hand.
Drepanosaurus, however, has radius and ulna bones that are not parallel. Instead, the ulna is a flat, crescent-shaped bone. Also, the two wrist bones that meet the end of the ulna are long rather than short. They are longer than the radius, in fact.
“The bone contacts suggest that the enlarged claw of Drepanosaurus could have been hooked into insect nests,” Pritchard said. “The entire arm could then have been powerfully retracted to tear open the nest. This motion is very similar to the hook-and-pull digging of living anteaters, which also eat insects.”
Drepanosaurus also had grasping feet and a claw-like structure at the tip of its tail. The finding suggests that tetrapods developed specialized, modern ecological roles more than 200 million years ago.
Pritchard is a postdoctoral fellow in the lab of Bhart-Anjan Bhullar in the Department of Geology and Geophysics at Yale. Co-authors of the study were Alan Turner of Stony Brook University, Randall Irmis of the University of Utah, Sterling Nesbitt of Virginia Polytechnic Institute and State University, and Nathan Smith of the Dinosaur Institute at the Natural History Museum of Los Angeles County.
Reference:
Adam C. Pritchard, Alan H. Turner, Randall B. Irmis, Sterling J. Nesbitt, Nathan D. Smith. Extreme Modification of the Tetrapod Forelimb in a Triassic Diapsid Reptile. Current Biology, 2016 DOI: 10.1016/j.cub.2016.07.084
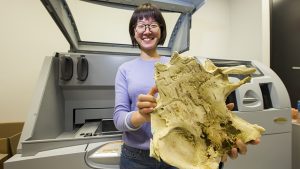
ANU PhD student Yuzhi Hu with a 3D print of the 400 million year old fish fossil that is six times the size of the specimen. Credit: Australian National University
Three-dimensional prints of a 400 million year old fish fossil from around Lake Burrinjuck in southeast Australia reveal the possible evolutionary origins of human teeth, according to new research by The Australian National University (ANU) and Queensland Museum.
ANU and Queensland Museum digitally dissected the jaws of a fossil Buchanosteus – an armoured fish from the extinct placoderm group – and used the 3-D prints to learn how the jaws moved and whether the fish had teeth.
Dr Gavin Young, one of the ANU researchers, said the study helped determine when and how teeth – a characteristic feature of all animal species with jaws, including humans – had originated in evolutionary history.
“We have used CT scanning facilities at ANU to investigate the internal structure of very fragile fossil skulls and braincases that have been acid-etched from limestone rock,” said Dr Young, a palaeontologist at the ANU Department of Applied Mathematics.
“We are conducting further research on the internal tissue structure of tooth-like denticles in the mouth of the fish fossil, to determine whether they represent a transitional stage in the evolution of teeth.”
Co-researcher Ms Yuzhi Hu from the ANU Research School of Earth Sciences said the evolutionary origin of teeth was a major scientific question.
“We are researching this question using new evidence from an exceptionally preserved fossil fish about 400 million years old,” said Ms Hu, a PhD candidate.
The research team used high-resolution CT scanning facilities developed at ANU to investigate the ancient fish fossil, found about 50km north-west of Canberra.
The ANU researchers and Dr Carole Burrow from Queensland Museum published the research results in Biology Letters, disputing findings in an article the journal published last year suggesting that the extinct placoderms had real teeth.
“It’s great that we are able to use recent technology, such as micro-CT scanning and 3-D printing, to examine some of the earliest known evidence of tooth-like structures in the most primitive jawed fishes,” Dr Burrow said.
“Placoderms have been a common focus in the question of tooth origins. Our team has been able to examine the gnathal plates of placoderms from the Early Devonian period, and compare their internal and external structure with those of younger placoderms as well as with the true teeth in other jawed fishes.”
Reference:
Carole Burrow et al. Placoderms and the evolutionary origin of teeth: a comment on Rücklin & Donoghue (2015), Biology Letters (2016). DOI: 10.1098/rsbl.2016.0159
Analysis of the first fossil bee nest from the Plio-Pleistocene of South Africa suggests that the human ancestor Australopithecus africanus lived in a dry savannah environment, according a study published September 28, 2016 in the open-access journal PLOS ONE by Jennifer Parker from University College London, United Kingdom, and colleagues.
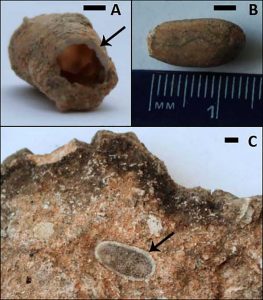
Little paleoecological information is available for the site in South Africa where the first Au. africanus fossil—the ‘Taung Child’—was discovered. However, insect-related fossils, abundant at the discovery site, can yield insights into the paleoenvironment. Bees, for example, tend to build characteristic nests in characteristic conditions. Parker and colleagues analyzed CT scans of a fossil bee nest that was discovered near the Taung Child site to determine its internal structure and thus the kinds of bees that built it.
The fossil nest was exceptionally well preserved, and the structure of its cells and tunnels suggested that it was made by a ground-nesting solitary bee. These bees typically nest on bare, light, dry soil that is exposed to the sun, which bolsters other recent evidence that Au. africanus lived in dry savannahs. Insect-related fossils are common but largely overlooked at sites where human ancestors lived, the researchers said, and their work underscores the contribution such fossils can make to understanding the environments where human ancestors lived.
“When Raymond Dart published his description of the ‘Taung Child’ in 1925 he profoundly changed our understanding of human evolution,” says study co-author Philip Hopley. “In the 90 years following his discovery, attention of anthropologists has moved to other African sites and specimens, and research at Taung has been hampered by the complex geology and uncertain dating. New research at Taung is helping to reconstruct the environment in which this enigmatic little hominin lived and died.”
Reference:
Jennifer F. Parker et al. Fossil Carder Bee’s Nest from the Hominin Locality of Taung, South Africa, PLOS ONE (2016). DOI: 10.1371/journal.pone.0161198
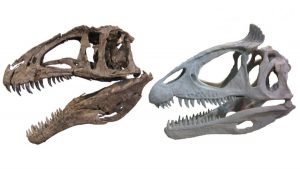
Theropod dinosaur skulls showing unornamented (Acrocanthosaurus NCMS 14345, left) and ornamented (Cryolophosaurus FMNH PR 1821, right) styles. Credit: Cryolophosaurus photo courtesy of Dr. Peter Makovicky, Acrocanthosaurus photo by Christophe Hendrickx
Tyrannosaurus rex and other large meat-eating theropods were the biggest baddies on the prehistoric block, and ornaments on their heads could help us figure out why. New research from North Carolina State University shows that theropod dinosaur species with bony crests, horns and knobs evolved to giant body sizes 20 times faster than those species lacking such embellishments. Additionally, the research shows that theropod dinosaurs most closely related to birds abandoned the hard ornaments strategy of their ancestors and likely used feathers for visual communication.
Most large theropods — in fact 20 of the largest 22 species like T. rex and Allosaurus — have bony bumps or crests on their heads. Paleontologists hypothesize that the accoutrements served as socio-sexual display mechanisms — a way for the dinosaurs to signal to one another for mating, territory or defense purposes.
Terry Gates, lecturer in NC State’s Department of Biological Sciences and research adjunct at the North Carolina Museum of Natural Sciences, wondered if there was a correlation between the development of cranial ornamentation and rapid gains in size. Along with colleague Lindsay Zanno, also of NC State and the NC Museum of Natural Sciences, and Montana State University’s Chris Organ, Gates examined the fossils of 111 ornamented and unornamented theropods and compared their size increases over time.
Using observational data and computer modeling, the researchers found that for theropods weighing under 36 kg (about 80 pounds) bony cranial ornamentation did not evolve. Above that threshold, 20 of the 22 largest theropods had ornamentation. And it turns out that once a theropod species developed some style of head display, subsequent species would take large leaps toward gigantic body sizes every 4 to 6 million years. Large theropod lineages containing species without ornamentation — such as Acrocanthosaurus — did not achieve giantism as rapidly as their ornamented brethren.
“We were surprised to find such a strong relationship between ornaments and huge body size in theropods,” Gates explains. “Something about their world clearly favored bling and big bods.”
The researchers also looked at the lineage of dinosaurs that led to modern birds — including maniraptoriforms like Velociraptor, Ornithomimus and Falcarius. These dinosaurs never acquired bony head displays (except the parrot-like oviraptors) despite the fact that many of them weighed much more than the 36 kg threshold for gaining such ornamentation. This led the researchers to wonder why the closest relatives to birds were defying the pattern observed for other theropod dinosaurs.
“The best explanation is that the long stiff feathers, which originated in this group of dinosaurs and were similar to modern bird feathers, could perform equally well as social signals when compared to the bony displays in T. rex or Dilophosaurus,” Gates surmises.
Zanno agrees. “Our work supports the idea that vaned feathers were great communication tools from the get-go and may have helped large bird-like theropods sidestep the bother of skeletal bells and whistles,” she says.
Reference:
Terry A. Gates, Chris Organ, Lindsay E. Zanno. Bony cranial ornamentation linked to rapid evolution of gigantic theropod dinosaurs. Nature Communications, 2016; 7: 12931 DOI: 10.1038/ncomms12931
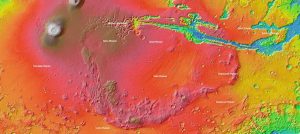
A map of Mars that includes the unually high elevation region LSU researchers are studying called Thaumasia Planum. Credit: Wikimedia
Researcher Don Hood from LSU and colleagues at collaborating universities studied an unusual region on Mars—an area with high elevation called Thaumasia Planum. They analyzed the geography and mineralogy of this area they termed Greater Thaumasia, which is about the size of North America. They also studied the chemistry of this area based on Gamma Ray Spectrometer data collected by the Mars Odyssey Orbiter, which was launched in 2001. What they found was the mountain ridge that outlines Greater Thaumasia was most likely created by a chain of volcanoes. The results were published recently in the Journal of Geophysical Research-Planets.
“The chemical changes we see moving northwestward through the region is consistent with the mantle evolving on Mars. Our research supports that this whole area was built as a volcanic construct,” said Don Hood, LSU Department of Geology and Geophysics doctoral candidate and lead author of the paper.
The chemical composition changes throughout the region. Silica and H20 increase and potassium decreases from southeast to northwest.
“The chemical composition shifting is the key progression that tells us that this environment was most likely shaped by a series of volcanic events that continually erupted from a changing mantle composition,” Hood said.
Hood and colleagues from Stony Brook University, University of Tokyo and Lehigh
University ruled out another hypothesis that the abundance of H20 and potassium was caused by water interacting in rock.
“We looked for evidence of aqueous alteration through other geochemical means and didn’t find it,” he said.
The geography of the region has many shield volcanoes that are similar to the ones found in Hawaii. However from geochemical analyses, the researchers found that the sulfur that is present was most likely deposited as a volcanic ash. Volcanic ash from various areas could be evidence of explosive volcanism on Mars, which would be an important clue for piecing together the history of Mars. It is significant because explosive eruptions emit a lot of gas that can stay in the atmosphere and can cause global cooling and warming events.
“Whether there was explosive volcanism on Mars and how much of it there was is an important question in terms of finding out what the past climate was like,” Hood said.
Reference:
Don R. Hood et al. Assessing the geologic evolution of Greater Thaumasia, Mars, Journal of Geophysical Research: Planets (2016). DOI: 10.1002/2016JE005046
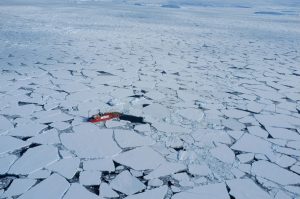
Arctic sea ice is changing, with less of the ”old and thick” sea ice, which survives through the summer, to ”new and thin” sea ice which melts in the spring and summer. Credit Andrea Spolaor, Ca’ Foscari university of Venice
By analysing ice cores drilled from deep inside the Greenland ice sheet, researchers have started to calculate how much Arctic sea ice there was in the past. Researchers from Denmark, Italy, Spain and Japan have just published the results in the research journal Scientific Reports.
The Greenland ice sheet records information about Arctic temperature and climate going back to more than 120,000 years ago. But new research reveals that the ice doesn’t just tell us about the situation in the air and on the land — it can also tell us about what was happening at sea. By analysing ice cores drilled from deep inside the Greenland ice sheet, researchers have started to calculate how much Arctic sea ice there was in the past. Researchers from Denmark, Italy, Spain and Japan have just published the results in the research journal Scientific Reports.
Arctic sea ice is changing. In the past the Arctic Ocean was covered by metres of thick sea ice but now that sea ice is thinning and being replaced by sea ice that melts away over the summer. The rapid decrease of summer sea ice that we currently observe is opening up the region for shipping and exploration but also threatening local ecosystems and cultures. But what was sea ice like in the past? The amount of sea ice has only been well known since the 1970’s when satellite measurements began, so we don’t know what has been happening far back into the past.
Researchers at the Niels Bohr Institute in Denmark and Ca’Foscari Univeristy of Venice in Italy have discovered that chemical traces of sea ice can be found far away from the ocean within the kilometres-thick Greenland ice sheet. The ice sheet is covered by snow which falls every year and is compressed into ice over many thousands of years. Every layer of ice tells us about the year that the snow originally fell on the ice sheet — what the temperature was like and what kinds of particles were blowing around in the atmosphere at that time.
“We can measure the amount of a chemical called bromine in the Greenland ice cores. You find bromine in both the ocean and sea ice, but when new sea ice forms in the winter the sea salt is concentrated into salty pockets of brine which contain bromine. In spring and summer, the sunlight that shines down onto the sea ice starts chemical reactions. In these reactions, ozone in the air reacts with bromine in the ice and the bromine is released in greater and greater amounts from the sea ice. This process is called a bromine explosion. When it is released from the sea ice, the concentrated bromine is carried by the wind up onto the ice sheet and then deposited with the falling snow. That is the source of the bromine we measure in ice cores,” explains Andrea Spolaor, researcher at Ca’ Foscari University of Venice, “The reactions stop in autumn and winter, when the sun goes below the horizon and new sea ice begins to form again..”
Reconstructing sea-ice in the past
It’s one thing to measure the amount of bromine in an ice core from Greenland, but it’s another thing to understand the connection between bromine and the amount of sea ice in the Arctic.
In order to link the bromine measurements with the amount of sea ice covering the Arctic, scientists have used satellite observations of sea ice as a measuring stick, which goes back to the 1970’s. The measurements can be used to link the bromine content in the ice cores with the amount of new sea ice produced each year since 1979. A clue about the amount of sea ice in the past has also been revealed by records from Icelandic fishing communities, which go back more than 1000 years. Altogether, these data have allowed researchers to calculate how much sea ice there was in the Arctic tens of thousands of years ago.
“With this technique we can fill the gaps in our understanding of the amount of Arctic sea ice in the past. Since ice cores also reveal a lot of information about the climate, we can combine the sea ice data with the climate data and start to understand how sea ice reacts to climate change” explains Paul Vallelonga, Associate Professor at the Centre for Ice and Climate at the Niels Bohr Insitute, University of Copenhagen.
Sea ice and climate change
Researchers have found that 8000 years ago the Arctic climate was 2 to 3 degrees warmer than now, and that there was also less summertime Arctic sea ice than today.
“We have been in this situation before, with less sea ice and more open ocean during the warm Arctic summer. So right now we have not yet exceeded the natural boundaries for the Arctic region, but the question is: with more warming in the Arctic driven by rising greenhouse gases, how soon will sea ice melting reach and exceed the levels of 8000 years ago? These new research results can help us to answer this question when we combine them with climate models,” says Paul Vallelonga.
Reference:
Andrea Spolaor, Paul Vallelonga, Clara Turetta, Niccolò Maffezzoli, Giulio Cozzi, Jacopo Gabrieli, Carlo Barbante, Kumiko Goto-Azuma, Alfonso Saiz-Lopez, Carlos A. Cuevas, Dorthe Dahl-Jensen. Canadian Arctic sea ice reconstructed from bromine in the Greenland NEEM ice core. Scientific Reports, 2016; 6: 33925 DOI: 10.1038/srep33925
A new study from the active volcano Kīlauea, which is on the big island of Hawaii, reports that people — especially children — with asthma are at greater risk of having serious asthma attacks if they live in a community with high levels of the volcanic gas sulfur dioxide (SO2) than if they live upwind of the volcano.
Volcanoes can emit SO2 and other airborne chemicals while erupting, and human sources of SO2, like coal plants, are reputed triggers of asthma attacks. Nurse epidemiologist Bernadette Mae Longo, from the University of Nevada, Reno, began to question whether volcanic sulfurous air pollution, known as “vog,” was linked to human health after having conversations with local health care professions and conducting door-to-door surveys near Kīlauea.
“As a nurse, it touched my heart, because I knew as I read a medical record that this was a real person struggling. Or maybe this was a family with a baby or child that had asthma, and it is very frightening when an asthma attack occurs,” says Longo, who will speak on the subject on Tuesday, 27 Sept., at the meeting of the Geological Society of America in Denver, Colorado. “The overriding question was: ‘is all the volcanic air pollution making people sick?’ ”
SO2 is considered a “non-threshold” gas, meaning that the amount of SO2 needed to trigger an asthma attack varies person to person. People without asthma or other respiratory illnesses can breath in a larger amount of SO2 before experiencing breathing problems.
After confirming that communities downwind of Kīlauea were being exposed to volcanic SO2, Longo initiated a seven-year study that ran from 2004 to 2010. She monitored atmospheric SO2 levels and documented the number of people who visited either emergency rooms or local clinics in need of immediate medical treatment for an asthma attack. She compared communities living downwind of the volcano, and thereby exposed to SO2 emissions, to communities upwind of the volcano. Longo ended up recording information from more than 1,000 visits from patients, who ranged in age from three months old to more than 89 years.
The risk of an asthmatic experiencing a serious asthma attack was three times higher for people living downwind of the volcano compared to populations living upwind of the volcano, once the data was corrected for age and gender. When she considered age, Longo found that the children downwind of Kīlauea were at much higher risk of an attack than the unexposed children.
Specifically, Longo saw that the risk of asthma attacks increased with in-town SO2 concentrations and not the amount of emissions gushing from the volcano. Furthermore, communities closer to the vents had a higher risk of asthma attacks compared to communities farther downwind.
At the beginning of the study, the East Rift Zone of Kīlauea was continuously erupting on a small scale, but the Halemaumau Crater of Kīlauea explosively erupted in 2008, causing SO2 emissions to skyrocket. Even now, downwind communities still exceed EPA recommendations for SO2 exposure a few times during the week, according to Longo.
“It allowed for a natural experiment of low vog exposure and high vog exposure,” says Longo. “We found that there was already significant risk before the summit eruption, but the magnitude of risk increased after the eruption.”
Overall, vog exposure appears to be hazardous to the health of those with asthma, because every asthma attack can further damage a patient’s lungs. Longo suggests geologists, public health care workers, and clinicians can work collaboratively to write guidelines that would allow clinicians to provide the best evidence-based, culturally sensitive care for the vulnerable populations living on volcanoes. In addition, Longo says scientists need to continue researching the effects of vog pollution on human health, not only on SO2, but also on the other gases and particulates in vog.
“We can’t shut the volcano off, and if we don’t document that there is this problem, there may not be the initiative to do something to try and help these populations,” says Longo.
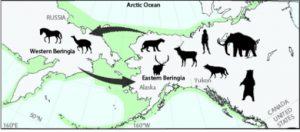
Schematic diagram of faunal exchange across Beringia (Bering Land Bridge) during the Pleistocene. Credit: Art credit Alycia Stigall
Many people are concerned about conservation of the planet’s cute and cuddlies. But in a world of global climate change, sometimes we must prioritize which species we can and should save from extinction. Dr. Alycia Stigall and her colleagues are leading the charge in studies to help us make those determinations by looking at the fossil record. She will report their findings at the Annual Meeting of the Geological Society of America on 25 September in Denver, Colorado, USA.
As a paleontologist, Stigall has looked at seven different events in deep time that experienced dramatic shifts in the biodiversity (number of species) and the size of species populations from as recent as 15,000 to 30,000 years ago (Beringia dispersals) to 485 to 460 million years ago (Great Ordovician Biodiversification Event).
So how does biodiversity generate on Earth? Stigall and her colleagues (all of whom are former students of hers) have found evidence for a cycle that explains how species diversify and disappear over time. Some animals living on a continent are generalists (able to thrive in multiple environments and/or from multiple resources). These animals spread out across the continent so that they reduce the amount of competition for resources. Over time, the continent breaks apart into numerous islands and the animals are isolated from each other. This leads to speciation (formation of new species) because the animals are all competing for limited resources and thus specialize into ecological niches in order to coexist peacefully. This speciation increases biodiversity, but if the environment changes, those specialized species are less likely to survive. So as those islands begin to form a new continent, the generalists invade the ecological niches of specialists and drive speciation, and thus biodiversity, down.
This information is critical for understanding modern conservation efforts because it tells us that specialist species are going to need a lot more help surviving global climate change than generalist species. As we undergo this changing environment, invasive species will become more of a common occurrence. Stigall explains that while this pattern keeps occurring throughout time, there are always going to be idiosyncrasies associated with the multitude of different drivers in each of those geological events. And when you start taking human interferences into account, predictive modeling becomes even more difficult.
“Places that are tropical and stable, regions that have similar climate year-round, will likely be impacted the most by invasive species,” Stigall explains. “Data sets for modern species are usually limited in terms of the number of species and years available when talking about biodiversity, so hopefully we can use the fossil record to expand our knowledge and use the past to make informed decisions about the future.”
Lithic, Pinnacle Pint Cave,. South Africa Credit: Kirsty Penkman, University of York
Scientists have identified fossil proteins in a 3.8 million year-old ostrich eggshell, suggesting that proteins could provide valuable new insights into the evolutionary tree, much further back in time than was previously thought.
The study, published in the journal eLife, suggests that survival of protein fragments in the ancient eggshell could provide genetic information almost 50 times older than any DNA record.
The findings shed new light on how animals and humans lived and interacted in the past, how some species became extinct, and why some evolved and continue to thrive today. Crucially, the research provides archaeologists with the ability to be more targeted in which fossils they submit for deeper analysis.
The team at the Universities of York, Sheffield and Copenhagen analysed and tracked egg fossils from well-dated sites in Tanzania and South Africa, where it is expected DNA and proteins would not survive the extreme environmental conditions.
Professor Matthew Collins, from the University of York’s Department of Archaeology, who led the team, said: “To date, DNA analysis from frozen sediments has been able to reach back to about 700,000 years ago, but human evolution left most of its traces in Africa and the higher temperature there takes its toll on DNA preservation.
“We had known for many years that proteins could give more clues into the past, but when we looked at protein decay in eggshells, it gave us unusual results when compared to other fossil materials and, until now, we have not really known why.”
The researchers speculated that proteins might survive better if they were stuck onto solid surfaces, and so they tested the theory with the support of computational scientists at the University of Sheffield, who modeled the bindings of proteins in ostrich eggshells.
Dr Beatrice Demarchi, from the University of York’s Department of Archaeology, said “Evidence suggested that it was the more fluid, unstable, region of the protein that promoted and regulated mineral growth in the shell, but it was also less likely to survive over time and the intense heat of the African climate.
“As we examined older and older eggshells, we could see that this assumption was surprisingly wrong, as it was in fact the unstable regions that survived the best. They were able to bind more strongly to the eggshell, allowing it be preserved in time.”
Fragments of ancient ostrich eggshells are abundant in Africa, and often found at archaeological and palaeontological sites. They were exploited by the earliest modern humans as raw materials to make art, and jewellery and, or for carrying water. The shell is very thick and hardwearing and therefore survives under many different environmental conditions.
Dr Colin Freeman, from the University of Sheffield, said: “Remarkably, the oldest eggshell in the study — from the famous 3.8 million year-old site of Laetoli in Tanzania — a region of the protein was still there, giving us a unique insight into what to look for when analysing fossils of this kind.
“Now that we know minerals can trap and preserve proteins in this way, we can be much more targeted in our study of ancient remains.”
Reference:
Beatrice Demarchi, Shaun Hall, Teresa Roncal-Herrero, Colin L Freeman, Jos Woolley, Molly K Crisp, Julie Wilson, Anna Fotakis, Roman Fischer, Benedikt M Kessler, Rosa Rakownikow Jersie-Christensen, Jesper V Olsen, James Haile, Jessica Thomas, Curtis W Marean, John Parkington, Samantha Presslee, Julia Lee-Thorp, Peter Ditchfield, Jacqueline F Hamilton, Martyn W Ward, Chunting Michelle Wang, Marvin D Shaw, Terry Harrison, Manuel Domínguez-Rodrigo, Ross DE MacPhee, Amandus Kwekason, Michaela Ecker, Liora Kolska Horwitz, Michael Chazan, Roland Kröger, Jane Thomas-Oates, John H Harding, Enrico Cappellini, Kirsty Penkman, Matthew J Collins. Protein sequences bound to mineral surfaces persist into deep time. eLife, 2016; 5 DOI: 10.7554/eLife.17092
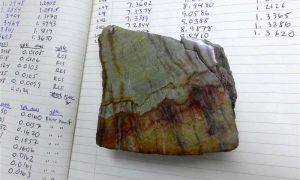
This sample of 3.26-billion-year-old barite shows the granular barite (gray-green areas) that was influenced by ocean water, and bladed barite (vertical black bands) that was by ocean water and water circulating below the sea floor. Credit: David Tenenbaum
As scientists continue finding evidence for life in the ocean more than 3 billion years ago, those ancient fossils pose a paradox. Organisms, including the single-celled bacteria living in the ocean at that early date, need a steady supply of phosphorus, but “it’s very hard to account for this phosphorus unless it is eroding from the continents,” says Aaron Satkoski, a scientist in the geoscience department at the University of Wisconsin-Madison. “So that makes it really hard to explain the fossils we see at this early era.”
Satkoski, who is first author of a new report on ocean chemistry from this remote period, says the conventional wisdom of geology has envisioned an oceanic planet, with little or no land above the waves. “Starting back in the 1960s, for various reasons people claimed there was very little continental mass, and so there wasn’t enough weathering to affect the chemistry of the ocean. But there wasn’t much real data from more than 3 billion years ago to support that.”
Discoveries of fossil remains of bacteria from over 3 billion years ago have changed that picture, says Satkoski. “But if there was life in the ocean, you need some amount of continental weathering taking place to deliver phosphorus so the organisms can live.”
The major influences on ocean chemistry today are hydrothermal flow (hot water that has circulated through the crust) and surface weathering (the river transport of material eroded from land into the ocean).
To evaluate each influence 3.26 billion years ago, geoscience Professor Clark Johnson and Satkoski collected samples from South Africa and compared isotopes in two forms of a rock called barite. The cemented granules had formed in the water, then fused after dropping to the ocean floor.
A solid, or bladed, type of barite had formed at the ocean floor. Johnson, Satkoski and colleague Brian Beard assumed that the granular rock would reflect ocean water chemistry, and therefore any eroded, continental material. The bladed barite would represent a mix of ocean chemistry and hydrothermal flow. The study hinged on precise measurements of isotopes — atoms that are chemically identical but that have different masses. Knowing that strontium derived from land shows a slightly higher ratio of strontium 87 than strontium derived from hydrothermal circulation, the scientists compared isotopes in each type of barite.
The result was a nearly infinitesimal — but still significant — difference in the isotope ratios, signifying that the granular barite indeed was derived from sediment eroded from land. In other words, a significant amount of erosion was taking place 3.26 billion years ago.
Their report, just published online by Earth and Planetary Science Letters, pushes back the first solid date for large-scale continental erosion by 400 million years.
“It’s a guess how much of the planet’s surface was land, but it could be as high as two-thirds of the area of today’s continents,” says Johnson, who leads the NASA Astrobiology Institute at the University of Wisconsin. “Some previous estimates had no continents at all.”
“When people were thinking about ocean chemistry, it was always centered on hydrothermal flow, but there was little data,” Johnson says. “We are trying to put some data into the equation.”
The finding about continents jibes with evidence from igneous rocks — those sourced in hot, molten rock — which indicated that the surface became rigid enough to support mountain belts, which would have eroded, during this period. “Now that we have a more complete picture, the story becomes more coherent,” Satkoski says.
The result also meshes with climate data, as intense continental weathering could result from an increase in carbon dioxide in the atmosphere. Although the sun was relatively cold at that time, the oceans were not frozen, Satkoski says. “That suggests there was more greenhouse gas in the atmosphere, which would produce a warmer climate combined with increased weathering, because carbon dioxide creates carbonic acid and acid rain, which speeds chemical weathering.”
The presence of continents also indicates that the broad, slow movements of plate tectonics had started at this distant time. “Conventional wisdom says Earth had few continents because it did not have plate tectonics, which is how continents are made,” Satkoski says. “Our evidence says the opposite.” Overall, the result provides a satisfying unification of diverse streams of evidence, Johnson says. “We are moving toward an explanation for the presence of life, and the nutrients in the ocean, and why Earth was not frozen. They seem to fit together, but this is a very different picture of the early Earth than we had just 20 years ago.
Reference:
Aaron M. Satkoski, Donald R. Lowe, Brian L. Beard, Max L. Coleman, Clark M. Johnson. A high continental weathering flux into Paleoarchean seawater revealed by strontium isotope analysis of 3.26 Ga barite. Earth and Planetary Science Letters, 2016; 454: 28 DOI: 10.1016/j.epsl.2016.08.032
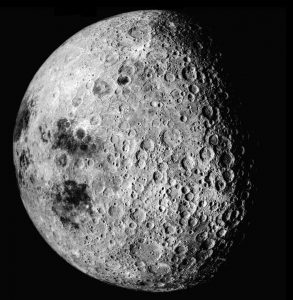
A layer of iron and other elements deep underground is the evidence scientists have long been seeking to support the hypothesis that the moon was formed by a planetary object hitting the infant Earth some 4.5 billion years ago, a new study led by Johns Hopkins University scientists argues.
Published in the current issue of the journal Nature Geoscience, the paper uses laboratory simulations of an Earth impact as evidence that a stratified layer beneath the rocky mantle — which appears in seismic data — was created when Earth was struck by a smaller object. The authors argue this was the same impact that sent a great mass of debris hurtling into space, creating the moon.
“Our experiments bring additional evidence in favor of the giant impact hypothesis,” said Maylis Landeau, the lead author of the paper, who was a post-doctoral fellow in Johns Hopkins’ Department of Earth and Planetary Sciences when the experiments were conducted. “They demonstrate that the giant impact scenario also explains the stratification inferred by seismology at the top of the present-day Earth’s core. This result ties the present-day structure of Earth’s core to its formation.”
Landeau, now a Marie Curie Fellow at the University of Cambridge, co-wrote the paper with Peter Olson, research professor in the Department of Earth and Planetary Sciences, Benjamin H. Hirsh, who was an undergraduate at Johns Hopkins, and Renaud Deguen of Claude Bernard University in Lyon, France.
Olson said the giant impact argument for the formation of the moon is the most prevalent scientific hypothesis on how Earth satellite was formed, but it is still considered unproven because there’s been no “smoking gun” evidence.
“We’re saying this stratified layer might be the smoking gun,” said Olson. “Its properties are consistent with it being a vestige of that impact.”
Their argument is based on seismic evidence of the composition of the stratified layer — believed to be some 200 miles thick and lie 1,800 miles below Earth’s surface — and on laboratory experiments simulating the turbulence of the impact. The turbulence in particular is believed to account for the stratification — meaning a mix of materials in layers rather than a homogeneous composition — at the top of the core.
The stratified layer is believed to consist of a mix of iron and lighter elements, including oxygen, sulfur and silicon. The very existence of this layer is understood from seismic imaging, as it lies far too deep underground to be sampled directly.
Up to now, most simulations of the impact have been done numerically, and have not accounted for impact turbulence, Olson said. Olson said turbulence is difficult to simulate mathematically and no computer model has yet done it successfully.
The researchers in this experiment simulated the impact using liquids meant to approximate the turbulent mixing of materials that would have occurred when the planetary object struck when Earth was just about fully formed — a “proto-Earth,” as scientists call it.
Olson said the experiments depended on the principle of “dynamic similarity.” In this case, that means a way to make reliable comparisons of fluid flows without replicating the scale, materials and force of the original Earth impact, which would be impossible. Instead, the experiment was meant to simulate the key ratios of forces acting on each other to produce the turbulence of the impact that could leave behind a layered mixture of material.
The researchers conducted more than 60 experiments in which about 3.5 ounces of saline or ethanol solutions representing the planetary projectile that hit Earth was dropped into a rectangular tank holding about six gallons of fluid representing the early Earth. In the tank was a combination of fluids in layers that do not mix: oil floating on the top to represent Earth’s mantle and water below representing Earth’s core.
The analysis of the impact showed that a mix of materials was left behind in varying amounts, and also that the distribution of the mixture depended on the size and density of the projectile hitting the “Earth.” The larger the projectile, the more likely the entire core of Earth, and not just a layer, would be a mix of material. The authors argue for a smaller moon-forming projectile, smaller or equal to the size of Mars, a bit more than half the size of Earth.
Reference:
Maylis Landeau, Peter Olson, Renaud Deguen, Benjamin H. Hirsh. Core merging and stratification following giant impact. Nature Geoscience, 2016; DOI: 10.1038/ngeo2808
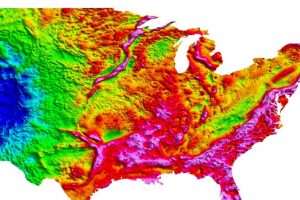
Most of the gravity highs on this map (hot colors for high; cool ones for low) correspond with mountains or other topographical features. But the long snake-like gravity high heading south from the tip of Lake Superior is another story. There’s nothing on the surface to explain its buried presence. Credit: USGS
When Doug Wiens approached Minnesota farmers to ask permission to install a seismometer on their land, he often got a puzzled look. “You could tell they were thinking ‘Why are you putting a seismometer here?,’ ” said Wiens, professor of earth and planetary sciences in Arts & Sciences at Washington University in St. Louis. “‘We don’t have earthquakes and we don’t have volcanoes. Do you know something we don’t?’ ”
Actually, he did. Deep beneath the fertile flat farmland, there is a huge scar in the Earth called the Midcontinent Rift. This ancient and hidden feature bears silent witness to a time when the core of what would become North America nearly ripped apart. If the U-shaped rip had gone to completion, the land between its arms—including at least half of what is now called the Midwest—would have pulled away from North America, leaving a great ocean behind.
Weisen Shen, a postdoctoral research associate with Wiens, will be presenting seismic images of the rift at the annual meeting of the Geological Society of America (GSA) Sept. 25-28. The images were made by analyzing data from Earthscope, a National Science Foundation (NSF) program that deployed thousands of seismic instruments across America in the past 10 years.
What is that thing?
The Midcontinent Rift was discovered by geophysicists who noticed that gravity was stronger in some parts of the upper Midwest than in others. In the 1950s and 1960s, they mapped the gravity and magnetic anomalies with airborne sensors. Shen is contributing to a session at the GSA dedicated to Bill Heinze, a geophysicist who helped discover and map the Midcontinent Rift.
But understanding of the rift then stalled until 2003, when the NSF funded Earthscope, a program whose mission is to use North America as a natural laboratory to gain insight into how the Earth operates.
As part of Earthscope, the Incorporated Research Institutions for Seismology (IRIS) installed a network of 400 seismometers, called the USArray, that rolled across the United States from west to east, gathering data at each location for two years before moving on. USArray was installed on the West Coast beginning in 2004, and had advanced to the Midwest by 2010.
Earthscope also made available a pool of seismometers, called the flexible array, for more focused field experiments. A consortium of universities, including Washington University in St. Louis, installed 83 of these stations along and across the rift in 2011, creating a dense array called SPREE.
A telescope looking down
Seismologists had never before been able to blanket the landscape with seismometers in this way, and so the USArray has stimulated many innovations in the manipulation of the seismic data to extract information about Earth’s crust and upper mantle.
Seismic interpretation is a thorny version of what is called an inverse problem. If the Earth’s interior were of uniform composition, seismic waves would travel in straight lines. But instead, underground structures or differences in temperature and density refract and reflect them. The problem is to figure out mathematically which obstructions could have produced the wave arrivals that the seismometers recorded.
It’s a bit like trying to figure out the shape of an island in a pond by throwing a pebble into the lake and recording the ripples arriving at the shore.
The data wizard on the Washington University team is Shen, who has devised new techniques for combining many types of seismological data to create sharper images of Earth’s interior.
The farmers in Minnesota have a point when they wonder what an “earthquake sensor” could detect in an area where there are no earthquakes. The answer is that the seismometers record distant earthquakes, such as those on the Pacific Ring of Fire on the opposite side of the planet, and ambient noise, caused by activity such as powerful storms slamming into the Jersey Shore.
Shen has seasoned the mix with several other measurements that can be extracted from the seismic record as well. By inverting all of these data functions simultaneously within a Bayesian statistical framework, he is able to obtain much clearer images of Earth’s interior than one type of data alone would produce, together with estimates of the probability that the images are correct.
Not just a scar, a keloid scar
What have the scientists learned about the rift?
“When you pull apart a continent, like a piece of taffy, it starts to stretch and to thin,” said Michael Wysession, professor of earth and planetary sciences and a member of the SPREE team. “And as it sags, the dip fills with low-density sediment.
“So if you go over a rift with a gravity sensor, you expect to find a negative gravity anomaly. Mass should be missing. But that’s not what happened with the Midcontinent Rift. Instead of being thinner than the surrounding crust, it is thicker.
“We know that lava comes out at rifts,” Wysession said. “The East African rift zone, for example, includes a number of active and dormant volcanoes, such as Mount Kilimanjaro. But the Midcontinent Rift was flooded with lava, and as it sank under the weight of the cooling basaltic rock, even more lava flowed into the depression.
“A huge volume of lava erupted here,” Wysession said. “It was perhaps the largest outflowing of lava in our planet’s history. And then, after the eruptions ended, the area was compressed by mountain building event to its east, thickening the scar by squeezing it horizontally.
Shen published images of the rift made with USArray data in the Journal of Geophysical Research 2013. But at that time, he had only sparse coverage in the rift’s vicinity. At the 2016 GSA meeting he will present images made with both USArray and SPREE data (especially many more “receiver functions,” a type of seismic data that is particularly sensitive to seismic boundaries) that show what lies beneath the rift more clearly.
Miles beneath the Earth’s surface, there is a seismic boundary called the Mohorovičić discontinuity, or Moho. At the Moho, seismic waves hit higher density material and suddenly accelerate. But beneath the rift, Shen said, the Moho is blurred rather than sharp. “Its structure has been destroyed,” he said.
He also sees evidence of something called magmatic underplating. “We think magma might have trapped, or stalled out, at the Moho or within the crust during its rise to the surface,” he said. This might explain why the Moho is so disrupted, although Shen can think of alternative explanations and expects there to be lively discussions at the GSA.
He compares images of the Midcontinent Rift made with the SPREE array to images of the Rio Grande rift made with a similar seismic array called La Ristra. The La Ristra images show that the Rio Grande rift is thinner than the surrounding crust, not thicker. The Moho is clear and rises rather than sinks under the rift.
“I think we’re looking at different stages of rifting,” Shen said. The Rio Grande Rift is still active, still opening, but the Midcontinent Rift is already dead and has been squeezed shut.
Wiens commented that the tremendous outpouring of magma at the Midcontinent Rift might also have disrupted its structure, making it look different from other rifts.
“My goal,” Shen said, “is to provide basic seismic models of interesting tectonic regions like this one for geologists, geochemists and scientists from other disciplines to use—to help them interpret their results and also help the public to better understand the story of the land they live on.”
Rural Minnesota is already onboard. “Some landowners were quite interested in what we were doing,” Wiens said. “We got into one or two small town newspapers. ‘So-and-so now has a seismometer on his farm,’ the headline would read.”
Reference:
Weisen Shen et al. A 3-D model of the crust and uppermost mantle beneath the Central and Western US by joint inversion of receiver functions and surface wave dispersion, Journal of Geophysical Research: Solid Earth (2013). DOI: 10.1029/2012JB009602
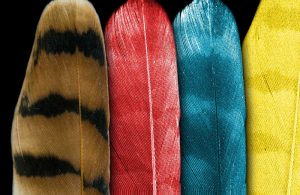
Scientists were able to map the chemical environments of two different types of melanin, a pigment responsible for black/dark brown or reddish/yellow color in feathers. This illustration shows an American kestrel feather (left), and the X-ray fluorescence maps of zinc (shown with a red filter), calcium (blue) and benzo-sulfur (yellow) in the same feather. The researchers will use the information provided by these maps to identify melanin in fossil specimens. Credit: SLAC National Accelerator Laboratory
In order to discover the true colors of ancient animals, scientists are using X-rays to closely examine the chemical details of modern bird feathers.
The researchers were able to map elements that make up pigments responsible for red and black colors in feathers. They hope to use this information to find traces of the same pigments in fossil specimens of extinct animals, such as dinosaurs.
This latest discovery means that scientists may be able to go beyond monochrome in their depictions of fossilized creatures, and make steps towards portraying their colors more accurately.
The team published their results in the journal Scientific Reports.
The experiments were conducted at the Stanford Synchrotron Radiation Lightsource (SSRL) at the Department of Energy’s SLAC National Accelerator Laboratory and the Diamond Light Source in the United Kingdom. SSRL is a DOE Office of Science user facility.
The international team of scientists, led by the University of Manchester, analyzed the elements associated with a pigment called melanin in feathers shed by birds housed in animal sanctuaries. Melanin is responsible for skin color variation in humans, and it is the dominant pigment in most mammals and birds. The pigment gives animals either a black/dark brown or reddish/yellow color. The black type is called eumelanin, while the reddish type is called pheomelanin.
“Melanin is a very important component in biology, but its exact chemistry is still not precisely known, especially as to how metals such as calcium, copper and zinc interact with it,” says Nick Edwards, a postdoctoral research associate at the University of Manchester and the lead author of the study.
Edwards says the researchers found subtle but measurable differences between the different types of melanin with regards to certain elements.
For example, the X-rays allowed them to see contrasts in the different chemical environments of sulfur and zinc. Zinc, when bound to sulphur in a specific way, could be used as a reliable indicator of the red type of melanin within the feathers of brightly colored birds of prey. And zinc in the absence of sulphur could indicate the black form of melanin.
The team also saw patterns in calcium and copper that match the markings of the tested feathers.
“With X-rays, one of the advantages is that we’re able to map these visual patterns in the chemical elements associated with colors in a non-destructive way,” says Dimosthenis Sokaras, staff scientist at SLAC and a co-author on the paper. “We can study something in its original state.”
An earlier study from the same group revealed light and dark patterns in a fossilized Confuciusornis sanctus, an ancient bird with the first true beak that lived at the same time as the dinosaurs.
“A fundamental truth in geology is that the present is the key to the past,” says Roy Wogelius, professor of geochemistry at the University of Manchester and senior author of the study. “This work on modern animals now provides another chemical ‘key’ for helping us to accurately reconstruct the appearance of long extinct animals.”
Reference:
Nicholas P. Edwards, Arjen van Veelen, Jennifer Anné, Phillip L. Manning, Uwe Bergmann, William I. Sellers, Victoria M. Egerton, Dimosthenis Sokaras, Roberto Alonso-Mori, Kazumasa Wakamatsu, Shosuke Ito, Roy A. Wogelius. Elemental characterisation of melanin in feathers via synchrotron X-ray imaging and absorption spectroscopy. Scientific Reports, 2016; 6: 34002 DOI: 10.1038/srep34002
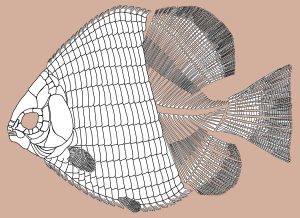
Skeleton of Hemicalypterus. Credit: Gibson 2016. CC-BY
Fish have a bit of a boring reputation among many vertebrate paleontologists–too many bones, too hard to identify, not as charismatic as dinosaurs, etc., etc. But, this is entirely undeserved (and I say that as a dinosaur paleontologist, too)! The ins and outs of fish evolution are truly fascinating, bolstered by a phenomenal fossil record. Fish have an astounding array of body shapes and sizes, with an unparalleled ecological and geographic distribution. Consequently, fish are an excellent group in which to study adaptation and evolutionary transitions.
Co-blogger Sarah Gibson, based in the Department of Geology and the Biodiversity Institute at the University of Kansas, has made her mark studying fish that swam in the lakes and streams of North America during the dawn of the dinosaurs. Tremendous changes were happening in the world at this time, with the breakup of Pangaea and its associated environmental impacts. Although the land critters get most of the attention, fish were a happening group during the Triassic/Jurassic transition, too.
One of these early Mesozoic fish was Hemicalypterus, known from fossils first uncovered in Utah in the 1960s. It wasn’t terribly big–at about 6.5 cm (2.5 inches) long, it would have fit comfortably into your typical home aquarium. Yet, Sarah’s study of newly discovered fossils revealed some surprising details–including the fact that Hemicalypterus may have evolved herbivory tens of millions of years before other fish did. Sarah was kind enough to answer a few questions about this work, outlined below. I hope you’ll agree that Hemicalypterus was a pretty cool little fish!
Hemicalypterus weiri has been known for awhile; what makes a restudy of this organism so important? How does it fit into the broader realm of fish work?
SG: It’s important to revisit and restudy old organisms, especially when you find new information about them. And Hemicalypterus, when it was described in the 1960s, was incomplete. The new fossils we discovered in the past twelve years gave so much additional information than what Bobb Schaeffer (who named Hemicalypterus) had access to back then that it warranted a redescription. And more importantly, the evolutionary relationship of Hemicalypterus to other ray-finned fishes has never been considered within the context of a phylogenetic analysis, so no one really had a good idea of what it was closely related to. My paper in PLOS is the first to suggest where Hemicalypterus fits in the evolutionary relationships of lower ray-finned fishes. It’s important to consider these taxa! They may not have living relatives so they often get overlooked, but in the broader realm of fish work, these fishes were evolving in ways that could impact our understanding of the evolutionary history of fishes today. They were also moving into novel ecological niches, such as herbivory, long before we ever thought fishes did, so that, too, gives us clues about the environment at the time, the ecology, and the feeding behaviors and niches of early ray-finned fishes.
As you discuss in the paper, congruent with other previous work, the teeth of Hemicalypterus suggest it was potentially herbivorous. What kinds of plants might it have been feeding on? When did other fish evolve herbivory?
SG: I think the best analogy for what the teeth of Hemicalypterus look like is that each tooth looks like a little “spork”, with a recurved spatulate crown and tiny little toothlets on the end. The teeth are also pretty delicate, so Hemicalypterus was probably not crushing invertebrates or some other hard prey. When I first discovered the teeth while prepping newly collected fossils, I had no idea what a tooth with this type of morphology would be used for because I had never seen anything like it in any of the fossil fishes I was familiar with. So I started looking at modern fishes, and found that quite a few living fishes in several families and in different habitats have a similar tooth morphology, and they all use their teeth to scrape algae off of a rocky or woody substrate. They are all herbivorous or at least partially herbivorous, with algae the predominant part of their diet. Some living examples are fishes such as freshwater algae-scraping ciclids and marine surgeonfishes and butterflyfishes. So, Hemicalypterus was also likely scraping algae! There’s a great video [shown below] of an algae-scraping cichlid (Labeotropheus) in the wild in Africa displaying this specific feeding behavior, and I suspect Hemicalypterus was doing something similar.
Before discovery of this type of tooth morphology in Hemicalypterus, it was generally accepted that herbivory in fishes did not evolve until around 50 million years ago, in the Eocene. In deposits from the Monte Bolca Formation, many fishes are preserved that are extinct relatives of living herbivorous teleost fishes (such as rabbitfishes, surgeonfishes, etc.), and some of these fossils from the Monte Bolca Formation have a similar tooth morphology. There are also isolated teeth with similar multicuspid edges from Cretaceous deposits in Africa in Asia, but no one really hypothesized that these belonged to herbivorous fishes. But Hemicalypterus is from the Triassic! Regardless, it is the oldest potential evidence for the evolution of herbivory in fishes!
There are a whole ton of new specimens of Hemicalypterus weiri in your paper–what has happened to give us this new bounty of scientific information?
SG: Hemicalypterus fossils are mostly found in southeastern Utah in the Chinle Foration. When fish fossils were discovered in the Chinle in Utah in the mid-20th century, it was kind of by accident. USGS Geologists were exploring for uranium deposits, and documented fish fossils in some layers. The American Museum of Natural History and the Smithsonian National Museum of Natural History made a big push in the 1950s and 1960s to collect and describe fishes and other fossils from the area. But more recently there has been a strong, collaborative effort to thoroughly assess and document the geology and biodiversity of the Chinle Formation in Utah and how it all relates to other Chinle Formation deposits elsewhere. Researchers from the University of Utah, the St. George Dinosaur Discovery Site at Johnson Farm (in St. George, Utah), Petrified Forest National Park, and other institutions, have been going out to southeastern Utah to survey, map, and collect fossils from this region. I’m lucky to be the resident fishy person in this collaboration! The work has produced hundreds of fish fossils, and in addition to my work on Hemicalypterus, I’ve described a new genus and two new species of semionotid fishes (Lophionotus sanjuanensis and L. chinleana), and am currently working with colleages, as well as for my own dissertation, on other fishes from the sites. There’s a lot of cool fishy critters to come!
One thing I’ve always wondered is why some paleontologists put that little dagger or cross in front of their extinct study taxa. But, at least in dinosaurs (and most mammal papers I’ve read), it’s not really common practice. Why are fish workers so weird? Is it a cultural thing?
SG: Ha! Well, fish workers can be a little bit weird sometimes! But it’s really because ichthyology and paleoichthyology cross over far more than probably any other sub-disciplines of vertebrate zoology or paleontology, due to the fantastic fossil record for fishes (they just happen to live in the perfect place for deposition and preservation) and the fact that fishes are still one of the most (if not the most) abundant vertebrate on the planet today! Good ichthyologists take into consideration the fossil record when trying to resolve evolutionary relationships of their respective groups or when estimating the time of divergence of a clade, and likewise good paleoichthyologists consider living taxa in their studies of fossil taxa, their evolutionary relationships, and evolutionary history. But because there are so many living and extinct taxa in any given fish clade, the dagger just helps clarify that this fish/family/order is completely extinct. It’s not a mandatory practice, just a courtesy to help ichthyologists keep track. I try to use it consistently when I’m publishing in a journal that is not solely paleontology (because it would be a redundant practice in a paleontology-specific journal).
It’s also not limited to fish scientists; other paleontologists often use the dagger to indicate extinct taxa when they, too, have living representative taxa. It would be quite silly to see the on Tyrannosaurus rex because there are no living tyrannosaurids, so no need to clarify!
What was your favorite part of working on this project?
SG: I think the best part of working with Hemicalypterus was discovering the teeth. I really had a double-take moment while prepping the fossils in the lab at the University of Kansas. When I first saw the teeth, in particular a row of five or so on the lower jaw, I really couldn’t figure out what I was looking at! Was it an error? Was it another animal? Was it fake!? Is this a prank?! What is going on!?! (All real thoughts) When I realized that those in fact were the teeth, I freaked out, in a good way! I think I ran around the museum telling anyone I saw what I had found! That kind of excitement is hard to convey in a dry scientific text, but it’s the kind of thing that makes research worth it!
Reference:
Sarah Z. Gibson et al. Redescription and Phylogenetic Placement of Hemicalypterus weiri Schaeffer, 1967 (Actinopterygii, Neopterygii) from the Triassic Chinle Formation, Southwestern United States: New Insights into Morphology, Ecological Niche, and Phylogeny, PLOS ONE (2016). DOI: 10.1371/journal.pone.0163657