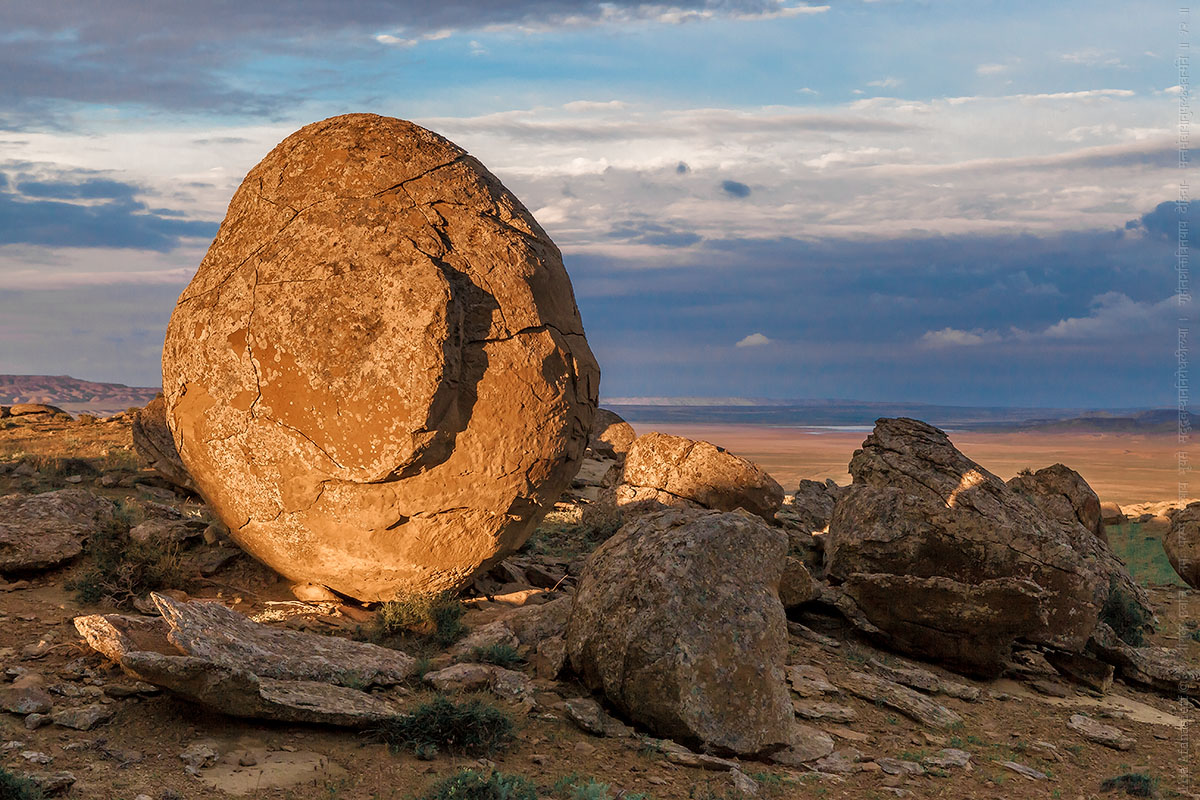
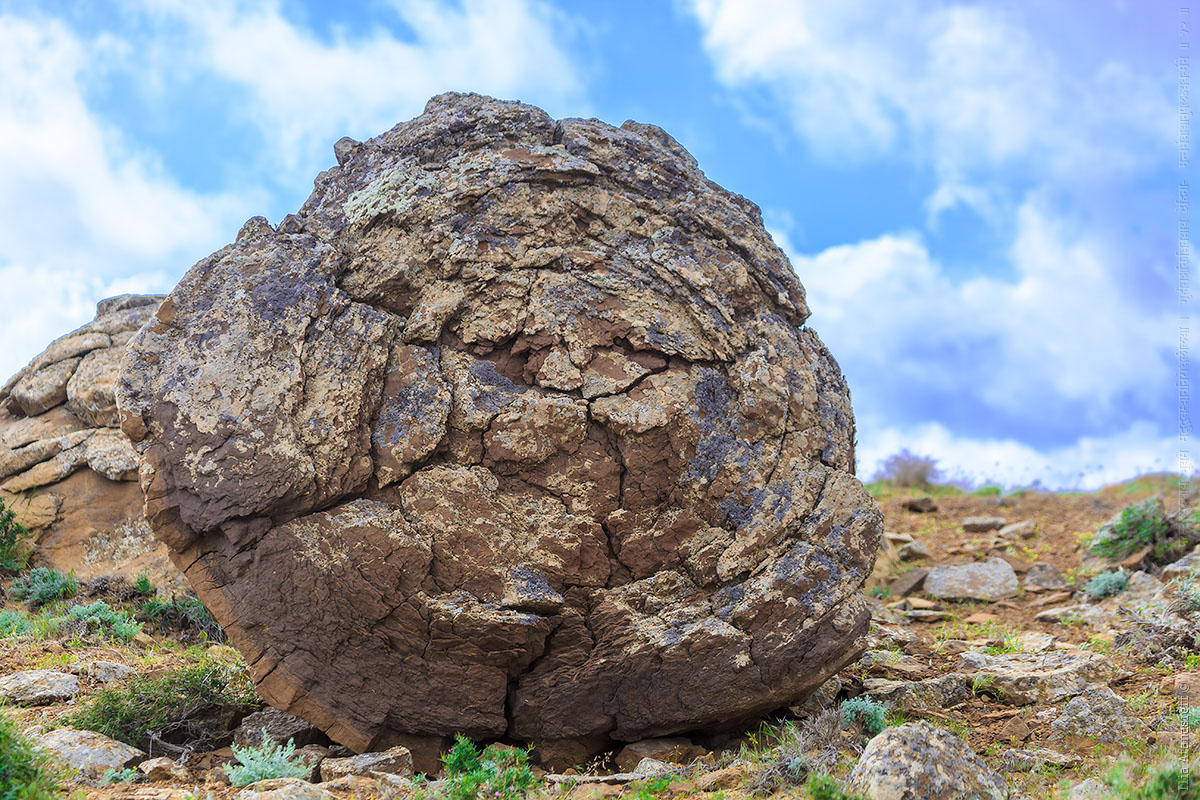
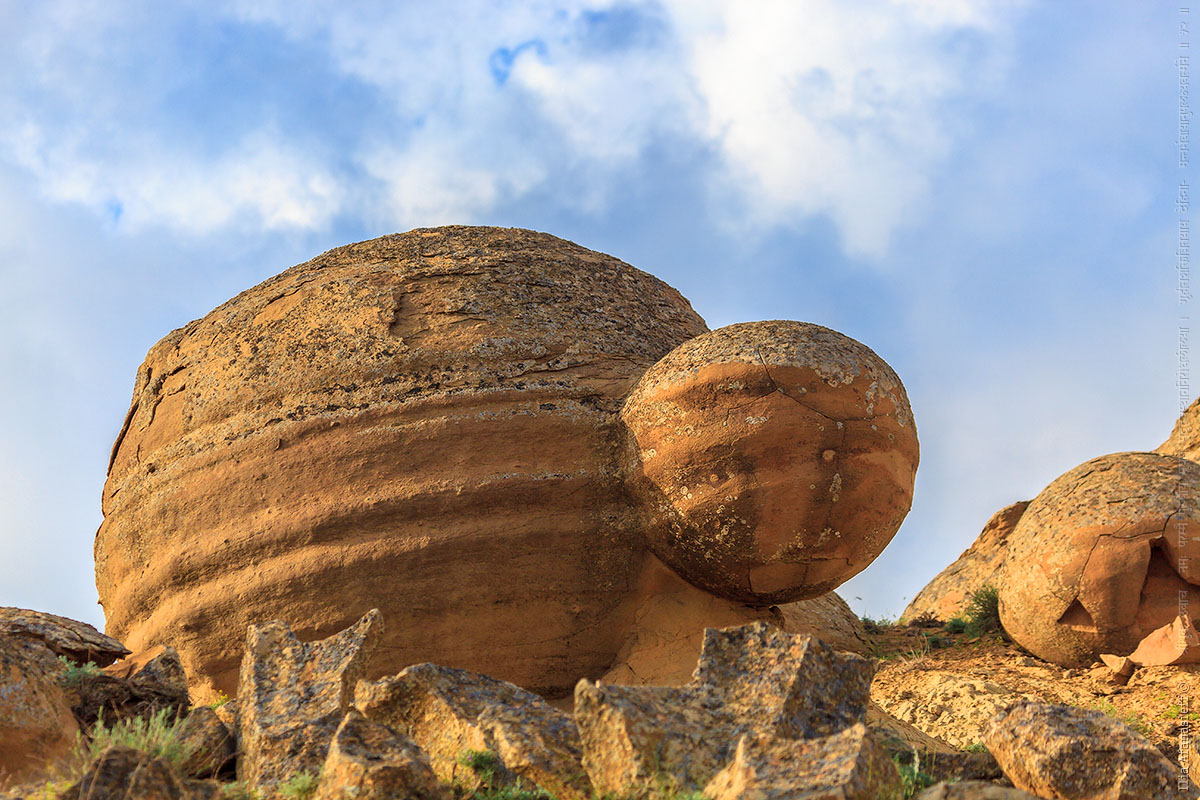
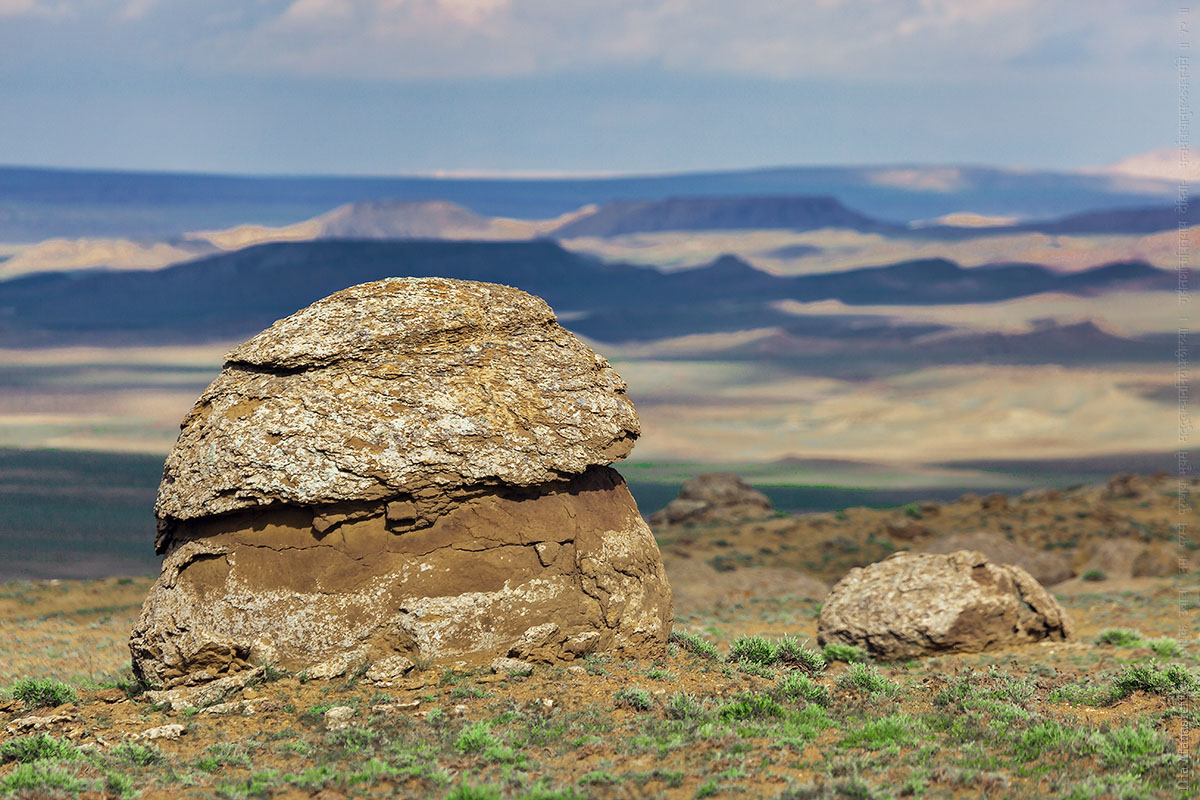
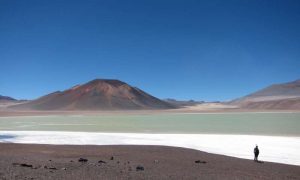
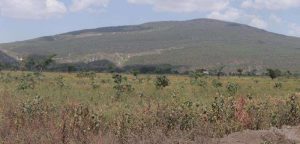
The Mangystau region of Kazakhstan, near the borders of Turkmenistan and Uzbekistan, is a huge, empty place. In total, it covers 165,600 square kilometers – an area larger than England.
The geography of the region varies between tundra, grasslands, epic mountains and dusty, dry barren wilderness.
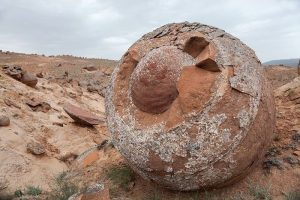
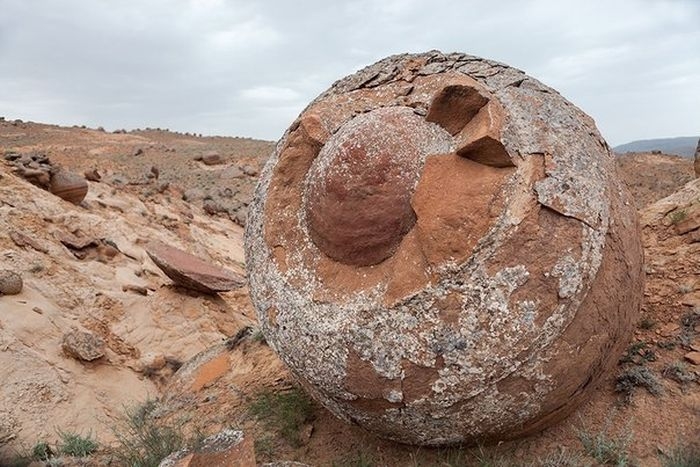
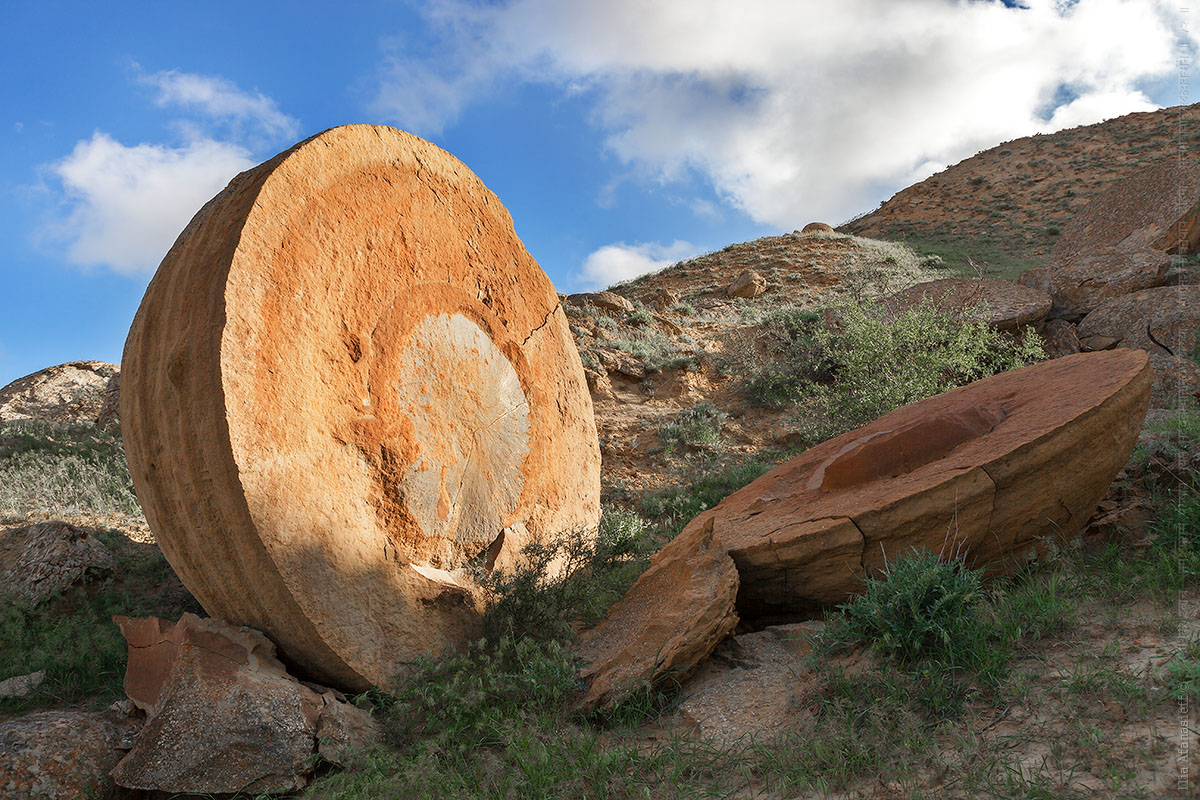
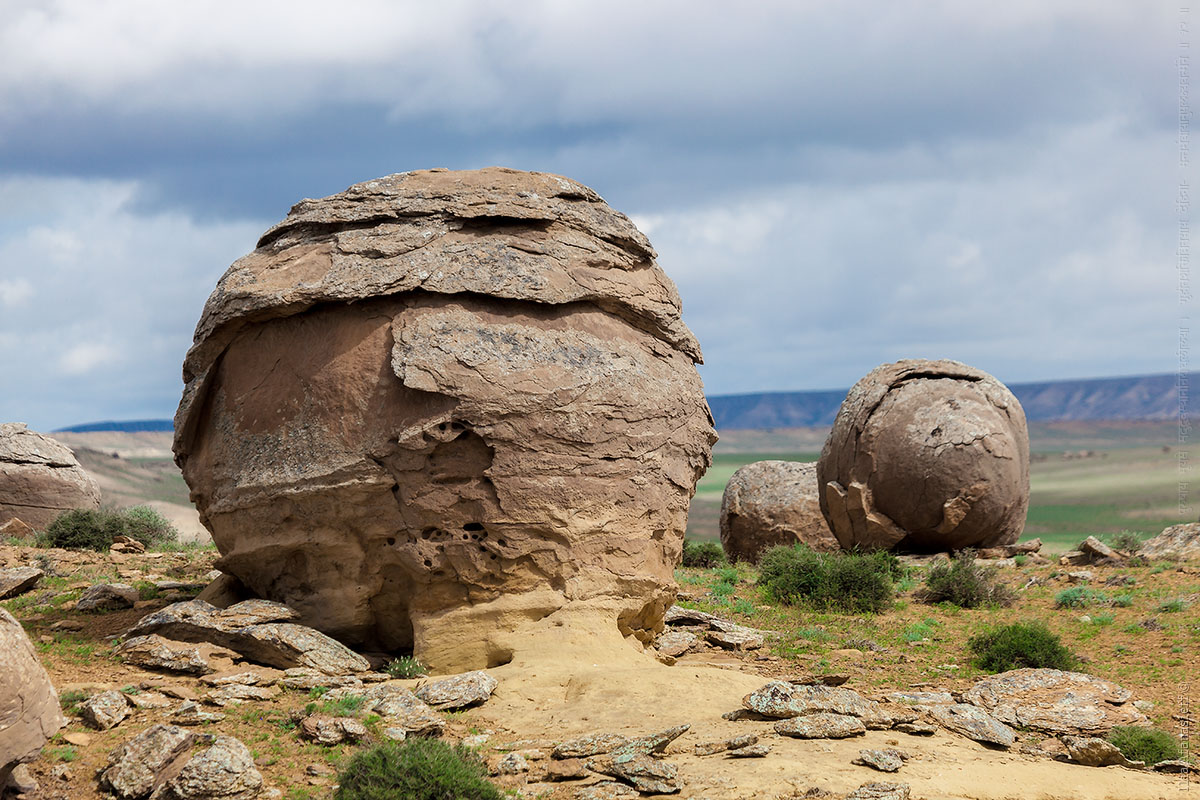
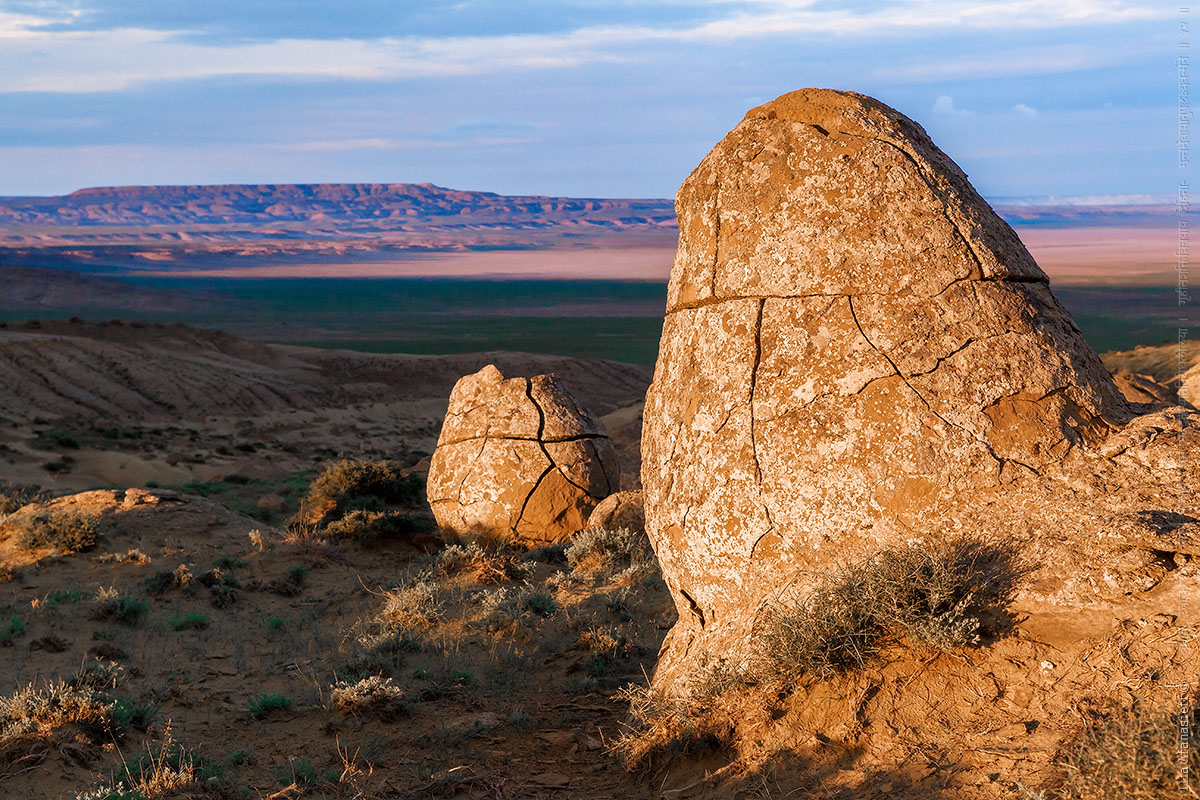
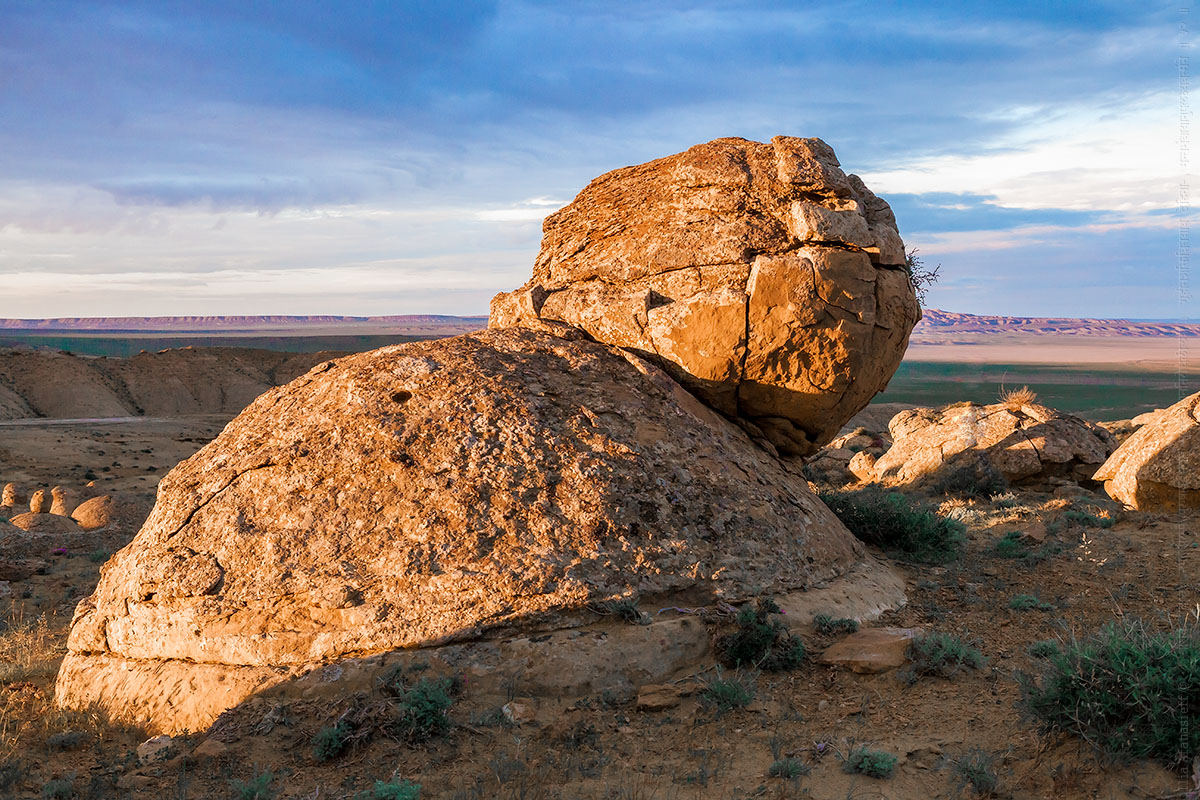
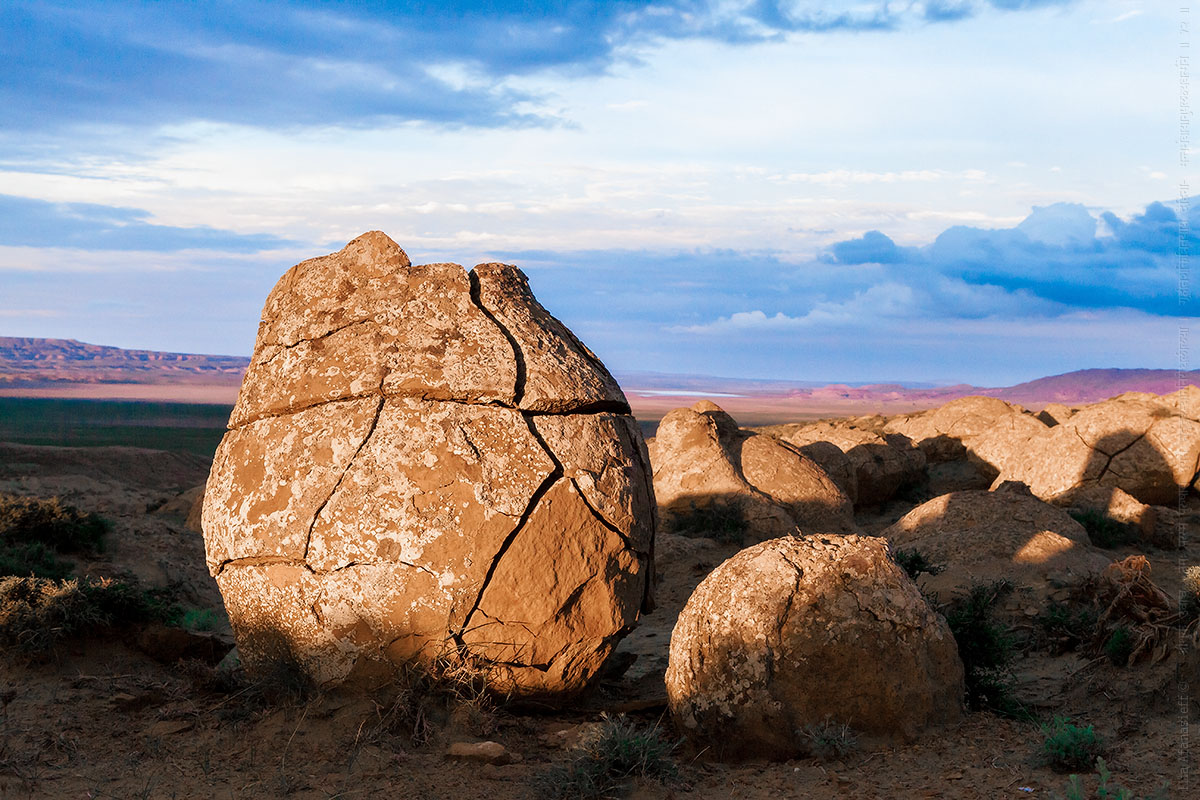
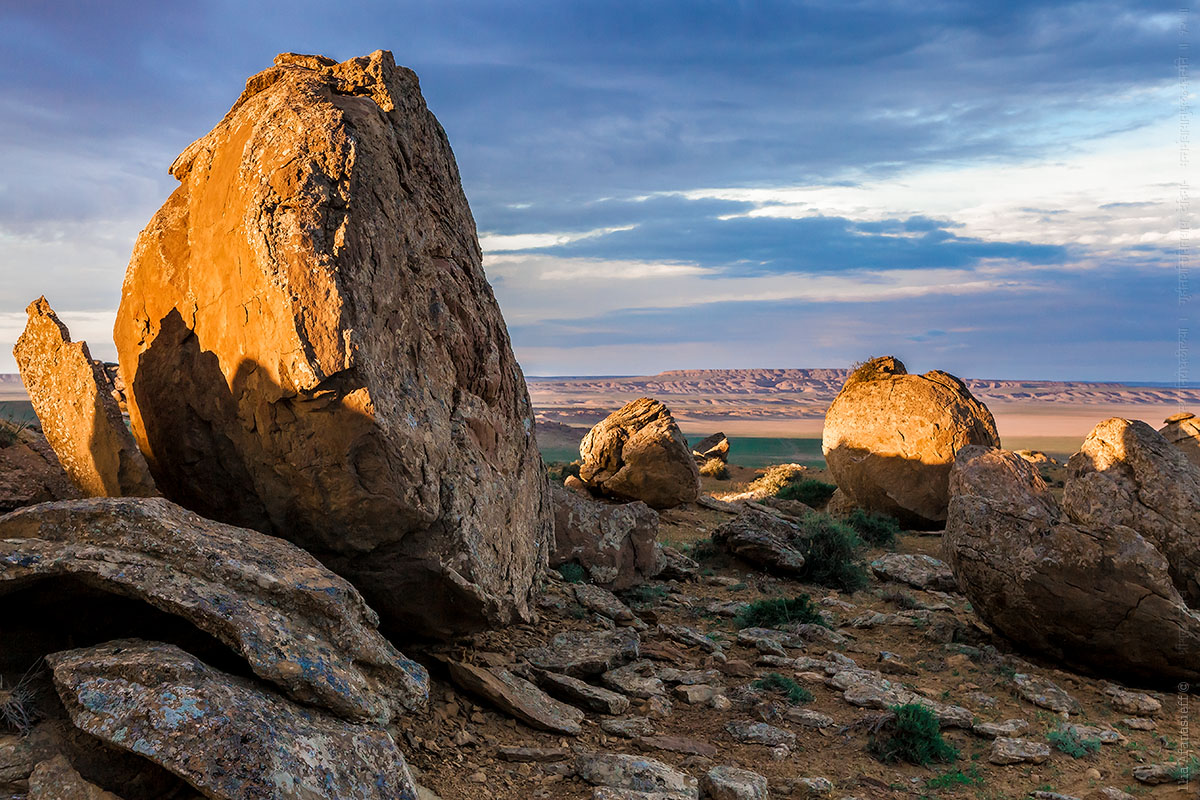
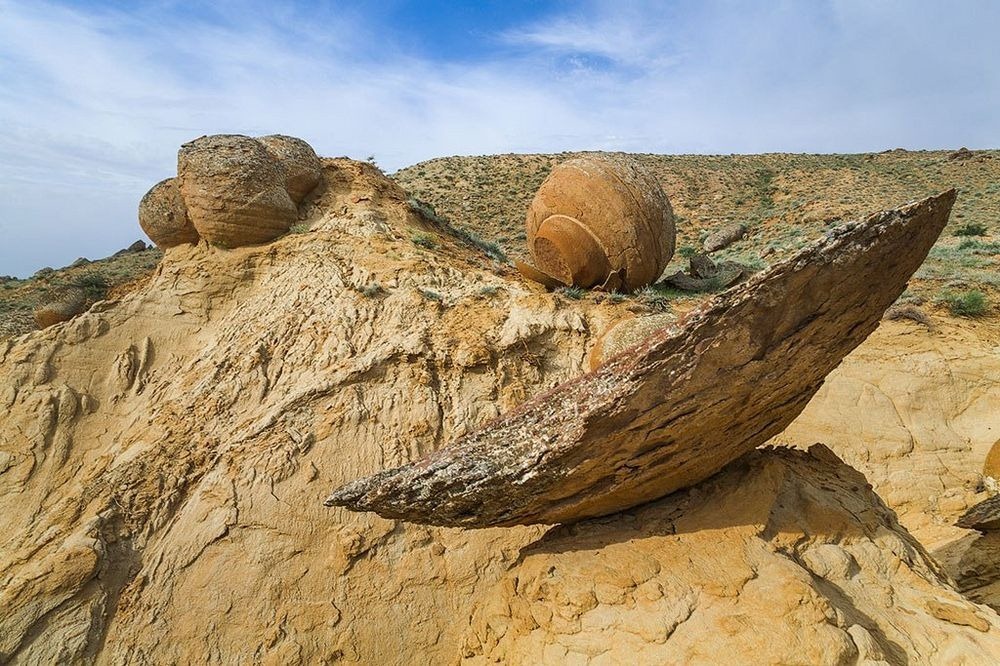
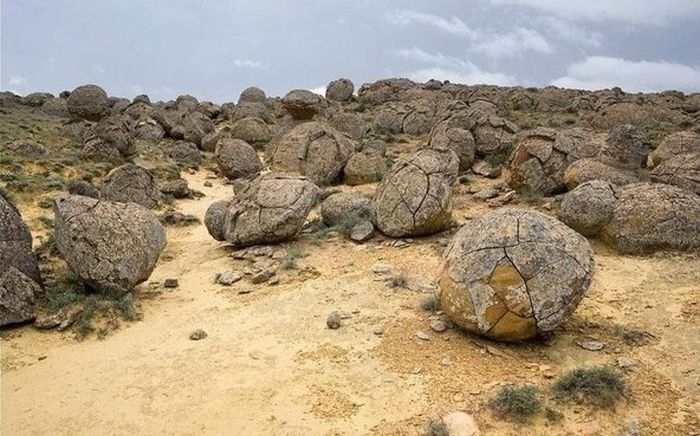
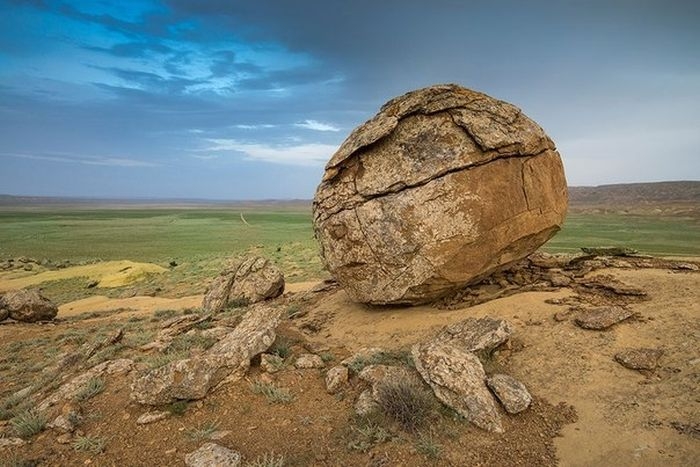
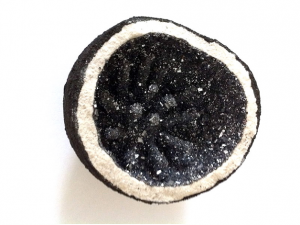
The size of spherical concretions is up to 4 meters in diameter. The time of origin is about 180-120 million years ago. Concretion – from the Latin word “concretio” – fusion, thickening.
They are round-shaped mineral formations found in sedimentary rocks, formed, for some not entirely clear reason, around grains of minerals, shells, teeth and bones of fish, plant residues, etc.
How concretion occurs:
“A concretion is a compact mass of mineral matter, usually spherical or disk-shaped, embedded in a host rock of a different composition. This hard, round mass of sedimentary rock cement is carried into place by ground water. Concretions, the most varied-shaped rocks of the sedimentary world, occur when a considerable amount of cementing material precipitates locally around a nucleus, often organic, such as a leaf, tooth, piece of shell or fossil.”
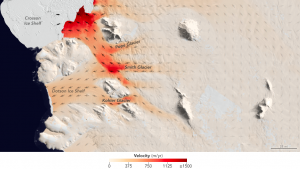
For a pair of recent studies, UCI and NASA JPL scientists examined three neighboring glaciers in West Antarctica that are melting and retreating at different rates. The Smith, Pope and Kohler glaciers flow into the Dotson and Crosson ice shelves in the Amundsen Sea embayment in West Antarctica, the part of the continent with the largest loss of ice mass. Credit: NASA JPL
Two new studies by researchers at the University of California, Irvine and NASA have found the fastest ongoing rates of glacier retreat ever observed in West Antarctica and offer an unprecedented look at ice melting on the floating undersides of glaciers. The results highlight how the interaction between ocean conditions and the bedrock beneath a glacier can influence the frozen mass, helping scientists better predict future Antarctica ice loss and global sea level rise.
The studies examined three neighboring glaciers that are melting and retreating at different rates. The Smith, Pope and Kohler glaciers flow into the Dotson and Crosson ice shelves in the Amundsen Sea embayment in West Antarctica, the part of the continent with the largest decline in ice.
“Our primary question is how the Amundsen Sea sector of West Antarctica will contribute to sea level rise in the future, particularly following our observations of massive changes in the area over the last two decades,” said UCI’s Bernd Scheuchl, lead author on the first of the two studies, published in the journal Geophysical Research Letters in August.
“Using satellite data, we continue to measure the evolution of the grounding line of these glaciers, which helps us determine their stability and how much mass the glacier is gaining or losing,” said the Earth system scientist. “Our results show that the observed glaciers continue to lose mass and thus contribute to global sea level rise.”
Scheuchl’s team compared radar measurements from the European Space Agency’s Sentinel-1 mission and data from the earlier ERS-1 and ERS-2 satellites to identify changes in each glacier’s grounding line — the boundary where it loses contact with bedrock and begins to float on the ocean.
The grounding line is important because nearly all glacier melting takes place on the underside of this floating portion, called the ice shelf. If a glacier loses mass from enhanced melting, it may start floating farther inland from its former grounding line, just as a boat stuck on a sandbar may be able to float again if a heavy cargo is removed. This is called grounding line retreat.
UCI and NASA researchers found that the Smith Glacier’s grounding line had retreated 1.24 miles (2 kilometers) per year since 1996. The Pope Glacier’s grounding line receded more slowly, at 0.31 miles (0.5 kilometers) annually since 1996. And the Kohler Glacier’s grounding line, which had gradually retreated, actually readvanced 1.24 miles (2 kilometers) since 2011.
Scheuchl credits the Sentinel-1 radar mission with changing the way scientists look at polar ice sheets. “It’s a two-satellite constellation with funding for more than 20 years, and Europe is committing resources for regular ice sheet data acquisitions,” he said. “Our work shows that the data collected is very well-suited for ice sheet science, and we can combine it with other satellite and airborne data sets to establish a more detailed record of these glaciers.”
For a separate study, the NASA Jet Propulsion Laboratory’s Ala Khazendar — a co-author of Scheuchl’s paper — measured ice loss at the bottom of the three glaciers, which he suspected might be influencing the changes in their grounding lines. His work, published today in the journal Nature Communications, involved gauging the thickness and height of the ice via radar and laser altimetry instruments utilized in NASA’s Operation IceBridge and earlier NASA airborne campaigns.
Radar waves penetrate glaciers all the way to their base, allowing direct assessment of how the bottom profiles of the three glaciers at their grounding lines differed between 2002 and 2014. Laser measurements of surface elevation were used to infer changes in the thickness of the floating ice shelves.
Previous studies using other techniques estimated the average melting rates at the bottom of the Dotson and Crosson ice shelves to be about 40 feet (12 meters) per year. Khazendar and his team, analyzing their direct radar measurements, found stunning rates of ice loss from the glaciers’ undersides on the ocean sides of their grounding lines. The fastest-melting glacier, Smith, lost between 984 and 1,607 feet (300 and 490 meters) in thickness between 2002 and 2009 near its grounding line, or up to 230 feet (70 meters) per year.
Those years encompass a period when rapid mass loss was seen around the Amundsen Sea. The regional scale of the decline made scientists strongly suspect that an increase in the influx of ocean heat beneath the ice shelves must have taken place. “Our observations provide a crucial piece of evidence to support that suspicion, as they directly reveal the intensity of ice melting at the bottom of the glaciers during that period,” Khazendar said.
“If I had been using data from only one instrument, I wouldn’t have believed what I was looking at, because the thinning was so large,” he added. However, the two IceBridge instruments, which employ different techniques, both measured the same rapid ice loss.
Khazendar said Smith’s fast retreat and thinning are likely related to the shape of the underlying bedrock over which it was retreating between 1996 and 2014, which sloped downward toward the continental interior, and oceanic conditions in the cavity beneath the glacier. As the grounding line receded, warm and dense ocean water could reach the newly uncovered deeper parts of this cavity, causing more melting.
As a result, Khazendar said, “more sections of the glacier become thinner and float, meaning that the grounding line continues retreating, and so on.” Smith’s retreat might slow down now that its grounding line has reached bedrock that rises farther inland of the 2014 grounding line. Pope and Kohler, in contrast, are on bedrock that slopes upward toward the interior.
The question remains whether other glaciers in West Antarctica will behave more like Smith or more like Pope and Kohler. Many glaciers in this sector of Antarctica are on beds that deepen farther inland, like Smith’s. However, Khazendar and Scheuchl said, researchers need more information on the shape of the bedrock and seafloor beneath the ice, as well as more data on ocean circulation and temperatures, to be able to better project how much ice these glaciers will contribute to the ocean in a changing climate.
Scheuchl’s co-authors on the Geophysical Research Letters study are JPL’s Khazendar and Jeremie Mouginot, Mathieu Morlighem and Eric Rignot from UCI’s Department of Earth System Science.
Khazendar’s co-authors on the Nature Communications study are UCI’s Mouginot, Rignot, Scheuchl and Isabella Velicogna, along with Dustin Schroeder, Helene Seroussi, Michael Schodlok and Tyler Sutterley of JPL.
Reference:
B. Scheuchl, J. Mouginot, E. Rignot, M. Morlighem, A. Khazendar. Grounding line retreat of Pope, Smith, and Kohler Glaciers, West Antarctica, measured with Sentinel-1a radar interferometry data. Geophysical Research Letters, 2016; 43 (16): 8572 DOI: 10.1002/2016GL069287
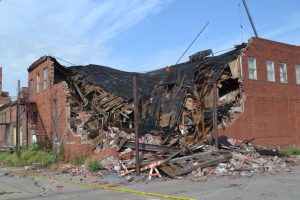
Representative Image: A collapsed building in Cushing, Oklahoma, after several 4.0-range quakes
The third-largest earthquake in Oklahoma was likely triggered by underground disposal of wastewater from oil and natural gas production, the U.S. Geological Survey found in a report issued Monday.
The magnitude 5.1 quake that struck northwest of Fairview in February was likely induced by distant disposal wells, the agency said. The USGS report indicated that in the area around where the Fairview quake occurred, the volume of fluid injected had increased sevenfold over three years.
The Fairview temblor had been the largest in the central and eastern U.S. since a magnitude 5.7 quake hit near Prague in 2011. In September, the largest earthquake in the state struck near Pawnee with a magnitude 5.8. The relationship between that quake and wastewater injection is still being studied.
A study by the U.S. Geological Survey last year suggested that the sharp rise in earthquakes in Oklahoma in the past 100 years had likely been the result of industrial activities in the energy-rich state, such as oil and natural gas production.
Geologists say earthquakes of magnitude 2.5 to 3.0 are generally smallest that are felt by humans; damage is not likely in quakes below magnitude 4.0.
In response to research suggesting a wastewater disposal-earthquake link, state regulators have ordered the shutdown of some disposal wells and asked producers to reduce disposal volumes in earthquake-prone regions of the state.
Note: The above post is reprinted from materials provided by The Associated Press.
The fluorite mineral the stone is fashioned from is more valuable than diamonds in China
Weighing six tons and standing 5ft tall, this luminous pearl may be hard to shift physically speaking – but even with a mammoth £88million price tag it shouldn’t be too hard to find a buyer.
The stone, formed mostly of a fluorite mineral, glows green in the dark and is prized more highly than diamonds in China.
It was unearthed in the Chinese region of Inner Mongolia and took its finders three years to grind the raw gem down to its pearl shape.
It has gone on show in Hainan, southern China, to attract buyers and have measurements taken for a world record bid.
It is amazing and glows a blue green in the dark,’ remarked one show organiser.
‘These pearls are very sought after in China, especially when they are this size.’
The luminous stones, sometimes known as a Chintamani, are a wish-fulfilling jewel within the Buddhist religion.
Fluorite is well known for the amazing colours it can give out, so much so that it has been given the nickname of ‘the most colourful mineral in the world’.
Its unique properties mean that the characteristic of fluorescence, when a material emits light, is named after fluorite itself.
Scientists believe that fluorite glows in the dark because of mineral impurities in the lattice that makes up its structure, as well as exposure to radiation from the atmosphere over time. Green colours are slightly rarer than the others and may be due to the presence of rare earth ions such as manganese.
In fluorite, the visible light emitted is most commonly blue, but it can be almost any colour imaginable -like this green pearl – ‘.
Fluorite is also sometimes thermoluminescent – meaning it glows when heated.
Chintamani s depicted on Tibetan prayer flags and tradition maintains that one attains the Wisdom of Buddha by carrying it while reciting a prayer.
Although, such a feat might be too much of a struggle with this stone.
News of the £88m pearl follows the sale last week of the world’s most expensive diamond, which fetched £29million at a Sotheby’s auction in Geneva.
The rectangular rare pink diamond, which weighs 24.78 carats, was bought by the British billionaire jeweller Laurence Graff, 72.
Dubbed ‘The King of Bling’ – Mr Graff said that he had bought the gem for himself and immediately named it ‘The Graff Pink’.
The Altiplano-Puna plateau in the central Andes features vast plains punctuated by spectacular volcanoes, such as the Lazufre volcanic complex in Chile seen here. Credit: Noah Finnegan
A new analysis of the topography of the central Andes shows the uplifting of the Earth’s second highest continental plateau was driven in part by a huge zone of melted rock in the crust, known as a magma body.
The Altiplano-Puna plateau is a high, dry region in the central Andes that includes parts of Argentina, Bolivia, and Chile, with vast plains punctuated by spectacular volcanoes. In a study published October 25 in Nature Communications, researchers used remote sensing data and topographic modeling techniques to reveal an enormous dome in the plateau.
About 1 kilometer (3,300 feet) high and hundreds of miles across, the dome sits right above the largest active magma body on Earth. The uplifting of the dome is the result of the thickening of the crust due to the injection of magma from below, according to Noah Finnegan, associate professor of Earth and planetary sciences at UC Santa Cruz and senior author of the paper.
“The dome is the Earth’s response to having this huge low-density magma chamber pumped into the crust,” Finnegan said.
The uplifting of the dome accounts for about one-fifth of the height of the central Andes, said first author Jonathan Perkins, who led the study as a graduate student at UC Santa Cruz and is now at the U.S. Geological Survey in Menlo Park, Calif.
“It’s a large part of the evolution of the Andes that hadn’t been quantified before,” Perkins said.
Plate tectonics
The other forces uplifting the Andes are tectonic, resulting from the South American continental plate overriding the Nazca oceanic plate. The subduction zone where the Nazca plate dives beneath the western edge of South America is the source of the magma entering the crust and feeding volcanic activity in the region. Water released from the subducting slab of oceanic crust changes the melting temperature of the overlying wedge of mantle rock, causing it to melt and rise into the overriding plate.
Perkins and Finnegan worked with researchers at the University of Arizona who had used seismic imaging to reveal the remarkable size and extent of the Altiplano-Puna magma body in a paper published in 2014. That study detected a huge zone of melted material about 11 kilometers thick and 200 kilometers in diameter, much larger than previous estimates.
“People had known about the magma body, but it had not been quantified that well,” Perkins said. “In the new study, we were able to show a tight spatial coupling between that magma body and this big, kilometer-high dome.”
Based on their topographic analysis and modeling studies, the researchers calculated the amount of melted material in the magma body, yielding an estimate close to the previous calculation based seismic imaging. “This provides a direct and independent verification of the size and extent of the magma body,” Finnegan said. “It shows that you can use topography to learn about deep crustal processes that are hard to quantify, such as the rate of melt production and how much magma was pumped into the crust from below.”
Super-volcanoes
The Altiplano-Puna Volcanic Complex was one of the most volcanically active places on Earth starting about 10 million years ago, with several super-volcanoes producing massive eruptions and creating a large complex of collapsed calderas in the region. Although no major eruptions have occurred in several thousand years, there are still active volcanoes and geothermal activity in the region. In addition, satellite surveys of surface deformation since the 1990s have shown that uplifting of the surface is continuing to occur at a relatively rapid rate in a few places. At Uturuncu volcano located right in the center of the dome, the uplift is about 1 centimeter (less than half an inch) per year.
“We think the ongoing uplift is from the magma body,” Perkins said. “The jury is still out on exactly what’s causing it, but we don’t think it’s related to a supervolcano.”
The growth of the crust beneath the Altiplano-Puna plateau, driven by the intrusion of magma from below, is a fundamental process in the building of continents. “This is giving us a glimpse into the factory where continents get made,” Perkins said. “These big magmatic systems form during periods called magmatic flare-ups when lots of melt gets injected into Earth’s crust. It’s analogous to the process that created the Sierra Nevada 90 million years ago, but we’re seeing it now in real time.”
In addition to Perkins and Finnegan, the coauthors of the paper include Kevin Ward, George Zandt, and Susan Beck at the University of Arizona and Shanaka de Silva at Oregon State University. This research was funded by the National Science Foundation.
Reference:
Jonathan P. Perkins, Kevin M. Ward, Shanaka L. de Silva, George Zandt, Susan L. Beck & Noah J. Finnegan. Surface uplift in the Central Andes driven by growth of the Altiplano Puna Magma Body. DOI: 10.1038/NCOMMS13185
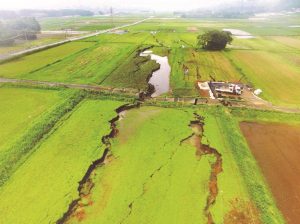
Drone image of co-seismic ruptures near Aso volcano. Credit: Image courtesy of Kyoto University
Damage from the 2016 Kumamoto earthquake could hasten Mt. Aso’s eruption, volcanologists warn. In a paper published on Science, Kyoto University researchers and colleagues report new faults in the vicinity of Mt. Aso’s magma chamber and volcanic cones, which they say could alter spatial and mechanical properties of Aso volcano.
Mt. Aso is one of the largest active volcanoes in the world. The 16 April 2016 Kumamoto earthquake, study authors say, were a rare opportunity to study how faults form in the vicinity of volcanoes. “Our survey group went to the epicenter area one day after the event and continued field work for the past half year after the earthquake,” says Aiming Lin of Kyoto University, who led the study.
The Kumamoto earthquake enabled the researchers to do a before-and-after comparison of fault distribution in the area. Field investigations, seismic data, and analysis of high-resolution Google earth images show that the earthquake produced new faults and surface ruptures.
Some of these cut Aso caldera but terminated there.
“Magma is fluid so it absorbs stress. That’s why the damage — the co-seismic rupturing — shouldn’t travel any further,” says Lin. “Large earthquakes often accompany or precede volcanic eruptions. The presence of magma does have an association with the distribution of active faults. But whether volcanoes affect the fault rupturing following an earthquake remained unclear due to the lack of case studies.
“Our findings show that propagation of ruptures from this earthquake terminated in Aso caldera because of the presence of magma beneath the Aso volcanic cluster.”
The newly formed co-seismic ruptures under Aso caldera are potential new channels for magma venting, thus changing the physical dynamics of Aso volcano, such as where pressure is concentrated. These then influence factors like the nucleation of interpolate earthquakes, seismicity patterns, source rupture processes, strong ground motion and recurrence behavior of fault segments. The study results, the authors wrote, could play an important role in reassessing volcanic hazard in the Aso volcano area.
And Mt Aso did erupt 8th October 2016, after the research team had submitted the paper.
“We are surprised that Aso volcano erupted after a 36 years dormant duration, as we documented in this paper that the new faults changed the spatial and mechanical dynamics of Aso volcano,” says Lin.
Reference:
A. Lin, T. Satsukawa, M. Wang, Z. Mohammadi Asl, R. Fueta, F. Nakajima. Coseismic rupturing stopped by Aso volcano during the 2016 Mw 7.1 Kumamoto earthquake, Japan. Science, 2016; DOI: 10.1126/science.aah4629
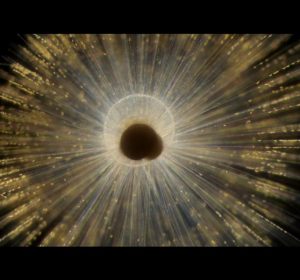
Foraminifera are marine organisms whose shells, buried in marine sediments, provide a record of past climate stretching back 200 million years. A new study by UC Davis, University of Washington and Pacific Northwest National Lab applies material science techniques to understand how foraminifera build their shells, and may help improve our understanding of this climate record. Image shows the foraminiferan Orbulina universa. Credit: Howard Spero, UC Davis
For the first time scientists can see how the shells of tiny marine organisms grow atom-by-atom, a new study reports. The advance provides new insights into the mechanisms of biomineralization and will improve our understanding of environmental change in Earth’s past.
Led by researchers from the University of California, Davis and the University of Washington, with key support from the U.S. Department of Energy’s Pacific Northwest National Laboratory, the team examined an organic-mineral interface where the first calcium carbonate crystals start to appear in the shells of foraminifera, a type of plankton.
“We’ve gotten the first glimpse of the biological event horizon,” said Howard Spero, a study co-author and UC Davis geochemistry professor. The findings were published in the Proceedings of the National Academy of Sciences.
Foraminifera’s Final Frontier
The researchers zoomed into shells at the atomic level to better understand how growth processes may influence the levels of trace impurities in shells. The team looked at a key stage — the interaction between the biological ‘template’ and the initiation of shell growth. The scientists produced an atom-scale map of the chemistry at this crucial interface in the foraminifera Orbulina universa. This is the first-ever measurement of the chemistry of a calcium carbonate biomineralization template, Spero said.
Among the new findings are elevated levels of sodium and magnesium in the organic layer. This is surprising because the two elements are not considered important architects in building shells, said lead study author Oscar Branson, a former postdoctoral researcher at UC Davis who is now at the Australian National University in Canberra. Also, the greater concentrations of magnesium and sodium in the organic template may need to be considered when investigating past climate with foraminifera shells.
Calibrating Earth’s Climate
Most of what we know about past climate (beyond ice core records) comes from chemical analyses of shells made by the tiny, one-celled creatures called foraminifera, or “forams.” When forams die, their shells sink and are preserved in seafloor mud. The chemistry preserved in ancient shells chronicles climate change on Earth, an archive that stretches back nearly 200 million years.
The calcium carbonate shells incorporate elements from seawater — such as calcium, magnesium and sodium — as the shells grow. The amount of trace impurities in a shell depends on both the surrounding environmental conditions and how the shells are made. For example, the more magnesium a shell has, the warmer the ocean was where that shell grew.
“Finding out how much magnesium there is in a shell can allow us to find out the temperature of seawater going back up to 150 million years,” Branson said.
But magnesium levels also vary within a shell, because of nanometer-scale growth bands. Each band is one day’s growth (similar to the seasonal variations in tree rings). Branson said considerable gaps persist in understanding what exactly causes the daily bands in the shells.
“We know that shell formation processes are important for shell chemistry, but we don’t know much about these processes or how they might have changed through time,” he said. “This adds considerable uncertainty to climate reconstructions.”
Atomic Maps
The researchers used two cutting-edge techniques: Time-of-Flight Secondary Ionization Mass Spectrometry (ToF-SIMS) and Laser-Assisted Atom Probe Tomography (APT). ToF-SIMS is a two-dimensional chemical mapping technique which shows the elemental composition of the surface of a polished sample. The technique was developed for the elemental analysis of complex polymer materials, and is just starting to be applied to natural samples like shells.
APT is an atomic-scale three-dimensional mapping technique, developed for looking at internal structures in advanced alloys, silicon chips and superconductors. The APT imaging was performed at the Environmental Molecular Sciences Laboratory, a U.S. Department of Energy Office of Science User Facility at the Pacific Northwest National Laboratory.
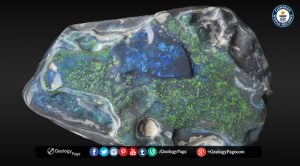
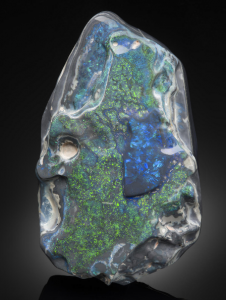
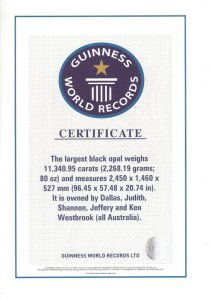
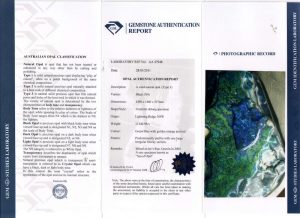
The largest black opal weighs 11,340.95 carats (2,268.19 grams; 80 oz) and measures 2,450 x 1,460 x 527 mm (96.45 x 57.48 x 20.74 in). It is owned by Dallas, Judith, Shannon, Jeffery and Ken Westbrook (all Australia). The black opal was found in Lightning Ridge, New South Wales, Australia.
Gem-like broad flash blue-green play-of-color is seen on this portion of the specimen, while fine iridescent green, blue and vivid orange pinfire play-of-color covers a large extent of the face. True black potch is seen to the reverse.
It’s name obtained directly from the miner, it was he who named the specimen “The Sea of Opal”. His inspiration was two-fold: the outline of the large raised blue patch of color in the center has a resemblance to a swimming fish and the green flash that is seen at the apex is reminiscent of seaweed. Yet the name also evokes the geology of the region in that the center of the Australian continent was once an inland sea, the mineralized waters of which were responsible for producing the opal which we so admire today.
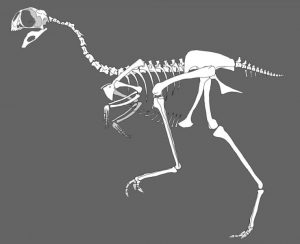
This is an Avimimus reconstruction by Gregory Funston, University of Alberta. Credit: Gregory Funston
In the paleontology popularity contest, studying the social life of dinosaurs is on the rise.
A new publication on the bird-like dinosaur Avimimus, from the late-Cretaceous suggests they were gregarious, social animals — evidence that flies in the face of the long-held mysticism surrounding dinosaurs as solo creatures.
“The common mythology of dinosaurs depicts solitary, vicious monsters running around eating everything,” explains Gregory Funston, PhD student and Vanier scholar at the University of Alberta. “Our discovery demonstrates that dinosaurs are more similar to modern animals than people appreciate. Although the players are different, this evidence shows that dinosaurs were social beings with gregarious behaviour who lived and died together in groups.”
The discovery comes from a site in Mongolia, first encountered by paleontologists a decade ago. The site contained thousands of shards of destroyed bone, belying the telltale evidence of a previous discovery by fossil poachers. After conducting additional field work, scientists discovered a bonebed with an assemblage of Avimimus dinosaurs, who were extremely rare prior to this discovery.
Funston, who has traveled to Mongolia several times to work on the material, explains that though it is common knowledge that modern birds form flocks, this is the first evidence of flocking behavior in bird-like dinosaurs.
“With an assemblage like this, you can’t really understand why the dinosaurs died together unless you see the field site,” says Funston. “We can tell that they were living together around the time of death, but the mystery still remains as to why.”
What the paleontologists do know is that the discovery highlights the potential trend of increasing gregariousness and social behaviour in dinosaurs.
“There are groups of dinosaurs that become social towards the end of the Cretaceous. What still remains to be solved is whether this increasing trend is based on dinosaur behavior or it if it’s because of how the fossils were preserved.”
Bonebeds provide good evidence that the animals were living together in herds or groups. Though rare in the Jurassic and Triassic, they dominate the Cretaceous period. However, this is the first discovery of a bonebed of bird-like dinosaurs.
Funston says that perhaps more important than the scientific findings is shedding light on the increasing incidence of fossil poaching and how this affects scientific understanding. For this reason, he and his co-authors have published their findings in the open-access Scientific Reports, part of the Nature group of scientific journals. Inspired by their mentor who has been working in Mongolia since the 1980s, Currie’s students have taken up not only the scientific cause but also the higher social justice to protect our shared heritage.
The actor Nicholas Cage made headlines in late-2015 when he returned a Tarbosaurus skull to Mongolia — purchased in an auction where he beat out another fossil-loving film star Leonardo DiCaprio — after learning the fossil was poached. Funston says without buyers, the fossil poaching market will dry up, so it is critical to raise awareness of the crime.
“Exposing poaching is almost more important than the science, because cutting off this crime will let the science continue. It changes our attitude about fossils,” says Funston. “They shouldn’t be seen as collectors’ objects but rather as evidence of our shared heritage that helps us understand where we came from and where we are going. To work as part of a team that is helping to ameliorate the situation is a great honour.”
Reference:
Gregory F. Funston, Philip J. Currie, David A. Eberth, Michael J. Ryan, Tsogtbaatar Chinzorig, Demchig Badamgarav, Nicholas R. Longrich. The first oviraptorosaur (Dinosauria: Theropoda) bonebed: evidence of gregarious behaviour in a maniraptoran theropod. Scientific Reports, 2016; 6: 35782 DOI: 10.1038/srep35782
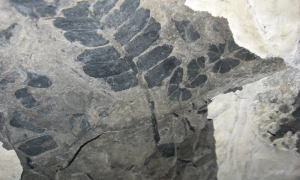
Scientists used fossilized plants, like this seed fern, to reconstruct the ancient atmospheric CO2 record from more than 300 million years ago. Credit: William DiMichele/Smithsonian Institution
The last time Earth experienced both ice sheets and carbon dioxide levels within the range predicted for this century was a period of major sea level rise, melting ice sheets and upheaval of tropical forests.
The repeated restructuring of tropical forests at the time played a major role in driving climate cycles between cooler and warmer periods, according to a study led by the University of California, Davis and published today in the journal Nature Geoscience.
Using fossilized leaves and soil-formed minerals, the international team of researchers reconstructed the ancient atmospheric carbon dioxide record from 330 to 260 million years ago, when ice last covered Earth’s polar regions and large rainforests expanded throughout the tropics, leaving as their signature the world’s coal resources.
The team’s deep-time reconstruction reveals previously unknown fluctuations of atmospheric carbon dioxide at levels projected for the 21st century and highlights the potential impact the loss of tropical forests can have on climate.
Climate Change Feeding Off Itself
“We show that climate change not only impacts plants but that plants’ responses to climate can in turn impact climate change itself, making for amplified and in many cases unpredictable outcomes,” said lead author Isabel Montañez, a Chancellor’s Leadership Professor with UC Davis Department of Earth and Planetary Science. “Most of our estimates for future carbon dioxide levels and climate do not fully take into consideration the various feedbacks involving forests, so current projections likely underestimate the magnitude of carbon dioxide flux to the atmosphere.”
Similarly to how oceans have served as the primary carbon sink in the recent past, tropical forests 300 million years ago stored massive amounts of carbon dioxide during these ancient glacial periods. The study indicates that repeated shifts in tropical forests in response to climate change were enough to account for the 100 to 300 parts per million changes in carbon dioxide estimated during the climate cycles of the period.
While plant biologists have been studying how different trees and crops respond to increasing carbon dioxide levels, this study is one of the first to show that when plants change the way they function as CO2 rises or falls, it can have major impact, even to the point of extinction.
“We see great resilience in vegetation to climatic changes, millions of years of stable composition and structure despite glacial-interglacial cycles,” said co-author William DiMichele, a paleobiologist with the Smithsonian Institution. “But we’ve come to understand that there are thresholds that, when crossed, can be accompanied by rapid and irreversible biological change.”
Co-leading author Jenny McElwain, professor of paleobiology at University College in Dublin, Ireland, said the study indicates that shifts in atmospheric carbon dioxide impacted plant groups differently.
“The forest giants of the period were hit particularly hard because they were the most inefficient of all the plants around at the time, likely losing water like open hose pipes” McElwain said. “Their forest competitors, like tree ferns, were able to outcompete them as the climate dried.”
Background: Unprecedented Rise of CO2
Over the past million years, atmospheric carbon dioxide has been generally low and fluctuated predictably within a window of 200 to 300 ppm. This, the researchers explain, has sustained the current icehouse – a time marked by continental ice at the polar regions – under which humans have evolved. This trend has been abruptly interrupted by the pronounced rise of carbon dioxide over the past 100 years to the current level of 401 ppm—one not seen on Earth for at least the past 3.5 million years.
The current unprecedented rate of rising atmospheric CO2 raises concerns about melting ice sheets, rising sea level, major climate change, and biodiversity loss – all of which were evident more than 300 million years, the only other time in Earth’s history when high CO2 accompanied ice at the polar regions.
Reference:
Climate, pCO2 and terrestrial carbon cycle linkages during late Palaeozoic glacial–interglacial cycles, Nature Geoscience, DOI:10.1038/ngeo2822
Note: The above post is reprinted from materials provided by UC Davis.
1- 2 C. borax
~1 L. water
bamboo skewer
thread
white pipe cleaners
food coloring
Weave 3, pipe cleaners into a loose coil. Suspend the coil from a length of thread and then attach it to the bamboo skewer, so that the coils hangs in the middle of the container without touching the sides or the bottom. Make your solution in a pot or heat-proof beaker. Heat your water and add borax a little at a time. Stir constantly and keep adding borax until it no longer dissolves. The solution will be cloudy and some borax will settle. Add your food coloring (20-30 drops.) Suspend your pipe cleaner in the hot solution and cover with a piece of cardboard. Allow it to sit undisturbed for 8-12 hours. Pull out your crystal and dry with a paper towel.
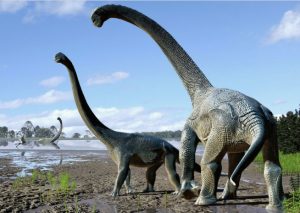
The Australian Age of Dinosaurs Museum today announced the naming of Savannasaurus elliottorum, a new genus and species of dinosaur from western Queensland, Australia. The bones come from the Winton Formation, a geological deposit approximately 95 million years old.
The paper naming the new dinosaur was published on Thursday October 20 at 2pm BST (Friday October 21 at 12am AEST) in Scientific Reports — an open access, online journal published by Nature.
Savannasaurus was discovered by David Elliott, co-founder of the Australian Age of Dinosaurs Museum, while mustering sheep in early 2005. As Elliott recalled yesterday, “I was nearly home with the mob — only about a kilometre from the yards — when I spotted a small pile of fossil bone fragments on the ground. I was particularly excited at the time as there were two pieces of a relatively small limb bone and I was hoping it might be a meat-eating theropod dinosaur.” Mr Elliott returned to the site later that day to collect the bone fragments with his wife Judy, who ‘clicked’ two pieces together to reveal a complete toe bone from a plant-eating sauropod. The Elliotts marked the site and made arrangements to hold a dig later that year.
The site was excavated in September 2005 by a joint Australian Age of Dinosaurs (AAOD) Museum and Queensland Museum team and 17 pallets of bones encased in rock were recovered. After almost ten years of painstaking work by staff and volunteers at the AAOD Museum, the hard siltstone concretion around the bones was finally removed to reveal one of the most complete sauropod dinosaur skeletons ever found in Australia. More excitingly, it belonged to a completely new type of dinosaur.
The new discovery was nicknamed Wade in honour of prominent Australian palaeontologist Dr Mary Wade. “Mary was a very close friend of ours and she passed away while we were digging at the site,” said Mr Elliott. “We couldn’t think of a better way to honour her than to name the new dinosaur after her.”
“Before today we have only been able to refer to this dinosaur by its nickname,” said Dr Stephen Poropat, Research Associate at the AAOD Museum and lead author of the study. “Now that our study is published we can refer to Wade by its formal name, Savannasaurus elliottorum,” Dr Poropat said. “The name references the savannah country of western Queensland in which it was found, and honours the Elliott family for their ongoing commitment to Australian palaeontology.”
In the same publication, Dr Poropat and colleagues announced the first sauropod skull ever found in Australia. This skull, and the partial skeleton with which it was associated, has been assigned to Diamantinasaurus matildae — a sauropod dinosaur named in 2009 on the basis of its nickname Matilda. “This new Diamantinasaurus specimen has helped to fill several gaps in our knowledge of this dinosaur’s skeletal anatomy,” said Poropat. “The braincase in particular has allowed us to refine Diamantinasaurus’ position on the sauropod family tree.”
Dr Poropat collaborated with British sauropod experts Dr Philip Mannion (Imperial College, London) and Professor Paul Upchurch (University College, London), among others, to work out the position of Savannasaurus (and refine that of Diamantinasaurus) on the sauropod family tree. “Both Savannasaurus and Diamantinasaurus belong to a group of sauropods called titanosaurs. This group of sauropods includes the largest land-living animals of all time,” said Dr Mannion. “Savannasaurus and the new Diamantinasaurus specimen have helped us to demonstrate that titanosaurs were living worldwide by 100 million years ago.”
Poropat and his colleagues suggest that the arrangement of the continents, and the global climate during the middle part of the Cretaceous Period, enabled titanosaurs to spread worldwide.
“Australia and South America were connected to Antarctica throughout much of the Cretaceous,” said Professor Upchurch. “Ninety-five million years ago, at the time that Savannasaurus was alive, global average temperatures were warmer than they are today. However, it was quite cool at the poles at certain times, which seems to have restricted the movement of sauropods at polar latitudes. We suspect that the ancestor of Savannasaurus was from South America, but that it could not and did not enter Australia until approximately 105 million years ago. At this time global average temperatures increased allowing sauropods to traverse landmasses at polar latitudes.”
Savannasaurus was a medium-sized titanosaur, approximately half the length of a basketball court, with a long neck and a relatively short tail. “With hips at least one metre wide and a huge barrel-like ribcage, Savannasaurus is the most rotund sauropod we have found so far — even more so than the somewhat hippopotamus-like Diamantinasaurus,” said Dr Poropat. “It lived alongside at least two other types of sauropod (Diamantinasaurus and Wintonotitan), as well as other dinosaurs including ornithopods, armoured ankylosaurs, and the carnivorous theropod Australovenator.”
Mr Elliott is relieved that Wade can now join “Matilda” and the other new dinosaur species on display in the Museum’s Holotype Room. “That this dinosaur specimen can now be displayed for our visitors is a testament to the efforts of numerous volunteers who have worked at the Museum on the fossils over the past decade,” he said. Mr Elliott and Dr Poropat agree that the naming of Savannasaurus, the fourth new species published by the AAOD Museum, is just the tip of the iceberg with respect to the potential for new dinosaur species in western Queensland. “The Australian Age of Dinosaurs Museum has a massive collection of dinosaur fossils awaiting preparation and the number of specimens collected is easily outpacing the number being prepared by volunteers and staff in our Laboratory,” Mr Elliott said. “The Museum already has the world’s largest collection of bones from Australia’s biggest dinosaurs and there is enough new material to keep us working for several decades.”
Reference:
Stephen F. Poropat, Philip D. Mannion, Paul Upchurch, Scott A. Hocknull, Benjamin P. Kear, Martin Kundrát, Travis R. Tischler, Trish Sloan, George H. K. Sinapius, Judy A. Elliott, David A. Elliott. New Australian sauropods shed light on Cretaceous dinosaur palaeobiogeography. Scientific Reports, 2016; 6: 34467 DOI: 10.1038/srep34467
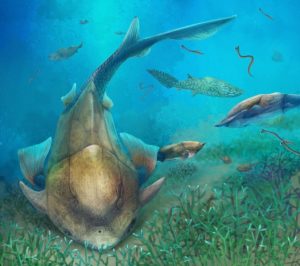
Life reconstruction of Qilinyu along with Guiyu and Entelognathus in Silurian waters. Credit: Dinghua Yang
Where did our jaws come from? The question is more complicated than it seems, because not all jaws are the same. In a new article, published in Science, palaeontologists from China and Sweden trace our jaws back to the extinct placoderms, armoured prehistoric fish that lived over 400 million years ago.
Jaws are an iconic and defining feature, not only of our own anatomy but of all jawed vertebrates: not for nothing did Steven Spielberg use “Jaws” as the one-word title of his immortal shark epic.
Jaws first appear in the developing embryo as a cartilage bar similar to a gill arch. In a shark, this develops directly into the adult jaws, but in an embryo of a bony fish or a human being new bones appear on the outside of the cartilage. In our own skull, these bones — the dentary, maxilla and premaxilla — make up the entire jaws and carry our teeth.
It is universally accepted that the dentary, maxilla and premaxilla are a shared heritage of bony fishes and tetrapods: you will find these same bones in a crocodile or a cod. But what about further back? Only one other group of fishes, the extinct placoderms, have a similar set of jaw bones. But these bones, known as ‘gnathal plates’ and shown to spectacular effect in the giant placoderm Dunkleosteus where they are developed into blades like sheet-metal cutters, have always been regarded as unrelated to the dentary, maxilla and premaxilla. For one thing they are located slightly further inside the mouth, and in any case the general opinion has been that placoderms and bony fishes are only very distantly related.
The picture began to change fundamentally in 2013 with the description of Entelognathus, a Silurian (423 million year old) fossil fish from Yunnan in China which combines a classic placoderm skeleton with presence of a dentary, maxilla and premaxilla. Together with the discovery of placoderm-like characteristics in some of the earliest bony fishes, this began to build a strong case for a close relationship between placoderms and bony fishes, accompanied by a substantial carry-over of placoderm characteristics into bony fishes (and hence ultimately to us). But what about those jaws, where did they come from?
This is where the new fossil, Qilinyu, comes in. Qilinyu, described this week in Science by palaeontologists from the Institute of Vertebrate Paleontology and Paleoanthropology (IVPP) in Beijing and Uppsala University in Sweden, comes from the same place and time period as Entelognathus, and also combines a placoderm skeleton with dentary, maxilla and premaxilla, though the two fishes otherwise look quite different and must have had different lifestyles. Looking at the jaw bones of Entelognathus and Qilinyu we can see that they, in both fishes, combine characters of the bony fish jaw bones (they contribute to the outer surface of the face and lower jaw) and placoderm gnathal plates (they have broad biting surfaces inside the mouth). Another thing becomes apparent as well: it has been argued that placoderm gnathal plates represent an inner jaw arcade, similar in position to the ‘coronoid bones’ of bony fishes, and if that were true we would expect to find gnathal plates just inside of the dentary, maxilla and premaxilla of Entelognathus and Qilinyu; but there is nothing there.
The simplest interpretation of the observed pattern is that our own jaw bones are the old gnathal plates of placoderms, lightly remodelled. It seems like substantial parts of our anatomy can be traced back, not only to the earliest bony fishes, but beyond them to the strange ungainly armoured placoderms of the Silurian period.
Reference:
Zhu et al. A Silurian maxillate placoderm illuminates jaw evolution. Science, October 2016 DOI: 10.1126/science.aah3764
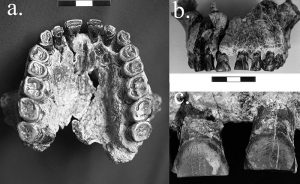
David Frayer, KU professor emeritus of anthropology, is lead author on a recent study published in the Journal of Evolution that found striations on teeth of a Homo habilis fossil 1.8 million years old moved from left to right, indicating the earliest evidence in the fossil record for right-handedness. Researchers believe the marks came from using a tool to try to cut food being pulled from the mouth with the left hand. Credit: David Frayer
Perhaps the bias against left-handers dates back much further than we thought.
By examining striations on teeth of a Homo habilis fossil, a new discovery led by a University of Kansas researcher has found the earliest evidence for right-handedness in the fossil record dating back 1.8 million years.
“We think that tells us something further about lateralization of the brain,” said David Frayer, a KU professor emeritus of anthropology and the lead author of the study. “We already know that Homo habilis had brain lateralization and was more like us than like apes. This extends it to handedness, which is key.”
The findings were published online this week in the Journal of Human Evolution. The researchers made the discovery after analyzing small cut marks, or labial striations, which are the lip side of the anterior teeth in an intact upper jaw fossil, known as OH-65, found in a stream channel of the Olduvai Gorge in Tanzania.
Frayer said among the network of deep striations found only on the lip face of the upper front teeth most cut marks veered from left down to the right. Analysis of the marks makes it likely they came from when OH-65 used a tool with its right hand to cut food it was holding in its mouth while pulling with the left hand. The scratches can be seen with the naked eye, but a microscope was used to determine their alignment and to quantify their angulation.
“Experimental work has shown these scratches were most likely produced when a stone tool was used to process material gripped between the anterior teeth and the tool occasionally struck the labial face leaving a permanent mark on the tooth’s surface,” Frayer said.
Based on the direction of the marks, it’s evident the Homo habilis was right-handed. It’s a sample of one, but because this is the first potential evidence of a dominant handed pre-Neanderthal, Frayer said, the study could lead to a search for the marks in other early Homo fossils.
“Handedness and language are controlled by different genetic systems, but there is a weak relationship between the two because both functions originate on the left side of the brain,” he said. “One specimen does not make an incontrovertible case, but as more research is done and more discoveries are made, we predict that right-handedness, cortical reorganization and language capacity will be shown to be important components in the origin of our genus.”
Multiple lines of research point to the likelihood that brain reorganization, the use of tools and use of a dominant hand occurred early in the human lineage. Today, researchers estimate that 90 percent of humans are right-handed, and this differs from apes which are closer to a 50-50 ratio. Until now, no one looked for directionality of striations in the earliest specimens representing our evolutionary lineage.
“We think we have the evidence for brain lateralization, handedness and possibly language, so maybe it all fits together in one picture,” Frayer said.
Reference:
David W. Frayer, Ronald J. Clarke, Ivana Fiore, Robert J. Blumenschine, Alejandro Pérez-Pérez, Laura M. Martinez, Ferran Estebaranz, Ralph Holloway, Luca Bondioli. OH-65: The earliest evidence for right-handedness in the fossil record. Journal of Human Evolution, 2016; 100: 65 DOI: 10.1016/j.jhevol.2016.07.002
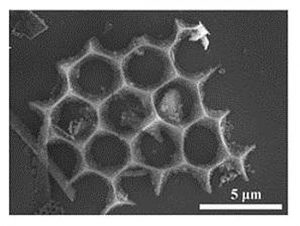
Electron microscopy showing one of the unique geometries observed in the nano-silicon power derived from diatomaceous earth. Credit: UC Riverside
Researchers at the University of California, Riverside’s Bourns College of Engineering have developed an inexpensive, energy-efficient way to create silicon-based anodes for lithium-ion batteries from the fossilized remains of single-celled algae called diatoms. The research could lead to the development of ultra-high capacity lithium-ion batteries for electric vehicles and portable electronics.
Titled “Carbon-Coated, Diatomite-Derived Nanosilicon as a High Rate Capable Li-ion Battery Anode,” a paper describing the research was published recently in the journal Scientific Reports. The research was led by Mihri Ozkan, professor of electrical engineering, and Cengiz Ozkan, professor of mechanical engineering. Brennan Campbell, a graduate student in materials science and engineering, was first author on the paper.
Lithium-ion batteries, the most popular rechargeable batteries in electric vehicles and personal electronics, have several major components including an anode, a cathode, and an electrolyte made of lithium salt dissolved in an organic solvent. While graphite is the material of choice for most anodes, its performance is a limiting factor in making better batteries and expanding their applications. Silicon, which can store about 10 times more energy, is being developed as an alternative anode material, but its production through the traditional method, called carbothermic reduction is expensive and energy-intensive.
To change that, the UCR team turned to a cheap source of silicon — diatomaceous earth (DE) — and a more efficient chemical process. DE is an abundant, silicon-rich sedimentary rock that is composed of the fossilized remains of diatoms deposited over millions of years. Using a process called magnesiothermic reduction, the group converted this low-cost source of Silicon Dioxide (SiO2) to pure silicon nano-particles.
“A significant finding in our research was the preservation of the diatom cell walls — structures known as frustules — creating a highly porous anode that allows easy access for the electrolyte”, Cengiz Ozkan said.
This research is the latest in a series of projects led by Mihri and Cengiz Ozkan to create lithium-ion battery anodes from environmentally friendly materials. Previous research has focused on developing and testing anodes from portabella mushrooms and beach sand.
“Batteries that power electric vehicles are expensive and need to be charged frequently, which causes anxiety for consumers and negatively impacts the sale of these vehicles. To improve the adoption of electric vehicles, we need much better batteries. We believe diatomaceous earth, which is abundant and inexpensive, could be another sustainable source of silicon for battery anodes,” Mihri Ozkan said.
Reference:
Brennan Campbell, Robert Ionescu, Maxwell Tolchin, Kazi Ahmed, Zachary Favors, Krassimir N. Bozhilov, Cengiz S. Ozkan & Mihrimah Ozkan. Carbon-Coated, Diatomite-Derived Nanosilicon as a High Rate Capable Li-ion Battery Anode. DOI:10.1038/srep33050
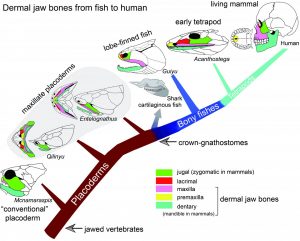
Diagram showing the dermal jaw bones from fish to human. Credit: Brian Choo and Min Zhu
The unearthing of a fossil in China has shed light on the evolution of the three-part jaw, revealing a previously unknown stage of jaw evolution in an extinct class of armored, prehistoric fish known as placoderms.
Placoderms dominated the oceans for many millions of years, and the emergence of jaws in these creatures marks a significant turning point in early vertebrate evolution. While all modern vertebrates have a jaw that is composed of three parts, the jaw system of placoderms was different, with most species having bony plates rather than a full jaw.
Several years ago, Min Zhu and colleagues unveiled a fossil, Entelognathus, that had a placoderm-like body but a three-part jaw. However, there was some uncertainty as to whether it could, indeed, be classified as a placoderm. Now, the same group of researchers has unearthed a new species, named Qilinyu, from a fossil bed in China.
The preserved part of the fossil is 126 millimeters in length, with an estimated total body length of more than 20 centimeters. Sporting a dolphin-shaped head, this fish appears to have dwelled and fed along the bottom of bodies of water.
A comparison of Qilinyu to 372 other species in 104 taxa consistently placed it as a sister group of Entelognathus. What’s more, its jaw reveals the basis of a three-part complex, confirming that such a setup evolved from within the placoderm system, and did not arise independently of the placoderms. A Perspective by John Long discusses this finding in greater detail.
Reference:
Min Zhu, Per E. Ahlberg, Zhaohui Pan, Youan Zhu, Tuo Qiao, Wenjin Zhao, Liantao Jia, Jing Lu.A Silurian maxillate placoderm illuminates jaw evolution. DOI: 10.1126/science.aah3764
The fake minerals are minerals (or gems, that is to say outstanding minerals) not natural, man-made. This can be a natural mineral transformed by man into another, or an entirely artificial mineral. Also referred to as false to the synonyms. In short, counterfeiting may be partial (sample processed) or total (sample created by humans) or cover the name given to the sample. They have always existed, their marketing is growing very rapidly.
There are now numerous examples of fakes in mineralogy and gemology. If there are criteria for authentication of minerals, it is sometimes difficult to distinguish between fake and genuine ones. Fake samples are sold for real deception, but when the infringement is announced or found, it may have a financial interest, decorative or teaching for the buyer.
Non Natural mineral can be made by: Man Made Crystals, Coated Crystals, Chemical Reaction to Crystals, Mechanic Alteration of Crystals, Irradiation of Crystals, Heat Treatment of Crystals, Dyeing of Crystals.
List of fake Minerals
Aqua Aura Quartz
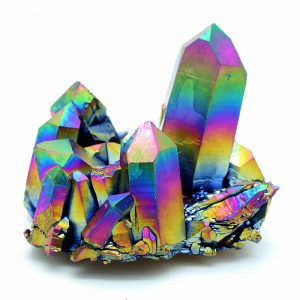
Titanium Flame Aura Quartz Cluster
Aqua Aura Quartz is a beautiful bright blue color, but this color is not natural. It’s surface has been coated with metal to give them an iridescent metallic sheen. Crystals treated this way are used as gemstones and for other decorative purposes. Possible coatings include gold (resulting in a stone called aqua aura), indium, titanium, niobium and copper. Other names for crystals treated so include; angel aura, flame aura, opal aura or rainbow quartz.
Aqua aura is created in a vacuum chamber from quartz crystals and gold vapour by vapour deposition. The quartz is heated to 871 °C (1600 °F) in a vacuum, and then gold vapor is added to the chamber. The gold atoms fuse to the crystal’s surface, which gives the crystal an iridescent metallic sheen.
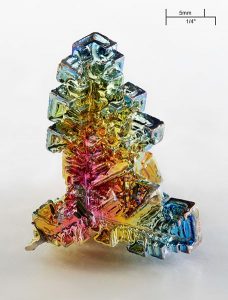
Bismuth does occur in nature, but usually as dull gray amorphous (“without crystal structure”) lumps and often accompanied by yellow or green oxidation products.
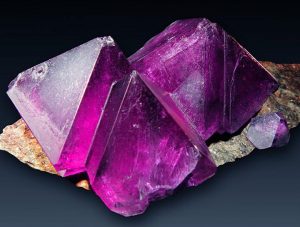
This is not a natural mineral, but instead is probably laboratory-grown chrome alum (aluminum chromium sulfate) or regular, colorless alum which has been crystallized in the presence of a dye. Other laboratory grown specimens of different colors have also been called cermikite.
Nickel Crystals
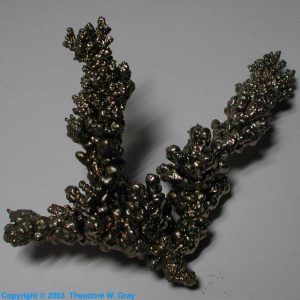
Nickel crystals can form on the wires used in the electrodeposition process. These fakes are easy to spot. Natural nickel crystals are exceptionally rare (usually found only in meteorites), and when they do occur, they are very small (a 1 mm natural nickel crystal is considered large).
Carborundum
Credit: John Faithfull/Wikimedia
It does occur in naturally as well, as the mineral moissanite, but it is very rare, and crystals are almost always tiny or microscopic.
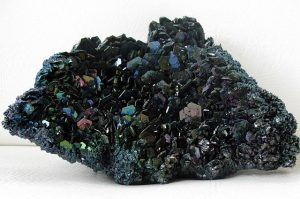
Carborundum (silicon carbide) is produced artifically in large quantities as an abrasive. Most is crushed and used in griding grits and abrasive papers. This specimen shows coarsely crystallised hexagonal plates of silicon carbide, with typical rainbow irridescent surface colours.
Galena Geodes
Galena Geodes
They are not naturally formed and are a man made product. They have been created using a natural geode which has been filled in with galena.
Green Quartz
An example from eBay
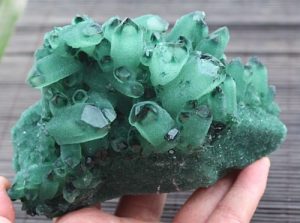
Green quartz can be produced in the lab by a modification of the process used to manufacture large, high-quality quartz crystals for electronics applications. The process involves heating the quartz with water under high pressure. This causes the quartz to recrystallize. If other substances are present these might be included into the new crystals.
Brightly colored Obsidian
Fake Blue Obsidian
Obsidian is a naturally occurring volcanic glass formed as an extrusive igneous rock.
It is produced when felsic lava extruded from a volcano cools rapidly with minimal crystal growth. Obsidian is commonly found within the margins of rhyolitic lava flows known as obsidian flows, where the chemical composition (high silica content) induces a high viscosity and polymerization degree of the lava.
Obsidian comes in black, brown, gray and several combinations such as white and black “Snowflake” obsidian and brown and black “Mahogany” obsidian.
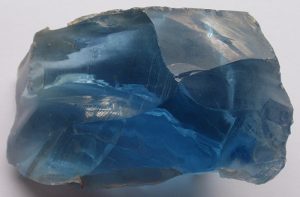
Fake is brightly colored Reds, Blues, Greens
This is a small list of fake minerals but there are a lot, Please be cautious, So try to find reliable dealers.
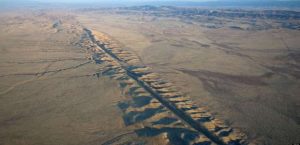
Aerial photo of the San Andreas Fault in the Carrizo Plain, northwest of Los Angeles. Credit: Wikipedia.
The most dangerous earthquake fault in the San Francisco Bay Area is connected to another, which means both could rupture simultaneously and unleash major devastation, a new study finds.
The Hayward Fault has long been considered a threat because it runs under densely populated neighborhoods east of San Francisco. The new work found that beneath San Pablo Bay, it joins with a second, less active underground fracture to the north.
Scientists had already considered the possibility of both faults rupturing at once, whether they are connected or not. So the discovery doesn’t change the estimated earthquake hazard much, although it confirms suspicions that the stage is set for what could be a massive quake.
If the Hayward and Rodgers Creek faults broke simultaneously along their combined 118 miles, they could produce a magnitude 7.4 quake, said scientists from the U.S. Geological Survey.
Such shaking would be more than five times stronger than the 1989 Loma Prieta quake on the San Andreas Fault that killed over 60 people and collapsed part of the San Francisco-Oakland Bay Bridge.
There hasn’t been a major quake on the Hayward Fault in more than 140 years. Quakes are caused by a sudden movement in the Earth’s crust, releasing stored energy that people feel as shaking.
“This should be a reminder that folks in the Bay Area need to be prepared for a major earthquake,” USGS geophysicist Janet Watt said in an email.
Watt and her team probed the geology beneath San Pablo Bay, a tidal estuary that extends north from the San Francisco Bay, using a special acoustic instrument that bounced sound waves through the water and into the rocks below.
The Hayward Fault extends for 62 miles from San Jose to San Pablo Bay, passing through Berkeley and Oakland. The last time it broke was in 1868 when a magnitude 6.8 struck, killing 30 people. The Rodgers Creek fracture runs 56 miles north of the bay through the heart of wine country.
The underwater surveys revealed a previously unknown strand of the Hayward Fault that connects to the western section of the Rodgers Creek Fault. One reason why it has taken so long to determine the relationship between the two faults is because the bay is very shallow, which makes it hard to use a boat. Researchers floated instruments on pontoons.
Results were published Wednesday in the journal Science Advances.
The evidence is “really quite convincing,” said Roland Burgmann, a geophysicist at the University of California, Berkeley who had no role in the research.
“Having a continuous fault does certainly make it easier for an earthquake rupture coming from either the north or the south to continue straight through,” he said in an email.
The study was published before an annual earthquake preparedness drill Thursday in which more than 10 million people in California will practice the “drop, cover, and hold” procedure. The drill began in 2008 in Southern California and has grown to include other states and countries.
The Ethiopian Rift Valley suffered colossal volcanic eruptions between about 320,000 and 170,000 years ago. Credit: David Pyle
The great Rift Valley that runs through Ethiopia has played a pivotal role in human evolution. It is both the location of the earliest fossils of anatomically modern humans and, later, become an important route for human migrations ‘out of Africa’.
Today, it is home to more than ten million people, a major hub for tourists, and the location of important transport links. The main Ethiopian Rift Valley is also one of the largest fields of volcanoes on Earth – although this status may not be obvious from the remnants of the sprawling tumbledown hills that break through the dusty flats of the rift valley floor. Here, Africa has been slowly pulling apart for millions of years. As the continent pulls apart, the crust extends and thins, promoting the rise of magma from the depths of the Earth’s mantle. None of these volcanoes is thought to have erupted since the early 19th century, and several are now the focus of development of geothermal energy potential.
In a new paper published in the journal Nature Communications, Will Hutchison, an Oxford DPhil student, and a team of collaborators from the UK, Ethiopia and the USA, shed a little more light on the violently explosive past of several of these rift volcanoes. Using a combination of field work (to reconstruct the deep history of the volcanoes) and isotopic age dating techniques, the researchers find that at least four of the volcanoes of the main Ethiopian Rift Valley suffered colossal eruptions between about 320,000 and 170,000 years ago. These were very significant eruptions – perhaps of the scale of the eruption of Krakatoa in Indonesia in 1883. They would have buried the rift floor in volcanic ejecta, disrupting water sources and habitats across wide areas, with the collapsed remnants of the volcanic edifices forming great ‘calderas’, or craters, in the rift floor.
This pulse in volcanism coincides with the arrival of Homo sapiens in the region around 200,000 years ago and raises the question of to what extent these changes in the landscape and environments occupied by our earliest human ancestors might have influenced human evolution and migration. The recognition that explosive volcanism in the rift occurs in bursts also poses some interesting geological questions, and future inter-disciplinary research is needed to understand the scale of eruptions at other large volcanoes of the rift, their causes, and their wider consequences.
Reference:
William Hutchison et al. A pulse of mid-Pleistocene rift volcanism in Ethiopia at the dawn of modern humans, Nature Communications (2016). DOI: 10.1038/ncomms13192