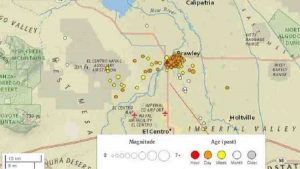
This map, generated about 5 p.m. on Jan. 1, 2017, shows the Brawley earthquake swarm that began on New Year’s Eve. Credit: U.S. Geological Survey
More than 250 small earthquakes have struck since New Year’s Eve near the California-Mexico border, causing unease among residents and attention from scientists.
The strongest earthquake in the sequence was magnitude 3.9, directly underneath Brawley, about 170 miles southeast of Los Angeles.
The earthquakes struck in the southern end of the Brawley Seismic Zone, a seismically active region where tectonic plates are moving away from each other and the Earth’s crust is getting stretched out “and basically adding land,” said Caltech seismologist Egill Hauksson.
The Brawley Seismic Zone is particularly important to watch because it is the region that connects the San Andreas and Imperial faults, both of which can produce damaging earthquakes. The seismic zone extends about 30 miles from Brawley, across the Salton Sea’s southern half, and ends near Bombay Beach.
Hauksson was closely monitoring the quakes that began Saturday, as there was a chance that an earthquake of magnitude 5 or larger could be triggered.
“There’s always reason to be concerned for a bigger earthquake,” Hauksson said. But by Sunday night, the possibility of the quakes triggering a larger event had largely receded.
The southern Brawley Seismic Zone is close to the Imperial fault. The Imperial fault has caused two major earthquakes in recent decades.
In 1979, a magnitude 6.5 earthquake shook El Centro, injuring 91 and causing so much damage to the concrete Imperial County Services Building that it had to be demolished.
There was major damage to the irrigation system in the Imperial Valley, a desert region that is a prolific producer of salad vegetables during the winter. Levees lining the All-American Canal, which funnels water from the Colorado River, collapsed along an eight-mile stretch.
The magnitude-7.1 earthquake that hit El Centro in 1940 killed nine people and swayed buildings as far away as Los Angeles. Irrigation systems were damaged, and railroad tracks were left warped where they crossed the fault.
Earthquakes that occur in the other end of the Brawley Seismic Zone – to the north – could trigger a major event on the San Andreas fault, one of California’s most dangerous, that could send catastrophic shaking into Riverside, San Bernardino and Los Angeles counties.
In late September, earthquakes began in the northern Brawley Seismic Zone, with three measuring above magnitude 4. That event led the U.S. Geological Survey to warn that chances of a magnitude 7 or greater earthquake on the San Andreas fault had risen as a result..
Another series of small earthquakes, topping out at magnitude 3.5, struck the town of Niland near the eastern shore of the Salton Sea on Halloween.
The last major earthquake to hit Brawley was in 2012, registering at magnitude 5.4.
Brawley Mayor Sam Couchman said the earthquakes have placed the city of 26,000 on edge since Saturday afternoon. The combination of the earthquakes and New Year’s pyrotechnics spooked some of the town’s dogs, who went missing, he said.
“We’re just kind of listening to it, and when you can hear it coming, it’ll rattle things,” Couchman said. “Last night, we had the rain, the earthquakes, and the fireworks.
“All we needed were frogs and locusts.”
Note: The above post is reprinted from materials provided by Los Angeles Times, Distributed by Tribune Content Agency, LLC..
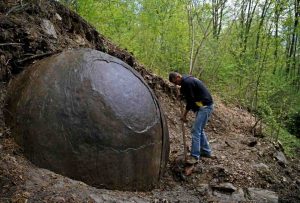
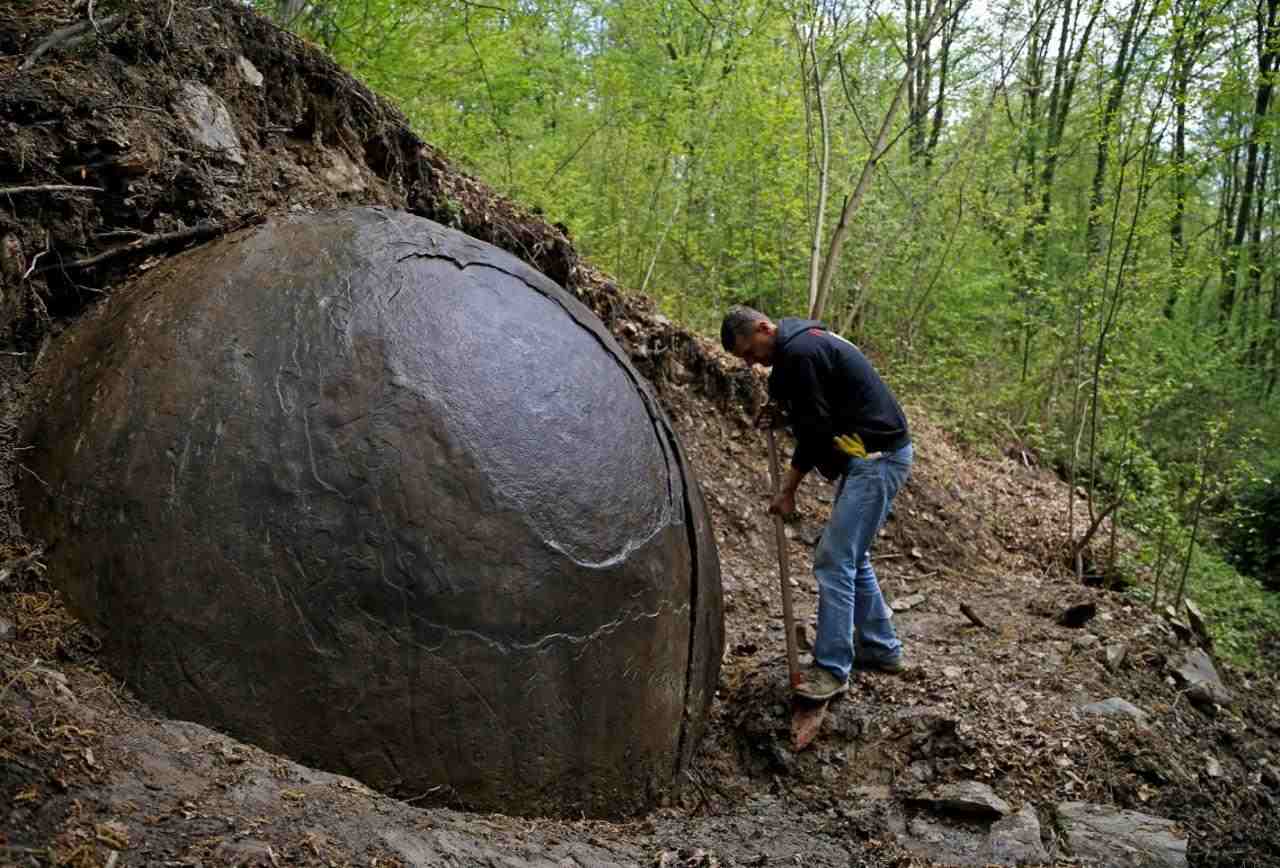
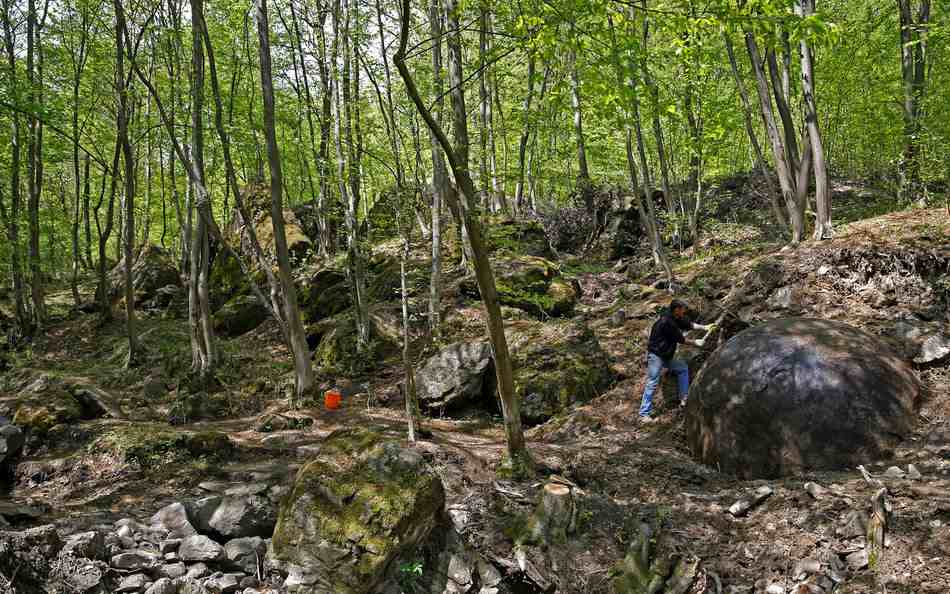
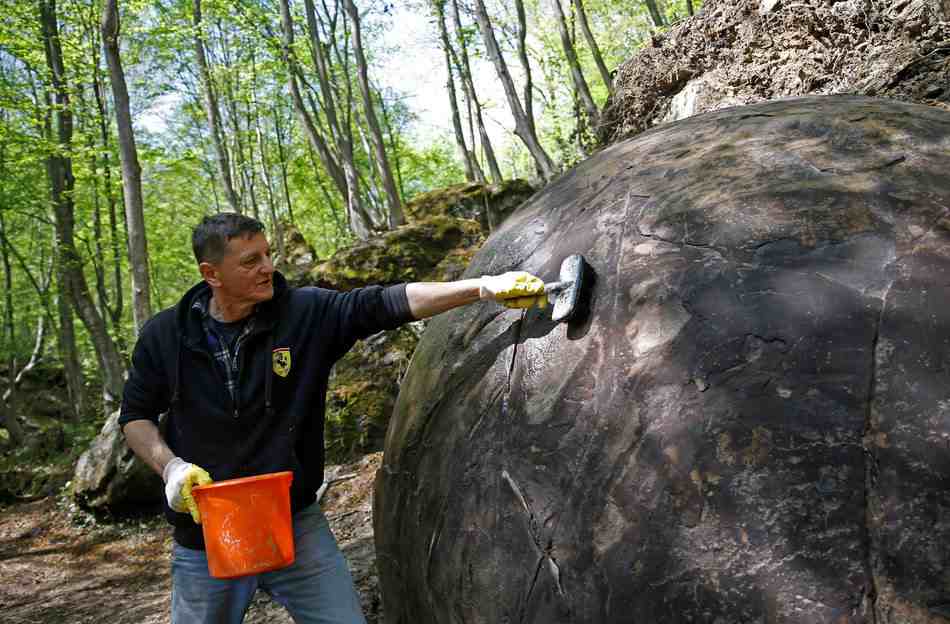
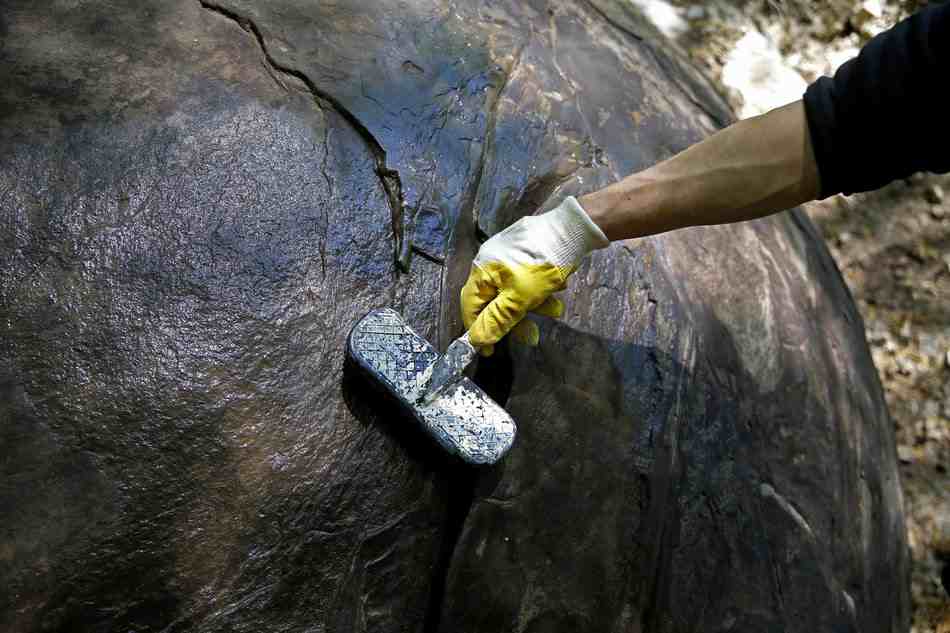
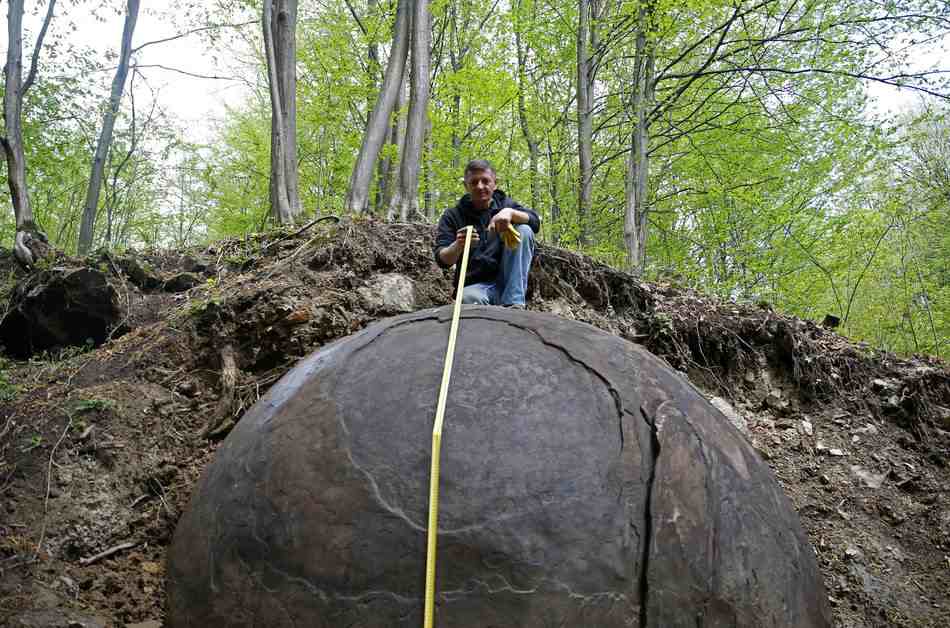
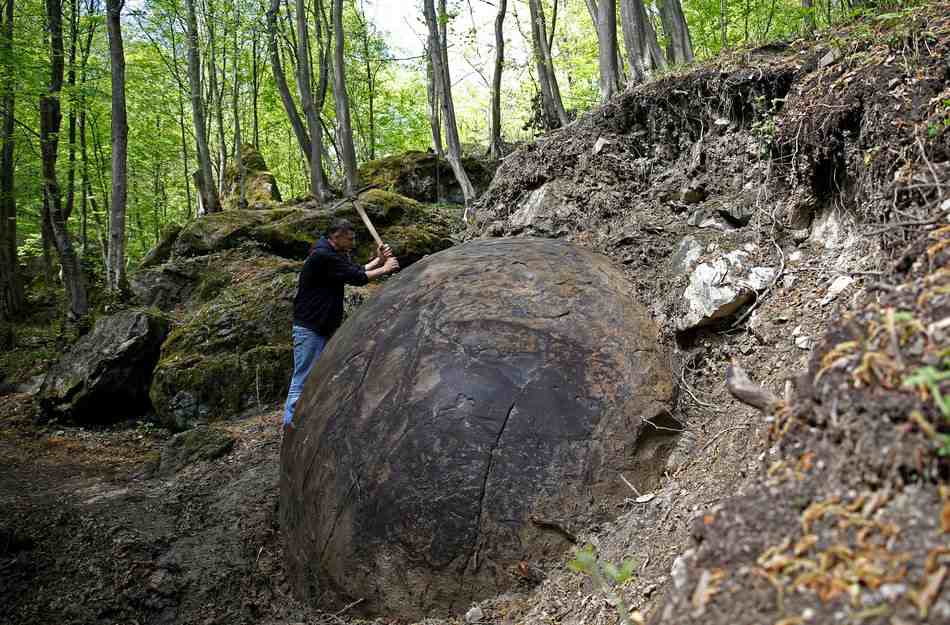
Suad Keserovic cleans a stone ball in Podubravlje village near Zavidovici, Bosnia and Herzegovina, April 11, 2016. Keserovic claimed that the stone sphere is 3.30 meters in diameter and the estimated weight of it is about 35 tons. Hundreds of tourists from around the world have visited this stone. Credit: Dado Ruvic / Reuters
A 10-foot-wide, stone ball recently discovered in a Bosnia forest is touching off a hot debate in academic circles: Was it created by Mother Nature … or a lost civilization?
Located near the town of Zavidovici , the giant sphere — the largest of a group of such objects — is partially sticking out from the ground, and according to archaeologist Sam Semir Osmanagich, who discovered the stone in March, it may have a very high iron content and weigh over 30 tons.
“It might end up as the biggest stone ball on the planet,” Osmanagich tells a group gathered at the object in the Bosnian forest, as seen in the video below.
Osmanagich, sometimes called the “Bosnian Indiana Jones“ for his global travels, has spent 15 years researching what he refers to as a “prehistoric stone ball phenomenon.”
In a blog written last month for his Archaeological Park: Bosnian Pyramid of the Sun foundation, Osmanagich suggests the Bosnian ball could be the largest man-made stone ball in Europe. He says many others found throughout the world could point to long-lost “advanced civilizations from the distant past, and we have no written records about them.
“Secondly, they had high technology, different than ours. Finally, they knew the power of geometrical shapes, because the sphere is one of the most powerful shapes along with pyramidal and conical shapes,” he continues.
According to UNESCO — the United Nations Educational, Scientific and Cultural Organization — similar stone spheres have been found at several sites in Costa Rica.
The objects’ “meaning, use and production remain largely a mystery. The spheres are distinctive for their perfection, number, size and density, and placement in original locations. Their preservation from the looting that befell the vast majority of archaeological sites in Costa Rica has been attributed to the thick layers of sediment that kept them buried for centuries.”
Osmanagich’s discovery has sparked controversy among other researchers and academics with his claims that, in addition to the large stone balls, certain hills in the Bosnian Visoko Valley and Herzegovina harbor ancient underground tunnels and pyramids.
“There is some genuine archaeology on the hill and I’m told it’s medieval, possibly Bronze Age or Roman,” Anthony Harding of the European Association of Archaeologists told The Telegraph.
“The speculation that there could be a 12,000-year-old structure beneath is a complete fantasy, and anyone with basic knowledge of archaeology or history should recognize that,” Harding added.
And regarding Osmanagich’s belief that the giant Bosnia sphere wasn’t created by nature, Mandy Edwards of the University of Manchester’s School of Earth told the Daily Mail the stone may be an example of something called concretion: A compact — often spherical — rock mass forms from the precipitation of natural mineral cement in the spaces between particles.
The jury is still out on whether these spherical objects were handmade by a lost civilization or Mother Nature’s handiwork in growing big balls.
Biggest Stone Ball in Europe just Discovered in Bosnia
1 of 6
Suad Keserovic cleans a stone ball in Podubravlje village near Zavidovici, Bosnia and Herzegovina, April 11, 2016. Keserovic claimed that the stone sphere is 3.30 meters in diameter and the estimated weight of it is about 35 tons. Hundreds of tourists from around the world have visited this stone. Credit: Dado Ruvic / Reuters
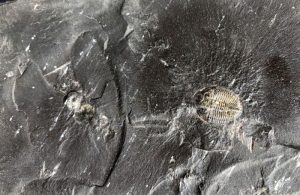
This black shale, formed 450 million years ago, contains fossils of trilobites and other organic material that, by removing carbon from Earth’s surface, helped support increases in oxygen in the atmosphere. Credit: Jon Husson and Shanan Peters/UW-Madison
For the development of animals, nothing — with the exception of DNA — may be more important than oxygen in the atmosphere.
Oxygen enables the chemical reactions that animals use to get energy from stored carbohydrates — from food. So it may be no coincidence that animals appeared and evolved during the “Cambrian explosion,” which coincided with a spike in atmospheric oxygen roughly 500 million years ago.
It was during the Cambrian explosion that most of the current animal designs appeared.
In green plants, photosynthesis separates carbon dioxide into molecular oxygen (which is released to the atmosphere), and carbon (which is stored in carbohydrates).
But photosynthesis had already been around for at least 2.5 billion years. So what accounted for the sudden spike in oxygen during the Cambrian?
A study now online in the February issue of Earth and Planetary Science Letters links the rise in oxygen to a rapid increase in the burial of sediment containing large amounts of carbon-rich organic matter. The key, says study co-author Shanan Peters, a professor of geoscience at the University of Wisconsin-Madison, is to recognize that sediment storage blocks the oxidation of carbon.
Without burial, this oxidation reaction causes dead plant material on Earth’s surface to burn. That causes the carbon it contains, which originated in the atmosphere, to bond with oxygen to form carbon dioxide. And for oxygen to build up in our atmosphere, plant organic matter must be protected from oxidation.
And that’s exactly what happens when organic matter — the raw material of coal, oil and natural gas — is buried through geologic processes.
To make this case, Peters and his postdoctoral fellow Jon Husson mined a unique data set called Macrostrat, an accumulation of geologic information on North America whose construction Peters has masterminded for 10 years.
The parallel graphs of oxygen in the atmosphere and sediment burial, based on the formation of sedimentary rock, indicate a relationship between oxygen and sediment. Both graphs show a smaller peak at 2.3 billion years ago and a larger one about 500 million years ago.
“It’s a correlation, but our argument is that there are mechanistic connections between geology and the history of atmospheric oxygen,” Husson says. “When you store sediment, it contains organic matter that was formed by photosynthesis, which converted carbon dioxide into biomass and released oxygen into the atmosphere. Burial removes the carbon from Earth’s surface, preventing it from bonding molecular oxygen pulled from the atmosphere.”
Some of the surges in sediment burial that Husson and Peters identified coincided with the formation of vast fields of fossil fuel that are still mined today, including the oil-rich Permian Basin in Texas and the Pennsylvania coal fields of Appalachia.
“Burying the sediments that became fossil fuels was the key to advanced animal life on Earth,” Peters says, noting that multicellular life is largely a creation of the Cambrian.
Today, burning billions of tons of stored carbon in fossil fuels is removing large amounts of oxygen from the atmosphere, reversing the pattern that drove the rise in oxygen. And so the oxygen level in the atmosphere falls as the concentration of carbon dioxide rises.
The data about North America in Macrostrat reflects the work of thousands of geoscientists over more than a century. The current study only concerns North America, since comprehensive databases concerning the other 80 percent of Earth’s continental surface do not yet exist.
The ultimate geological cause for the accelerated sediment storage that promoted the two surges in oxygen remains murky. “There are many ideas to explain the different phases of oxygen concentration,” Husson concedes. “We suspect that deep-rooted changes in the movement of tectonic plates or conduction of heat or circulation in the mantle may be in play, but we don’t have an explanation at this point.”
Holding a chunk of trilobite-studded Ordovician shale that formed approximately 450 million years ago, Peters asks, “Why is there oxygen in the atmosphere? The high school explanation is ‘photosynthesis.’ But we’ve known for a long time, going all the way back to Wisconsin geologist (and University of Wisconsin president) Thomas Chrowder Chamberlin, that building up oxygen requires the formation of rocks like this black shale, which can be rich enough in carbon to actually burn. The organic carbon in this shale was fixed from the atmosphere by photosynthesis, and its burial and preservation in this rock liberated molecular oxygen.”
What’s new in the current study, Husson says, is the ability to document this relationship in a broad database that covers 20 percent of Earth’s land surface.
Continual burial of carbon is needed to keep the atmosphere pumped up with oxygen. Many pathways on Earth’s surface, Husson notes, like oxidation of iron — rust — consume free oxygen. “The secret to having oxygen in the atmosphere is to remove a tiny portion of the present biomass and sequester it in sedimentary deposits. That’s what happened when fossil fuels were deposited.”
Reference:
Jon M. Husson, Shanan E. Peters. Atmospheric oxygenation driven by unsteady growth of the continental sedimentary reservoir. Earth and Planetary Science Letters, 2017; 460: 68 DOI: 10.1016/j.epsl.2016.12.012
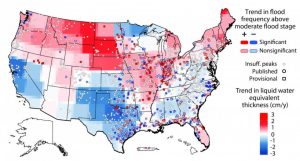
A University of Iowa study has found that the risk of flooding is changing in the United States and varies regionally. The threat of moderate flooding is increasing generally in the northern US (red areas) and decreasing in the southern US (blue areas), while some regions remain mostly unchanged (gray areas). The findings come from comparing river heights at 2,042 locations with NASA satellite information showing the amount of water in the ground. Credit: American Geophysical Union
The risk of flooding in the United States is changing regionally, and the reasons could be shifting rainfall patterns and the amount of water in the ground.
In a new study, University of Iowa engineers determined that, in general, the threat of flooding is growing in the northern half of the U.S. and declining in the southern half. The American Southwest and West, meanwhile, are experiencing decreasing flood risk.
UI engineers Gabriele Villarini and Louise Slater compiled water-height information between 1985 and 2015 from 2,042 stream gauges operated by the U.S. Geological Survey. They then compared the data to satellite information gathered over more than a dozen years by NASA’s Gravity Recovery and Climate Experiment (GRACE) mission showing “basin wetness,” or the amount of water stored in the ground.
What they found was the northern sections of the country, generally, have an increased amount of water stored in the ground, and thus are at greater risk for minor and moderate flooding, two flood categories used by the National Weather Service. Meanwhile, minor to moderate flood risk was decreasing in the southern portions of the U.S., where stored water has declined.
Not surprisingly, the NASA data showed decreased stored water — and reduced flood risk — in the Southwest and western U.S., in large part due to the prolonged drought gripping those regions.
“It’s almost like a separation where generally flood risk is increasing in the upper half of the U.S. and decreasing in the lower half,” says Villarini, associate professor in civil and environmental engineering and an author on the paper, published in the journal Geophysical Research Letters. “It’s not a uniform pattern, and we want to understand why we see this difference.”
Some of the regional variation can be attributed to changes in rainfall; a study led by Villarini published last year showed the Midwest and Plains states have experienced more frequent heavy rains in the past half-century. More rainfall leads to more groundwater, a “higher water base line,” Villarini explains.
“The river basins have a memory,” adds Slater, a post-doctoral researcher and the paper’s corresponding author. “So, if a river basin is getting wetter, in the Midwest for example, your flood risk is also probably increasing because there’s more water in the system.”
Why some sections of the nation are getting more, or less, rainfall is not entirely clear. The researchers say some causes could be the rains are being redistributed as regional climate changes.
The researchers hope that their findings could revise how changing flood patterns are communicated. In the past, flood risk trends have typically been discussed using stream flow, or the amount of water flowing per unit time. The UI study views flood risk through the lens of how it may affect people and property and aligns the results with National Weather Service terminology understood by the general public.
“The concept is simple,” says Villarini, whose primary appointment is in IIHR-Hydroscience, a branch of the College of Engineering. “We’re measuring what people really care about.”
Reference:
Louise J. Slater, Gabriele Villarini. Recent trends in U.S. flood risk. Geophysical Research Letters, 2016; DOI: 10.1002/2016GL071199
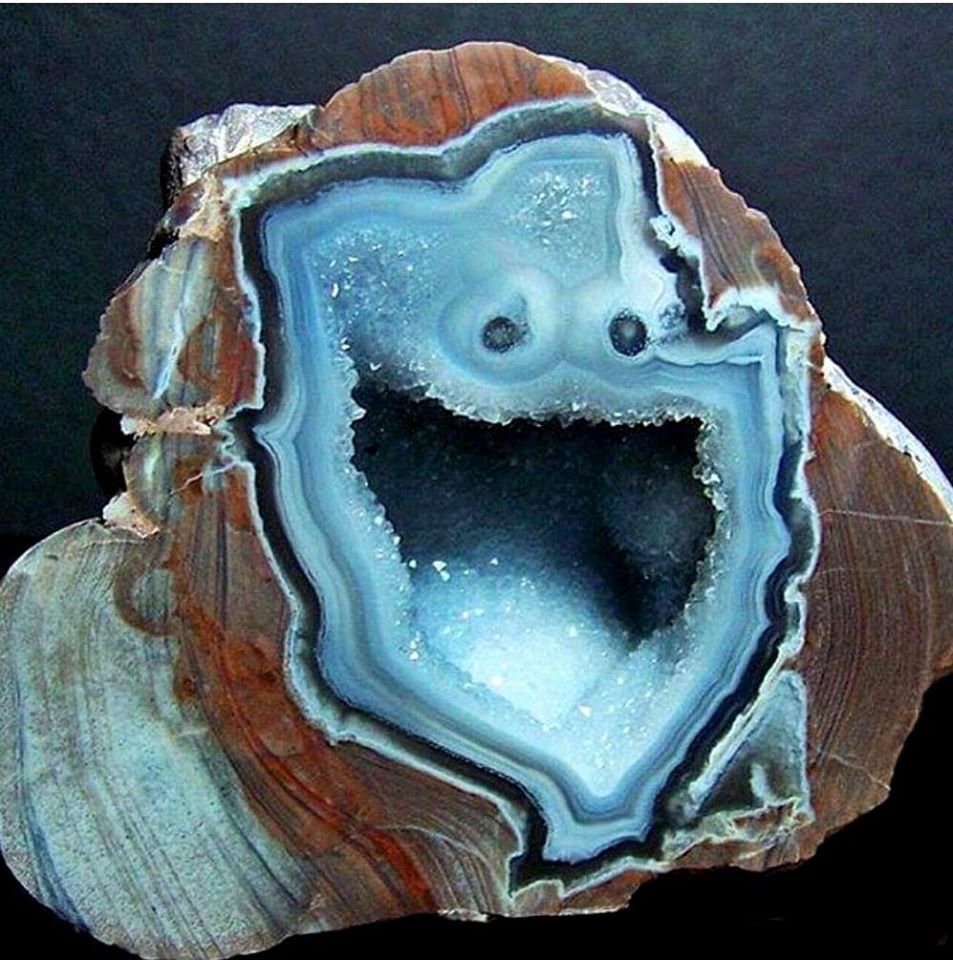
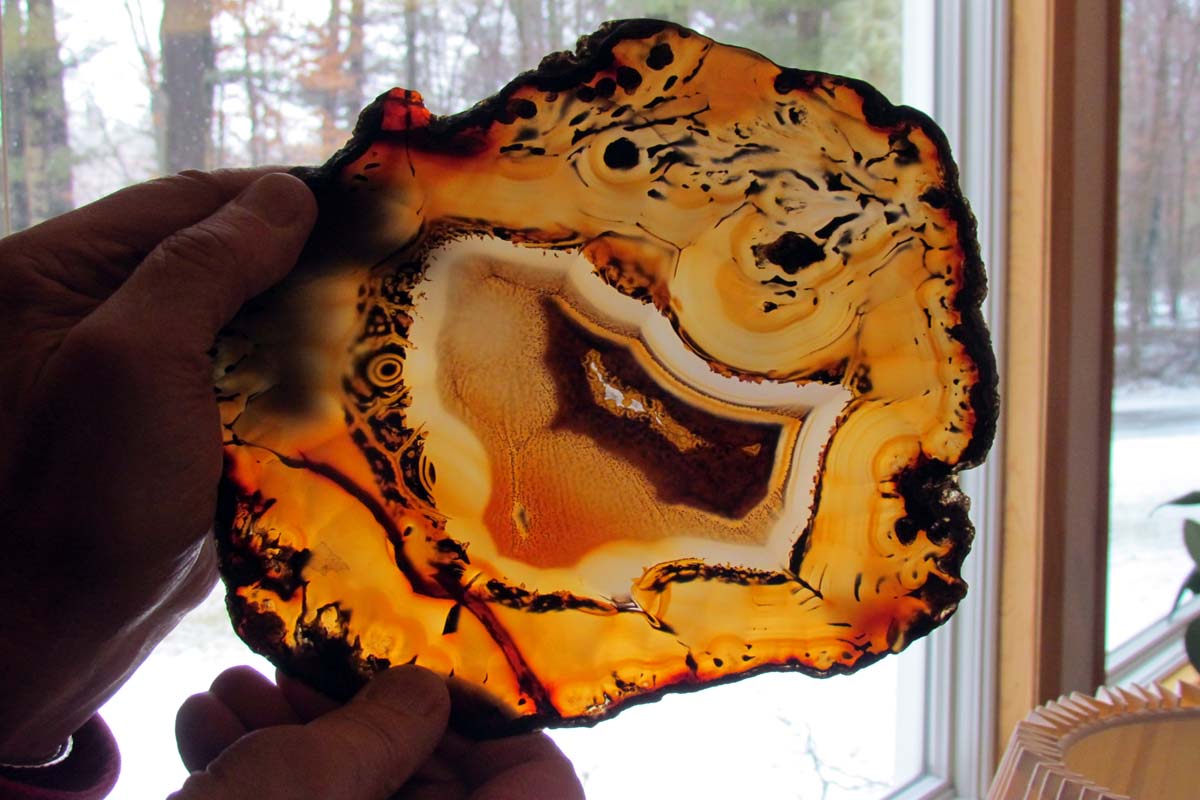
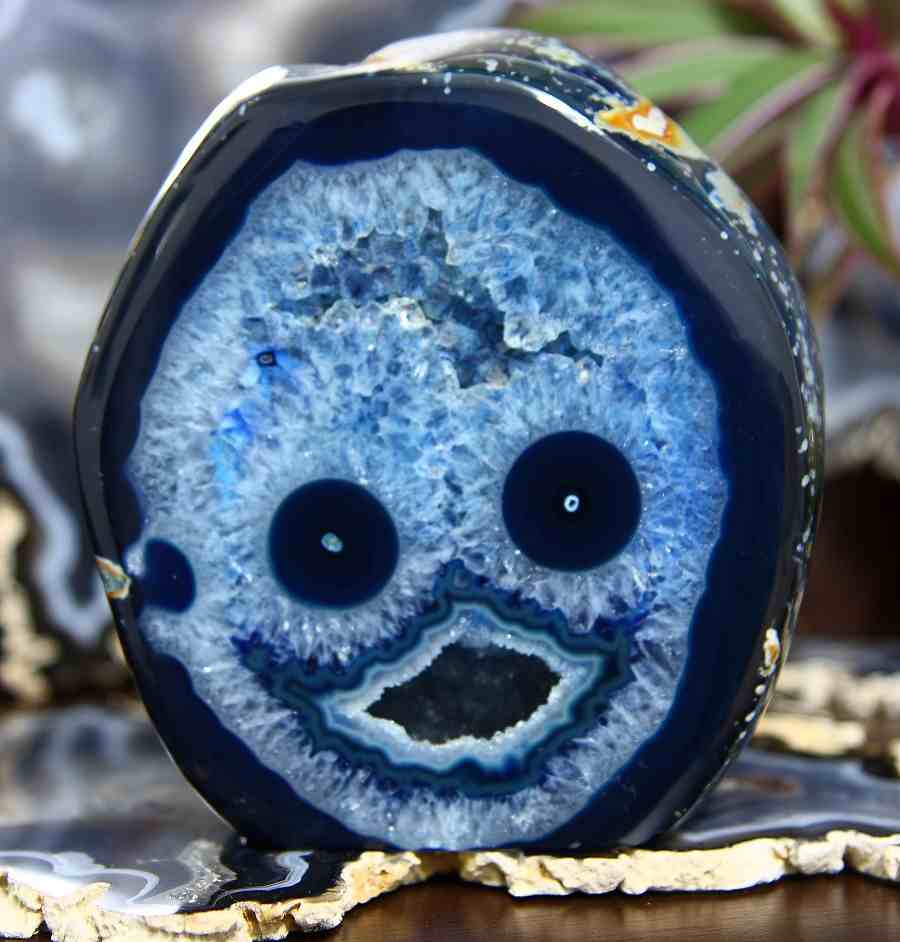
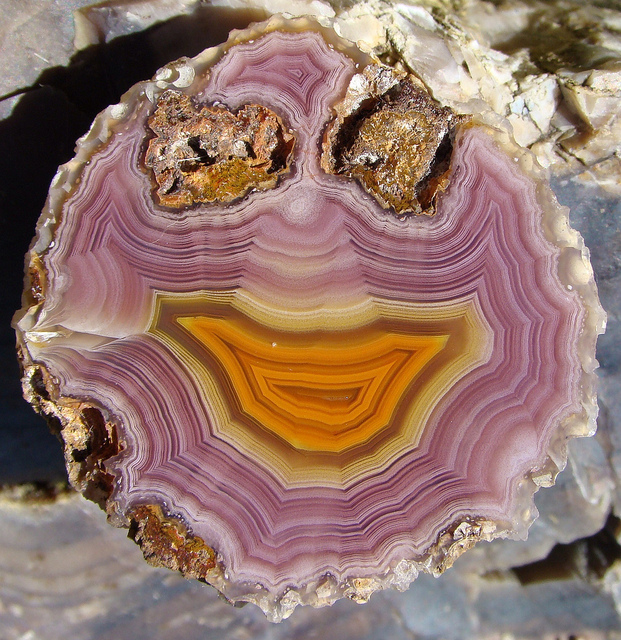
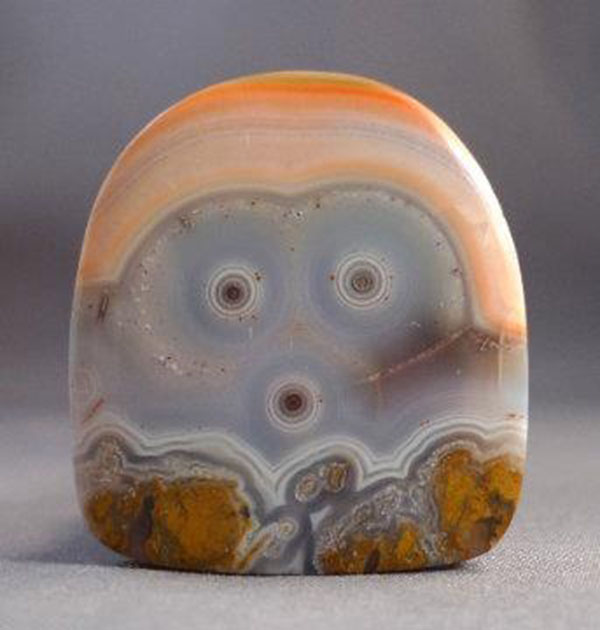
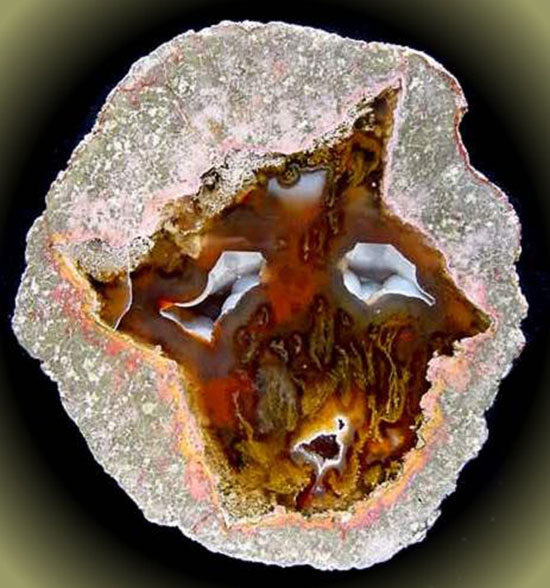
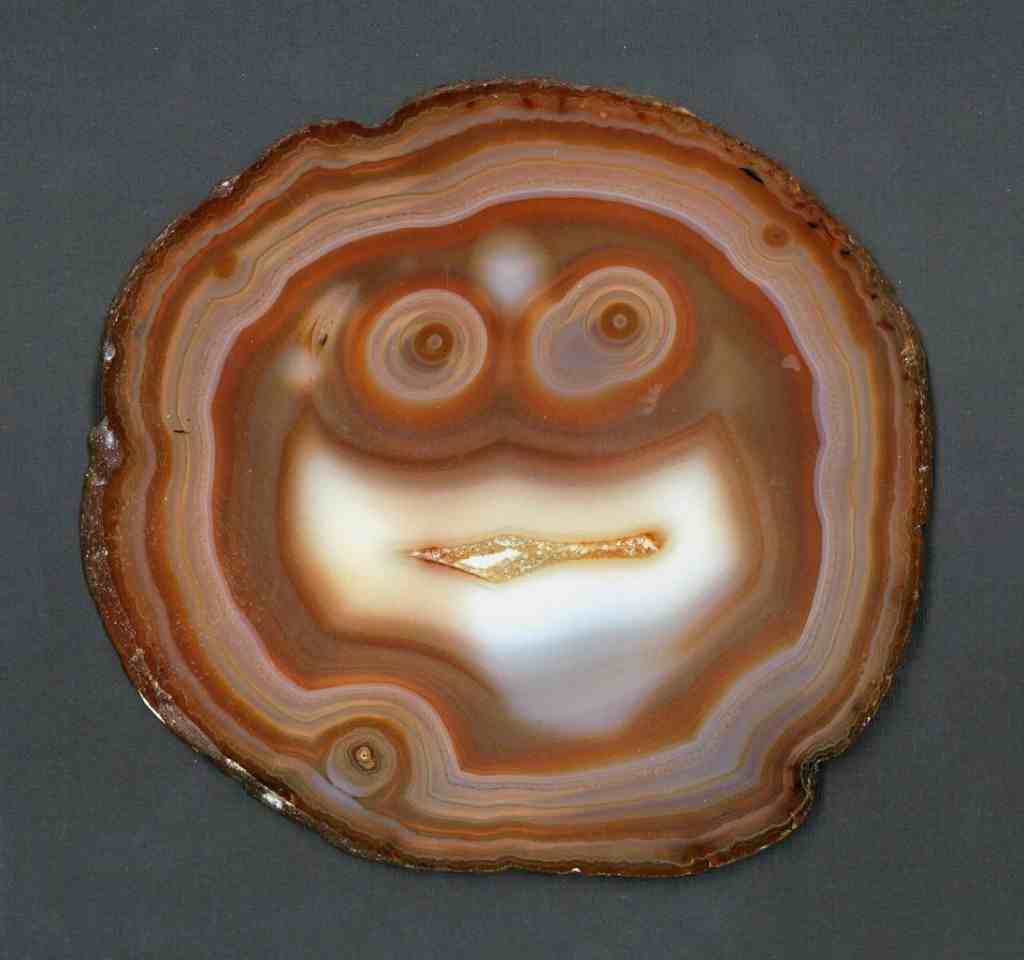
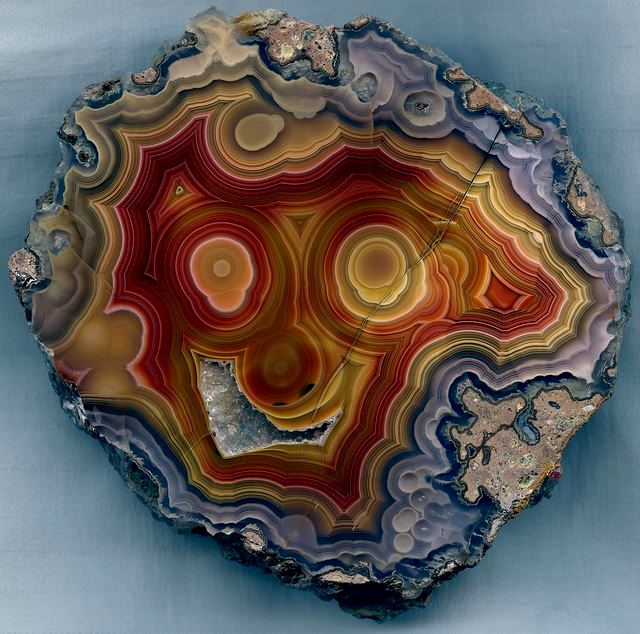
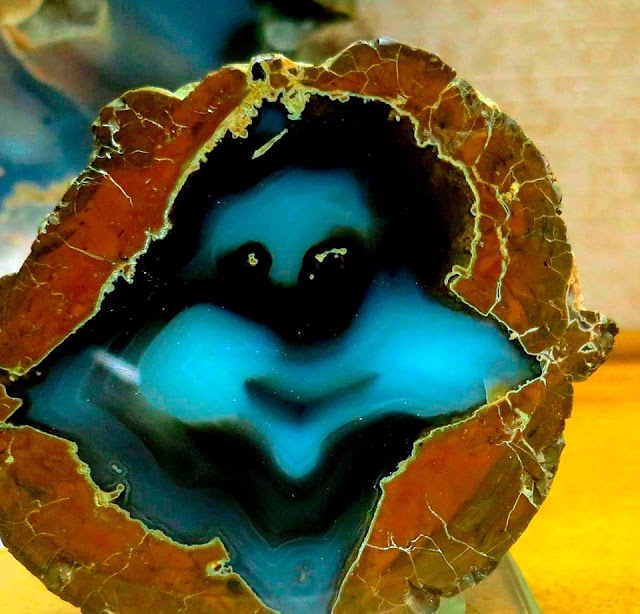
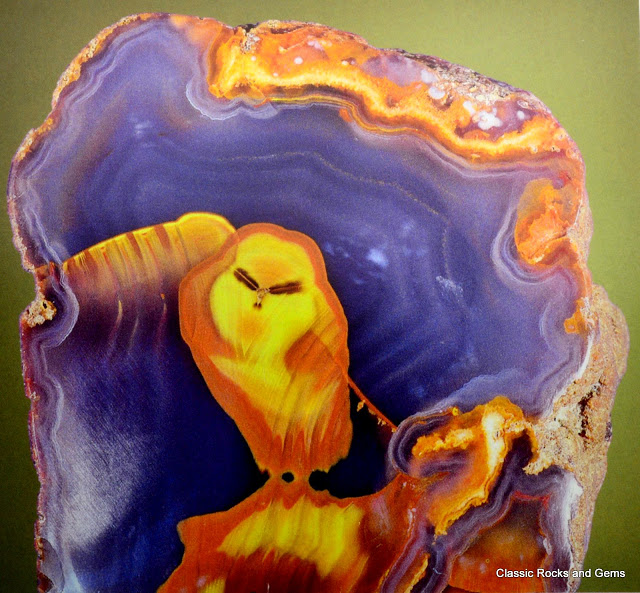
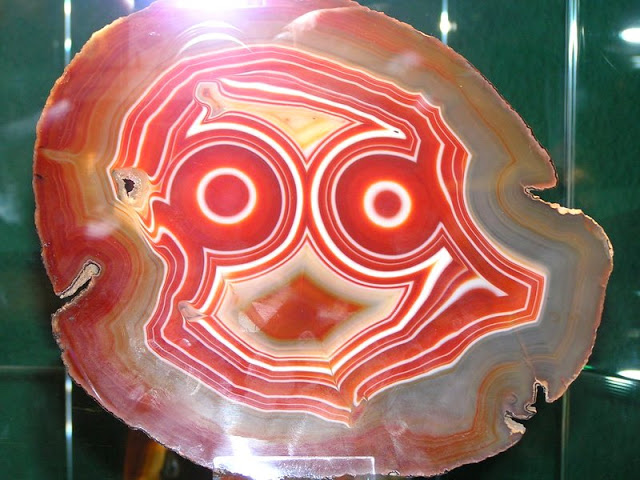
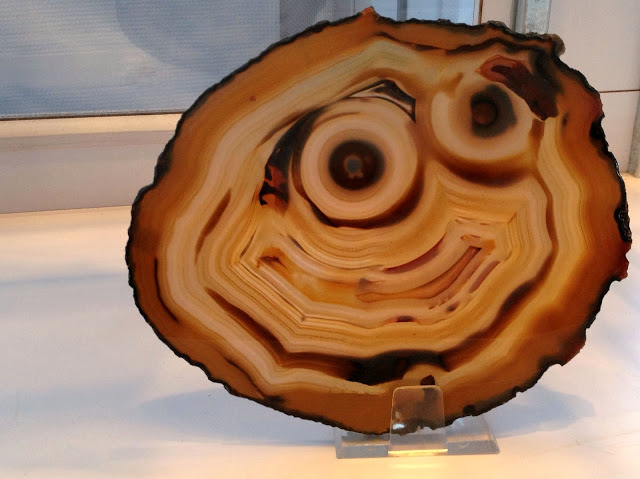
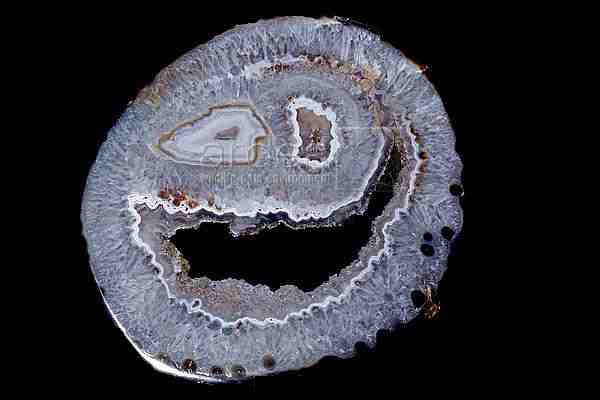
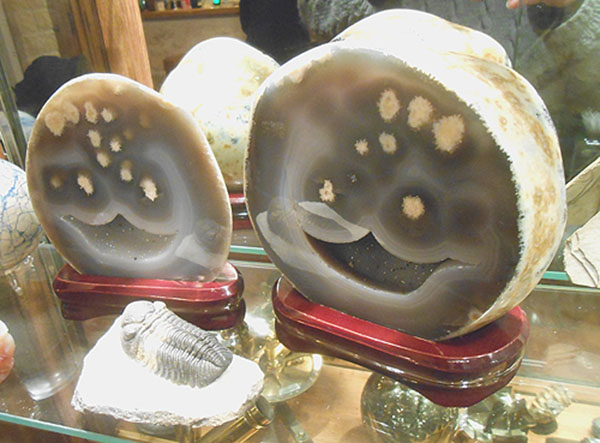
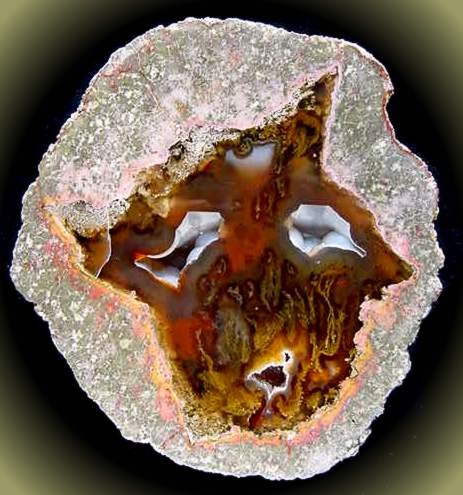
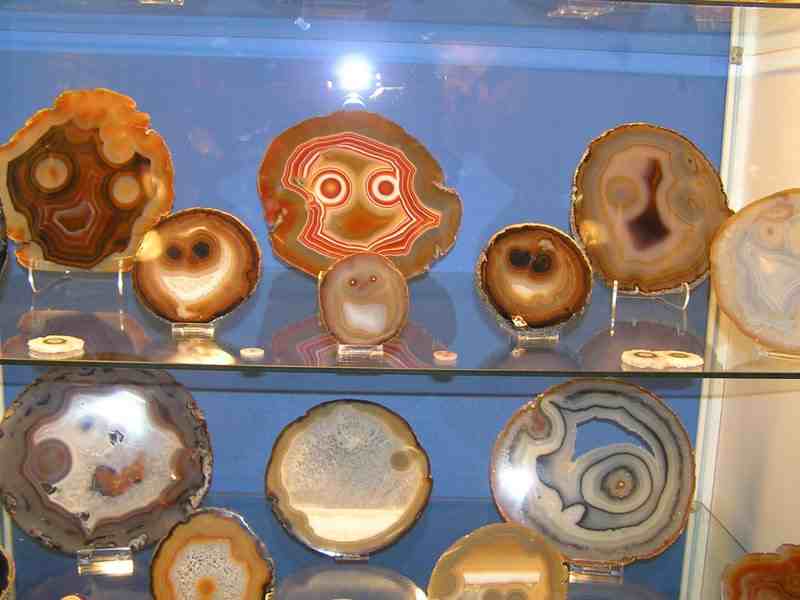
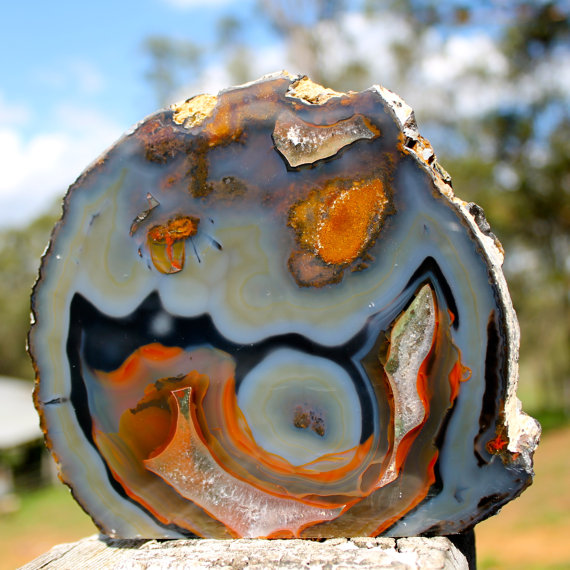
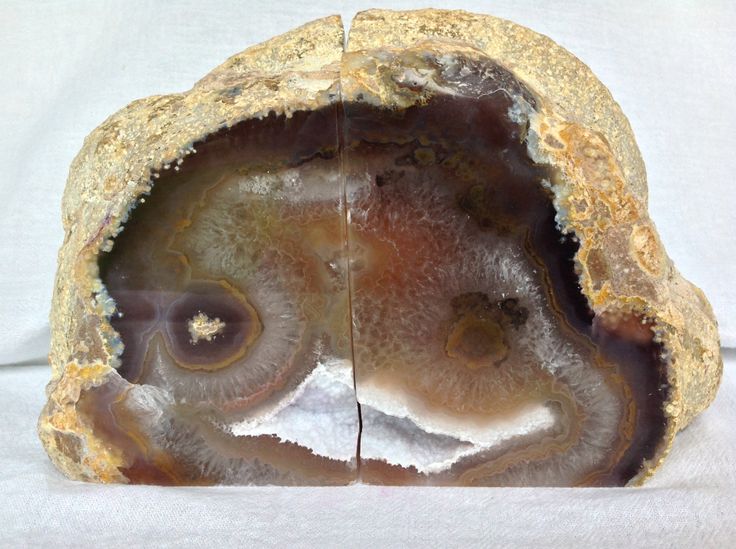
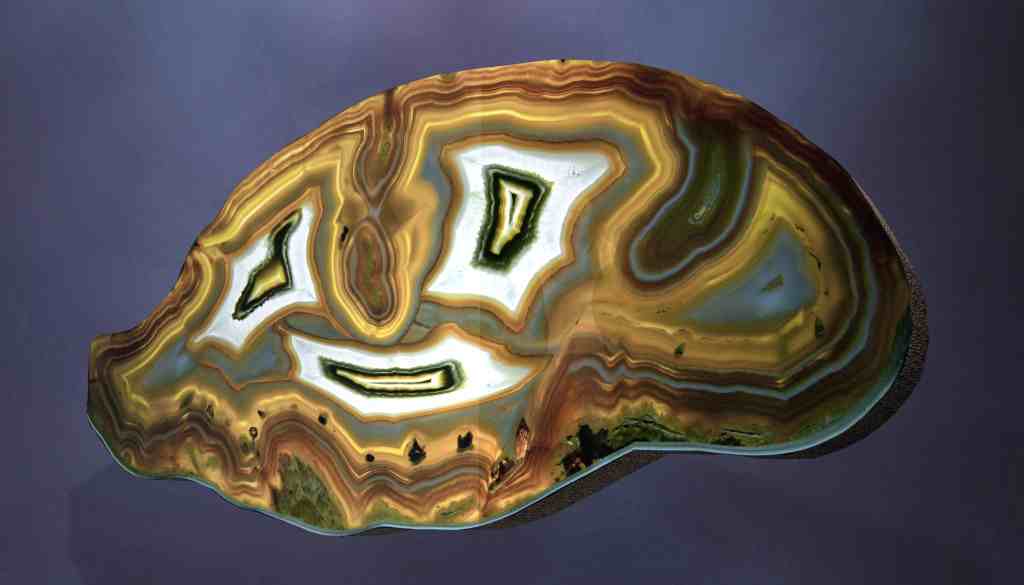
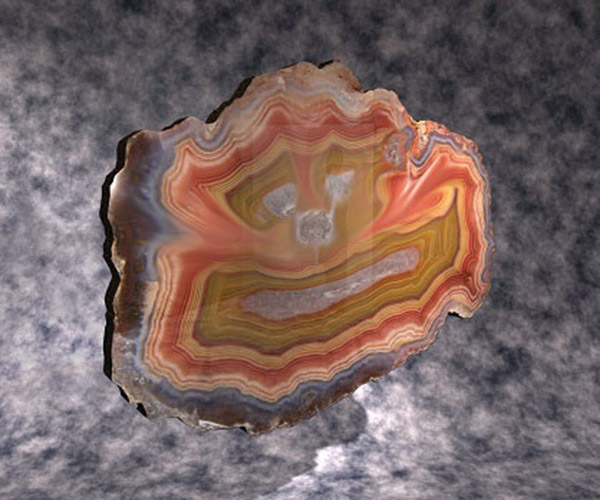
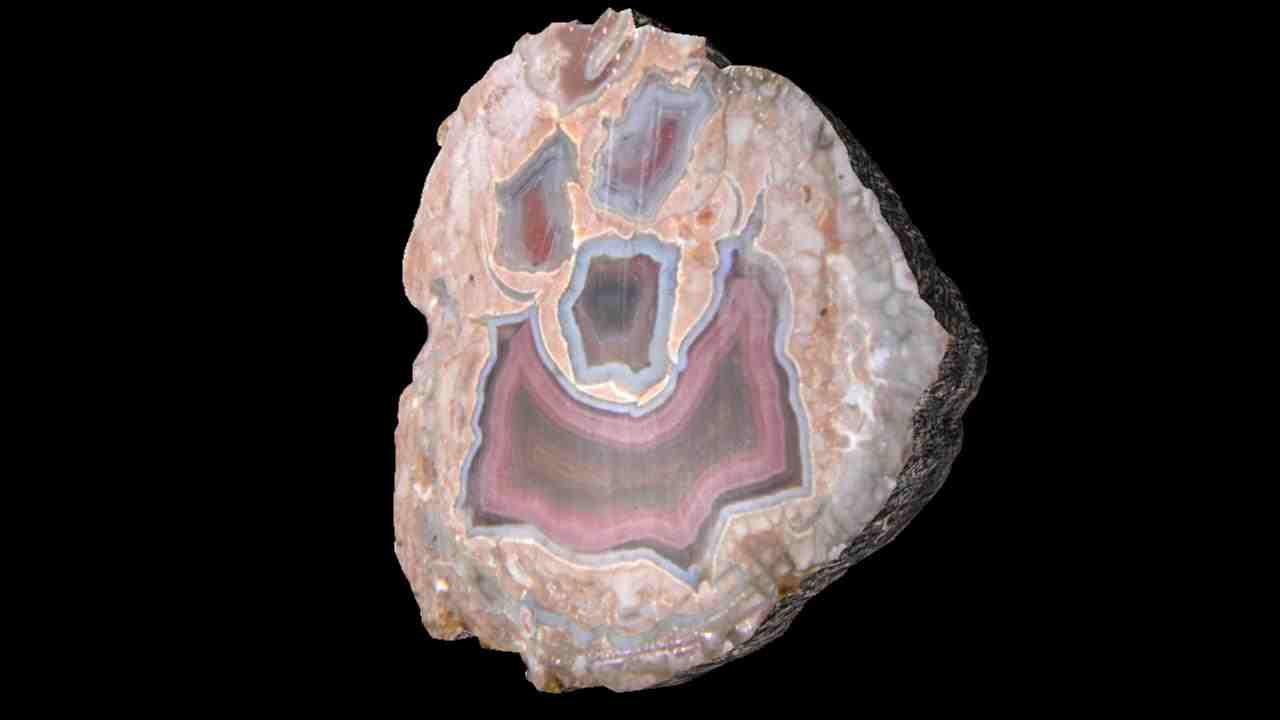
This Faces is Thunder Egg, A Thunder Egg “Thunderegg” is a nodule-like rock, similar to a filled geode, that is formed within rhyolitic volcanic ash layers. Thundereggs are rough spheres, most about the size of a baseball—though they can range from less than an inch to over a meter across
International Chronostratigraphic Chart (v2016/12)
Click here (PDF or JPG) to download the latest version (v2016/12) of the International Chronostratigraphic Chart. The explanatory article was published in September 2013 issue of Episodes (download from Episodes or ICS website).
Translations of the chart: Chinese (v2016/10: PDF or JPG), American Spanish (v2016/04: PDF or JPG), Spanish (v2015/01: PDF or JPG), Basque (v2015/01: PDF or JPG), Catalan (v2015/01: PDF or JPG), Norwegian (v2015/01: PDF or JPG), Lithuanian (v2015/01: PDF or JPG), Japanese (v2014/02: PDF or JPG), Portuguese (v2013/01: PDF or JPG) and French (v2012).
The old versions can be download at the following links: 2008 (PDF or JPG), 2009 (PDF or JPG), 2010 (PDF or JPG), 2012 (PDF or JPG), 2013/01 (PDF or JPG), 2014/02 (PDF or JPG) , 2014/10 (PDF or JPG), 2015/01 (PDF or JPG), 2016/04 (PDF or JPG), 2016/10 (PDF or JPG) and the ChangeLog for 2012-2016.
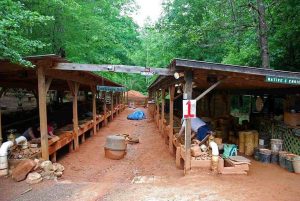
Find glittering, gorgeous emeralds in Hiddenite, only about an hour’s drive from Winston-Salem, NC. The Emerald Hollow Mine is home to the only emerald mine in the United States open for public treasure hunting. There are sluiceways where you can check out findings from the mine, or you can pay to do your own prospecting, digging, and hunting for a small fee.
Although the 70-acre site is known mostly for its emeralds, you could also end up with sapphire, tourmaline, garnet, topaz, and aquamarine. The mine is open year-round and boasts gorgeous scenery, too.
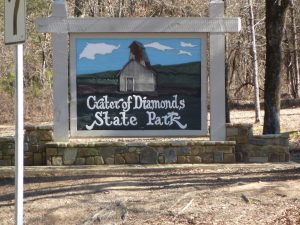
Crater of Diamonds State Park, Murfreesboro, Arkansas
Want to mine for diamonds? Murfreesboro is the place to go. The Crater of Diamonds State Park, 120 miles from Little Rock, AR, is the only existing mine where visitors can prospect for diamonds and keep their findings. Stay at the park campsite and enjoy wildlife and natural scenery as well as some sparkling stones.
You’ll see diamonds everywhere, even laying in the dirt, but you can rent equipment at the park for deeper digging. Once you have a pan of stones, head over to the office so an appraiser can check your stash to see how much your sparklers are worth. So far, visitors to the park have found well over 30,000 diamonds, including a 16-carat beauty in 1975, so your chances of landing a stone are high. As with other diamond deposits, most of the stones are small and included, but some fine gems have been found here.
(UPDATE: In June, 2015, an 8.52-carat diamond was discovered at Crater of Diamonds State Park. With an estimated value of $1 million, it’s the most valuable diamond ever mined in the US. Read more about this unique diamond named Esperanza).
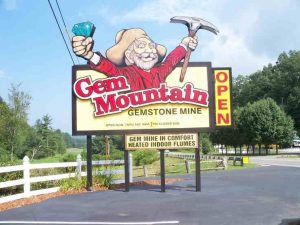
Gem Mountain, Spruce Pine, North Carolina
Looking for aquamarines? Head to Spruce Pine’s own Gem Mountain. The Blue Ridge Mountains are the perfect place to prospect for the beautiful blue stones as well as rubies and moonstones. Onsite gemologists can inspect your findings to see if they’re the real deal, and gem-cutters can spruce up and turn your gems into pieces of jewelry before you head home.
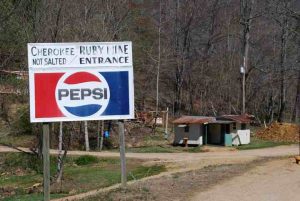
Cherokee Ruby Mine, Franklin, North Carolina
Search for rubies inside the Cherokee Ruby Mine. You can sluice through rocks and dirt with a screen and look for precious treasures, including sapphires, garnets, and rutile. The price of admission is low, and the fun level is high, so make it a family outing. The mine is open for gem hunting to the public from April through October. The backdrop of the Blue Ridge Mountains will make it a beautiful summer vacation.
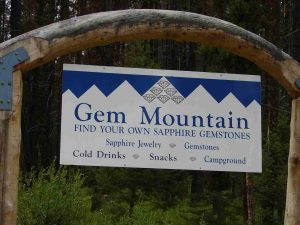
Gem Mountain Sapphire Mine, Philipsburg, Montana
One of the most beautiful states in the country, Montana is also a great place to go gem hunting. Check out Gem Mountain Sapphire Mine for some stellar prospecting. What will you find when you sift through the dirt and gravel at Gem Mountain? Sapphires, and lots of them.
The staff will help you clean your gems and assess them, so you’ll know which stones are worth saving and possibly turning into wearable pieces. You can also purchase sapphire gravel to take home or ready-made jewelry designs featuring the gorgeous Montana sapphires.
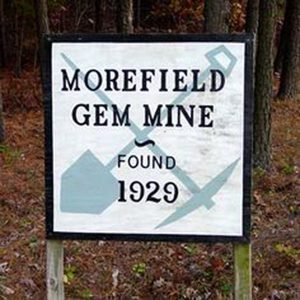
Morefield Mine, Amelia, Virginia
The Morefield Mine, just under an hour from Richmond, VA, is known for its vast amount of amazonite. Prospecting here may also reward you with garnet, amethyst, beryl, topaz, and many other minerals.
There are mining opportunities here for all skill levels. Prospectors can use the sluicing technique or collect from the mine dumps. The Morefield Mine has its own exhibit of stones onsite as well as one at the world-famous Smithsonian Institution in Washington, DC.
Rainbow Ridge Opal Mine, Virgin Valley, Nevada
Colorful and unusual, opal is an eye-catching gem. Mine your own opals at the Rainbow Ridge Opal Mine. This mine has produced very valuable stones, some worth upwards of $50,000. Bring tools and buckets. You’ll be doing some serious digging to get to the treasure here, but your hard work could pay off. The mine is open from May to September.
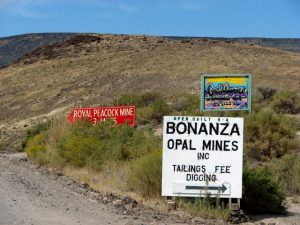
Bonanza Opal Mine, Denio, Nevada
Credit: Mike Hare/flickr
If you’re gem hunting for fire opals, visit the Bonanza Opal Mine in Denio, Nevada. The mine is open from May to September.
Crystal Grove Diamond Mine, St. Johnsville, New York
New York is home to Broadway shows, plenty of shopping, Times Square, and the Statue of Liberty, but did you know New York is a great place to mine for gemstones? Crystal Grove Diamond Mine is the place to go to find Herkimer diamonds, beautiful quartz crystals that are fun to mine. These crystals were first discovered in New York, and the perfect clarity of some of these stones makes them very popular with gem hunters.
You can rent or bring your own prospecting tools. For big embedded crystals, you may need a chisel or hammer to break them out of the rocks. It’s worth the effort.
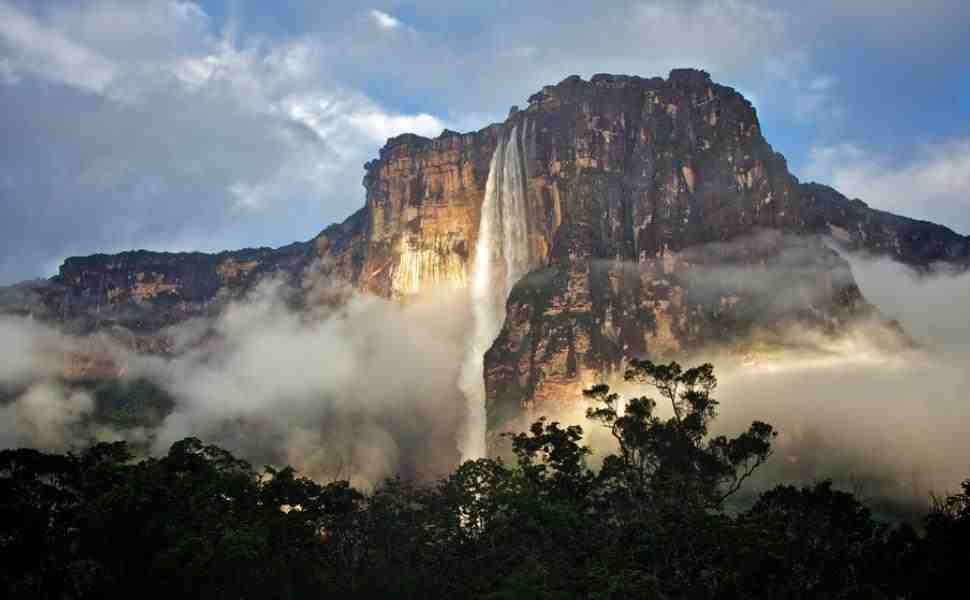
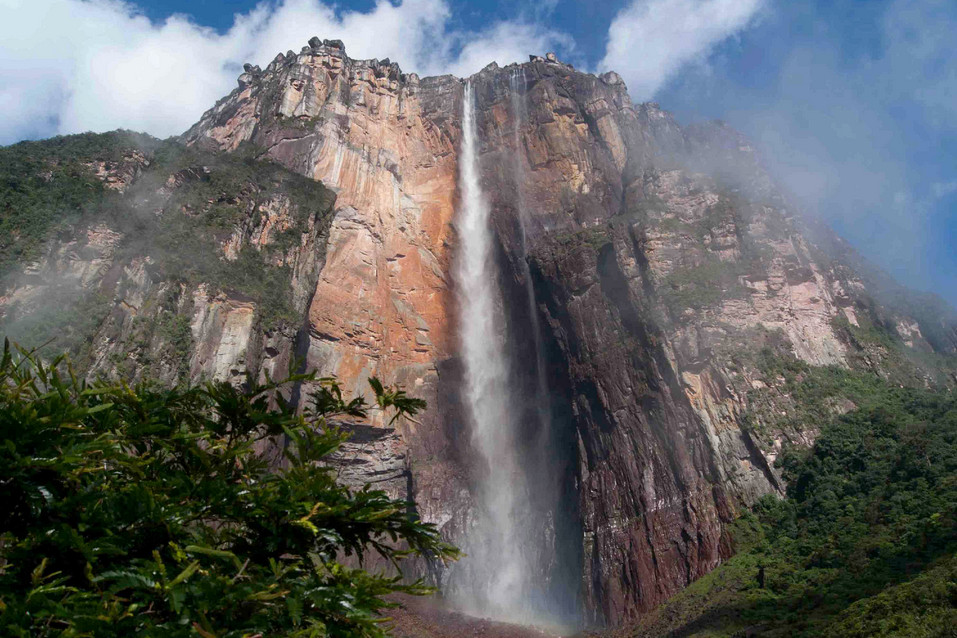
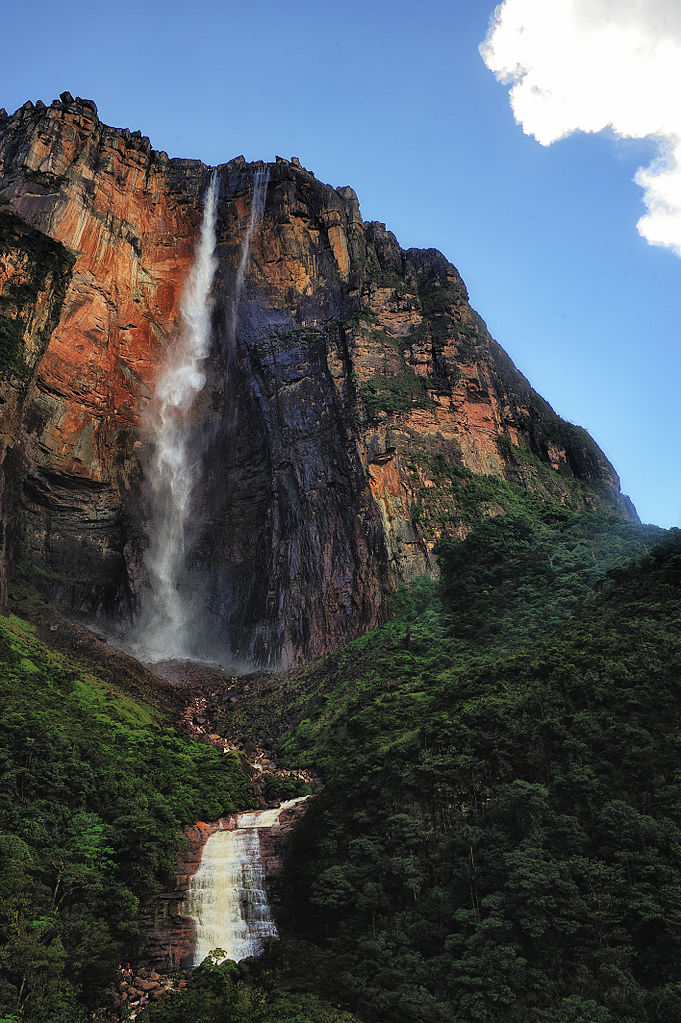
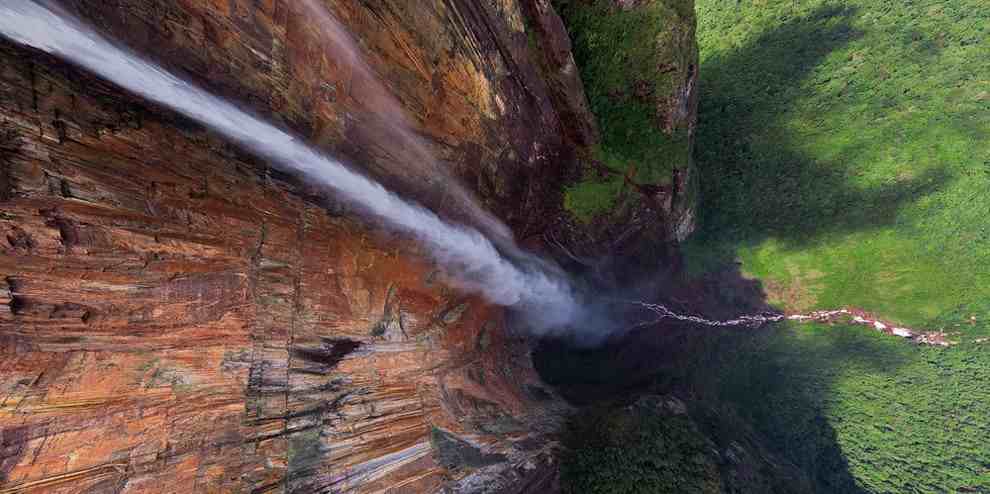
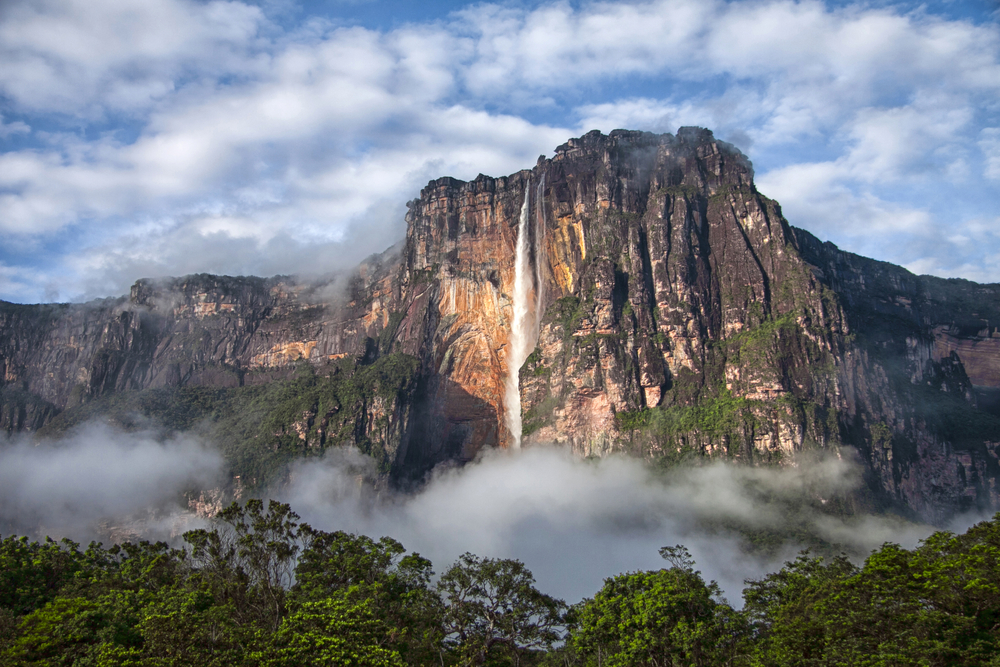
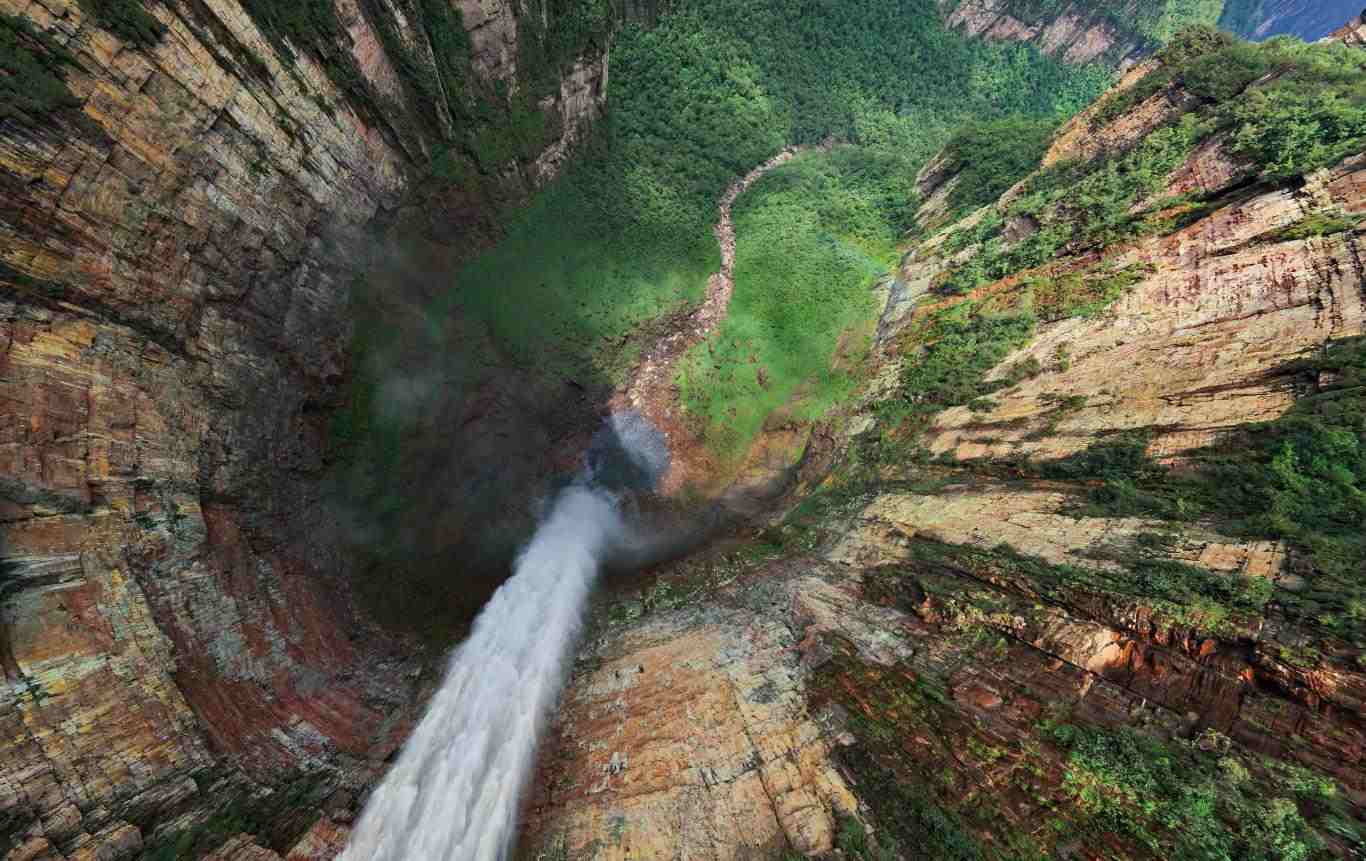
Angel Falls is a waterfall in Venezuela. It is the world’s highest uninterrupted waterfall, with a height of 979 meters (3,212 ft) and a plunge of 807 meters (2,648 ft). The waterfall drops over the edge of the Auyantepui mountain in the Canaima National Park (Spanish: Parque Nacional Canaima), a UNESCO World Heritage site in the Gran Sabana region of Bolívar State. The height figure 979 metres (3,212 ft) mostly consists of the main plunge but also includes about 400 metres (0.25 mi) of sloped cascade and rapids below the drop and a 30-metre (98 ft) high plunge downstream of the talus rapids.
The falls are along a fork of the Rio Kerepacupai Meru which flows into the Churun River, a tributary of the Carrao River, itself a tributary of the Orinoco River.
Name
The waterfall has been known as the “Angel Falls” since the Mid-20th century; they are named after Jimmie Angel, a US aviator, who was the first person to fly over the falls. Angel’s ashes were scattered over the falls on 2 July 1960.
Tourism
Angel Falls is one of Venezuela’s top tourist attractions, though a trip to the falls is a complicated affair. The falls are located in an isolated jungle. A flight from Puerto Ordaz or Ciudad Bolívar is required to reach Canaima camp, the starting point for river trips to the base of the falls. River trips generally take place from June to December, when the rivers are deep enough for use by the Pemon guides. During the dry season (December to March) there is less water seen than in the other months.
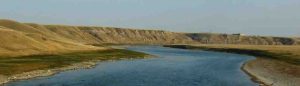
Discovering new dinosaurs is very romantic, isn’t it? A team of plucky explorers stumbles across a small bone sticking out of a cliff, and after a bit of digging around it reveals a complete dinosaur skeleton, and a totally new species to science! I mean, that’s how it always happens, right?
Wrong. Discoveries of complete dinosaurs, or even partial skeletons, are actually incredible rare. They often get the most glory and attention because this is how our media machine functions. The majority of dinosaur discoveries are actually disarticulated, broken, disassociated and fragmentary remains, often comprising no more than a few bones that somehow managed to survive the Earth’s never-ending ravages for tens of millions of years. This is the rule, and ‘good’ fossils, no matter how incredible, are the exception.
More commonly than complete skeletons, ‘bonebeds’ are incredibly fossil-rich deposits that occur in single layers, comprising numerous small fragments of bone, or ‘microfossils’. They typically form as ‘lag deposits’ in coastal environments or river bends where changes in the flow energy of water that transports the fossils leads to their deposition and concentration in clusters. Most of the time, the fossils aren’t identifiable to the species level due to their fragmented nature and small size, but they still give us a good idea about the faunal composition based on sheer numbers alone. This is because we can obtain fossils from them in bulk through methods like sieving, and accrue massive sample sizes. So an actual time where quantity over quality actually comes in useful!
We’ve had a post all about the value of bonebeds before on the network by Don Brinkman. Don described the kinds of patterns we could detect for dinosaur communities and their ecology from these bonebeds, such as trophic (feeding) structures. But what can bonebeds tell us about larger biological patterns too? Can they yield information about dinosaur biogeography, or how dinosaurs changed between different environments? This is what Thomas Cullen from the University of Toronto, Canada, set out to discover as part of his PhD focusing on the vertebrate faunas of North America during the Late Cretaceous.
The Belly River Group of southern Alberta is a renowned fossil hunters dream, containing numerous fossil deposits that have been well-sampled historically and represent a great diversity of dinosaurs and at a very high geological resolution. From this, Thomas helped to build and apply the largest Cretaceous vertebrate microsite dataset yet assembled to test different evolutionary and ecological associations between the faunal assemblages represented by the different microfossil sites.
What he found by applying a cadre of sophisticated statistical methods do this dataset is that changes in palaeoenvironment seem to have been most responsible for changes in the structure of the preserved faunal assemblages. In particular, where the rocks record a shift from a marine to a more inland (terrestrial) environment, major shifts in faunal composition are recorded, as we might expect. Personally, I kinda like this result as it supports some of my own research showing that sea level changes are important in controlling tetrapod diversity through time, but here on a much more localised scale and using different techniques and data.
What Thomas also found is that dinosaur faunas appear to be quite stable in terms of changes to latitude and altitude, distinct from numerous studies that have found this at larger scales within North America. For example, the existence of a dinosaur ‘latitudinal diversity gradient’ has been long debated, but evidence for the existence of this pattern on a more localised scale appears to be lacking. Furthermore, dinosaur faunas did not appear to differ substantially based on occupation of different terrestrial environments, for example coastal versus rivers. Again, this is contrary to some recent evidence that found a strong partitioning between sauropod dinosaurs and palaeoenvironment, but again at a different scale.
What this implies overall is that dinosaurs are perhaps less sensitive than previously thought to more subtle changes across terrestrial landscapes, and that additional parameters must therefore be responsible for their relatively high diversity at this time. Thomas suggests that additional ecological or evolutionary factors such as niche partitioning among species or high rates of evolution might be important here, but that’s an avenue for future research!
Reference:
Thomas M. Cullen et al. Palaeoenvironmental drivers of vertebrate community composition in the Belly River Group (Campanian) of Alberta, Canada, with implications for dinosaur biogeography, BMC Ecology (2016). DOI: 10.1186/s12898-016-0106-8
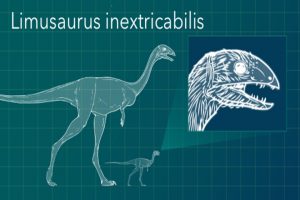
As Limusaurus grew from adolescent to adult, it lost its teeth and did not grow a new set. Credit: George Washington University
Researchers have discovered that a species of dinosaur, Limusaurus inextricabilis, lost its teeth in adolescence and did not grow another set as adults. The finding, published today in Current Biology, is a radical change in anatomy during a lifespan and may help to explain why birds have beaks but no teeth.
The research team studied 19 Limusaurus skeletons, discovered in “death traps,” where they became mired in mud, got stuck and died, in the Xinjiang Province of China. The dinosaurs ranged in age from baby to adult, showing the pattern of tooth loss over time. The baby skeleton had small, sharp teeth, and the adult skeletons were consistently toothless.
“This discovery is important for two reasons,” said James Clark, a co-author on the paper and the Ronald Weintraub Professor of Biology at the George Washington University’s Columbian College of Arts and Sciences. “First, it’s very rare to find a growth series from baby to adult dinosaurs. Second, this unusually dramatic change in anatomy suggests there was a big shift in Limusaurus’ diet from adolescence to adulthood.”
Limusaurus is part of the theropod group of dinosaurs, the evolutionary ancestors of birds. Dr. Clark’s team’s earlier research of Limusaurus described the species’ hand development and notes that the dinosaur’s reduced first finger may have been transitional and that later theropods lost the first and fifth fingers. Similarly, bird hands consist of the equivalent of a human’s second, third and fourth fingers.
These fossils indicate that baby Limusaurus could have been carnivores or omnivores while the adults were herbivores, as they would have needed teeth to chew meat but not plants. Chemical makeup in the fossils’ bones supports the theory of a change in diet between babies and adults. The fossils also could help to show how theropods such as birds lost their teeth, initially through changes during their development from babies to adults.
“For most dinosaur species we have few specimens and a very incomplete understanding of their developmental biology,” said Josef Stiegler, a graduate student at George Washington University and co-author. “The large sample size of Limusaurus allowed us to use several lines of evidence including the morphology, microstructure and stable isotopic composition of the fossil bones to understand developmental and dietary changes in this animal.”
Reference:
Wang et al. Extreme Ontogenetic Changes in a Ceratosaurian Theropod. Current Biology, 2016 DOI: 10.1016/j.cub.2016.10.043
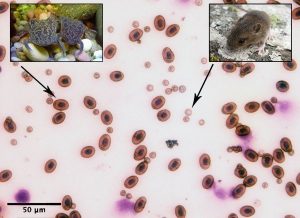
This is a photomicrograph showing a blood smear with the large red blood cells of the African clawed frog and the small red blood cells of a rodent side-by-side (400x magnification). Credit: Photomicrograph by Adam Huttenlocker, wood mouse by Anne Burges, African clawed frog by Tim Vickers
Many mammals and birds are remarkable athletes; mice work hard to dig burrows for protection and sparrows fight gravity with each flap of their wings. In order to have the energy to sustain vigorous exercise, the body’s tissues need a steady supply of oxygen, and red blood cells (RBCs) are the center of the oxygen delivery system. Size matters, too; athletic mammals and birds have much smaller RBCs than other vertebrates with lesser capacities for exercise. Biologists have long been puzzled over the evolutionary origins of RBC size. Were predecessors of mammals and birds — including dinosaurs — athletes and did they have tiny red blood cells? How do you measure the blood of extinct animals?
Now, biologists at the University of Utah and the Natural History Museum of Utah have established a ‘fossilizable’ indicator of athleticism in the bones of extinct vertebrates.
The study, which published online in Current Biology on Dec. 22, is the first to draw a link between RBC size and the microscopic traces of blood vessels and bone cells inside the bone. The researchers measured the bony channels that deliver oxygen to bone tissue to pinpoint when our mammal ancestors, bird and dinosaur predecessors evolved small RBCs. They found that extinct mammal relatives, or cynodonts, and extinct bird relatives had smaller RBCs and were likely better athletes than earlier terrestrial vertebrates. The timing of RBC-size reduction coincided with the greatest mass extinction event on Earth 252 million years ago, an event that paved the way for the age of the dinosaurs.
“Some people look at fossils, and they see rocks — but these were living and breathing organisms. To be able to find proxies that tell us something like this, it gets us to think about living organisms in their environments,” says lead author Adam Huttenlocker of the Keck School of Medicine at the University of Southern California, who completed the research as a postdoctoral fellow at the U and THE MUSEUM. “It allows us to think about the overall implications for mass extinction. What were some of the physiological innovations that allowed them to be successful? That’s really exciting.”
Red blood cells: oxygen delivery system
It may seem counterintuitive that tiny RBCs deliver oxygen more effeciently than larger cells, says Huttenlocker, but the smaller size corresponds to densely packed vascular networks that are far more efficient than big blood cells that are sparsely distributed.
“Think about it like this; it’s much easier to unload people from two small sedans quickly than it is to unload a 15-passenger van at the same rate,” says Huttenlocker. “That’s basically what red blood cells are — vehicles for oxygen. When you have lots more very small ones, you can pick up and drop off oxygen very quickly.”
Huttenlocker knew from previous research that the diameters of capillaries that deliver oxygen to muscles tend to have similar widths as the RBCs of the organism. This makes it easier for the oxygen molecules to leave the blood cells, pass through the capillary wall and push into various tissues. Athletic mammals’ and birds’ RBCs are much smaller than the blood cells of less active animals.
For a paleontologist hoping to find clues in the blood of extinct animals, this presents a problem; capillaries don’t fossilize. So Huttenlocker measured the diameter of the microscopic canals imbedded in fossilized bones that allow capillaries to deliver oxygen to bone tissue. He also measured tiny cavities that hold bone cells, called lacunae.
“This aspect — the diameter of the canals — has been overlooked by paleontologists,” says Colleen Farmer, senior author of the paper and biologist at the U and the museum. The size of the canals is a proxy for the size of the red blood cells, which indicates whether or not an organism had the ability to sustain vigorous exercise, she continues. “Aerobic capacity coevolved with many key life-history traits — mode of locomotion, ability of an animal to migrate, whether the animal experienced intense intraspecific competition — it’s not trivial, aerobic capacity is a central and key aspect of life history.”
A look into a long history
Huttenlocker and Farmer looked at three major lineages of terrestrial animals; the mammals and their extinct relatives, non-avian reptiles and birds and their extinct relatives, and amphibians. The researchers chose these three groups, called the tetrapods, because of their evolutionary history; they all shared the same, ancient four-legged ancestor before branching off on their own evolutionary courses by 320 million years ago.
The amphibians, including water-loving frogs and salamanders, diverged from the common tetrapod ancestor first in the early Carboniferous period, more than 320 million years ago. The mammal and reptile lineages branched off next. The extinct mammal-like cynodonts first appeared in the late Permian period, about 260 million years ago. They looked more like stout, possibly furred lizards than the mammals we see today. Around the same time, the reptiles diverged into two groups — the forebears to dinosaurs and birds, called the archosaurs, and the other non-avian reptiles.
At the beginning of the Triassic period 252 million years ago, 90 percent of life died off. The so-called Permian-Triassic mass extinction was the largest extinction event in Earth’s history, and left room for the survivors to diversify and fill in the newly vacant niches.
“We’re dealing with a long timescale. Right before the extinction in the early Permian and Carboniferous are these generalized-looking four-legged animals. By the time you get to the Triassic, they look more like what we see today, but still alien in some ways,” says Huttenlocker.
First, Huttenlocker analyzed the bones of 14 species of living tetrapods: six mammals, two birds, four non-avian reptiles and two amphibians. He made paper-thin sections of each animal’s forelimb bone and digitally visualized the image to see the microscopic canals and bone cell lacunae under a microscope. Then he measured the diameters of the smallest canals and lacunae and came up with equations that could predict the size of the RBCs. He tested his predictions against blood smears to measure the actual blood cell size. He found he was able to predict the size based on the microstructures in the bone.
The researchers found that mammals and birds had smaller canal and lacunae sizes than the non-avian reptiles and amphibians. Additionally, smaller blood cells corresponded to a higher density of canals, which allows oxygen to diffuse into tissues more rapidly. Huttenlocker and Farmer were confident that bone microstructure would be a proxy for RBC size in the extinct animals. They found that all of the Triassic mammal ancestors (the cynodonts) and some earlier mammal predecessors, had similar RBC sizes as modern mammals. The archosauromorphs had a wide range of cell sizes, however the smallest RBCs were about the same size as their contemporary Triassic cynodonts.
Under selective pressure
The fossilized proxy for RBC size gives clues to the extinct animals’ environment. The cynodonts existed 70 million years before true mammals appeared, yet they lived similar lifestyles. The small cynodonts nested in underground burrows, which often have lower oxygen levels than at the surface. The cynodonts may have evolved smaller RBCs to dig tunnels, move dirt around, and maintain active lifestyles in low-oxygen environments.
A more controversial hypothesis has to do with a long-term drop in atmospheric oxygen at the beginning of the Triassic. Some people have suggested that adaptations for more efficient oxygen distribution could have been caused by low oxygen levels. Whatever the cause, Huttenlocker says that there must have been some selective factors present during the Triassic period that promoted these traits.
“Similar environmental pressures can result in similar solutions to problems in these very different groups of animals,” says Huttenlocker. “In this paper, we’re just focusing on one little nugget of that. But the forerunners of mammals and birds were able to exercise and be athletes in the Permian-Triassic world.”
Farmer says that they need to analyze lots more living animals to strengthen the case that bone microstructures can be a proxy for athleticism. The tool will enable paleontologists to assess the athletic ability of many types of extinct animals. “Many fossils have been analyzed without this insight, and the data are just sitting there, and can readily be viewed through this lens,” says Farmer. “This is transformative in providing a new avenue to peer into the past to see what these animals were like.”
Reference:
Adam K. Huttenlocker, C.G. Farmer. Bone Microvasculature Tracks Red Blood Cell Size Diminution in Triassic Mammal and Dinosaur Forerunners. Current Biology, December 2016 DOI: 10.1016/j.cub.2016.10.012
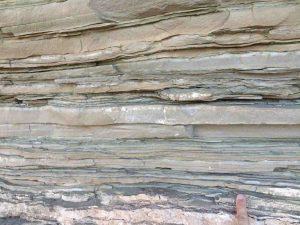
Close-up view of layered sedimentary rocks representative of those used in this study. Each layer records a snapshot of the Earth system over millions to billions of years. Credit: Georgia Tech / Yale University: Reinhard / Planavsky
For three billion years or more, the evolution of the first animal life on Earth was ready to happen, practically waiting in the wings. But the breathable oxygen it required wasn’t there, and a lack of simple nutrients may have been to blame.
Then came a fierce planetary metamorphosis. Roughly 800 million years ago, in the late Proterozoic Eon, phosphorus, a chemical element essential to all life, began to accumulate in shallow ocean zones near coastlines widely considered to be the birthplace of animals and other complex organisms, according to a new study by geoscientists from the Georgia Institute of Technology and Yale University.
Along with phosphorus accumulation came a global chemical chain reaction, which included other nutrients, that powered organisms to pump oxygen into the atmosphere and oceans. Shortly after that transition, waves of climate extremes swept the globe, freezing it over twice for tens of millions of years each time, a highly regarded theory holds. The elevated availability of nutrients and bolstered oxygen also likely fueled evolution’s greatest lunge forward.
After billions of years, during which life consisted almost entirely of single-celled organisms, animals evolved. At first, they were extremely simple, resembling today’s sponges or jellyfish, but Earth was on its way from being, for eons, a planet less than hospitable to complex life to becoming one bursting with it.
Earth’s true genesis
In the last few hundred million years, biodiversity has blossomed, leading to dense jungles and grasslands echoing with animal calls, and waters writhing with every shape of fin and color of scale. And most every stage of development has left its mark on the fossil record.
The researchers are careful not to imply that phosphorous necessarily caused the chain reaction, but in sedimentary rock taken from coastal areas, the nutrient has marked the spot where that burst of life and climate change took off. “The timing is definitely conspicuous,” said Chris Reinhard, an assistant professor in Georgia Tech’s School of Earth and Atmospheric Sciences.
Reinhard and Noah Planavsky, a geochemist from Yale University, who headed up the research together, have mined records of sedimentary rock that formed in ancient coastal zones, going down layer by layer to 3.5 billion years ago, to compute how the cycle of the essential fertilizer phosphorus evolved and how it appeared to play a big part in a veritable genesis.
They noticed a remarkable congruency as they moved upward through the layers of shale into the time period where animal life began, in the late Proterozoic Eon.
“The most basic change was from very limited phosphorous availability to much higher phosphorus availability in surface waters of the ocean,” Reinhard said. “And the transition seemed to occur right around the time that there were very large changes in ocean-atmosphere oxygen levels and just before the emergence of animals.”
Phosphorus at the beach
Reinhard and Planavsky, together with an international team, have proposed that a scavenging of nutrients in an anoxic (nearly O2-free) world stunted photosynthetic organisms that otherwise had been poised for at least two billion years to make stockpiles of oxygen. Then that balanced system was upset and oceanic phosphorus made its way to coastal waters.
The scientists published their findings in the journal Nature on Wednesday, December 21, 2016. Their research was funded by the National Science Foundation, the NASA Astrobiology Institute, the Sloan Foundation and the Japan Society for the Promotion of Science.
The work provides a new view into what factors allowed life to reshape Earth’s atmosphere. It helps lay a foundation that scientists can apply to make predictions about what would allow life to alter exoplanets’ atmospheres, and may inspire deeper studies, here on Earth, of how oceanic-atmospheric chemistry drives climate instability and influences the rise and fall of life through the ages.
Cyanobacteria, the mother of O2
Complex living things, including animals, usually have an immense metabolism and require ample O2 to drive it. The evolution of animals is unthinkable without it.
The path to understanding how a nutrient dearth would starve out breathable oxygen production leads back to a very special kind of bacteria called cyanobacteria, the mother of oxygen on Earth.
“The only reason we have a well-oxygenated planet we can live on is because of oxygenic photosynthesis,” Planavsky said. “O2 is the waste product of photosynthesizing cells, like cyanobacteria, combining CO2 and water to build sugars.”
And photosynthesis is an evolutionary singularity, meaning it only evolved once in Earth’s history – in cyanobacteria.
Some other biological phenomena evolved repeatedly in dozens or hundreds of unrelated incidences across the ages, such as the transition from single-celled organisms to rudimentary multicellular organisms. But scientists are confident that oxygenic photosynthesis evolved only this one time in Earth’s history, only in cyanobacteria, and all plants and other beings on Earth that photosynthesize coopted the development.
The iron anchor
Cyanobacteria are credited with filling Earth’s atmosphere with O2, and they’ve been around for 2.5 billion years or more.
That begs the question: What took so long? Basic nutrients that fed the bacteria weren’t readily available, the scientist hypothesize. The phosphorus, which Planavsky and Reinhard specifically tracked, was in the ocean for billions of years, too, but it was tied up in the wrong places.
For eons, the mineral iron, which once saturated oceans, likely bonded with phosphorous, and sank it down to dark ocean depths, far away from those shallows—also called continental margins—where cyanobacteria would have needed it to thrive and make oxygen. Even today, iron is used to treat waters polluted with fertilizer to remove phosphorous by sinking it as deep sediment.
The researchers also used a geochemical model to show how a global system with high iron concentration and low phosphorus availability combined with low nitrogen availability in ocean shallows could perpetuate itself in a low-oxygen world.
“It looks to have been such a stable planetary system,” Reinhard said. “But it’s obviously not the planet we live on now, so the question is, how did we transition from this low-oxygen state to where we are now?”
What ultimately caused that change is a question for future research.
Phosphorus starting pistol
But something did change about 800 million years ago, and cyanobacteria and other minute organisms in continental margin ecosystems got more phosphorus, the backbone of DNA and RNA, and a main actor in cell metabolism. The bacteria became more active, reproduced more quickly, ate lots more phosphorus and made loads more O2.
“Phosphorus is not only essential for life,” Planavsky said. “What’s implicit in all this is: It can control the amount of life on our planet.”
When the newly multiplied bacteria died, they fell to the floor of those ocean shallows, stacking up layer by layer to decay and enrich the mud with phosphorus. The mud eventually compressed to stone.
“As the biomass increased in phosphorus content, the more of it landed in layers of sedimentary rock,” Reinhard said. “To scientists, that shale is the pages of the sea floor’s history book.”
Scientists have thumbed through them for decades, compiling data. Planavsky and Reinhard analyzed some 15,000 rock records for their study.
“The first compilation we had of this was only 600 samples,” Planavsky said. Reinhard added, “But you could already see it then. The phosphorus jolt was as clear as day. And as the database grew in size, the phenomenon became more entrenched.”
That first signal of phosphorus in Earth’s coast shallows pops up in the shale record like a shot from a starting pistol in the race for abundant life.
Reference:
Christopher T. Reinhard, Noah J. Planavsky, Benjamin C. Gill, Kazumi Ozaki, Leslie J. Robbins, Timothy W. Lyons, Woodward W. Fischer, Chunjiang Wang, Devon B. Cole & Kurt O. Konhauser. Evolution of the global phosphorus cycle. DOI:10.1038/nature20772
Since 2005, Campi Flegrei has been undergoing what scientists call “uplift”, causing Italian authorities to raise the alert level in 2012 from green to yellow, signalling the need for active scientific monitoring. Credit: Carmine Minopoli, AFP
A slumbering Campi Flegrei volcano under the Italian city of Naples shows signs of “reawakening” and may be nearing a critical pressure point, according to a study published Tuesday.
Italian and French scientists have for the first time identified a threshold beyond which rising magma under the Earth’s surface could trigger the release of fluids and gases at a 10-fold increased rate.
This would cause the injection of high-temperature steam into surrounding rocks, said lead author Giovanni Chiodini, a researcher at Italy’s National Institute of Geophysics and Volcanology in Bologna.
“Hydrothermal rocks, if heated, can ultimately lose their mechanical resistance, causing an acceleration towards critical conditions,” he told AFP by email.
It is not possible at this time to say when—or if—the volcano will erupt anew, he said.
If it did, however, “it would be very dangerous” for the half-million people living inside and near the caldera, he added, using the scientific name for the bowl-like depression created after a volcano blows its top.
Since 2005, Campi Flegrei has been undergoing what scientists call “uplift”, causing Italian authorities to raise the alert level in 2012 from green to yellow, signalling the need for active scientific monitoring.
The pace of ground deformation and low-level seismic activity has recently increased.
Two other active volcanoes—Rabaul in Papua New Guinea, and Sierra Negra in the Galapagos—”both showed acceleration in ground deformation before eruption with a pattern similar to that observed at Campi Flegrei,” Chiodini said.
The Campi Flegrei caldera was formed 39,000 years ago in a blast that threw hundreds of cubic kilometres of lava, rock and debris into the air.
It was the largest eruption in Europe in the past 200,000 years, according to scientists.
Campi Flegrei last erupted in 1538, though on a much smaller scale.
Nearby Mount Vesuvius, whose massive eruption in 79 AD buried several Roman settlements in the area, including Pompeii, is also classified as an active volcano.
The dense urban population at risk “highlights the urgency of obtaining a better understanding of Campi Flegrei’s behaviour,” Chiodini said.
The study was published in the scientific journal Nature Communications.
Reference:
Giovanni Chiodini, Antonio Paonita, Alessandro Aiuppa, Antonio Costa, Stefano Caliro, Prospero De Martino, Valerio Acocella & Jean Vandemeulebrouck. Magmas near the critical degassing pressure drive volcanic unrest towards a critical state. DOI:10.1038/ncomms13712
Note: The above post is reprinted from materials provided by AFP.
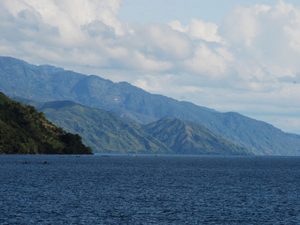
A view of the Malawi coast in Eastern Africa. Credit: Christopher Scholz
Researchers in the College of Arts and Sciences have published new details about the evolution of the East African Rift (EAR) Valley, one of the world’s largest continental rift zones.
Christopher Scholz, professor of Earth sciences, and a team of students and research staff, have spent the past year processing and analyzing data acquired in 2015 from Lake Malawi, the result of a multinational research effort sponsored by the National Science Foundation (NSF). By studying the interplay of sedimentation and tectonics, they have confirmed that rifting—the process by which the Earth’s tectonic plates move apart—has occurred slowly in the lake’s central basin over the past 1.3 million years, utilizing a series of faults many millions of years older.
Scholz says the nature of the tectonic activity is attributed to a strong, cold lithosphere and to strain localization on faults that occurred millions of years earlier, when the basin formed. The Earth’s lithosphere includes the crust and uppermost mantle.
The team’s findings are the subject of an article in the Journal of Structural Geology (Elsevier, 2016), which Scholz co-authored with lead author and Ph.D. candidate Tannis McCartney G’17.
“We collected data during a month-long research cruise aboard a converted container ship on Lake Malawi,” says Scholz, a leader in sedimentary basin analysis of extensional systems. “For the first time, a crustal-scale seismic source was deployed on an African lake, revealing tantalizing, new details about the stratigraphic and structural evolution of the East African Rift System.”
Tectonic plates are huge slabs of crust and mantle that are constantly in motion, often crashing into, grinding against or falling beneath one another, causing earthquakes in the process. When this happens, the plates tear apart to form a lowland region known as a rift valley.
One of the world’s largest rift valleys is the EAR, approximately 3,700 miles long and 30-40 miles wide. The rift valley is so big that it is slowly splitting Africa in two. The larger Nubian tectonic plate encompasses most of the continent, whereas the smaller Somali plate carries the Horn of Africa.
“The EAR is considered the cradle of humanity,” Scholz says. “During its formation more than 25 million years ago, the region underwent considerable rifting, altering its rivers, lakes and climate, and setting the stage for the evolution of primates and humans.”
Within the EAR are two valley systems, one of which is the Western Rift. This system is home to a chain of enormous lakes and wetlands, including Lake Malawi. Bordered by Malawi, Tanzania and Mozambique, Lake Malawi has a surface area of more than 11,400 square miles, making it the ninth-largest freshwater body of water in the world. It also is Africa’s third-largest lake, and, at 2,300 feet, its second deepest.
Lake Malawi is known for its more than one thousand species of cichlid fish—diversification likely triggered by shifting environmental forces. Scholz recently made headlines when he confirmed that water levels in Lake Malawi have ebbed and flowed approximately two-dozen times, sometimes by as much as 600 feet, over the past million years.
Scholz explains that a rift is a fracture in the Earth’s surface that widens over time. “In East Africa, rifting has created a series of narrow, deep rift valleys that contains some of the world’s largest freshwater lakes,” he says. Although these lakes stem from millions of years of tectonic stretching and thinning, Lake Malawi is relatively young. Based on analyses carried out by McCartney, the lake’s rift basin probably was formed about 8 million years ago. “Deep-water conditions didn’t persist until around 4 million years later, when freshwater flooded the rift valley,” Scholz adds.
In 2015, Scholz and a team of colleagues imaged geologic structures and recorded earthquakes beneath Lake Malawi. They did this using a supply of “air guns,” generating soundwaves that were recorded by pressure sensors within a 5,000-foot-long cable towed behind their converted research vessel. (The erstwhile container ship boasted a lab, generators, compressors and heavy equipment for towing the seismic source.) Data collected by the cable’s sensors were compared to that collected by dozens of seismometers onshore and on the bottom of the lake.
The team returned to Syracuse with loads of geophysical, geological and geochemical data. Little did they know how much of it was truly groundbreaking. McCartney, in fact, based her doctoral dissertation on it. “The data are helping us answer key questions about the origin and role of magma during early rifting, the formation and evolution of rift segmentation and its manifestation in the crust and upper mantle,” she says.
Much of the team’s work has focused on understanding the shapes and the extent of the rift-forming faults, which produce topographic depressions called half-grabens. When the Earth’s crust pulls apart, the lithosphere extends—in the case of Lake Malawi, less than an inch per year—and creates a rift. “We now have conclusive evidence of fault migration away from the border fault of the half-graben,” McCartney adds. “We also know that faults in the hangingwall [the section of the rift under the lake, itself], have lengthened over the past million years.”
Scholz hopes the findings will provide a unified geologic framework for anyone exploring the EAR system, and will shed light on other continental rift systems—even ancient ones, such as rift basins along the eastern coast of North America.
The Malawi government is interested in the rift’s potential for commercial quantities of oil and natural gas.
“The presence of working hydrocarbon systems in young rift-lake basins—those a few million years in age—has spurred extensive exploration interest in the Great Rift Valley,” Scholz says. “The scientific discoveries emerging from the NSF study are purely academic in nature, but governments in the region are using the findings to help identify energy resources for some of the world’s poorest people.”
Many researchers consider the EAR—and, by extension, Lake Malawi—one of the best-expressed examples of a continent in the early stages of break-up. “East Africa always has been a hotbed of evolution,” Scholz concludes. “Plate tectonics and climate variability have not only transformed its landscape, but also dictated our ancestors’ development and dispersal from Africa to the rest of the world. We’re witnessing evolution, in every respect of the word.”
Reference:
Tannis McCartney et al. A 1.3 million year record of synchronous faulting in the hangingwall and border fault of a half-graben in the Malawi (Nyasa) Rift, Journal of Structural Geology (2016). DOI: 10.1016/j.jsg.2016.08.012
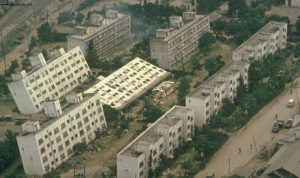
Representative Image: Some effects of liquefaction after the 1964 Niigata earthquake
Several strong earthquakes around the world have resulted in a phenomenon called soil liquefaction, the seismic generation of excess porewater pressures and softening of granular soils, often to the point that they may not be able to support the foundations of buildings and other infrastructure. The November 2016 earthquake in New Zealand, for example, resulted in liquefaction that caused serious damage to the Port of Wellington, which contributes approximately $1.75 billion to the country’s annual GDP. An estimated 40 percent of the U.S. is subject to ground motions severe enough to cause liquefaction and associated damage to infrastructure.
Effectively engineering infrastructure to protect life and to mitigate the economic, environmental, and social impacts of liquefaction requires the ability to accurately assess the likelihood of liquefaction and its consequences. A new report by the National Academies of Sciences, Engineering, and Medicine evaluates existing field, laboratory, physical model, and analytical methods for assessing liquefaction and its consequences, and recommends how to account for and reduce the uncertainties associated with the use of these methods.
When liquefaction occurs, wet granular materials such as sands and some silts and gravels can behave in a manner similar to a liquid. The most commonly used approaches to estimate the likelihood of liquefaction are empirical case-history-based methods initially developed more than 45 years ago. Since then, variations to these methods have been suggested based not only on case historical data but also informed by laboratory and physical model tests and numerical analyses. Many of the variations are in use, but there is no consensus regarding their accuracy. As a result, infrastructure design often incurs additional costs to provide the desired confidence that the effects of liquefaction are properly mitigated.
The report evaluates existing methods for assessing the potential consequences of liquefaction, which are not as mature as those for assessing the likelihood of liquefaction occurring. Improved understanding of the consequences of liquefaction will become more important as earthquake engineering moves more toward performance-based design.
“The engineering community wrestles with the differences among the various approaches used to predict what triggers liquefaction and to forecast its consequences,” said Edward Kavazanjian, Ira A. Fulton Professor of Geotechnical Engineering and Regents’ Professor at Arizona State University and chair of the committee that conducted the study and wrote the report. “It’s important for the geotechnical earthquake engineering community to consider new, more robust methods to assess the potential impacts of liquefaction.”
The committee called for greater use of principles of geology, seismology, and soil mechanics to improve the geotechnical understanding of case histories, project sites, and the likelihood and consequences of liquefaction. The committee also emphasized the need for explicit consideration of the uncertainties associated with data used in assessments as well as the uncertainties in the assessment procedures.
The report recommends establishing standardized and publicly accessible databases of liquefaction case histories that could be used to develop and validate methods for assessing liquefaction and its consequences. Further, the committee suggested establishing observatories for gathering data before, during, and after an earthquake at sites with a high likelihood of liquefaction. This would allow better understanding of the processes of liquefaction and the characteristics and behavior of the soils that liquefied. Data from these sites could be used to develop and validate assessment procedures.
The raggedness of the ocean floors could be the key to triggering some of the Earth’s most powerful earthquakes, scientists from Cardiff University have discovered.
In a new study published today in Nature Geoscience the team, also from Utrecht University, suggest that large bumps and mounds on the sea floor could be the trigger point that causes the crust in the Earth’s oceans to drastically slip beneath the crust on the continent and generate a giant earthquake.
By studying exposed rocks from a 180-million-year-old extinct fault zone in New Zealand, the researchers have shown, for the first time, that the extremely thick oceanic and continental tectonic plates can slide against each other without causing much bother, but when irregularities on the sea floor are introduced, it can cause a sudden slip of the tectonic plate and trigger a giant earthquake.
The researchers believe that this information, along with detailed subsurface maps of the ocean floor, could help to develop accurate models to forecast where large earthquakes are likely to occur along subduction zones, and therefore help to prepare for disasters.
For generations scientists have known that the largest earthquakes, known as megathrust earthquakes, are triggered at subduction zones where a single tectonic plate is pulled underneath another one. It is also in these regions that volcanoes form, as is most common in the so-called ‘Ring of Fire’ in the Pacific Ocean – the most seismically active region in the world.
The most recent megathrust earthquake occurred in Tohoku, Japan in 2011. The magnitude 9 earthquake triggered a 40 metre-high tsunami and claimed over 15,000 lives with economic costs estimated at US$235 billion.
However, there are many regions across the world, including in the ‘Ring of Fire’, where scientists would expect megathrust earthquakes to occur, but they don’t.
The new research appears to have solved this conundrum and therefore propose an explanation as to what triggers giant earthquakes. The team arrived at their conclusions by examining rocks that, through erosion and tectonic uplift, have been carried to the Earth’s surface from depths of 15-20km in an extinct fault zone in New Zealand that was once active around 180 million years ago.
The team found that the rocks in the fault zone can be tens to hundreds of metres thick and can act as a sponge to soak up the pressure that builds as two tectonic plates slip past each other.
This means that movement between two plates can commonly occur with no consequences, and that it takes a sudden change in the conditions, such as a lump or mound on the sea floor, to trigger an earthquake.
“By exhuming rocks from this depth, we’ve been able to gain an unprecedented insight into what a fault zone actually looks like,” said Dr Ake Fagereng, lead author of the study from Cardiff University’s School of Earth and Ocean sciences.
“With an active fault in the ocean, we can only drill to a depth of 6km, so our approach has given us some really valuable information.”
“We’ve shown that the fault zone along plate boundaries may be thicker than we originally thought, which can accommodate the stress caused by the creeping plates. However, when you have an irregularity on the sea floor, such as large bumps or mounds, this can cause the plate boundaries to slip tens of metres and trigger a giant earthquake.”
The tremendous wildlife biodiversity on the Galapagos Islands is due in part to the geology of part of the archipelago, says a new study involving the University of Colorado Boulder. Credit: University of Colorado
The Galápagos Islands are home to a tremendous diversity of plants and animals found nowhere else in the world. But why this is, and when it all began, remains something of an open question.
Now scientists may have at least one more piece of the puzzle. According to a new study out today in Earth and Planetary Science Letters, the geologic formation of one particular part of the archipelago — the part responsible for the huge biodiversity — formed, approximately 1.6 million years ago.
The lead author of the study is CIRES Fellow Kris Karnauskas, who you might say has a thing for these islands. He’s studied them extensively, authoring six peer-reviewed scientific papers with “Galápagos” in the title. But one question in particular kept nagging at him: When did the Galápagos become the Galápagos?
“I asked around and couldn’t get a straightforward answer,” says Karnauskas, who’s also an Assistant Professor in the Department of Atmospheric and Oceanic Sciences at the University of Colorado Boulder. “My geology friends said anywhere between half a million to twenty million years ago, depending on what feature we’re talking about.”
The age of one particular island, or even the whole chain, wasn’t quite what Karnauskas was looking for. “I wasn’t really interested in when the very first island breached the surface, but when this ecosystem developed,” he says. He wanted to put a finger on the geologic event or moment that turned the Galápagos from just another set of ordinary oceanic islands into one of the most biologically diverse spots in the world. “That’s not the customary way to ask questions in geology, nor does it lend itself to the usual toolbox.”
To start with the basics, the Galápagos sit on the Nazca tectonic plate, off the coast of South America. The plate is slowly moving from west to east (about 4 cm each year), and happens to be traveling over a hotspot, a point at which magma from Earth’s core makes it all the way through the crust, forming volcanic islands. The oldest of the Galápagos islands, now eroded and no longer above water, is millions of years old; the youngest island, farther west, currently sits on top of the hotspot.
Karnauskas and his colleagues hypothesized that the critical event that caused a biological explosion in the Galápagos came about when the Equatorial Undercurrent (EUC) began colliding with the archipelago. The EUC is a current that, because of the laws of physics — the shape of Earth and the way it spins — is virtually stuck to the equator. But what happens when something gets in the way?
“That’s what occurred with the Galápagos,” says Karnauskas. At some point, a large enough island (or possibly a cluster of them) rose high enough from the seafloor to block the current. Today, it’s the island of Isabela that serves that role. “It’s a pure accident of geography that Isla Isabela is so large and stands right on the equator, right where the EUC is trying to pass through. This is enough to drive cold, nutrient-rich water up to the surface where it can fuel marine productivity. We can easily see it today from space; the water is very cold and productive just west of the Galápagos along the shores of Isabela. It’s no surprise that you’ll find all the penguins jumping in the water there.”
Finding out exactly when the Galápagos blocked the EUC required help from some the paleoceanography community. Karnauskas and his colleagues used previously collected data from sediment cores — deep samples of the sea floor — that had been pulled up from sample sites near the Galápagos Islands and South America. The data files, which are hosted by NOAA Boulder’s National Centers for Environmental Information, provided information on changes in sea surface temperatures over millions of years.
Low and behold, approximately 1.6 million years ago, they saw shifts in the chemical composition of the fossil bugs in the sediment suggesting a significant change in those temperatures. Cold water that had once been upwelling off the coast of South America was suddenly upwelling along the western shores of the Galápagos instead. That sounded familiar to Karnauskas and coauthors; they knew from their own model experiments conducted over the past decade that this was the fingerprint of the Galápagos blocking the EUC. Coauthor Eric Mittelstaedt, Assistant Professor of Geological Sciences at the University of Idaho, then developed a new computer model of the archipelago’s geologic evolution; by combining that model with Karnauskas’ ocean circulation model, the team was able to independently corroborate the timing.
At that moment in time (geologically speaking, of course), the Galápagos ecosystem was forever changed. Since the EUC could no longer keep going straight toward the mainland, some of it rushed upward, carrying with it those cold, nutrient-rich waters to the surface, and creating conditions in which the fish, plants and penguins that now call the island chain home could thrive.
“Typically, we use known geologic constraints to help explain past changes in the environment such as ocean circulation,” says Karnauskas. “In this case, we flipped the problem on it’s head, combined models that aren’t normally combined, and discovered a new constraint for piecing together the bigger picture of the evolution of, and on, the islands over time. It contributes a unique data point not only for geology but also for ecology and biogeography — where and when life is distributed.”
Reference:
Kristopher B. Karnauskas, Eric Mittelstaedt, Raghu Murtugudde. Paleoceanography of the eastern equatorial Pacific over the past 4 million years and the geologic origins of modern Galápagos upwelling. Earth and Planetary Science Letters, 2017; 460: 22 DOI: 10.1016/j.epsl.2016.12.005
A happy looking Camarasaurus. Credit: Button et al., 2016
Sauropod dinosaurs are the biggest of all the wonderful behemoths to have ever roamed the Earth. Standing on four solid tree trunk legs, these giants are emblazoned in our hearts, minds and history books as towering Mesozoic monoliths, with long swooping necks, whiplash tails, fermentation-factory torsos, and weirdly tiny heads totally at odds with their immense bulk.
Many of these strange features sauropods possessed are underpinned by one key and unique aspect of sauropod life: how the hell did they eat enough to sustain such a massive body size? This question has had palaeontologists pondering for decades now, and is part of an ongoing puzzle that seeks to reveal how sauropods became some of the most diverse and abundant dinosaurs in spite of their sheer enormity.
Feeding is one of the most important ecological aspects to study for animals, as it influences their life style, metabolism, habitat, and general life strategy. Figuring this out for sauropods then is pretty important as it can tell us about how feeding links to evolutionary constraints on gigantic body sizes in land-dwelling animals.
Thankfully, computer-assisted engineering studies of biological organisms has really taken off in the last few years, especially in dinosaur studies. The field, generally known as biomechanics, applies our knowledge of materials and their physical properties to ask questions about how animals behaved in different ways, such as how fast they could run, or what bite forces they could achieve.
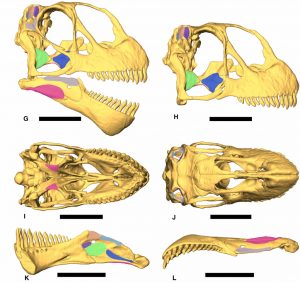
A team of researchers from the UK led by Dr. David Button decided to apply biomechanical methods to investigate the evolution of herbivory in sauropods and their ancestors, together called sauropodomorphs (palaeontologists win full points for originality..). To do this, they created 3-D computer models of the skulls two iconic dinosaurs, Plateosaurus from Europe, and Camarasaurus from North America. Sauropodomorph skulls are unusual in that despite being so small compared to their gargantuan bodies, they were highly specialised and effective cropping machines. But how this varied between different species is still relatively poorly understood.
What the team found then is that Camarasaurus had a much stronger bite force than the geologically older Plateosaurus. This was due to the former having greater chomping musculature – the adductor muscles – and also due to shape changes in the lower jaw, or mandible. By changing the jaw shape in particular ways, it is possible to increase bite efficiency by increasing the amount of muscle force that gets converted into bite force.
Woah, wait one second. Muscles? That’s crazy! We don’t have fossilised dinosaur muscles. Well, you’re right, we don’t (yet). But we do have skulls, and by comparing dinosaurs with other modern reptiles such as crocodiles and birds, we can actually be pretty confident about what the reconstructed skull muscles of dinosaurs looked like. By looking at both the reconstructed skull muscles and bones, Button and colleagues were able to gain a much more accurate mechanical picture of how sauropodomorph skulls function, as opposed to just using the skulls alone like the vast majority of previous studies.
This increase in bite force which they found on an evolutionary time scale is mirrored in the acquisition of additional key features that would have been critical in the ability of sauropods to bulk feed. For example, their tooth crowns became wider and were able to slide past, or occlude with, each other, making them much more efficient at cropping and slicing tough, fibrous plant matter.
In Plateosaurus, the jaw mechanics are quite different. The ability to distribute forces through the chewing gear and the structural strength appear to be much lesser in favour of being able to chew faster by opening and closing the jaws. This is due to features such as a relatively longer tooth row in Plateosaurus, which changes how the jaw operates as a mechanical ‘lever’.
Button and colleagues suggest that this could be due to Plateosaurus being at least partly omnivorous, as many other early sauropodomorphs might have been. This is because jaw closure speed isn’t exactly important when your sole ‘prey’ are, well, leaves, but is when your prey can try to run or wriggle away from you. In fact, Plateosaurus even has different types of teeth in the same individuals, a feature called ‘heterodonty’, that indicates the animals fed on different types of material, perhaps even small animals.
The shift from this structurally weaker skull in Plateosaurus to one in Camarasaurus that can accommodate increasing food-related forces would undoubtedly have been significant in sauropods’ increasing ability to bulk feed, and ultimately their enormous size as part of an ‘evolutionary cascade’.
Reference:
David J. Button et al. Comparative cranial myology and biomechanics ofandand evolution of the sauropod feeding apparatus, Palaeontology (2016). DOI: 10.1111/pala.12266
Researchers led by The University of Manchester have developed a model that will help civil defence agencies better judge the impact of future volcanic eruptions — including those that threaten the UK population.
Mike Burton, Professor of Volcanology at Manchester’s School of Earth and Environmental Science, has led a team of experts that has analysed the legacy of a powerful volcanic eruption to gain clues on how new eruptions would behave.
This pioneering analysis will help inform agencies and policy-makers on how to better plan and prepare for any potential volcanic crisis.
The research team was made up of experts from Manchester and INGV Pisa, Italy, supported by funding from the Natural Environment Research Council (NERC) and the European Research Council (ERC).
Their work has been reported in a paper entitled the ‘Role of syn-eruptive plagioclase disequilibrium crystallization in basaltic magma ascent dynamics’ published by the journal Nature Communications.
“This Manchester-led study examined the behaviour of basalt magmas so we can better forecast the impact of future volcanic eruptions,” explained Professor Burton.
“For example, Icelandic eruptions are on an official risk register as posing a potential threat to UK population through gas and aerosol inhalation. Studying how these magmas erupts will put us in a better position to judge impacts and will help policy-makers during crises.”
Professor Burton’s team based their research on the study of the 2001 eruption of Mount Etna in Italy, one of the most active volcanoes in the world.
Professor Burton added: “During a volcanic eruption magma ascends so quickly that crystals which are trying to form don’t have time to do so.
“In our work we use a combination of modelling and observations of the 2001 eruption of Mount Etna to calculate the growth rate of crystals during ascent, a key parameter in modelling future eruptions.”
This modelling work can be applied to other volcanic areas, including those in Iceland which are recognised as posing a direct threat to the UK.
This research was supported by the NERC-funded Quantifying disequilibrium processes in basaltic volcanism (DisEqm) project, a collaborative project between the universities of Manchester, Bristol, Durham and Cambridge, and the ERC-funded project “Quantifying the global volcanic CO2 cycle” (CO2Volc), both led by Professor Burton.
Reference:
G. La Spina, M. Burton, M. de’ Michieli Vitturi, F. Arzilli. Role of syn-eruptive plagioclase disequilibrium crystallization in basaltic magma ascent dynamics. Nature Communications, 2016; 7: 13402 DOI: 10.1038/ncomms13402
Surface burning of oil slicks during the Deepwater Horizon event. Credit: David Valentine
The oil discharged into the Gulf of Mexico following the explosion and sinking of the Deepwater Horizon (DWH) rig in 2010 contaminated more than 1,000 square miles of seafloor. The complexity of the event has made it difficult for scientists to determine the long-term fate of oil in this ocean environment.
But researchers from UC Santa Barbara, with colleagues from three other institutions, are making progress.
The scientists have now analyzed long-awaited data from the Natural Resource Damage Assessment to determine the specific rates of biodegradation for 125 major petroleum hydrocarbons — compounds from the oil that settled to the deep ocean floor when DWH’s Macondo well discharged 160 million gallons. Through that analysis, the team found that a number of factors influence how long the impact of such an oil spill lasts. Their results appear in the Proceedings of the National Academy of Sciences.
“Now, we can finally take all of this environmental data and begin to predict how long 125 major components of the DWH oil on the deep ocean floor will be there,” said co-author David Valentine, a professor in UCSB’s Department of Earth Science. “The way in which we’ve analyzed all of these different compounds helps answer questions everybody asked right after the 2010 blowout. Yes, we know where a lot of this oil went, and yes, we know what’s happening to it. It is slowly being biodegraded, but each compound is acting a bit differently.”
Lead author Sarah Bagby, who conducted the research as a postdoctoral scientist in the Valentine Lab at UCSB, combed through the massive data set to build a chemical fingerprint of Macondo oil based on its biomarker compounds. She identified the subset of samples that matched that fingerprint and developed a rigorous statistical framework to analyze each of the 125 individual hydrocarbons studied.
“You can make some predictions based on the chemistry,” Bagby said. “The smaller, simpler compounds are going to go away faster. The bigger ones are going to take longer if they go away at all. But superimposed on that are a couple of other trends. The clearest one is that the more heavily contaminated a sample is, the less loss of oil there is. The more lightly contaminated it is, the faster the stuff goes away. That means that the physical context — on a scale of microns to millimeters — makes a huge difference in long-term environmental fate. It’s very striking to me that such a small difference can have such a substantial environmental impact.”
To account for physical context, samples were classed as lightly, moderately or heavily contaminated, and the loss of each compound was examined for each of those conditions. For many of the compounds, there was a distinct signal that strongly suggested degradation had been much faster while the oil was still suspended in the water column and had slowed down considerably after deposition to the seafloor.
“The data indicates big particles of hydrocarbon that came down to the seafloor are not going away as quickly as smaller ones, which has a variety of implications,” Valentine explained. “This hadn’t previously been observed at this spatial scale or in this sort of environment, so this work is important in understanding the fate of oil that reaches the seafloor.”
In addition to charting the trend of oil biodegradation from DWH, the research also bears on the impact of chemical dispersant applied at the ruptured well to facilitate suspension of the oil in the deep ocean waters.
“Our evidence is circumstantial but points to rapid biodegradation of suspended oil,” Valentine said. “Since dispersant promotes and prolongs the suspension of oil, it is likely that the decision to apply dispersant ultimately boosted biodegradation.”
However, the researchers caution that prolonged suspension of droplets that allows for biodegradation should be balanced against the potential for increased exposure.
Reference:
David L. Valentine et al. Persistence and biodegradation of oil at the ocean floor following Deepwater Horizon. PNAS, December 2016 DOI: 10.1073/pnas.1610110114