Home Blog Page 147

The Deepwater Horizon aftermath

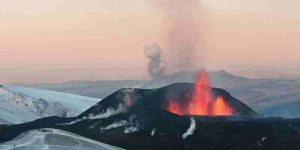
Surface burning of oil slicks during the Deepwater Horizon event. Credit: David Valentine

The oil discharged into the Gulf of Mexico following the explosion and sinking of the Deepwater Horizon (DWH) rig in 2010 contaminated more than 1,000 square miles of seafloor. The complexity of the event has made it difficult for scientists to determine the long-term fate of oil in this ocean environment.

But researchers from UC Santa Barbara, with colleagues from three other institutions, are making progress.

The scientists have now analyzed long-awaited data from the Natural Resource Damage Assessment to determine the specific rates of biodegradation for 125 major petroleum hydrocarbons — compounds from the oil that settled to the deep ocean floor when DWH’s Macondo well discharged 160 million gallons. Through that analysis, the team found that a number of factors influence how long the impact of such an oil spill lasts. Their results appear in the Proceedings of the National Academy of Sciences.

“Now, we can finally take all of this environmental data and begin to predict how long 125 major components of the DWH oil on the deep ocean floor will be there,” said co-author David Valentine, a professor in UCSB’s Department of Earth Science. “The way in which we’ve analyzed all of these different compounds helps answer questions everybody asked right after the 2010 blowout. Yes, we know where a lot of this oil went, and yes, we know what’s happening to it. It is slowly being biodegraded, but each compound is acting a bit differently.”

Lead author Sarah Bagby, who conducted the research as a postdoctoral scientist in the Valentine Lab at UCSB, combed through the massive data set to build a chemical fingerprint of Macondo oil based on its biomarker compounds. She identified the subset of samples that matched that fingerprint and developed a rigorous statistical framework to analyze each of the 125 individual hydrocarbons studied.

“You can make some predictions based on the chemistry,” Bagby said. “The smaller, simpler compounds are going to go away faster. The bigger ones are going to take longer if they go away at all. But superimposed on that are a couple of other trends. The clearest one is that the more heavily contaminated a sample is, the less loss of oil there is. The more lightly contaminated it is, the faster the stuff goes away. That means that the physical context — on a scale of microns to millimeters — makes a huge difference in long-term environmental fate. It’s very striking to me that such a small difference can have such a substantial environmental impact.”

To account for physical context, samples were classed as lightly, moderately or heavily contaminated, and the loss of each compound was examined for each of those conditions. For many of the compounds, there was a distinct signal that strongly suggested degradation had been much faster while the oil was still suspended in the water column and had slowed down considerably after deposition to the seafloor.

“The data indicates big particles of hydrocarbon that came down to the seafloor are not going away as quickly as smaller ones, which has a variety of implications,” Valentine explained. “This hadn’t previously been observed at this spatial scale or in this sort of environment, so this work is important in understanding the fate of oil that reaches the seafloor.”

In addition to charting the trend of oil biodegradation from DWH, the research also bears on the impact of chemical dispersant applied at the ruptured well to facilitate suspension of the oil in the deep ocean waters.

“Our evidence is circumstantial but points to rapid biodegradation of suspended oil,” Valentine said. “Since dispersant promotes and prolongs the suspension of oil, it is likely that the decision to apply dispersant ultimately boosted biodegradation.”

However, the researchers caution that prolonged suspension of droplets that allows for biodegradation should be balanced against the potential for increased exposure.

Reference:
David L. Valentine et al. Persistence and biodegradation of oil at the ocean floor following Deepwater Horizon. PNAS, December 2016 DOI: 10.1073/pnas.1610110114

Note: The above post is reprinted from materials provided by University of California – Santa Barbara.

Studies refute hypothesis on what caused abrupt climate change thousands of years ago

Representative Image

Two new studies in the Journal of Quaternary Science refute the hypothesis that one or more comets/bolides struck North America approximately 12,900 years ago triggering rapid climate change and the start of the Younger Dryas period.

Prior to the Younger Dryas, the climate had gradually warmed from glacial conditions to near modern temperatures, and the massive ice sheets in North America were in full retreat; however, approximately 12,900 years ago, temperatures rapidly plummeted and returned to glacial conditions for about a 1200 year long period. Also about this time, the mammoths and mastodons became extinct in North America.

The two papers challenge two lines of evidence reported and used by others to support the impact theory. One is the report of elevated concentrations of nanometer-sized diamonds in sediments deposited at the onset of the Younger Dryas. It is claimed that these diamonds were formed during an impact. The other is the interpretation that paleofire evidence at a key archaeological site demonstrates massive wildfires at the beginning of the Younger Dryas. It is claimed that the impact caused wildfires that spanned the continent.

Each paper shows that the evidence and interpretations supporting these two lines of arguments do not stack up. “Impact proponents report the rare form of diamond, lonsdaleite, that is usually associated with shock processing; however, we show that they misidentified polycrystalline aggregates of graphene and graphane as lonsdaleite,” said Dr. Tyrone Daulton, lead author of one of the papers. “Further, we show that the nanodiamond concentration measurements reported by impact proponents are critically flawed. There is no evidence for a spike in the nanodiamond concentration at the onset of the Younger Dryas to suggest that an impact event occurred.”

Prof. Andrew Scott, lead author of the second paper said, “The idea of a Younger Dryas impact was an interesting one that has drawn much attention; however, increasingly methodological research over the past few years has failed to corroborate that story. Our research has shown that many of the markers for such an event have been misinterpreted or misidentified.”

References:

  1. Tyrone L. Daulton, Sachiko Amari, Andrew C. Scott, Mark Hardiman, Nicholas Pinter, R. Scott Anderson. Comprehensive analysis of nanodiamond evidence relating to the Younger Dryas Impact Hypothesis. Journal of Quaternary Science, 2016; DOI: 10.1002/jqs.2892
  2. Andrew C. Scott, Mark Hardiman, Nicholas Pinter, R. Scott Anderson, Tyrone L. Daulton, Ana Ejarque, Paul Finch, Alice Carter-champion. Interpreting palaeofire evidence from fluvial sediments: a case study from Santa Rosa Island, California, with implications for the Younger Dryas Impact Hypothesis. Journal of Quaternary Science, 2016; DOI: 10.1002/jqs.2914

Note: The above post is reprinted from materials provided by Wiley.

The case of the missing diamonds

Artist’s conception of comet approaching Earth-like planet. The explosion of a comet near our planet’s surface, it was proposed, might have lofted enough dust and debris into Earth’s atmosphere to temporarily dim the sun. Credit: Shutterstock

It all began innocently enough. Tyrone Daulton, a physicist with the Institute for Materials Science and Engineering at Washington University in St. Louis, was studying stardust, tiny specks of heat-resistant minerals thought to have condensed from the gases exhaled by dying stars. Among the minerals that make up stardust are tiny diamonds.

In 2007, Richard Kerr, a writer for the journal Science, knowing Daulton’s expertise, called to ask whether nanodiamonds found in sediments could be evidence of an ancient impact.

Daulton said it was possible the heat and pressure of such a cataclysm could convert carbon in Earth’s crust to diamond, but asked to see the paper, which had been published in Science.

The Science paper argued that a shower of exploding comet fragments over the North American ice sheet had triggered a sudden climate reversal called the Younger Dryas. Having read the paper, Daulton told the reporter, “It looks interesting, [but] there’s not enough information in this paper to say whether they found diamonds.”

Since then, Daulton has periodically been asked to evaluate Younger Dryas sediments for nanodiamonds. In the issue of the Journal of Quaternary Science released online Dec.19, he reviews the accumulated evidence and reports on his own analysis of new samples from California and Belgium.

For the second time in 10 years, Daulton has carefully reviewed the evidence, and found no evidence for a spike in nanodiamond concentration in Younger Dryas sediments. Since nanodiamonds are the strongest piece of evidence for the impact hypothesis, their absence effectively discredits it.

And so a great idea apparently has been brought low by the humblest of evidence.

What went wrong?

Nanodiamonds, it bears emphasizing, are tiny—smaller than bacteria. Impact supporters often claim to find them inside small spheres of carbon, and those spheres are about the size of the period at the end of this sentence.

Even so, how is it possible for some scientists to find diamonds in samples and others to find none? One answer is that carbon atoms can arrange themselves in many different configurations. These arrangements, which make the difference between pencil lead and diamond, can be confused with one another.

Impact supporters often claim to have found lonsdaleite, a rare form of diamond that has a hexagonal rather than the common, cubic atomic structure. “Lonsdaleite is usually reported in the literature associated with impact sites or in meteorites that were shock processed,” Daulton said. “It can also be formed by detonation in the laboratory, so the presence of lonsdaleite to me would be a strong suggestion of an impact.”

But when he examined Younger Dryas samples reported to contain lonsdaleite, Daulton couldn’t find it. Instead, he found aggregates of single-atom-thick sheets of carbon atoms (graphene) and sheets of carbon atoms with attached hydrogen atoms (graphane) that looked “very, very similar to lonsdaleite.” So the claim of lonsdaleite was based on a misidentification: Daulton published this result in 2010.

End of story? Not so fast.

In 2014, a group of researchers reported that they had found a nanodiamond-rich sediment layer that spanned three continents. While claiming to find cubic and hexagonal diamond, they also claimed to find much more abundant n-diamond, a controversial form of diamond characterized by electron diffraction patterns similar to diamond, but with extra “forbidden” reflections that diamond does not exhibit.

Pulled back into the controversy, Daulton again found no diamond or n-diamond in the samples from the Younger Dryas horizon. What he found instead was nanocrystalline copper, which produces diffraction patterns just like the controversial n-diamond.

Daulton also attempted to reproduce the analyses that found a spike in the concentration of nanodiamonds at the Younger Dryas but found flaws in the methodology that invalidated the result.

Paradoxically it was Daulton’s experience finding nanodiamonds in stardust that prepared him not to find them in sediments.

Note: The above post is reprinted from materials provided by Washington University in St. Louis.

Satellites help discover a jet stream in the Earth’s core

Swarm’s three satellites provide a high-resolution picture of the Earth’s magnetic field Credit: European Space Agency.
Credit: Image courtesy of University of Leeds

A jet stream within the Earth’s molten iron core has been discovered by scientists using the latest satellite data that helps create an ‘x-ray’ view of the planet.

Lead researcher Dr Phil Livermore, from the University of Leeds, said: “The European Space Agency’s Swarm satellites are providing our sharpest x-ray image yet of the core. We’ve not only seen this jet stream clearly for the first time, but we understand why it’s there.”

“We can explain it as an accelerating band of molten iron circling the North Pole, like the jet stream in the atmosphere,” said Dr Livermore, from the School of Earth and Environment at Leeds.

Because of the core’s remote location under 3,000 kilometres of rock, for many years scientists have studied the Earth’s core by measuring the planet’s magnetic field — one of the few options available.

Previous research had found that changes in the magnetic field indicated that iron in the outer core was moving faster in the northern hemisphere, mostly under Alaska and Siberia.

But new data from the Swarm satellites has revealed these changes are actually caused by a jet stream moving at more than 40 kilometres per year.

This is three times faster than typical outer core speeds and hundreds of thousands of times faster than the speed at which the Earth’s tectonic plates move.

The European Space Agency’s Swarm mission features a trio of satellites which simultaneously measure and untangle the different magnetic signals which stem from Earth’s core, mantle, crust, oceans, ionosphere and magnetosphere. They have provided the clearest information yet about the magnetic field created in the core.

The study, published today in Nature Geoscience, found the position of the jet stream aligns with a boundary between two different regions in the core. The jet is likely to be caused by liquid in the core moving towards this boundary from both sides, which is squeezed out sideways.

Co-author Professor Rainer Hollerbach, from the School of Mathematics at Leeds, said: “Of course, you need a force to move the liquid towards the boundary. This could be provided by buoyancy, or perhaps more likely from changes in the magnetic field within the core.”

Rune Floberghagen, ESA’s Swarm mission manager, said: “Further surprises are likely. The magnetic field is forever changing, and this could even make the jet stream switch direction.

“This feature is one of the first deep-Earth discoveries made possible by Swarm. With the unprecedented resolution now possible, it’s a very exciting time — we simply don’t know what we’ll discover next about our planet.”

Co-author Dr Chris Finlay, from the Technical University of Denmark said: “We know more about the Sun than the Earth’s core. The discovery of this jet is an exciting step in learning more about our planet’s inner workings.”

Reference:
Philip W. Livermore, Rainer Hollerbach, Christopher C. Finlay. An accelerating high-latitude jet in Earth’s core. Nature Geoscience, 2016; DOI: 10.1038/ngeo2859

Note: The above post is reprinted from materials provided by University of Leeds.

New prehistoric bird species discovered

This is an artist’s rendering of Tingmiatornis arctica, the new prehistoric bird species discovered by scientists at the University of Rochester.
Credit: Artist rendering by Michael Osadciw/University of Rochester

A team of geologists at the University of Rochester has discovered a new species of bird in the Canadian Arctic. At approximately 90 million years old, the bird fossils are among the oldest avian records found in the northernmost latitude, and offer further evidence of an intense warming event during the late Cretaceous period.

“The bird would have been a cross between a large seagull and a diving bird like a cormorant, but likely had teeth,” says John Tarduno, professor and chair of the Department of Earth and Environmental Sciences at the University and leader of the expedition.

Tarduno and his team, which included both undergraduate and graduate students, named the bird Tingmiatornis arctica; “Tingmiat” means “those that fly” in the Inuktitut language spoken in the central and eastern Canadian Arctic (Nunavut territory).

Their findings, published in Scientific Reports, add to previous fossil records Tarduno uncovered from the same geological time period and location in previous expeditions. Taken together, these fossils paint a clearer picture of an ecosystem that would have existed in the Canadian Arctic during the Cretaceous period’s Turonian age, which lasted from approximately 93.9 to 89.8 million years ago.

“These fossils allow us to flesh out the community and add to our understanding of the community’s composition and how it differed from other places in the world,” says Donald Brinkman, vertebrate paleontologist and director of preservation and research at the Royal Tyrrell Museum in Alberta, Canada.

Building historic climate records further helps scientists determine the effects of climate on various communities, ecosystems, and the distribution of species and could help predict the effects of future climatic events.

“Before our fossil, people were suggesting that it was warm, but you still would have had seasonal ice,” Tarduno says. “We’re suggesting that’s not even the case, and that it’s one of these hyper-warm intervals because the bird’s food sources and the whole part of the ecosystem could not have survived in ice.”

From the fossil and sediment records, Tarduno and his team were able to conjecture that the bird’s environment in the Canadian Arctic during the Turonian age would have been characterized by volcanic activity, a calm freshwater bay, temperatures comparable to those in northern Florida today, and creatures such as turtles, large freshwater fish, and champsosaurs — now-extinct, crocodile-like reptiles.

“The fossils tell us what that world could look like, a world without ice at the arctic,” says Richard Bono, a PhD candidate in earth and environmental sciences at the University and a member of Tarduno’s expedition. “It would have looked very different than today where you have tundra and fewer animals.”

The Tingmiatornis arctica fossils were found above basalt lava fields, created from a series of volcanic eruptions. Scientists believe volcanoes pumped carbon dioxide into Earth’s atmosphere, causing a greenhouse effect and a period of extraordinary polar heat. This created an ecosystem allowing large birds, including Tingmiatornis arctica, to thrive.

Tarduno’s team unearthed three bird bones: part of the ulna and portions of the humerus, which, in birds, are located in the wings. From the bone features, as well as its thickness and proportions, the team’s paleontologist, Julia Clarke of the University of Texas, was able to determine the evolutionary relationships of the new birds as well as characteristics that indicate whether it likely was able to fly or dive.

“These birds are comparatively close cousins of all living birds and they comprise some of the oldest records of fossil birds from North America,” Clarke says. “Details of the upper arm bones tell us about how features of the flightstroke seen in living species came to be.”

Previous fossil discoveries indicate the presence of carnivorous fish such as the 0.3-0.6 meter-long bowfin. Birds feeding on these fish would need to be larger-sized and have teeth, offering additional clues to Tingmiatornis arctica’s characteristics.

Physiological factors, such as a rapid growth and maturation rate, might explain how this line of bird was able to survive the Cretaceous-Paleogene mass extinction event that occurred approximately 66 million years ago and eliminated approximately three-quarters of the plant and animal species on Earth.

These physiological characteristics are still conjecture, Tarduno emphasizes, but he says the bird’s environment gives clear indications as to why the bird fossils were found in this location.

“It’s there because everything is right,” Tarduno says. “The food supply was there, there was a freshwater environment, and the climate became so warm that all of the background ecological factors were established to make it a great place.”

Reference:
Richard K. Bono, Julia Clarke, John A. Tarduno, Donald Brinkman. A Large Ornithurine Bird (Tingmiatornis arctica) from the Turonian High Arctic: Climatic and Evolutionary Implications. Scientific Reports, 2016; 6: 38876 DOI: 10.1038/srep38876

Note: The above post is reprinted from materials provided by University of Rochester.

Above and beyond megathrusts

LFE band is outlined in blue, while individual LFEs and active volcanoes are denoted by red dots and white triangles, respectively. Labels A-F mark locations of interest for LFE activity. Names of the regions discussed in the text are also shown. Broken lines denote depth contours of the upper surface of the Philippine Sea slab with an interval of 10 km.
Credit: Nature Communications

In the Nankai subduction zone, Japan, non-volcanic deep tremors occur down-dip of the megathrust seismogenic zone, and are observed to coincide temporally with short-term slow-slip events (SSEs). They occur within a limited depth range of 30-35 km over an along-strike length of ~700 km, associated with subduction of the Philippine Sea Plate.

As Low-Frequency Earthquakes (LFEs) coincide spatially with tremor activity, the locations of LFEs act as a proxy for tremor activity. There are two distinct gaps in LFE activity at the Kii Gap and Ise Gap, while there is limited or no LFE activity beneath Kanto and Kyushu at the extensions of the LFE activity zone. Junichi Nakajima from Tokyo Institute of Technology and Akira Hasegawa at Tohoku University examined the seismic properties of Nankai, including areas where LFEs are present and absent, in an effort to elucidate the factors controlling LFE generation.

The observed P-wave (dVp) and S-wave (dVs) velocities show the presence of low-velocity anomalies in the overlying plate at Kanto, Ise Gap, Kii Gap, and Kyushu, where there is limited or no LFE activity. LFEs do not occur on the megathrust where dVp and dVs are lower than approximately -4%, suggesting a systematic change in seismic velocities in the overlying plate between areas with and without LFE activity.

There is a spatial correlation between LFE locations and seismic velocity, attenuation, and anisotropy anomalies. One hypothesis that could explain the variation in seismic properties along the LFE band is along-strike variation in the degree of prograde metamorphism above the megathrust that is proportional to the rate of fluid leakage from the subducting slab into the overlying plate. Notably, large amounts of fluid are liberated from the subducting crust at depths of 30-60 km.

The along-strike variations in seismic properties suggest that the overlying plate is less metamorphosed in areas with LFE activity, and is significantly metamorphosed in areas of limited or no LFE activity. This anti-correlation between LFEs and metamorphism is probably caused by along-strike variation in hydrological conditions in the overlying plate.

An impermeable overlying plate restricts fluids to the megathrust, whereas fluids escape from the megathrust, if the overlying plate is permeable. Undrained conditions at the megathrust elevate pore-fluid pressures to near-lithostatic values, lower the shear strength of the megathrust sufficiently to facilitate LFEs, and result in a low degree of metamorphism in the overlying plate. In contrast, in areas of limited LFE activity, fluids migrate into and metamorphose the permeable overlying plate, reducing pore-fluid pressures at the megathrust, which is no longer weak enough to generate LFEs.

The large number of crustal earthquakes in the Kii Gap and Ise Gap suggests that LFE activity and seismicity in the overlying plate are anti-correlated, largely reflecting the magnitude of fluid flux from the megathrust. The scientists concluded that a well-drained megathrust allows fluids to migrate into the overlying plate, inhibiting LFE activity at the megathrust, but facilitating shallow seismicity due to the decreased shear strength of crustal faults.

Reference:
Junichi Nakajima, Akira Hasegawa. Tremor activity inhibited by well-drained conditions above a megathrust. Nature Communications, 2016; 7: 13863 DOI: 10.1038/NCOMMS13863

Note: The above post is reprinted from materials provided by Tokyo Institute of Technology.

Imaging the underground with help from the cosmos

This illustration shows how a series of five borehole muon detectors could be deployed in a horizontal well below a carbon dioxide reservoir.
Credit: PNNL

Muons, once used to explore the inside of pyramids and volcanoes alike, are enabling researchers to see deep underground with a technological breakthrough from PNNL.

Invisible to the naked eye, muons are elementary particles created by the collisions of cosmic rays with molecules in the atmosphere. Muons are constantly raining down on the earth at various angles. They can pass through materials, such as earth and rock, and detecting these particles have helped researchers “see” the inside of structures such as the pyramids of Giza. But the detectors — which measure the number and trajectories of muons hitting the detector — are rather large, about the size of a small car.

In order to be able to “see” changes in density underground, the detectors need to be much smaller. PNNL researchers and their partners have created a smaller — just six inches in diameter and about three feet long — and more rugged version. This mini detector will be able to go thousands of feet underground via horizontal boreholes.

The borehole-sized detectors are made out of plastic components and optical fibers that carry signals to electronics to count each muon that passes through the device. This summer, researchers tested its output against two existing large detectors in a tunnel at Los Alamos National Laboratory. The results were the same as the larger machines developed by LANL and Sandia National Laboratories. Like its big brothers, the small detector can measure anomalies in the flux of muons that pass through. A change in the number of muons hitting the detector during a certain period and space indicate a change in density within the structure or object — for instance a plume or reservoir of carbon dioxide underground.

The data convert to an image and both could help monitor CO2 movement or leakage underground at a sequestration site, and have applications for a wide variety of subsurface imaging.

Alain Bonneville, a geophysicist at Pacific Northwest National Laboratory, will present details on the muon detector and the comparative field tests at the American Geophysical Union Fall Meeting in San Francisco.

Note: The above post is reprinted from materials provided by Pacific Northwest National Laboratory.

Etna’s volcanic ashes and extreme cold boost life in the abyssal depths of the Mediterranean

Volcanic ashes from the Etna eruption and intense cold activated carbon export in the big marine depths of the Mediterranean.

Volcanic ashes from the Etna eruption (March, 2012) and the extreme cold from the previous winter, created an authentic shower of manna in the Ierapetra Basin (4.430 meters depth abyss) in one of the less productive marine environments of the Eastern Mediterranean Sea.

This is one of the main conclusions of the article published in the journal Geophysical Research Letters by the experts Rut Pedrosa-Pàmies, Anna Sanchez Vidal, Antoni Calafat and Miquel Canals, from the Research Group on Marine Geosciences (GRC), from the Faculty of Earth Sciences of the University of Barcelona, and a team from the Hellenic Centre for Marine Research (HCMR) in Crete (Greece).

Ierapetra Bassin, in the south-east of Crete and part of the Pliny-Strabo trench region is not the deepest place in the Mediterranean Sea -the Calypso Deep in the Ionic Sea covers 4.267 meters- but it is deeper than the ones in Western Europe (3.600 meters). The REDECO project, led by Nikolaos Lampadarious, from the Hellenic Centre for Marine Research, the team studied which processes enable the transport of organic matter and capture of atmospheric carbon in the abyssal depths of the Mediterranean Sea.

To carry this research out, the team of the GRC Marine Geosciences worked on a line set at 4.300 meters depth in Ierapetra -a technological and logistic challenge regarding the depth- with a sediment trap for particles and a current meter. From 2010 to 2013, they registered physical and biogeochemical conditions of Ierapetra Bassin. The study published in Geophysical Research Letters shows unpublished data about the origins, quantity and season variability and interannual flow of the organic matter in the Mediterranean Sea, between the surface and deep marine waters.

Volcanic ashes and extreme cold in the Mediterranean Sea

“The results show the oligotrophic character -low in nutrients- of Western Mediterranean. However, in March 2012, the mix of a cold winter with Etna’s volcanic activity in Sicily created a sudden and massive phyloplankton growth (mostly diatom particles), the largest one in the last decades,” says Professor Antoni Calafat, from the Department of Earth and Ocean Dynamics of the UB.

“This phenomenon -says Rut Pedrosa- created flows of organic matter higher than 12 milligrams per square meter and day. That is, a shower of manna two orders of higher magnitude than the usual flow in this marine environment which is extremely poor.”

Submarine cascades: when cold waters sink to depth water

In some parts of the Mediterranean Sea, surface water masses get cold in the winter, and sink and enable the arrival of organic matter to abyssal areas. During the 2012 winter, which was quite cold in the Mediterranean, there were cases of cascading in the Gulf of Lion and the Adriatic Sea, and convections in the open sea in the area of the Rhodes Gyre. In that area, this intense convection provoked the rise of cold waters rich in nutrients, boosting the phyloplanktonic growth -especially diatom particles. This exceptional blooming was probably strengthened by the arrival of nutrients coming from the movement of the volcanic ashes from Etna’s eruption in the spring of 2012. As a result, in April 2012 the organic carbon export increased up to fourteen times compared to April 2011 and 2012, which had a regular exportation in these marine areas.

According to Anna Sanchez-Vidal, “so far, nobody explained that the mix of convections due cold water surfaces and the arrival of nutrients due volcanic ashes is a factor that boosts the flow of organic matter in abyssal depths.”

Ocean machinery enabling particle transport to the basins is linked to blooms, which have an essential role in trophic chains of marine ecosystems. “If this process has a sinking of dense waters, which carry organic matter to big depths, efficacy increases. Volcanic ashes, which ballast organic particles and bring them to abyssal depths without affecting their nutrition values, can boost results even more” says Rut Pedrosa.

Nutrient and carbon traps in marine depths

Biodiversity can decrease with the depths of these marine areas. Interestingly, this tendency is different in the unknown abyssal basins, according to previous studies by the scientific team. The hypothesis of the study sees the abyssal trenches as traps for organic matter in ocean depths. Carbon, carried to extreme depths until being isolated from cycles of active exchange with the atmosphere, would remain in these big submarine depressions. Moreover, the arrival of labile matter to bathyal zones represents an important contribution to carbon’s remineralisation and oxygen reduction in deep waters.

This phenomenon described in the journal Geophysical Research Letters could happen in other abyssal trenches worldwide, in marine regions with seismic and volcanic activity, and processes of dense water formation. The process of cascading occurs in seas and oceans around the world, and it was described in submarine canyons in North-Western Mediterranean (Gulf of Lion, 2006) in an article of the journal Nature, whose main author was Professor Miquel Canals, Head of the GRC Marine Geosciences of the University of Barcelona.

Reference:
R. Pedrosa-Pàmies, A. Sanchez-Vidal, M. Canals, N. Lampadariou, D. Velaoras, A. Gogou, C. Parinos, A. Calafat. Enhanced carbon export to the abyssal depths driven by atmosphere dynamics. Geophysical Research Letters, 2016; 43 (16): 8626 DOI: 10.1002/2016GL069781

Note: The above post is reprinted from materials provided by Universidad de Barcelona.

Creating earthquake heat maps

Heather Savage’s team sampled all along the Muddy Mountain thrust in Nevada and made some surprising discoveries. Credit: Heather Savage

When you rub your hands together to warm them, the friction creates heat. The same thing happens during earthquakes, only on a much larger scale: When a fault slips, the temperature can spike by hundreds of degrees, high enough to alter organic compounds in the rocks and leave a signature. A team of scientists at Columbia University’s Lamont-Doherty Earth Observatory has been developing methods to use those organic signatures to reconstruct past earthquakes and explore where those earthquakes started and stopped and how they moved through the fault zone. The information could eventually help scientists better understand what controls earthquakes.

Lamont geophysicist Heather Savage and geochemist Pratigya Polissar began developing the methods about eight years ago, building on techniques used by the oil industry. Their unique pairing of two fields – rock mechanics and organic geochemistry – made possible innovations that are changing how we look at earthquakes.

The process starts in the field, along a fault where scientists either chip off or drill samples from inside the fault zone. When sediments in a fault zone are heated by the friction of an earthquake, that short but powerful burst of heat alters the chemical composition of organic material inside the rock. (The same process over long periods of time creates oil and gas.) Scientists can examine the organic compounds in those samples and compare the ratio of stable molecules to unstable molecules to measure their thermal maturity and determine how hot each sample became.

“If even a tiny structure within a fault has had an earthquake, we can actually see the difference between how hot that piece of the fault got versus everything outside of it,” Savage said. “What we want to figure out is where the earthquakes in this big fault zone were actually happening. Do they all happen to one side? Are the distributed throughout? Are they all clustered on the weakest material within the fault zone?”

“What this does is give us a picture, almost like a heat map, of the fault itself, and the hottest places are where the earthquakes happened,” Savage said.

When temperatures are high enough, rock can melt, creating glass-like pseudotachylytes. Geologists have used these melted rock remnants for several years, but finding them is rare.

Savage, Polissar, and their team are looking closer, to the molecular level, where they can measure the thermal maturity of common organic compounds to determine how hot the sample became. They often test for methylphenanthrenes, organic molecules that are fairly common in faults within sedimentary rocks between 1 and 5 kilometers below ground. In deeper faults, some 10-14 kilometers down, the scientists can look for diamondoids, which are among the most thermally stable organic compounds.

To put their molecular data into context, the scientists also need to understand how rocks in the fault react to heat and pressure. In Lamont’s Rock and Ice Mechanics Lab, Savage’s team can test rock samples under a wide range of high pressures and temperatures. From their experiments, they can develop models that show how much shear stress and displacement are required to generate specific levels of heat in specific types of rock, and then how that heat will decay through diffusion.

Using these models, the scientists can then look at the geochemical analysis of their samples, determine the temperatures the compounds were exposed to in the past, and estimate the friction from the earthquake and how far the fault slipped.

For example, when the team tested samples from the Pasagshak Point megathrust on Alaska’s Kodiak Island, they measured the ratio of thermally stable diamondoids to thermally unstable alkanes and determined that the temperature during a past earthquake would have risen between 840°C and 1170°C above the normal temperature of the surrounding rock. From that temperature rise, they were able to estimate that the earthquake’s frictional energy would have been 105-227 megajoules per square meter, likely a magnitude 7 or 8 earthquake. Using their experimental friction measurements, they could then estimate that the fault must have slipped 1-8 meters.

At the American Geophysical Union Fall Meeting today in San Francisco, Genevieve Coffey, a graduate student in Savage’s team at Lamont, presented early results from their highest-density testing yet, involving samples taken in transects along the Muddy Mountain thrust in Nevada. One surprise was that the places where one might expect to see high temperatures because of the local structures in the rock were not necessarily the locations where they found it, Coffey said. “Structural variability along a fault does not necessary indicate that slip has occurred along that section,” she said.

Savage’s team is working on similar experiments at the San Andreas fault, and the Japan trench where the Tōhoku earthquake began, and they are working with colleagues on techniques to date the earthquakes.

“The important step for us is to determine how each of those compounds reacts to time and temperature,” Savage said. “That’s going to tell us about the physics of the earthquakes in that fault, which in the long run could lead to a better understanding of earthquake hazards.”

Note: The above post is reprinted from materials provided by Columbia University.

Determining erosion rates via painting

Paintings on rocks in a gorge in the Swiss Alps help monitor erosion rates. Credit: Alexander R. Beer/ETH Zurich

The determination of the spatial distribution of erosive processes is difficult. Especially in rough terrain the installation of measuring devices for a continuous measurement is complicated. This is why to date there are only few data available, especially on millimeter scale. In a new feasibility study, a Swiss-German team of scientists with the participation of Jens Turowski, Helmholtz Centre Potsdam — GFZ German Research Centre for Geosciences, shows how erosive processes can be visualized by simple painting.

In a gorge in the Swiss Alps close to Zermatt, the scientists applied horizontal and vertical patterns of paint on an area of thirty times five meters of rock and monitored them for three years via photographs taken from defined positions. Based on these photographs they were able to show the erosive processes in time that become visible by the removal of the paint. They call the new method “erosion painting.” Erosion painting allows for an analysis of the spatial distribution and intensity of erosive processes in a riverbed. Knowledge on this helps to better understand the physics behind erosion. The study aims at implementing the new method within process research.

Until now, sophisticated techniques like photogrammetry, fixed monitoring stations, laser scanning, or erosion sensors had to be applied to measure and map topographic changes on rock surfaces. But “why so complicated?” the scientists asked themselves. Erosion painting needs no expensive installation, can be applied fast and on high-resolution even in rough terrain, and only requires visual inspection via photography. Jens Turowski: “Using paint is a cheap and easy method to analyze the spatial distribution of erosive processes. With this study we would like to show that this method can be applied for science.” By repeated laser scans the scientists did validate their method. This also revealed that laser scanning cannot assess erosion rates on smallest millimeter scale that is, however, made visible by erosion painting.

The scientists only used environmental friendly, water-insoluble latex paint. To minimize the effect on nature the scientists advise to only use the paint sparsely and to avoid sensitive areas.

Reference:
Alexander R. Beer, James W. Kirchner, Jens M. Turowski. Graffiti for science – erosion painting reveals spatially variable erosivity of sediment-laden flows. Earth Surface Dynamics, 2016; 4 (4): 885 DOI: 10.5194/esurf-4-885-2016

Note: The above post is reprinted from materials provided by GFZ GeoForschungsZentrum Potsdam, Helmholtz Centre.

Researchers find roads shatter the Earth’s surface into 600,000 fragments

Credit: AAAS Monika Hoffmann

A new global map of roadless areas shows that the Earth’s surface is shattered by roads into more than 600,000 fragments. More than half of them are smaller than 1 km2. Roads have made it possible for humans to access almost every region but this comes at a very high cost ecologically to the planet’s natural world. Roads severely reduce the ability of ecosystems to function effectively and to provide us with vital services for our survival. Despite substantial efforts to conserve the world’s natural heritage, large tracts of valuable roadless areas remain unprotected. The study shows that the United Nations’ sustainability agenda fails to recognize the relevance of roadless areas in meetings its goals.

Recent research carried out by an international team of conservation scientists and published in Science used a dataset of 36 million kilometres of roads across the landscapes of the earth. They are dividing them into more than 600,000 pieces that are not directly affected by roads. Of these remaining roadless areas only 7 percent are larger than 100 km2. The largest tracts are to be found in the tundra and the boreal forests of North America and Eurasia, as well as some tropical areas of Africa, South America and Southeast Asia. Only 9 percent of these areas undisturbed by roads are protected.

Roads introduce many problems to nature. For instance, they interrupt gene flow in animal populations,facilitate the spread of pests and diseases, and increase soil erosion and the contamination of rivers and wetlands. Then there is the free movement of people made possible by road development in previously remote areas, which has opened these areas up to severe problems such as illegal logging, poaching and deforestation. Most importantly, roads trigger the construction of further roads and the subsequent conversion of natural landscapes, a phenomenon the study labels “contagious development.”

“Our global map provides guidance on the location of the most valuable roadless areas. In many cases they represent remaining tracks of extensive functional ecosystems, and are of key significance to ecological processes, such as regulating the hydrological cycle and the climate,” says Pierre Ibisch, lead author of the study based at the Centre for Econics and Ecosystem Management at Eberswalde University for Sustainable Development in Germany. The researchers used a large data base generated through crowd-sourcing, the OpenStreetMap platform. “This was the best available source of information to produce a global map for roadless areas although it was clear to us the data were incomplete. Our figures overestimate roadless areas, and we know many of the areas have already gone or been reduced in size,” explains Monika Hoffmann, coauthor from Eberswalde University for Sustainable Development who carried out the spatial analyses.

“All roads affect the environment in some shape or form including timber extraction tracks and minor dirt roads, and the impacts can be felt far beyond the road edge. The area most severely affected is within a 1-km band on either side of a road,” says Nuria Selva, co-author of the study with the Institute of Nature Conservation of the Polish Academy of Sciences in Krakow, Poland.

The study shows that the United Nations’ agenda for sustainable development, brought into force in 2015 and now referred to as the Sustainable Development Goals, presents conflicts of interest between generating economic growth and safeguarding biodiversity. Some goals threaten the remaining roadless areas. However, limiting road expansion into roadless areas could be the most cost-effective way to achieve Sustainable Development Goals that relate to preserving the world’s natural heritage. The UN Convention on Biological Diversity just held its Conference of the Parties in Cancún, Mexico. Its strategic plan is represented by the so-called Aichi Biodiversity Targets. The Science study shows how this conservation plan ignores the need of safeguarding roadless areas.

“As roads continue to expand, there is an urgent need for a global strategy for the effective conservation, restoration and monitoring of roadless areas and the ecosystems they comprise. We urge governments to avoid the costly building of roads in remote areas, which would be ecologically disastrous,” Pierre Ibisch concludes.

Reference:
P. L. Ibisch et al. A global map of roadless areas and their conservation status, Science (2016). DOI: 10.1126/science.aaf7166

Note: The above post is reprinted from materials provided by Eberswalde University for Sustainable Development.

Seafloor maps provide new information about 2015 eruption at Axial Seamount

Collecting a fragment of lava from the 2015 eruption of Axial Seamount. Credit: MBARI

Axial Seamount, a large underwater volcano about 470 kilometers (290 miles) offshore of the Oregon coast, is one of the most active volcanoes in the world-and one of the most intensively studied. Three research papers, to be published this week, describe a large eruption on Axial Seamount that occurred in April 2015.

At the 2016 meeting of the American Geophysical Union (AGU), researchers from the Monterey Bay Aquarium Research Institute (MBARI) will be presenting a new seafloor map that complements these research papers, showing the results of detailed underwater surveys conducted in August 2016, after the papers were written. This map reveals a number of previously undocumented flows from the 2015 eruption.

By comparing the new map with survey data before the 2015 eruption, researchers were able to precisely estimate the volume of lava emitted during the 2015 eruption. The new data indicate that the eruption consisted of 14 separate lava flows containing almost 156 million cubic meters of lava.

The new map also allowed geologists to locate precisely where the lava was disgorged from the seafloor. During the 2015 eruption, a series of “eruptive fissures” extended from the north end of the Axial crater (caldera) and far up the north rift zone–a total distance of 19 kilometers.

The new map doesn’t just show the lava that erupted during 2015. It covers the entire Axial caldera, as well as the north and south rift zones. Thus it will serve as a useful benchmark for geologists the next time the volcano erupts.

Since 2006, MBARI researchers have been mapping the seafloor at Axial using sonar systems mounted on autonomous underwater vehicles (AUVs). For this map, researchers combined data from MBARI’s seafloor mapping AUVs with data from Sentry, an AUV operated by Woods Hole Oceanographic Institution. Because these AUVs fly just 50 to 75 meters above the seafloor, they reveal details such as thin lava flows that are invisible to sonar from surface ships.

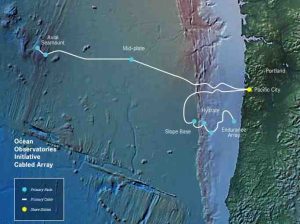
Seafloor pressure recorders such as those deployed on the Ocean Observatories Initiative (OOI) Cabled Array at Axial Seamount can record very small changes in seafloor depth (deformation). But they only provide point measurements. To show deformation over a larger area, MBARI researchers ran identical sets of AUV survey lines across the entire Axial caldera in 2011, 2014, 2015, and 2016.

These repeated surveys showed that the center of the caldera bulged up as much 1.8 meters between 2011 and 2014 (after the 2011 eruption), then subsided more than one meter between 2014 and 2015 (during the 2015 eruption). Between 2015 and 2016, the caldera floor uplifted about one half of a meter, which suggests that that magma is building up below the caldera in advance of the next eruption

In addition to running AUV surveys, over the past 10 years MBARI researchers have conducted about 40 dives on Axial Seamount using remotely operated vehicles (ROVs). Their latest dives, in 2016, revealed fascinating details about the 2015 flow. For example, on one fresh lava flow, the researchers discovered a field of tiny (30- to 50-centimeter-tall) hydrothermal chimneys, complete with tubeworms and other vent animals.

The 2016 ROV dives also revealed hundreds of lava “pillows” that exploded during the 2015 eruption, in parts of the new flows not explored in 2015 during ROV Jason dives. Tens of thousands of gunshot-like sounds were documented by seafloor seismometers on the OOI Cabled Array, as described in one of the research papers published in Science this week. Geologists suspect that these sounds were produced when seawater became trapped beneath fingers of hot lava, suddenly turned to steam, and exploded.

Much larger explosions apparently occurred earlier in the history of Axial Seamount, according to research conducted by former MBARI postdoctoral fellow Ryan Portner. These explosions scattered huge volumes of pulverized lava over wide areas of seafloor. Portner analyzed layers of fine-grained sediment that collected on the rims of the summit caldera, and used the shells of foraminifera (tiny marine animals) to determine how long ago these sediment layers were deposited. His research suggests the main caldera at Axial Seamount formed between 700 and 1,200 years ago, answering a question that has been perplexing geologists since they started studying Axial Seamount in the early 1980s.

Geologists know that Axial Volcano erupted in 1998, 2011, and 2015, and dozens of times in the preceeding 350 years. Thus it is likely that the next eruption will occur some time within the next decade. When that happens, MBARI’s newly created bathymetric map will provide essential information for geologists trying to figure out the extent and volume of the latest flow from this amazingly active underwater volcano.

Note: The above post is reprinted from materials provided by Monterey Bay Aquarium Research Institute.

Biggest and best diamonds formed in deep mantle metallic liquid

A cut and polished diamond of the kind studied in this paper with metallic inclusions. The most obvious group of inclusions looks like black spots on the left side, middle. Credit: Jae Liao

New research from a team including Carnegie’s Steven Shirey and Jianhua Wang explains how the world’s biggest and most-valuable diamonds formed—from metallic liquid deep inside Earth’s mantle. The findings are published in Science.

The research team, led by Evan Smith of the Gemological Institute of America, studied large gem diamonds like the world-famous Cullinan or Lesotho Promise by examining their so-called “offcuts,” which are the pieces left over after the gem’s facets are cut for maximum sparkle. They determined that these diamonds sometimes have tiny metallic grains trapped inside them that are made up of a mixture of metallic iron and nickel, along with carbon, sulfur, methane, and hydrogen.

These inclusions indicate that the diamonds formed, like all diamonds, in the Earth’s mantle, but they did so under conditions in which they were saturated by liquid metal. As unlikely as it sounds, their research shows that pure carbon crystalized from this pool of liquid metal in order to form the large gem diamonds.

“The existence of this metal mixture has broad implications for our understanding of deep Earth processes,” Smith said.

Diamonds form deep in the Earth’s mantle and shoot to the surface in minor volcanic eruptions of magma. Impurities contained inside diamonds can teach geologists about deep Earth chemistry under the pressure, temperature, and chemical conditions in which they were formed. Diamonds, once formed, have a unique ability to protect and shield any minerals contained inside their crystal structures, thereby giving scientists a special, protected sample of the mantle mineralogy and a glimpse at conditions miles beneath the planet’s surface.

Most diamonds form at depths around 90-150 miles under the continents. But so-called “superdeep” diamonds form much deeper—at depths below 240 miles, where the mantle rocks are known to be mobile due to convection. From the team’s work, we now understand for the first time that large gem diamonds are a group of superdeep diamonds, according to analysis of tiny samples of silicate that were also found inside the studied diamonds. These tiny silicate inclusions are also associated with the metal.

So what do these tiny samples of metal, along with their associated methane and hydrogen, tell scientists about the deep mantle? It tells them about oxygen availability in different parts of the mantle.

Near the surface, the mantle chemistry is more oxidized, which scientists can tell from the presence of carbon in the form of carbon dioxide in magmas erupted in volcanoes (among other indications). But deeper down, according to the team’s findings, some regions of the mantle are the opposite of oxidized, or reduced, which is what allows the iron-nickel liquid metal to form there.

“The fact that reduced regions can be found in the Earth’s mantle has been theoretically predicted, but never before confirmed with actual samples” Shirey explained.

“This result provides a direct link between diamond formation and deep mantle conditions, addressing a key goal of the Deep Carbon Observatory,” said DCO Executive Director and Carnegie scientist Robert Hazen. “The fact that it was made possible by a hugely successful collaboration between our Diamonds and Mantle Geodynamics of Carbon group and the Gemological Institute of America is also very exciting, highlighting the importance of academic connections with industry and their important role in providing postdoctoral funding and the key specimens for this research.”

Reference:
“Large gem diamonds from metallic liquid in Earth’s deep mantle,” Science science.sciencemag.org/cgi/doi/10.1126/science.aal1303

Note: The above post is reprinted from materials provided by Carnegie Institution for Science.

Plate tectonics shift?

Shown is a typical rock outcrop of peridotite, which contains a series of melt veins, the slightly green horizontal bands running across the rock. Credit: University of Delaware

Plate tectonics, the idea that the surface of the Earth is made up of plates that move apart and come back together, has been used to explain the locations of volcanoes and earthquakes since the 1960s.

One well-known example of this is the Pacific Ring of Fire, a 25,000-mile stretch of the Pacific Ocean known for its string of underwater volcanoes (nearly 450 of them) and earthquake sites, according to the National Oceanic and Atmospheric Administration (NOAA).

On the Pacific Coast, this area sits along the subduction zone known as the Cascadia plate, which runs down the west coast of Canada to the west coast of the United States. Most earthquakes are said to occur at subduction zones or along faults in tectonic plates.

What actually defines a tectonic plate and how thick plates are, however, has remained a hotly debated topic. This is because while scientists know that the top of the plate is the surface of the Earth, defining the plate’s bottom boundary has been challenging.

A recent study by the University of Delaware’s Jessica Warren and colleagues at the University of Oxford and the University of Minnesota, Twin Cities, provides a new data set that scientists can use to understand this problem.

“Understanding the thickness of the plate is important to understanding how plates move around, both when they form at mid-ocean ridges and later on when the material goes back down into the Earth through subduction zones such as those in Cascadia, the Andes, Japan and Indonesia,” said Warren, assistant professor in the Department of Geological Sciences in the College of Earth, Ocean, and Environment.

“It also can help scientists model and predict future earthquake and volcanic hazards, where they might occur and how deep the devastation might be depending on what the models show.”

Olivine a robust model of Earth’s interior

To understand what’s happening inside the Earth, scientists must be creative because studying the interior of the Earth in situ is impossible.

Instead, scientists study how seismic waves pass through the Earth and then invert the signal that is received to reverse engineer what’s happening. They also model the thermal properties of the rock, including where temperature changes occur, because they know that the interior of the Earth is hotter than the surface crust.

“Science has been telling us that what we predict for temperature changes within the Earth should agree with what the seismic waves are telling us. The problem has been that these two models don’t agree,” said Warren, a petrology expert who studies the origin of rocks and how they formed.

One longstanding argument has been whether the Gutenberg discontinuity — the identification of a change in seismic properties — represents the bottom of the plate.

To investigate this problem, Warren and her colleagues performed laboratory experiments on olivine, the main mineral found in the Earth’s mantle (the upper ~250 miles of the planet). Olivine also is the main mineral in peridotite rock, which is considered to be a robust model of the interior of the Earth’s composition.

The researchers took olivine and added melt (also known as basalt) to mimic how a new plate is created at a mid-ocean ridge. The team then twisted the olivine-melt mixture under high temperatures and high pressure to determine the influence of melt on the alignment of olivine crystals. They then used these experiments to predict the seismic signature of this rock and compared it to the seismic signature associated with the Gutenberg discontinuity.

The team’s results showed that the Gutenberg discontinuity does not define the bottom of the plate, but instead is caused by the presence of olivine-melt mixtures within tectonic plates.

“I’ve spent over a decade studying how olivine minerals are oriented in peridotite rocks because the flow patterns provide a historical record of how these rocks from the mantle have changed and deformed over time,” says Warren.

The research team’s results suggest the best way to model the plate thickness is based on the thermal profile and the conductive cooling that occurs as a plate ages.

“We think that the bottom of the plate is below where you have a cooling in the temperature profile. It is a layer that is associated with melt being trapped or frozen in the rock and changing the seismic properties in the rock that subsequently produced the layer that we’re imaging,” she said. “By our estimates, this would mean that the tectonic plates in the ocean are approximately 100 kilometers or about 62 miles thick. ”

The team’s data also offers an explanation for the Guttenberg discontinuity, Warren continued, saying that it corresponds to melt that was trapped or frozen in the rock after melting at mid-ocean ridges, which produced a change in how the seismic waves pass through the rock.

Reference:
Lars N. Hansen, Chao Qi, Jessica M. Warren. Olivine anisotropy suggests Gutenberg discontinuity is not the base of the lithosphere. Proceedings of the National Academy of Sciences, 2016; 113 (38): 10503 DOI: 10.1073/pnas.1608269113

Note: The above post is reprinted from materials provided by University of Delaware.

Study Models Tsunami Risk for Florida and Cuba

Left: Morphology of the modeled submarine landslide (top) and margin collapse (bottom) imaged by multibeam bathymetry data. The displacement of the water by the landslide mass causes the tsunami waves that impact the coasts of Florida and Cuba. Right: The modeled tsunami waves with over a meter wave height (5 ft) reach the Florida coast 20 minutes after the landslide (top). The tsunami waves generated by the margin collapse of southwestern Great Bahama Bank are 4.5 m (14ft) high because the coastline of Cuba is close to the margin failure area.
Credit: Eberli & Schnyder – UM Rosenstiel School of Marine and Atmospheric Science

While the Caribbean is not thought to be at risk for tsunamis, a new study by researchers at the University of Miami (UM) Rosenstiel School of Marine and Atmospheric Science indicates that large submarine landslides on the slopes of the Great Bahama Bank have generated tsunamis in the past and could potentially again in the future.

“Our study calls attention to the possibility that submarine landslides can trigger tsunami waves,” said UM Rosenstiel School Ph.D. student Jara Schnyder, the lead author of the study. “The short distance from the slope failures to the coastlines of Florida and Cuba makes potential tsunamis low-probability but high-impact events that could be dangerous.”

The team identified margin collapses and submarine landslides along the slopes of the western Great Bahama Bank — the largest of the carbonate platforms that make up the Bahamas archipelago — using multibeam bathymetry and seismic reflection data. These landslides are several kilometers long and their landslide mass can slide up to 20 kilometers (12 miles) into the basin.

An incipient failure scar of nearly 100 kilometers (70 miles) length was identified as a potential future landslide, which could be triggered by an earthquake that occasionally occur off the coast of Cuba.

Using the mathematical models commonly used to evaluate tsunami potential in the U.S., the researchers then simulated the tsunami waves for multiple scenarios of submarine landslides originating off the Great Bahama Bank to find that submarine landslides and margin collapses in the region could generate dangerous ocean currents and possibly hazardous tsunami waves several meters high along the east coast of Florida and northern Cuba.

“Residents in these areas should be aware that tsunamis do not necessarily have to be created by large earthquakes, but can also be generated by submarine landslides that can be triggered by smaller earthquakes,” said UM Rosenstiel School Professor of Marine Geosciences Gregor Eberli, senior author of the study.

The study, titled “Tsunamis caused by submarine slope failures along western Great Bahama Bank,” was published in the Nov. 4 issue of the journal Scientific Reports. The paper’s co-authors include: Jara S.D. Schnyder, Gregor P. Eberli of the CSL-Miami, James T. Kirby, Fengyan Shi, and Babak Tehranirad of the University of Delaware, Thierry Mulder and Emmanuelle Ducassou of the Université de Bordeaux in France, and Dierk Hebbeln and Paul Wintersteller of the University of Bremen in Germany.

Reference:
Jara S.D. Schnyder, Gregor P. Eberli, James T. Kirby, Fengyan Shi, Babak Tehranirad, Thierry Mulder, Emmanuelle Ducassou, Dierk Hebbeln, Paul Wintersteller. Tsunamis caused by submarine slope failures along western Great Bahama Bank. Scientific Reports, 2016; 6: 35925 DOI: 10.1038/srep35925

Note: The above post is reprinted from materials provided by University of Miami Rosenstiel School of Marine & Atmospheric Science.

Learning from slow-slip earthquakes

This map of large earthquakes outlines some of the most active tectonic plate boundaries. Slow-slip earthquakes create an ideal lab for investigating fault behavior along the shallow portion of subduction zones. Credit: USGS

Off the coast of New Zealand, there is an area where earthquakes can happen in slow-motion as two tectonic plates grind past one another. The Pacific plate is moving under New Zealand at about 5 centimeters per year there, pulling down the northern end of the island as it moves. Every 14 months or so, the interface slowly slips, releasing the stress, and the land comes back up.

Unlike typical earthquakes that rupture over seconds, these slow-slip events take more than a week, creating an ideal lab for studying fault behavior along the shallow portion of a subduction zone.

In 2015, Spahr Webb, the Jerome M. Paros Lamont Research Professor of Observational Physics at Lamont-Doherty Earth Observatory, and an international team of colleagues became the first to capture these slow-slip earthquakes in progress using instruments deployed under the sea. The data they collected from the New Zealand site, published this year by lead author Laura Wallace of the University of Texas, will help scientists better understand earthquake risks, particularly at trenches, the seismically active interfaces between tectonic plates where one plate dives under another. Members of the team are discussing their work this week at the American Geophysical Union (AGU) Fall Meeting.

“We don’t yet understand the stickiness of the interface between the two plates, and that is partly what determines how big an earthquake you can have,” Webb said. “In particular, we care about the stickiness near the trench, because when you have a lot of motion near a trench, you can generate big tsunamis.”

Previously, scientists thought that the soft sediments piled up near trenches were usually not strong enough to support an earthquake and that they would dampen the slip, Webb said. “We’re recently seen a lot of big tsunamis where there has been large slip right close to the trench,” he said.

One reason the 2011 Tōhoku earthquake in Japan was so devastating was that part of the interface very close to the trench moved a large distance, around 50 meters, pushing the water with it, Webb said. While the main part of the Tōhoku earthquake involved uplift of only a few meters, the part near the trench doubled the size of the tsunami, leading to waves almost 40 meters high at some points along the coast.

To be able to anticipate tsunami-producing earthquakes and more accurately assess regional risks, scientists are studying why some areas of trenches have these slow-slip events, why others continuously creep, and others lock up and build strain that eventually erupts as a tsunami-generating earthquake.

The Alaska Risk

Webb has his sights next on the Aleutian Trench, just off Kodiak Island, Alaska. It is one of the most seismically active parts of the world. A large tsunami-generating earthquake there could wreak havoc not only in Alaska but along the west coast of North America and as far as Hawaii and Japan, as the Good Friday earthquake did in 1964.

Lamont scientists, including Donna Shillington and Geoffrey Abers, who are also presenting their work this week at AGU, have spent years studying the structure of the Aleutian Trench and what happens as the Pacific plate dives beneath the North American plate. Webb and a large group of collaborators now want to find out where sections of the trench are sliding and where sections are locking to help understand what determines where it locks. Finding slow-slip earthquakes could help reveal some of those secrets.

To study the New Zealand slow-slip event, Webb and his colleagues installed an array of 24 absolute pressure gauges and 15 ocean-bottom seismometers directly above the Hikurangi Trough, where two plates converge. Absolute pressure gauges deployed on the seafloor continuously record changes in the pressure of the water above. If the seafloor rises, pressure decreases; if the seafloor moves downward, pressure increases due to the increasing water depth. When the slow-slip event began, the instruments recorded how the seafloor moved.

The scientists found that parts of the Hikurangi interface slipped and others didn’t during the slow-slip event. “It may be that much of the interface slips in these events but you have a few places that are locked, and those finally break and create earthquakes and tsunamis that cause damage,” Webb said.

Most of the instruments used in the New Zealand study were built at Lamont in the OBS (ocean-bottom seismometer) lab started by Webb.

In Alaska, Webb and his collaborators have proposed an experiment that would again use a large numbers of Lamont-built ocean-bottom seismometers and pressure gauges, this time to collect data near Kodiak Island. Alaska is a special challenge for seafloor measurements. The ocean is quite shallow south of Alaska before deepening near the Aleutian Trench, and seismic instruments on the seafloor can be moved by strong currents or damaged by bottom trawling. Webb and the team in the OBS lab at Lamont developed a solution: they built heavy metal shields that sink to the sea floor with the seismometers to protect them.

Once data from the instruments are collected, they will be made publicly available so seismologists across the country can begin to analyze the records in search of clues to the area’s earthquake behavior.

By detecting patterns of earthquakes, scientists can help regional engineers plan construction to better withstand worst-case earthquake scenarios, but predicting earthquake remains elusive.

“If we start seeing precursors based on the off-shore data, then maybe we’ll also get some predictive ability,” Webb said. “The hope is if you have better off-shore measurements, you’ll start to understand things better, and maybe there is some sign of motion happening before the earthquake that will provide some warning.”

Reference:
L. M. Wallace et al. Slow slip near the trench at the Hikurangi subduction zone, New Zealand, Science (2016). DOI: 10.1126/science.aaf2349

Note: The above post is reprinted from materials provided by Columbia University.

Underwater volcano’s eruption captured in exquisite detail by seafloor observatory

A seismic instrument (long black cylinder, right) installed in 2013 on a level triangular metal plate on the seafloor atop Axial Volcano. The green plate holds electronics that communicate between the instrument and the orange cable sending data back to shore as part of the National Science Foundation’s Ocean Observatories Initiative. Credit: University of Washington/OOI-NSF/CSSF-ROPOS

The cracking, bulging and shaking from the eruption of a mile-high volcano where two tectonic plates separate has been captured in more detail than ever before. A University of Washington study published this week shows how the volcano behaved during its spring 2015 eruption, revealing new clues about the behavior of volcanoes where two ocean plates are moving apart.

“The new network allowed us to see in incredible detail where the faults are, and which were active during the eruption,” said lead author William Wilcock, a UW professor of oceanography. The new paper in Science is one of three studies published together that provide the first formal analyses of the seismic vibrations, seafloor movements and rock created during an April 2015 eruption off the Oregon coast. “We have a new understanding of the behavior of caldera dynamics that can be applied to other volcanoes all over the world.”

The studies are based on data collected by the Cabled Array, a National Science Foundation-funded project that brings electrical power and internet to the seafloor. The observatory, completed just months before the eruption, provides new tools to understand one of the test sites for understanding Earth’s volcanism.

“Axial volcano has had at least three eruptions, that we know of, over the past 20 years,” said Rick Murray, director of the NSF’s Division of Ocean Sciences, which also funded the research. “Instruments used by Ocean Observatories Initiative scientists are giving us new opportunities to understand the inner workings of this volcano, and of the mechanisms that trigger volcanic eruptions in many environments.

“The information will help us predict the behavior of active volcanoes around the globe,” Murray said.

It’s a little-known fact that most of Earth’s volcanism takes place underwater. Axial Volcano rises 0.7 miles off the seafloor some 300 miles off the Pacific Northwest coast, and its peak lies about 0.85 miles below the ocean’s surface. Just as on land, we learn about ocean volcanoes by studying vibrations to see what is happening deep inside as plates separate and magma rushes up to form new crust.

The submarine location has some advantages. Typical ocean crust is just 4 miles (6 km) thick, roughly five times thinner than the crust that lies below land-based volcanoes. The magma chamber is not buried as deeply, and the hard rock of ocean crust generates crisper seismic images.

“One of the advantages we have with seafloor volcanoes is we really know very well where the magma chamber is,” Wilcock said.

“The challenge in the oceans has always been to get good observations of the eruption itself.”

All that changed when the Cabled Array was installed and instruments were turned on. Analysis of vibrations leading up to and during the event show an increasing number of small earthquakes, up to thousands a day, in the previous months. The vibrations also show strong tidal triggering, with six times as many earthquakes during low tides as high tides while the volcano approached its eruption.

Once lava emerged, movement began along a newly formed crack, or dike, that sloped downward and outward inside the 2-mile-wide by 5-mile-long caldera.

“There has been a longstanding debate among volcanologists about the orientation of ring faults beneath calderas: Do they slope toward or away from the center of the caldera?” Wilcock said. “We were able to detect small earthquakes and locate them very accurately, and see that they were active while the volcano was inflating.”

The two previous eruptions sent lava south of the volcano’s rectangular crater. This eruption produced lava to the north. The seismic analysis shows that before the eruption, the movement was on the outward-dipping ring fault. Then a new crack or dike formed, initially along the same outward-dipping fault below the eastern wall of the caldera. The outward-sloping fault has been predicted by so-called “sandbox models,” but these are the most detailed observations to confirm that they happen in nature. That crack moved southward along this plane until it hit the northern limit of the previous 2011 eruption.

“In areas that have recently erupted, the stress has been relieved,” Wilcock said. “So the crack stopped going south and then it started going north.” Seismic evidence shows the crack went north along the eastern edge of the caldera, then lava pierced the crust’s surface and erupted inside and then outside the caldera’s northeastern edge.

The dike, or crack, then stepped to the west and followed a line north of the caldera to about 9 miles (15 km) north of the volcano, with thousands of small explosions on the way.

“At the northern end there were two big eruptions and those lasted nearly a month, based on when the explosions were happening and when the magma chamber was deflating,” Wilcock said.

The activity continued throughout May, then lava stopped flowing and the seismic vibrations shut off. Within a month afterward the earthquakes dropped to just 20 per day.

The volcano has not yet started to produce more earthquakes as it gradually rebuilds toward another eruption, which typically happen every decade or so. The observatory centered on Axial Volcano is designed to operate for at least 25 years. “The cabled array offers new opportunities to study volcanism and really learn how these systems work,” Wilcock said. “This is just the beginning.”

Reference:

  1. “Seismic constraints on caldera dynamics from the 2015 Axial Seamount eruption,” Science, science.sciencemag.org/cgi/doi/10.1126/science.aah5563
  2. Related paper: “Inflation-predictable behavior and co-eruption deformation at Axial Seamount,” Science, science.sciencemag.org/cgi/doi/10.1126/science.aah4666

Note: The above post is reprinted from materials provided by University of Washington.

The Secret Life of Volcanoes

Scientists traverse the rim of Chile’s Quizapu volcano. The crater is about a half mile wide and one thousand feet deep. Credit: Kevin Krajick ’76GS, ’77JRN

On a ledge just inside the lip of the crater, Philipp Ruprecht was furiously digging a trench. A thousand-foot drop loomed yards away, and the wind was whipping the dust off his shovel. But Ruprecht was undaunted. Here, at the top of Chile’s Quizapu, at an elevation of ten thousand feet, the scientist had found a spot topped with undisturbed layers of powdered rock that the volcano had vomited from the deep earth eighty-four years earlier. These were the samples he’d been searching for.

In 1932, Quizapu (kee-SAH-poo), located about 150 miles south of Santiago in the Chilean Andes, produced one of South America’s largest recorded volcanic explosions, expelling a fiery plume of ash-to-boulder-sized material that instantly turned some four hundred square miles to desert. Today, the region is a volcanic wonderland: a barren landscape of hardened lava flows, hot springs, and pumice that has been left relatively undisturbed by human activity.

Ruprecht, an adjunct associate research scientist at Columbia’s Lamont-Doherty Earth Observatory who also teaches at the University of Nevada, has been studying Quizapu for more than a decade. Earlier this year, he brought along six other American and Chilean scientists and a dozen students. The purpose of the weeklong expedition (supported by the Columbia Global Center in Santiago and the President’s Global Innovation Fund) was to better understand the forces that drive Quizapu and other volcanoes in the region.

In recent years, scientists have become more adept at monitoring volcanoes to anticipate their eruptions. But they struggle to predict the type and intensity of these events, and there are plenty of false alarms. Quizapu is an interesting case study because it has erupted in different ways at different times. In 1932 it exploded with massive force, but in 1846 it simply bled out a river of relatively slow-moving lava.

“If you’re trying to decide how many people to evacuate from around a volcano, you really want to know what that eruption is going to be like,” says Ruprecht, noting that while lava flows may destroy property and wildlife, they are rarely deadly. “If you tell people to flee because the next big one is coming, and then only a minor eruption occurs, they may not believe you the next time you warn them.”

By reconstructing Quizapu’s past eruptions, Ruprecht and his colleagues aim to more accurately interpret the volcano’s seismic vibrations. They approach their work like forensics experts at a crime scene. By inspecting the mineral composition of lava deposits, for instance, they can determine the depth from which the magma originated, and the speed with which it ascended to the earth’s surface.

“One of the things we look for is the presence of crystals that form very deep in the earth,” says Ruprecht. “This is a sign that the eruption was fueled, at least in part, by magma that came from miles underground.”

On previous trips to Quizapu, Ruprecht made a surprising discovery: hardened lava from the relatively mellow 1846 eruption is chock-full of well-preserved remnants of this deep-earth magma. This was unexpected, because volcanologists have long assumed that whenever a large volume of magma shoots up from the earth’s mantle, an explosive eruption will occur. To explain the discrepancy, Ruprecht has come up with another theory. He suspects that if rapidly ascending magma encounters cooler pockets of magma on its way to the earth’s surface, it may release certain stored gases — thus giving the lava less explosive kick when it emerges.

“A major factor in an explosive eruption is the buildup of gas pressure within the magma as it accumulates just below the earth’s surface,” Ruprecht says. “When the magma eventually bursts out as lava, it’s like soda spraying out of a shaken bottle. But if the magma has lost all its gas, it may just pour out in a benign fashion.”

To test this theory, the members of Ruprecht’s expedition gathered dozens of lava samples, which are now being analyzed to determine their composition.

“We want to see if the lava from the 1846 eruption had unusually low concentrations of gas,” says Lucy Tweed, a Columbia graduate student in earth and environmental sciences who was a member of the expedition. “This is tricky, because the new lava that shot up from deep within the earth mingled with lava that had been slowly accumulating for years right beneath the volcano. So we need to look very carefully at the crystallization signatures within the different magma flows.”

During the trip, Einat Lev, an assistant research professor at Lamont-Doherty who studies the fluid dynamics of lava, and Elise Rumpf, a postdoctoral research scientist at Lamont, flew a drone over Quizapu to create the first comprehensive photographic survey of the lava deposits around the volcano. Lev says that their maps, together with her colleagues’ geochemical analysis, will provide insights into how lava flows produced by different types of volcanic eruptions behave on land.

“Lava flows aren’t a huge concern around Quizapu, since the immediate area is sparsely populated, but there are dozens of other volcanoes in South America and in places like Japan, Hawaii, the Philippines, and Italy that threaten major towns and cities,” Lev says. “The people who live there need to know: if a big lava flow occurs, how fast will it come down? What direction is it likely to go in? Should we construct protective barriers in certain areas to redirect the flow? By piecing together how volcanoes have erupted in the past, we’re starting to be able to answer these questions.”

Note: The above post is reprinted from materials provided by Columbia University.

Earthquake faults are smarter than we usually think

Representative Image

Northwestern University researchers now have an answer to a vexing age-old question: Why do earthquakes sometimes come in clusters?

The research team has developed a new computer model and discovered that earthquake faults are smarter — in the sense of having better memory — than seismologists have long assumed.

“If it’s been a long time since a large earthquake, then, even after another quake happens, the fault’s ‘memory’ sometimes isn’t wiped out, so there’s still a good chance of having another,” said Seth Stein, the study’s senior author and the William Deering Professor of Geological Sciences in the Weinberg College of Arts and Sciences.

“As a result, a cluster of earthquakes occurs,” he said. “Earthquake clusters imply that faults have a long-term memory.”

The model shows that clusters can occur on faults with long-term memory, so that even after a big earthquake happens, the chance of another earthquake can stay high. The memory comes from the fact that the earthquake didn’t release all the strain that built up on the fault over time, so some strain remains after a big earthquake and can cause another.

“This isn’t surprising,” said Bruce D. Spencer, a professor of statistics in Weinberg and an author of the study. “Many systems’ behavior depends on their history over a long time. For example, your risk of spraining an ankle depends not just on the last sprain you had, but also on previous ones.”

Leah Salditch, lead author of the study, will present details of the research Thursday, Dec. 15, at the American Geophysical Union (AGU) meeting in San Francisco.

Since earthquake seismology started after a large earthquake destroyed San Francisco in 1906, seismologists have usually assumed that when the next big earthquake will happen on a fault depends on the time since the last one happened. In other words, a fault has only short-term memory — it “remembers” only the last earthquake and has “forgotten” all the previous ones.

This assumption goes into forecasting when future earthquakes will happen, and then into hazard maps that predict the level of shaking for which earthquake-resistant buildings should be designed.

However, Salditch, a graduate student in Stein’s research group, explained, “Long histories of earthquakes on faults sometimes show clusters of earthquakes with relatively short times between them, separated by longer times without earthquakes. For example, during clusters on the San Andreas, big earthquakes happened only about 50 years apart, while the clusters are separated by several hundred years. Clusters also have been found on the Cascadia fault system off the coast of Oregon, Washington and British Columbia, and along the Dead Sea fault in Israel.”

These results could be important for forecasting when future earthquakes will happen, said Edward M. Brooks, an author of the study and a graduate student in Stein’s research group.

“When you’re trying to figure out a team’s chances of winning a ball game, you don’t want to look just at what happened in the last game between those teams,” Brooks said. “Looking back over earlier games also can be helpful. We should learn how to do a similar thing for earthquakes.”

Note: The above post is reprinted from materials provided by Northwestern University. Original written by Megan Fellman..

New evidence for a warmer and wetter early Mars

Hellas Basin on Mars. Credit: MOLA Science Team

A recent study from ESA’s Mars Express and NASA’s Mars Reconnaissance Orbiter (MRO) provides new evidence for a warm young Mars that hosted water across a geologically long timescale, rather than in short episodic bursts – something that has important consequences for habitability and the possibility of past life on the planet.

Although water is known to have once flowed on Mars, the nature and timeline of how and when it did so is a major open question within planetary science.

The findings follow an analysis of a region of relatively smooth terrain, called inter-crater plains, just north of the Hellas Basin. With a diameter of 2300 km, the Hellas Basin is one of the largest identified impact craters both on Mars and within the Solar System, and is thought to have formed some 4 billion years ago.

“These plains on the northern rim of Hellas are usually interpreted as being volcanic, as we see with similar surfaces on the Moon,” said Francesco Salese of IRSPS, Università “Gabriele D’Annunzio”, Italy, and lead author on the new paper. “However, our work indicates otherwise. Instead, we found thick, widespread swathes of sedimentary rock.”

Sedimentary and volcanic (igneous) rocks form in different ways – volcanic, as the name suggests, needs active volcanism driven by a planet’s internal activity, while sedimentary rock usually requires water. Igneous rock is created as volcanic deposits of molten rock cool and solidify, while sedimentary builds up as new deposits of sediment form layers that compact and harden over geologically long timescales.

“To create the kind of sedimentary plains we found at Hellas, we believe that a generally aqueous environment was present in the region some 3.8 billion years ago,” said Salese. “Importantly, it must have lasted for a long period of time – on the order of hundreds of millions of years.”

A volatile adolescence?

There are a couple of key models for early Mars – both involve the presence of liquid water, but in vastly different ways.

Some studies suggest that Mars’ earliest days (the Noachian period, over 3.7 billion years ago) had a steadily warm climate, which enabled vast pools and streams of water to exist across the planet’s surface. This watery world then lost both its magnetic field and atmosphere and cooled down, transforming into the dry, arid world we see today.

Alternatively, rather than hosting a warm climate and water-laden surface for eons, Mars may instead have only experienced short, periodic bursts of warmth and wetness that lasted for less than 10 000 years each, facilitated by a sputtering cycle of volcanism that intermittently surged and subsided across the years.
Both scenarios could form some of the water-dependent chemistries and rock morphologies we see across Mars’ surface, and have significant consequences for Mars in both a geological sense – how the planet formed and evolved, whether its past has anything in common with Earth’s, and the composition and structure of its surface – and in terms of potential habitability.

“Understanding if Mars had a warmer and wetter climate for a long period of time is a key question in our search for past life on the Red Planet,” said co-author Nicolas Mangold of CNRS-INSU, Nantes University, France.

“If we can understand how the martian climate evolved, we’ll have a better understanding of whether life could have ever flourished, and where to look for it if it did. We can also learn much about rocky planets in general, which is especially exciting in this era of exoplanet science, and about our own planet – the same processes we think to have been important on a young Mars, such as sedimentary processes, volcanism, and impacts, have also been crucial on Earth.”

From formation to erosion

Salese and colleagues used imaging and spectro-imaging data from Mars Express and MRO to create a detailed geological map of the area around northern Hellas, taking advantage of so-called “erosional windows” – geological formations that act as natural “drill holes” down into the plains, revealing deeper material (examples include impact craters, grabens, and outcrops).

These data showed the plains to be composed of an over 500-metre-thick band of flat, layered, light-coloured rock. The rock showed several characteristics typical of sedimentary deposition: box-work, which is a type of box-like mineral structure formed by erosion; cross-bedding, identified as layers of rock intersecting at different tilts and inclines; and planar stratification, which manifests as distinct, near-horizontal layers of rock that line up atop one another. These were in addition to large amounts of clays known as smectites.

Clays are exciting chemicals, as they indicate that a wet and thus potentially habitable environment once existed at that location. Clays can also trap organic material and potentially preserve signs of life.

“These characteristics suggest that the rock didn’t form from lava flow deposits but rather from sedimentary processes, which implies that the region once experienced warm and wet conditions for a relatively long time,” said Salese. “When the layered rock was deposited – during the Noachian period, around 3.8 billion years ago – its surroundings must have been soaked in water, with intense liquid circulation. We think it likely formed in a lake (lacustrine) or stream (alluvial) environment, or a combination of both.”

The rock then underwent an intense period of volcanic erosion during the Hesperian period (3.7 to 3.3 billion years ago) and was covered by volcanic flows, creating the morphology we see today. The scientists estimate a minimum erosion rate for this time period of one metre per million years – one hundred times higher than the erosion rates estimated on Mars in the past 3 billion years.

“This is further evidence of a prolonged period of active geological processes on the surface of early Mars,” added Mangold. “We can also extrapolate our finding to the rest of Mars and be confident we understand the evolution of the planet as a whole – we believe that the global climate conditions of Noachian Mars were sufficient to support significant liquid water.”

Cosmic Collaboration

This study used data from Mars Express and MRO, which allowed the scientists to explore the region’s appearance, topography, morphology, mineralogy, and age. More specifically, Mars Express imaging data allowed Salese and colleagues to study the plains’ geology on a regional scale, providing context for the local-scale observations from MRO.

The presence of rock morphologies or minerals that imply a wet history point towards possible habitability at that location in the past – something that is important in selecting landing sites and areas of interest for future robotic and potential human missions to Mars.

“This work again demonstrates the importance of successful cooperation between different missions, and collaboration between ESA and NASA,” said Dmitri Titov, ESA Project Scientist for Mars Express. “No mission would be able to unveil the history of Mars alone. By using multiple spacecraft and different observation techniques, it’s possible to characterise all kinds of different geological processes on Mars in all their complexity, and gain a more complete view of Mars’ early days.”

This finding is part of a series of efforts to understand Mars’ history and the planet as a whole, performed using Mars Express and other spacecraft – from studying Mars’ early climate by probing the evolution of large lakes that once existed across the planet’s surface, to observing Mars’ present-day weather (including mystery clouds and aurorae), and characterising the pockets of magnetism locked up within its crust.

Note: The above post is reprinted from materials provided by European Space Agency.

Related Articles