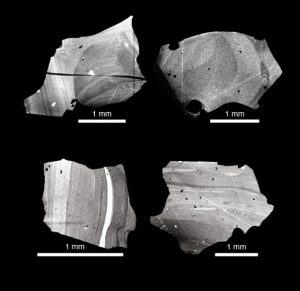
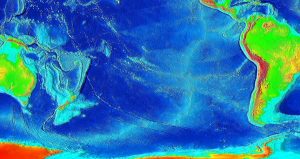
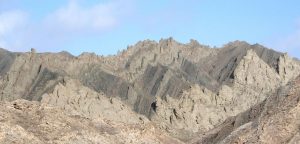
The researchers analysed quartz crystals from Toba, and found a distinct shift in the isotopic composition towards the outer rim of the crystals. Credit: Image courtesy of Uppsala Universitet
Researchers have now found an explanation for what triggered the largest volcanic eruption witnessed by humankind. The volcano’s secret was revealed by geochemical clues hidden inside volcanic quartz crystals.
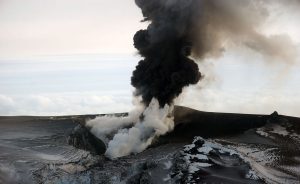
The deadliest volcanoes on earth are called supervolcanoes, capable of producing cataclysmic eruptions that devastate huge regions, and cause global cooling of the climate. The Indonesian supervolcano Toba had one of these eruptions about 73000 years ago, when 2800 cubic kilometers of volcanic ash was ejected into the atmosphere and rained down and covered enormous areas in Indonesia and India.
Scientists have long debated how these extraordinary volumes of magma are generated, and what makes this magma erupt so very explosively. A team of researchers at Uppsala University, together with international colleagues, have now found intriguing clues hidden inside millimeter-sized crystals from the volcanic ash and rock.
‘Quartz crystals that grow in the magma register chemical and thermodynamical changes in the magmatic system prior to eruption, similar to how tree rings record climate variations. When the conditions in the magma change, the crystals respond and produce distinct growth zones that record these changes. The problem is that each “tree ring”-analogue is only a few micrometers across, which is why they are extremely challenging to analyse in detail,’ says Dr. David Budd at the Department of Earth Sciences, Uppsala University.
The researchers analysed quartz crystals from Toba, and found a distinct shift in the isotopic composition towards the outer rim of the crystals. The crystal rims contain a relatively lower proportion of the heavy isotope 18O compared to the lighter 16O.
‘The low ratio of 18O to 16O contents in the crystal rims indicate that something in the magmatic system changed drastically just before the big eruption. The explanation behind these chemical signatures is that the magma melted and assimilated a large volume of a local rock that itself is characterised by a relatively low ratio of 18O to 16O . This rock type also often contains a lot of water, which may be released into the magma, producing steam, and thereby an increased gas pressure inside the magma chamber. This rapidly increased gas pressure eventually allowed the magma to rupture the overlying crust, and send thousands of cubic kilometres of magma into the atmosphere,’ explains Dr. Frances Deegan at the Department of Earth Sciences, Uppsala University.
Luckily, these cataclysmic super-eruptions happen very rarely.
‘Biologists have previously shown that this particular eruption at Toba pushed humanity close to extinction. It will hopefully take many thousands of years, but the fact is it is only a matter of time before the next super eruption, maybe at Toba, Yellowstone (USA), or somewhere else. Hopefully, we will know more and be better prepared next time!’ says Professor Valentin Troll at the Department of Earth Sciences, who led this study of Toba quartzes at Uppsala University.
Reference:
David A. Budd, Valentin R. Troll, Frances M. Deegan, Ester M. Jolis, Victoria C. Smith, Martin J. Whitehouse, Chris Harris, Carmela Freda, David R. Hilton, Sæmundur A. Halldórsson, Ilya N. Bindeman. Magma reservoir dynamics at Toba caldera, Indonesia, recorded by oxygen isotope zoning in quartz. Scientific Reports, 2017; 7: 40624 DOI: 10.1038/srep40624
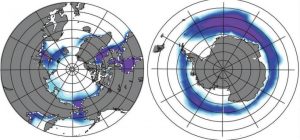
The Southern Hemisphere has a higher capacity to grow sea ice than the Northern Hemisphere, where continents block growth. New research shows that the expansion of Southern Hemisphere sea ice during certain periods in Earth’s orbital cycles can control the pace of the planet’s ice ages. Credit: Jung-Eun Lee / Brown University
Earth is currently in what climatologists call an interglacial period, a warm pulse between long, cold ice ages when glaciers dominate our planet’s higher latitudes. For the past million years, these glacial-interglacial cycles have repeated roughly on a 100,000-year cycle. Now a team of Brown University researchers has a new explanation for that timing and why the cycle was different before a million years ago.
Using a set of computer simulations, the researchers show that two periodic variations in Earth’s orbit combine on a 100,000-year cycle to cause an expansion of sea ice in the Southern Hemisphere. Compared to open ocean waters, that ice reflects more of the sun’s rays back into space, substantially reducing the amount of solar energy the planet absorbs. As a result, global temperature cools.
“The 100,000-year pace of glacial-interglacial periods has been difficult to explain,” said Jung-Eun Lee, an assistant professor in Brown’s Department of Earth, Environmental and Planetary Studies and the study’s lead author. “What we were able to show is the importance of sea ice in the Southern Hemisphere along with orbital forcings in setting the pace for the glacial-interglacial cycle.”
The research is published in the journal Geophysical Research Letters.
Orbit and climate
In the 1930s, Serbian scientist Milutin Milankovitch identified three different recurring changes in Earth’s orbital pattern. Each of these Milankovitch Cycles can influence the amount of sunlight the planet receives, which in turn can influence climate. The changes cycle through every 100,000, 41,000 and 21,000 years.
The problem is that the 100,000-year cycle alone is the weakest of the three in the degree to which it affects solar radiation. So why that cycle would be the one that sets the pace of glacial cycle is a mystery. But this new study shows the mechanism through which the 100,000-year cycle and the 21,000-year cycle work together to drive Earth’s glacial cycle.
The 21,000-year cycle deals with precession — the change in orientation of Earth’s tilted rotational axis, which creates Earth’s changing seasons. When the Northern Hemisphere is tilted toward the sun, it gets more sunlight and experiences summer. At the same time, the Southern Hemisphere is tilted away, so it gets less sunlight and experiences winter. But the direction that the axis points slowly changes — or precesses — with respect to Earth’s orbit. As a result, the position in the orbit where the seasons change migrates slightly from year to year. Earth’s orbit is elliptical, which means the distance between the planet and the sun changes depending on where we are in the orbital ellipse. So precession basically means that the seasons can occur when the planet is closest or farthest from the sun, or somewhere in between, which alters the seasons’ intensity.
In other words, precession causes a period during the 21,000-year cycle when Northern Hemisphere summer happens around the time when Earth is closest to the sun, which would make those summers slightly warmer. Six months later, when the Southern Hemisphere has its summer, Earth would be at its furthest point from the sun, making the Southern Hemisphere summers a little cooler. Every 10,500 years, the scenario is the opposite.
In terms of average global temperature, one might not expect precession to matter much. Whichever hemisphere is closer to the sun in its summer, the other hemisphere will be farther away during its summer, so the effects would just wash themselves out. However, this study shows that there can indeed be an effect on global temperature if there’s a difference in the way the two hemispheres absorb solar energy — which there is.
That difference has to do with each hemisphere’s capacity to grow sea ice. Because of the arrangement of the continents, there’s much more room for sea ice to grow in the Southern Hemisphere. The oceans of the Northern Hemisphere are interrupted by continents, which limits the extent to which ice can grow. So when the precessional cycle causes a series of cooler summers in the Southern Hemisphere, sea ice can expand dramatically because there’s less summer melting.
Lee’s climate models rely on the simple idea that sea ice reflects a significant amount of solar radiation back into space that would normally be absorbed into the ocean. That reflection of radiation can lower global temperature.
“What we show is that even if the total incoming energy is the same throughout the whole precession cycle, the amount of energy Earth actually absorbs does change with precession,” Lee said. “The large Southern Hemispheric sea ice that forms when summers are cooler reduces the energy absorbed.”
But that leaves the question of why the precession cycle, which repeats every 21,000 years, would cause a 100,000-year glacial cycle. The answer is that the 100,000-year orbital cycle modulates the effects of the precession cycle.
The 100,000-year cycle deals with the eccentricity of Earth’s orbit — meaning the extent to which it deviates from a circle. Over a period of 100,000 years, the orbital shape goes from almost circular to more elongated and back again. It’s only when eccentricity is high — meaning the orbit is more elliptical — that there’s a significant difference between Earth’s furthest point from the sun and its closest. As a result, there’s only a large difference in the intensity of seasons due to precession when eccentricity is large.
“When eccentricity is small, precession doesn’t matter,” Lee said. “Precession only matters when eccentricity is large. That’s why we see a stronger 100,000-year pace than a 21,000-year pace.”
Lee’s models show that, aided by high eccentricity, cool Southern Hemisphere summers can decrease by as much as 17 percent the amount of summer solar radiation absorbed by the planet over the latitude where the difference in sea ice distribution is largest — enough to cause significant global cooling and potentially creating the right conditions for an ice age.
Aside from radiation reflection, there may be additional cooling feedbacks started by an increase in southern sea ice, Lee and her colleagues say. Much of the carbon dioxide — a key greenhouse gas — exhaled into the atmosphere from the oceans comes from the southern polar region. If that region is largely covered in ice, it may hold that carbon dioxide in like a cap on a soda bottle. In addition, energy normally flows from the ocean to warm the atmosphere in winter as well, but sea ice insulates and reduces this exchange. So having less carbon and less energy transferred between the atmosphere and the ocean add to the cooling effect.
Explaining a shift
The findings may also help explain a puzzling shift in Earth’s glacial cycle. For the past million years or so, the 100,000-year glacial cycle has been the most prominent. But before a million years ago, paleoclimate data suggest that pace of the glacial cycle was closer to about 40,000 years. That suggests that the third Milankovitch Cycle, which repeats every 41,000 years, was dominant then.
While the precession cycle deals with which direction Earth’s axis is pointing, the 41,000-year cycle deals with how much the axis is tilted. The tilt — or obliquity — changes from a minimum of about 22 degrees to a maximum of around 25 degrees. (It’s at 23 degrees at the moment.) When obliquity is higher, each of the poles gets more sunlight, which tends to warm the planet.
So why would the obliquity cycle be the most important one before a million years ago, but become less important more recently?
According to Lee’s models, it has to do with the fact that the planet has been generally cooler over the past million years than it was prior to that. The models show that, when Earth was generally warmer than today, precession-related sea ice expansion in the Southern Hemisphere is less likely to occur. That allows the obliquity cycle to dominate the global temperature signature. After a million years ago, when Earth became a bit cooler on average, the obliquity signal starts to take a back seat to the precession/eccentricity signal.
Lee and her colleagues believe their models present a strong new explanation for the history of Earth’s glacial cycle — explaining both the more recent pace and the puzzling transition a million years ago.
As for the future of the glacial cycle, that remains unclear, Lee says. It’s difficult at this point to predict how human contributions to Earth’s greenhouse gas concentrations might alter the future of Earth’s ice ages.
Reference:
Jung-Eun Lee, Aaron Shen, Baylor Fox-Kemper, Yi Ming. Hemispheric sea ice distribution sets the glacial tempo. Geophysical Research Letters, 2017; DOI: 10.1002/2016GL071307
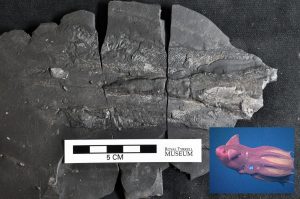
A fossilized mantle of a vampyropod, a relative to the modern vampire squid (pictured on bottom right). The ink sack is the raised structure in the center, and muscles have a striated appearance. Credit: Rowan Martindale/The University of Texas at Austin Jackson School of Geosciences and the Monterey Bay Aquarium Research Institute.
A trove of exceptionally preserved Jurassic marine fossils discovered in Canada, rare for recording soft-bodied species that normally don’t fossilize, is expanding scientists’ view of the rich marine life of the period.
The preservation of the fossils—which include soft body parts as well as shells and bones—ranks the site among the highest quality sources of Jurassic (183 million year old) marine fossils in the world, and the only such site in North America. A paper describing the site and fossils recovered from it was published online in the journal Geology in January.
The presence of fossilized soft tissue is especially significant because it offers a more complete view of life in ancient ecosystems and can help fill the gaps in knowledge connecting extinct organisms to those living today, said Rowan Martindale, a professor at The University of Texas at Austin’s Jackson School of Geosciences who led research on the fossils.
“In a normal fossil deposit, you only preserve a fraction of the organisms that were alive in the past. When you get an extraordinary fossil deposit with soft tissues preserved, you see significantly more of the community that would have been alive,” said Martindale, a paleontologist in the Department of Geological Sciences. “Normally, we wouldn’t find many of the animals because they lack a skeleton or have a very soft skeleton.”
Collaborators include researchers from Harvard University, Virginia Tech and Florida State University.
The new site was found on the Parks Canada Ya Ha Tinda Ranch near Banff National Park in southwest Alberta. Co-author Benjamin Gill, a professor at Virginia Tech, spotted the first exceptional fossil when he noticed his Ph.D. student and co-author, Theodore Them, standing right on top of a lobster.
“The lighting was just right to make out the outline of the lobster,” Gill said. “Then we looked around and noticed fossils all around us.”
The lobster was the first sign the site could be special because lobsters’ flexible exoskeletons usually aren’t preserved as fossils. Other unusual fossils recovered from the site include delicate shrimp, complete fish skeletons with scales and gills, large dolphin-like marine reptiles called ichthyosaurs, as well as “vampyropods” (related to modern vampire squid and octopus) with their delicate ink sacks still intact.
The presence of many well-preserved, soft-bodied animals marks the new site as a “Konservat-Lagerstätte,” a term for fossil beds that preserve an array of organisms with soft tissues as well as hard ones. These sites are rare. There are only three other sites, all located in Europe, that are known to contain fossils from the Early Jurassic like the Ya Ha Tinda site. Another famous example of a Canadian Lagerstätte is the Burgess Shale, which preserves a community of soft tissue organisms from the Cambrian Explosion (540 million years ago), named for the burst of animal diversity that appears in the fossil record from this time.
The new site is about 183 million years old, meaning the fossilized life was alive during the Early Jurassic. At this time, Ya Ha Tinda and the similarly aged European sites were on opposite sides of an ancient continent that became modern-day North America and parts of Europe. Having an array of well-preserved fossils from marine ecosystems on opposite sides of the continent will help scientists understand the distribution of sea life millions of years ago.
“This is the first time we have a site like this outside of Europe, so the Ya Ha Tinda fossilized community will give us a unique snapshot of life in the Early Jurassic Panthalassa Ocean,” Martindale said.
The researchers have been visiting the site every summer since 2013 and have recovered dozens of fossils, including some that are probably newly discovered species. Notable specimens include a lobster with bulky arms capped with diminutive, scissor-like claws, and 16 new vampyropod specimens, a number that Gill estimates increases known diversity of specimens from North America by threefold.
“Every time we’ve gone, we’ve found something new,” Gill said. “It’s a really abundant place.”
The next step of the research is to investigate how so many diverse organisms were fossilized together. Researchers think that the high-quality preservation is related to a widespread extinction of marine life caused by a period of extremely low levels of oxygen in parts of the Jurassic oceans. Free of most scavengers, these low oxygen areas could have been an ideal place for a carcass to lay undisturbed and become beautifully fossilized.
“If a carcass sinks into anoxic water, you’re more likely to get the conditions that will favor the preservation of soft tissues, feathers and articulated skeletons,” Martindale said. “These ‘fossil jackpots’ are really special.”
Reference:
Rowan C. Martindale et al, A new Early Jurassic (ca. 183 Ma) fossilfrom Ya Ha Tinda, Alberta, Canada, Geology (2017). DOI: 10.1130/G38808.1
For tens of thousands of years, the warm, sticky natural asphalt that occasionally bubbled to the Earth’s surface in the area now called Los Angeles was a death sentence for some ice age animals.
Woolly mammoths, camels, rabbits, horses, bison, sloths, rodents, snails, turtles, birds and saber-toothed cats perished after becoming mired in the liquid asphalt—sometimes referred to as tar pits.
For Jacquelyn Gill, the fossils, twigs and plants encased in this sticky petroleum at the La Brea Tar Pits and Museum in downtown Los Angeles provide opportunities to examine the climate and flora and fauna of the past and observe evolutionary changes.
The University of Maine paleoecologist’s findings will be added to the broader mosaic of what’s already known about the very large animals of that era.
Gill and other scientists involved with Project 23, as it’s called, intend to reconstruct the food web—from mastodons and bison to rodents and plants—during 2,000- to 5,000-year snapshots across an approximate 50,000-year period.
“Most of these are ice age survivors,” Gill says of the animals and plants trapped in the oil seeps. “What made them so resilient to climate change and extinction?”
By reconstructing the food web, Gill and the team of researchers will learn how various species were connected for extended periods of time when they were not under climate stress.
Understanding those connections could help protect today’s biodiversity in a changing climate, she says.
“We can see how species relied on each other, and use those relationships to predict extinction risk based on food web connections,” says Gill. “It’s a useful model to apply to our modern ecosystems.”
Fossils in the tar pit tombs were unearthed recently when the Los Angeles County Museum of Art, which is adjacent to La Brea Tar Pits and Museum, excavated a site to build an underground parking garage.
Salt Lake Oil Field, a large petroleum reservoir below the Earth’s surface, is nearby. For tens of thousands of years, oil—formed from marine plankton deposited in an ocean basin 5–25 million years ago—has seeped to the surface.
The National Science Foundation funds Gill’s nearly $300,000 portion of the $1.2 million three-year project.
Gill conceived of the project when she delivered a lecture about ice age ecosystems and extinction at the Natural History Museum of Los Angeles County, which manages the Tar Pits.
“For the first time, we can look at the entire ice age ecosystem of Rancho La Brea, instead of just the largest herbivores and predators,” Gill says.
Thus far, Gill says the plants that have been identified in asphalt chunks from Los Angeles now grow in Oregon and at higher elevations in the southern Sierra Nevada mountains.
This indicates the late Pleistocene climate at La Brea Tar Pits was cooler and wetter than it is now, she says.
An illustrated life reconstruction of Magnuviator ovimonsensis at the Egg Mountain site as it may have appeared in the Cretaceous Period 75 million years ago. One Magnuviator eats a wasp, and on the ground is a tooth from the bird-like dinosaur Troodon. The arid-adapted plant is based on fossil pollen found near Egg Mountain. Credit: Misaki Ouchida
Paleontologists picking through a bounty of fossils from Montana have discovered something unexpected—a new species of lizard from the late dinosaur era, whose closest relatives roamed in faraway Asia.
This ancient lizard, which lived 75 million years ago in a dinosaur nesting site, is described from stem to stern in a paper published Jan. 25 in the Proceedings of the Royal Society B. Christened Magnuviator ovimonsensis, the new species fills in significant gaps in our understanding of how lizards evolved and spread during the dinosaur era, according to paleontologists at the University of Washington and the Burke Museum of Natural History & Culture who led the study.
“It is incredibly rare to find one complete fossil skeleton from a relatively small creature like this lizard,” said David DeMar, lead author and postdoctoral research associate in the UW biology department and the Burke Museum. “But, in fact, we had two specimens, both from the same site at Egg Mountain in Montana.”
Right out of the gate, Magnuviator is reshaping how scientists view lizards, their biodiversity and their role in complex ecosystems during this reptile’s carefree days in the Cretaceous Period 75 million years ago.
Based on analyses of the nearly complete fossil skeletons, Magnuviator was an ancient offshoot of iguanian lizards—and they’re actually the oldest, most complete iguanian fossils from the Americas. Today, iguanians include chameleons of the Old World, iguanas and anoles in the American tropics and even the infamous water-walking basilisk—or “Jesus Christ”—lizards. But based on its anatomy, Magnuviator was at best a distant relative of these modern lizard families, most of which did not arise until after the non-avian dinosaurs—and quite a few lizards and other creatures—went extinct 66 million years ago.
The team came to these conclusions after meticulous study of both Egg Mountain specimens over four years. This included a round of CT scans at Seattle Children’s Hospital to narrow down the fossil’s location within a larger section of rock and a second round at the American Museum of Natural History to digitally reconstruct the skull anatomy. The fact that both skeletons were nearly complete allowed them to determine not only that Magnuviator represented an entirely new species, but also that its closest kin weren’t other fossil lizards from the Americas. Instead, it showed striking similarities to other Cretaceous Period iguanians from Mongolia.
“These ancient lineages are not the iguanian lizards which dominate parts of the Americas today, such as anoles and horned lizards,” said DeMar. “So discoveries like Magnuviator give us a rare glimpse into the types of ‘stem’ lizards that were present before the extinction of the dinosaurs.”
But Magnuviator’s surprises don’t end with the Mongolian connection. The site of its discovery is also eye-popping.
Egg Mountain is already famous among fossil hunters. Over 30 years ago, paleontologists discovered the first fossil remains of dinosaur babies there, and it is also one of the first sites in North America where dinosaur eggs were discovered.
“We now recognize Egg Mountain as a unique site for understanding Cretaceous Period ecosystems in North America,” said senior author Greg Wilson, UW associate professor of biology and curator of paleontology at the Burke Museum. “We believe both carnivorous and herbivorous dinosaurs came to this site repeatedly to nest, and in the process of excavating this site we are learning more and more about other creatures who lived and died there.”
The team even named their new find as homage to its famous home and its close lizard relatives in Asia. Magnuviator ovimonsensis means “mighty traveler from Egg Mountain.”
Through excavations at Egg Mountain led by co-author David Varricchio at Montana State University and meticulous analysis of fossils at partner institutions like the UW and the Burke Museum, scientists are piecing together the Egg Mountain ecosystem of 75 million years ago. In those days, Egg Mountain was a semi-arid environment, with little or no water at the surface. Dinosaurs like the duck-billed hadrosaurs and the birdlike, carnivorous Troodon nested there.
Researchers have also unearthed fossilized mammals at Egg Mountain, which are being studied by Wilson’s group, as well as wasp pupae cases and pollen grains from plants adapted for dry environments. Based on the structure of Magnuviator’s teeth, as well as the eating habits of some lizards today, the researchers believe that it could have feasted on wasps at the Egg Mountain site. Though based on its relatively large size for a lizard—about 14 inches in length—Magnuviator could have also eaten something entirely different.
“Due to the significant metabolic requirements to digest plant material, only lizards above a certain body size can eat plants, and Magnuviator definitely falls within that size range,” said DeMar.
Whatever its diet, Magnuviator and its relatives in Mongolia did not make it into the modern era. DeMar and co-authors hypothesize that these stem lineages of lizards may have gone extinct along with the non-avian dinosaurs. But given the spotty record for lizards in the fossil record, it will take more Magnuviator-level discoveries to resolve this debate. And, unfortunately, part of the excitement surrounding Magnuviator is that it is a rare find.
Reference:
A new Late Cretaceous iguanomorph from North America and the origin of New World Pleurodonta (Squamata, Iguania). Proceedings of the Royal Society B DOI: 10.1098/rspb.2016.1902
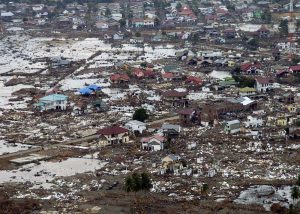
Indian Ocean (Jan. 2, 2005). A village near the coast of Sumatra lays in ruin after the Tsunami that struck South East Asia. Credit: Wikipedia
Devastating tsunamis could be halted before hitting the Earth’s shoreline by firing deep-ocean sound waves at the oncoming mass of water, new research has proposed.
Dr Usama Kadri, from Cardiff University’s School of Mathematics, believes that lives could ultimately be saved by using acoustic-gravity waves (AGWs) against tsunamis that are triggered by earthquakes, landslides and other violent geological events.
AGWs are naturally occurring sounds waves that move through the deep ocean at the speed of sound and can travel thousands of metres below the surface.
AGWs can measure tens or even hundreds of kilometres in length and it is thought that certain lifeforms such as plankton, that are unable to swim against a current, rely on the waves to aid their movement, enhancing their ability to find food.
In a paper published today in the journal Heliyon, Dr Kadri proposes that if we can find a way to engineer these waves, they can be fired at an incoming tsunami and will react with the wave in such a way that reduces its amplitude, or height, and causes its energy to be dissipated over a large area.
By the time the tsunami reaches the shoreline, Dr Kadri writes, the reduced height of the tsunami would minimise the damage caused to both civilians and the environment.
Dr Kadri also believes that this process of firing AGWs at a tsunami could be repeated continuously until the tsunami is completely dispersed.
“Within the last two decades, tsunamis have been responsible for the loss of almost half a million lives, widespread long-lasting destruction, profound environmental effects and global financial crisis,” Dr Kadri said.
“Up until now, little attention has been paid to trying to mitigate tsunamis and the potential of acoustic-gravity waves remains largely unexplored.”
The devastating tsunami that was generated in the Indian Ocean in 2004 after a magnitude 9 earthquake has been recorded as one of the deadliest natural disasters in recent history after it caused over 230,000 deaths in 14 countries.
The energy released on the Earth’s surface by the earthquake and subsequent tsunami was estimated to be the equivalent of over 1,500 times that of the Hiroshima atomic bomb.
In order to use AGWs in tsunami mitigation, engineers will firstly need to devise highly accurate AGW frequency transmitters or modulators, which Dr Kadri concedes would be challenging.
It may also be possible to utilise the AGWs that are naturally generated in the ocean when a violent geological event, such as an earthquake, occurs – essentially using nature’s natural processes against itself.
Indeed, Dr Kadri has already shown that naturally occurring AGWs could be utilised in an early tsunami detection system by placing detection systems in the deep ocean.
Dr Kadri continued: “In practice, generating the appropriate acoustic-gravity waves introduces serious challenges due to the high energy required for an effective interaction with a tsunami. However, this study has provided proof-of-concept that devastating tsunamis could be mitigated by using acoustic-gravity waves to redistribute the huge amounts of energy stored within the wave, potentially saving lives and billions of pounds worth of damage.”
Reference:
Usama Kadri. Tsunami mitigation by resonant triad interaction with acoustic–gravity waves, Heliyon (2017). DOI: 10.1016/j.heliyon.2017.e00234
Note: The above post is reprinted from materials provided by Cardiff University.
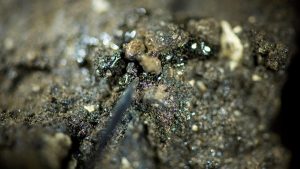
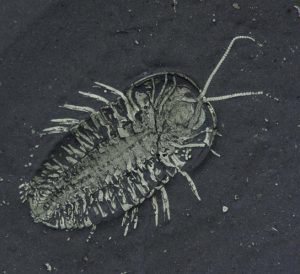
A light photograph of a pyritized, egg-bearing specimen of Triarthrus eatoni. A cluster of nine eggs is present on the right side of the head. Credit: Image courtesy of Western Illinois University
For the past two years, Western Illinois University Assistant Professor of Geology Thomas Hegna has been part of a three-member team conducting research on what are believed to be the first-ever discovered trilobite eggs paired with a fossil of the segmented creature.
The ancient eggs, believed to be about 450 million years old, were found in New York by Markus Martin, an amateur paleontologist and friend to Hegna. The team also includes Assistant Professor Simon Darroch of Vanderbilt University.
Hegna said trilobites most closely resemble modern “rolly-polly” bugs. The trilobites are fossilized inside black shale, which Hegna said likely happened as a result of them being forced out of their habitat by an event such as an undersea mudslide.
“They would have had to be buried quickly to have been preserved,” Hegna said.
Martin collected the rocks in New York and then cracked them in an effort to examine what was inside. The trilobites from this locality are replaced with the mineral pyrite. Hegna said if Martin saw pyrite, also known as fools gold, in the crack, he then used an air abrasion system to go through the layers to get down to the trilobite.
“After Markus showed me the pictures of what he found we had a ‘eureka’ moment,” said Hegna. “My first thought was ‘What else could they be?’ People have found trilobites before, but never found the actual animal and eggs together.”
As fossil invertebrates, trilobites lived exclusively in the ocean during the Paleozoic Era.
After conducting visual research on the unearthed trilobites, Hegna said the team used a micro CT scanner at Vanderbilt University to get a “flipbook of slices” through the preserved trilobites and eggs.
“We digitally dissected the fossils,” said Hegna. “The CT scans help us see if the eggs were attached to the body without disturbing the fossil. It helped verify the egg’s replacement relative to the trilobite.”
The three-member team collaborated to write up the results of their research into a paper that was recently published in the academic journal Geology.
The team also presented its findings at the Central Regional and National meetings of the Geologic Society of America. Hegna said the attention the presentations received helped confirm the findings the team had made through its research.
Prior to the team’s discovery, nothing was known about this early phase of the development of trilobites.
“By knowing more about their reproductive biology, we expand our knowledge about trilobite autecology and can begin to address long-standing research questions about trilobite mating behavior and reproductive strategies,” said the team’s paper. “Pyritized in situ trilobite eggs from the Ordovician of New York (Lorraine Group): Implications for trilobite reproductive biology.”
Many of the specimens that were part of the team’s research were donated to the Peabody Museum at Yale University, where Hegna completed his doctoral research. The museum also received the three-dimensional digital model of the specimens the team produced using the CT scan data.
Reference:
Thomas A. Hegna, Markus J. Martin, Simon A.F. Darroch. Pyritized in situ trilobite eggs from the Ordovician of New York (Lorraine Group): Implications for trilobite reproductive biology. Geology, 2017; G38773.1 DOI: 10.1130/G38773.1
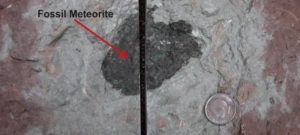
Researchers have discovered minerals from 43 meteorites that landed on Earth 470 million years ago. More than half of the mineral grains are from meteorites completely unknown or very rare in today’s meteorite flow. These findings mean that we will probably need to revise our current understanding of the history and development of the solar system. Credit: Image courtesy of Lund University
Researchers have discovered minerals from 43 meteorites that landed on Earth 470 million years ago. More than half of the mineral grains are from meteorites completely unknown or very rare in today’s meteorite flow. These findings mean that we will probably need to revise our current understanding of the history and development of the solar system.
The discovery confirms the hypothesis presented this summer when geology professor Birger Schmitz at Lund University in Sweden revealed that he had found what he referred to as an “extinct meteorite” — a meteorite dinosaur.
The meteorite was given the name Österplana 065 and was discovered in a quarry outside Lidköping in Sweden. The term ‘extinct’ was used because of its unusual composition, different from all known groups of meteorites, and because it originated from a celestial body that was destroyed in ancient times.
The discovery led to the hypothesis that the flow of meteorites may have been completely different 470 million years ago compared to today, as meteorites with such a composition no longer fall on Earth.
“The new results confirm the hypothesis. Based on 43 micrometeorites, which are as old as Österplana 065, our new study shows that back then the flow was actually dramatically different. So far we have always assumed that the solar system is stable, and have therefore expected that the same type of meteorites have fallen on Earth throughout the history of the solar system, but we have now realised that this is not the case,” says Birger Schmitz.
Birger Schmitz conducted the study together with his colleagues at Lund University, the University of Chicago, and the University of Wisconsin-Madison. The result was unexpected. Birger Schmitz is convinced that something so far unknown but of fundamental importance in the history of the solar system occurred nearly 500 million years ago.
He also emphasises that the new study shows that it is possible to make highly detailed reconstructions of the changes that have occurred in the solar system.
“We can now recreate late history of not only the Earth but of the entire solar system. The scientific value of this new report is greater than the one last summer,” says Birger Schmitz.
The method of reconstructing the meteorite flow was developed at the specially established Astrogeobiology Laboratory in Lund. In the search for the mineral grains (chromium oxides) that fell on Earth together with the meteorites, the researchers used different acids to dissolve several tons of sediment from the ancient seabed. The chromium oxides were subsequently analysed to identify their composition and oxygen isotopes. This made it possible to determine from which type of meteorites the grains originated.
Reference:
Philipp R. Heck, Birger Schmitz, William F. Bottke, Surya S. Rout, Noriko T. Kita, Anders Cronholm, Céline Defouilloy, Andrei Dronov, Fredrik Terfelt. Rare meteorites common in the Ordovician period. Nature Astronomy, 2017; 1: 0035 DOI: 10.1038/s41550-016-0035
An enormous volcanic eruption would not necessarily plunge the world into a new societal crisis, according to a new study of the biggest eruption of the last millennium published in Nature Geoscience.
The 1257 eruption of the Samalas volcano in Indonesia produced a dust cloud that blocked out the sun around the world, and has been blamed for triggering severe food shortages and turmoil worldwide.
But analysis of nearly 200 medieval manuscripts, as well as tree-ring and ice core data spanning more than a thousand years, has revealed Samalas may not be the ultimate cause of the crises, states Dr Sébastien Guillet, lead author of the study at the Faculty of Science, University of Geneva.
Dr Pablo Ortega, a climate scientist at the University of Reading scientist, who was involved in the research, said: “There are numerous indications of extreme weather conditions with serious societal consequences following the eruption, but also show that climatic conditions were back to normal by 1259 over most of Europe.
“While these extreme weather conditions originate at the Samalas eruption, our research shows it only played an aggravating role on the subsequent crises.”
Evidence showed famines in England and Japan had already begun before the eruption occurred. The scientists therefore argue that volcanic cooling might be less likely to lead to global crises than previously thought.
Documents from the years after the Samalas eruption describe the dimming of the sun, leading to cold temperatures, incessant rain and increased cloudiness, with one source from 1258 stating “There was no summer during summer”. Descriptions of crop harvests following the eruption reveal they suffered badly, with wine production in Europe destroyed by “rock hard” grapes.
In addition, chronicles suggest a normal climate had resumed within four years of the eruption, contradicting previous model results suggesting temperature drops of as much as 1ᵒC until 1264.
The scientists found the magnitude of the cooling by the Samalas eruption was very similar to smaller later eruptions, highlighting that the amount of sulphuric ash thrown into the air does not appear to directly correlate with the cooling effect on Earth.
Dr Ortega said: “Should a massive volcanic eruption occur in the next few years, its consequences for society might still be still difficult to predict, as the world in which we live in is more vulnerable and more exposed.”
Reference:
Sébastien Guillet et al. Climate response to the Samalas volcanic eruption in 1257 revealed by proxy records, Nature Geoscience (2017). DOI: 10.1038/ngeo2875
Mount Everest officially stands at 8,848 metres (29,029 feet) above sea level
Scientists will take the tape measure to Mount Everest to determine whether a massive earthquake in Nepal really did knock an inch off the world’s tallest peak.
India’s top surveyor said Tuesday a team of scientists would be sent to neighbouring Nepal to measure Everest in the hope of putting to rest a debate about the true height of the towering mountain.
A deadly 7.8-magnitude earthquake struck Nepal in 2015, killing thousands and altering the landscape across the Himalayan nation.
Satellite data at the time suggested the impact of the quake reduced Everest’s peak—which officially stands at 8,848 metres (29,029 feet) above sea level—by anywhere between a few millimetres and an inch.
But lingering doubt among the scientific community has prompted a fresh expedition to size up the peak, said India’s surveyor general Swarna Subba Rao.
“We will remeasure it,” Rao was quoted as saying by the Press Trust of India (PTI) news agency, adding the team would set off in two months.
“Two years have passed since the major Nepal earthquake and there’s doubt in the scientific community that it did in fact shrink.”
The exercise will require a month for observation and roughly another fortnight for the data to be officially declared.
Another official told AFP that a five-member team would depart for the expedition at winter’s end, and would take measurements using instruments on the ground to gauge the peak’s real height.
The earthquake, Nepal’s deadliest disaster in more than 80 years, is also believed to have shifted the earth beneath the capital Kathmandu several metres to the south.
Note: The above post is reprinted from materials provided by AFP.
An international team of researchers has managed to pinpoint, to within three months, a medieval volcanic eruption in east Asia the precise date of which has puzzled historians for decades. They have also shown that the so-called “Millennium eruption” of Changbaishan volcano, one of the largest in history, cannot have brought about the downfall of an important 10th century kingdom, as was previously thought.
Writing in the journal Quaternary Science Reviews the team describes how new analysis of the partly fossilised remains of a tree killed by the eruption, and ice cores drilled in Greenland, lead them to conclude the eruption occurred in the final months of 946 AD.
The volcano, also known as Mount Paektu, is located on the border between China and North Korea. The team of researchers, led by Dr. Clive Oppenheimer from the University of Cambridge’s Department of Geography, set out to establish an accurate date for the event by making new radiocarbon measurements on a fossilised larch trunk recovered from the Chinese side of the volcano. The tree was 264 years old when it was killed and buried by a flow of larva, hot ashand pumice.
Armed with new information, the modern-day time detectives set about ascertaining when this could have happened. They reckoned the tree would have been standing in 775, a year that was marked by a burst of cosmic rays reaching the Earth. Evidence of this event, in the shape of radiocarbon, was found in one of the tree’s rings and by counting to the outer ring, the team was able to work out when the tree must have perished. Further analysis indicates it had stopped its seasonal growth suggesting Autumn or Winter as the likely time of its demise.
By cross-referencing with ash deposits found in ice cores drilled in northern Greenland, the team could narrow down the calculation to the last 2 or 3 months of 946 AD.
Lead author, Dr Oppenheimer says:
“The Millennium eruption has fascinated scientists and historians for decades because of its size, potential worldwide impacts, and the mystery surrounding when it actually happened. Lacking a clear historical record of the event, there have been dozens of attempts to date the eruption using conventional tree ring techniques. We got lucky thanks to the burst of cosmic radiation that bathed the Earth in the year 775. It was only recently recognised that this left a worldwide signature in trees alive at the time. Now we have a secure date for the eruption at last, we can be more confident in investigating the effects it has on the climate, environment and society.”
Previous attempts to date the eruption had led historians to scan medieval texts for clues. Some argued the event led to the collapse of the Bohai kingdom (698-925 AD), however the findings now prove this predated the eruption. The kingdom spanned a vast area of what was then eastern Manchuria and northern Korea. The new date focuses attention instead on a chronicle from a temple in Japan that reports “white ash falling like snow” on the 3rd November 946 AD. This site is not near any of Japan’s active volcanoes, and is close to where ash from the Millennium eruption has recently been identified in lake sediments. It may well pinpoint the actual date of the eruption since it would only have taken the ash clouds a day or so to reach Japan.
Changbaishan is a site revered by the Koreans. It is steeped in folklore and Koreans see it as their spiritual and ancestral home. Its eruption in 946 was one of the most violent of the last two thousand years and is thought to have discharged around 100 cubic kilometres of ash and pumice into the atmosphere – enough to bury the entire UK knee deep.
Reference:
Clive Oppenheimer et al. Multi-proxy dating the ‘Millennium Eruption’ of Changbaishan to late 946 CE, Quaternary Science Reviews (2017). DOI: 10.1016/j.quascirev.2016.12.024
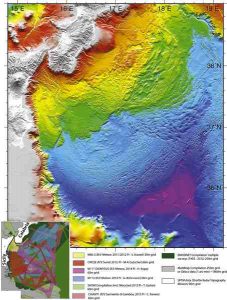
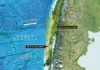
opography of the sea floor east of Sicily based on data of different expeditions. Credit: Marc-André Gutscher, Univ. Brest.
Tectonically, the Mediterranean is extremely active and thus threatened by natural catastrophes. This is underpinned by the recent earthquakes in Central Italy. Over the last few years an international team of researchers with participation of scientists from GEOMAR Helmholtz Centre for Ocean Research Kiel has intensively studied the seafloor south of Sicily and Calabria. In their study, now published in the international scientific journal Earth and Planetary Science Letters, they found evidence for recent tectonic activity on a plate boundary, which can cause strong earthquakes.
Since the early civilizations, the lives of people in Europe, in the Middle East, and in North Africa have been closely linked to the Mediterranean. Natural catastrophes such as volcanic eruptions, earthquakes and tsunamis have repeatedly shattered cultures and states in this area. The reason for this constant threat is that in the Mediterranean the Eurasian plate and the African plate interact. “Unfortunately, the tectonic situation is very complicated, since there are many different fault zones in this area. This makes an exact hazard analysis for certain areas very difficult”, explains Prof. Dr. Heidrun Kopp Geophysicist at GEOMAR Helmholtz Centre for Ocean Research Kiel.
Together with colleagues from France, Italy and Spain, as well as from the Universities of Kiel and Bremen, the scientists now published their results of extensive investigations of the seafloor off the coast of Sicily and Calabria in the current edition of the international scientific journal Earth and Planetary Science Letters. The research campaigns have provided evidence that a plate boundary in the region shows current activity. “From historical natural disasters we know about the geological processes in this area, but so far the causes have not been well known. Now we are beginning to understand them better”, says Professor Kopp, co-author of the study.
The results are based on six ship expeditions since 2010, including three with the German research vessel METEOR. During these expeditions the respective teams have mapped the seafloor using state-of-the-art technologies. In addition, the scientists have used seismic methods to investigate the structure of the ocean floor up to a depth of 30 kilometres.
“We already knew before that sedimentary layers in this region are typical for a situation when one plate slides underneath the other. However, it has been controversial whether these structures are old or whether the so-called subduction process is still active”, explains Heidrun Kopp. The new investigations now show that the plates are still moving – “slowly, but in a way that they can build up stresses in the interior of the Earth”, Professor Kopp adds.
The region investigated in this study is of great interest because in the past it has repeatedly been hit by devastating earthquakes and tsunamis. For example, an earthquake in the Messina strait in 1908 and a subsequent tsunami called for 72,000 lives.
“Of course, with the new findings, we can not predict if and when a severe earthquake will occur. But the more we know about the seafloor and its structure in detail, the better we can estimate where the probability of natural hazards is particularly high. Then actions for hazard mitigation and building regulations can reduce the risks”, says Prof. Dr. Kopp.
Reference:
Marc-André Gutscher et al, Active tectonics of the Calabrian subduction revealed by new multi-beam bathymetric data and high-resolution seismic profiles in the Ionian Sea (Central Mediterranean), Earth and Planetary Science Letters (2017). DOI: 10.1016/j.epsl.2016.12.020
Brachylophosaur canadensis fossil femur (MOR 2598) in field jacket, showing area of sampling for molecular analyses. Credit: Mary Schweitzer
Utilizing the most rigorous testing methods to date, researchers from North Carolina State University have isolated additional collagen peptides from an 80-million-year-old Brachylophosaurus. The work lends further support to the idea that organic molecules can persist in specimens tens of millions of years longer than originally believed and has implications for our ability to study the fossil record on the molecular level.
Elena Schroeter, NC State postdoctoral researcher, and Mary Schweitzer, professor of biological sciences with a joint appointment at the North Carolina Museum of Natural Sciences, wanted to confirm earlier findings of original dinosaur collagen first reported in 2009 from Brachylophosaurus canadensis, a type of hadrosaur, or duck-billed dinosaur, that roamed what is now Montana around 80 million years ago.
“Mass spectrometry technology and protein databases have improved since the first findings were published, and we wanted to not only address questions concerning the original findings, but also demonstrate that it is possible to repeatedly obtain informative peptide sequences from ancient fossils,” Schroeter says.
Collagen is a protein and peptides are the building blocks of proteins. Recovering peptides allows researchers to determine evolutionary relationships between dinosaurs and modern animals, as well as investigate other questions, such as which characteristics of collagen protein allow it to preserve over geological time (or millions of years).
“We collected B. canadensis with molecular investigation in mind,” Schweitzer says. “We left a full meter of sediment around the fossil, used no glues or preservatives, and only exposed the bone in a clean, or aseptic, environment. The mass spectrometer that we used was cleared of contaminants prior to running the sample as well.”
The sample material came from the specimen’s femur, or thigh bone. Using mass spectrometry, the team recovered eight peptide sequences of collagen I, including two that are identical to those recovered in 2009, and six that are new. The sequences show that the collagen I in B. canadensis has similarities with collagen I in both crocodylians and birds, a result we would expect for a hadrosaur, based on predictions made from previous skeletal studies.
“We are confident that the results we obtained are not contamination and that this collagen is original to the specimen,” Schroeter says. “Not only did we replicate part of the 2009 results, thanks to improved methods and technology we did it with a smaller sample and over a shorter period of time.”
“Our purpose here is to build a solid scientific foundation for other scientists to use to ask larger questions of the fossil record,” Schweitzer adds. “We’ve shown that it is possible for these molecules to preserve. Now, we can ask questions that go beyond dinosaur characteristics. For example, other researchers in other disciplines may find that asking why they preserve is important.”
Reference:
Elena R. Schroeter, Caroline J. DeHart, Timothy P. Cleland, Wenxia Zheng, Paul M. Thomas, Neil L. Kelleher, Marshall Bern, Mary H. Schweitzer. Expansion for the Brachylophosaurus canadensis Collagen I Sequence and Additional Evidence of the Preservation of Cretaceous Protein. Journal of Proteome Research, 2017; DOI: 10.1021/acs.jproteome.6b00873
Credit: Image courtesy of Cleveland Museum of Natural History
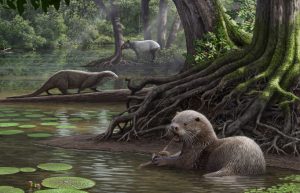
Dr. Xiaoming Wang, Curator and Head of Vertebrate Palaeontology at the Natural History Museum of Los Angeles County and Dr. Denise Su, Curator & Head of Paleobotany and Paleoecology at the Cleveland Museum of Natural History have published a paper with colleagues in the Journal of Systematic Paleontology on the discovery of one of the largest otter species ever found. This discovery was made in the Yunnan Province, Southwestern China by an international team of scientists from the United States, France, and China. It represents groundbreaking research into the evolution of a little-known fossil genus of the otter family.
This newly discovered species of otter, Siamogale melilutra, belongs to an ancient lineage of extinct otters that was previously known only from isolated teeth recovered from Thailand. The discovery of a complete cranium, mandible, dentition and various skeletal elements at Shuitangba provides information about the taxonomy, evolutionary history, and functional morphology of this new species.
“While the cranium is incredibly complete, it was flattened during the fossilization process. The bones were so delicate that we could not physically restore the cranium. Instead, we CT-scanned the specimen and virtually reconstructed it in a computer,” said Dr. Su. The CT restoration revealed a combination of otter-like and badger-like cranial and dental feature, hence its species name, “melilutra,” which refers to meles, Latin for badger, and lutra, Latin for otter.
Siamogale melilutra was about the size of a wolf and weighed approximately 110 lbs., almost twice as large as the largest living otters. It had a large and powerful jaw, with enlarged, bunodont (rounded-cusped) cheek teeth. These characteristics appear to have been adaptations for eating large shellfish and freshwater mollusks, both of which were found in abundance at Shuitangba. “From the vegetation and other animal groups found at Shuitangba, we know that it was a swampy, shallow lake with quite dense vegetation,” said Dr. Su.
“Multiple otter lineages have low-crowned bunodont teeth, leading us to ask the question if this was inherited from a common ancestor or if this was convergent evolution based on common dietary behaviors across different species,” said Dr. Wang, lead author of the paper. “Our phylogenetic analysis suggests that bunodont dentition independently appeared at least three times over the evolutionary history of otters.”
The completeness of the specimens from Shuitangba allows the scientists to better understand the evolutionary history of otters and specifically this enigmatic genus from the Miocene, of which there had been little information. The findings from Shuitangba reveal that Siamogale belongs to one of the oldest and most primitive lineages of the otter family, which goes back at least 18 million years in the form of Paralutra from Europe.
The scientists are working to understand other aspects of the life of Siamogale melilutra.
“The discovery of the otter helps solve some questions about otter relationships, but has opened the door to new questions,” said Dr. Wang. For instance, why was it so large, how did it crack open mollusks and shellfish for food, and how did it move in the water and on land?
“Continued studies by our group will address these fundamental questions and give us a more complete picture of its paleobiology,” said Dr. Su.
Reference:
Xiaoming Wang, Camille Grohé, Denise F. Su, Stuart C. White, Xueping Ji, Jay Kelley, Nina G. Jablonski, Tao Deng, Youshan You, Xin Yang. A new otter of giant size, Siamogale melilutra sp. nov. (Lutrinae: Mustelidae: Carnivora), from the latest Miocene Shuitangba site in north-eastern Yunnan, south-western China, and a total-evidence phylogeny of lutrines. Journal of Systematic Palaeontology, 2017; 1 DOI: 10.1080/14772019.2016.1267666
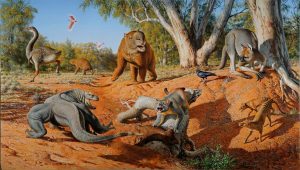
A menagerie of megafauna that inhabited Australia some 45,000 years ago. Credit: Peter Trusler, Monash University
New evidence involving the ancient poop of some of the huge and astonishing creatures that once roamed Australia indicates the primary cause of their extinction around 45,000 years ago was likely a result of humans, not climate change.
Led by Monash University in Victoria, Australia and the University of Colorado Boulder, the team used information from a sediment core drilled in the Indian Ocean off the coast of southwest Australia to help reconstruct past climate and ecosystems on the continent. The core contains chronological layers of material blown and washed into the ocean, including dust, pollen, ash and spores from a fungus called Sporormiella that thrived on the dung of plant-eating mammals, said CU Boulder Professor Gifford Miller.
Miller, who participated in the study led by Sander van der Kaars of Monash University, said the sediment core allowed scientists to look back in time, in this case more than 150,000 years, spanning Earth’s last full glacial cycle. Fungal spores from plant-eating mammal dung were abundant in the sediment core layers from 150,000 years ago to about 45,000 years ago, when they went into a nosedive, said Miller, a professor in the Department of Geological Sciences.
“The abundance of these spores is good evidence for a lot of large mammals on the southwestern Australian landscape up until about 45,000 years ago,” he said. “Then, in a window of time lasting just a few thousand years, the megafauna population collapsed.”
A paper on the subject was published online Jan. 20 in Nature Communications.
The Australian collection of megafauna some 50,000 years ago included 1,000-pound kangaroos, 2-ton wombats, 25-foot-long lizards, 400-pound flightless birds, 300-pound marsupial lions and Volkswagen-sized tortoises. More than 85 percent of Australia’s mammals, birds and reptiles weighing over 100 pounds went extinct shortly after the arrival of the first humans, said Miller.
The ocean sediment core showed the southwest is one of the few regions on the Australian continent that had dense forests both 45,000 years ago and today, making it a hotbed for biodiversity, said Miller, also associate director of CU Boulder’s Institute of Arctic and Alpine Research.
“It’s a region with some of the earliest evidence of humans on the continent, and where we would expect a lot of animals to have lived,” Miller said. “Because of the density of trees and shrubs, it could have been one of their last holdouts some 45,000 years ago. There is no evidence of significant climate change during the time of the megafauna extinction.”
Scientists have been debating the causes of the Australian megafauna extinctions for decades. Some claim the animals could not have survived changes in climate, including a shift some 70,000 years ago when much of the southwestern Australia landscape went from a wooded eucalyptus tree environment to an arid, sparsely vegetated landscape.
Others have suggested the animals were hunted to extinction by Australia’s earliest immigrants who had colonized most of the continent by 50,000 years ago, or a combination of overhunting and climate change, said Miller.
Miller said the extinction may have been caused by “imperceptible overkill.” A 2006 study by Australian researchers indicates that even low-intensity hunting of Australian megafauna – like the killing of one juvenile mammal per person per decade – could have resulted in the extinction of a species in just a few hundred years.
“The results of this study are of significant interest across the archaeological and Earth science communities and to the general public who remain fascinated by the menagerie of now extinct giant animals that roamed the planet – and the cause of their extinction – as our own species began its persistent colonization of Earth,” said van der Kaars.
In 2016 Miller used burned eggshells of the 400-pound bird, Genyornis, as the first direct evidence that humans actually preyed on the Australian megafauna.
The new study also included Research Professor Scott Lehman of INSTAAR. The study was funded in part by the U.S. National Science Foundation and the German Research Foundation.
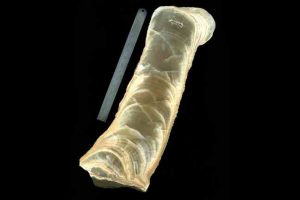
Scanned image of a polished stalagmite showing growth layers. As stalagmites grow, they incorporate trace amounts of naturally occurring magnetic minerals, primarily from soils overlying the cave. The concentration of these magnetic minerals is enhanced with increasing rainfall and can be used as a record of past precipitation history. The ruler is 15 cm long. Credit: Becky Strauss (Minnesota Ph.D. 2016)
Researchers at the University of Minnesota have found that major flooding and large amounts of precipitation occur on 500-year cycles in central China. These findings shed light on the forecasting of future floods and improve understanding of climate change over time and the potential mechanism of strong precipitation in monsoon regions.
The research is published in the published in the Proceedings of the U.S. National Academy of Sciences (PNAS).
“To predict how climate change will impact the future, it’s important to know what has happened in the past,” said Joshua Feinberg, a University of Minnesota associate professor of Earth Sciences and associate director of the Institute for Rock Magnetism, who supervised the research.
“As the variability and intensity of storms increase in the world, we need to reevaluate what the frequency of these major storms could be,” Feinberg said. “We didn’t have the potential to develop these kinds of precipitation records for most of the world, until now. These speleothems provide more than 8,000 years of data that led us to identify with strong confidence the presence of a 500-year cycle,” he added
The research used stalagmites collected from Heshang Cave in central China within the Yangtze River drainage. Researchers measured the magnetic properties of layered stalagmites, or columnar mineral deposits formed in caves by the growth of carbonate minerals from dripping groundwater. As they form over time, stalagmites develop annual layers of the mineral calcite, which are broadly similar to the rings of a tree. They also collect iron-rich magnetic materials within these layers, which originated in overlying soil and are transported into the cave during precipitation and flooding events. These iron-rich minerals are far less than the width of human hair in size, but produce a strong magnetic signal that can be easily measured by modern magnetometers.
Feinberg and his team analyzed the magnetic properties of the layered stalagmites and discovered more than 8,000 years of data within the materials. The magnetic data varied in such a way as to trace out a 500-year cycle of storm variation, where wetter intervals showed an increased concentration of magnetic minerals. This correlates well with the cycles of El Niño Southern Oscillation pattern and measured changes in the amount of the energy from the sun. The cycle can be used to anticipate broad precipitation patterns in the future, and provide insight on climate change in the region over time. Feinberg and his team hope to expand this work wherever possible around the globe.
With the help of the Institute for Rock Magnetism (IRM), based at the University of Minnesota, the group was able to measure the magnetic materials within the speleothems to at a higher resolution and sensitivity than previously possible. Many rocks record the direction and strength of the Earth’s magnetic field at the time of their formation. By measuring these magnetizations, researchers are able to show how tectonic plates have moved around the globe through time, as well as how the Earth’s magnetic field has varies over timescales ranging from millions of years to decades. The short-term behavior of the Earth’s magnetic field has important ramifications for satellites and satellite communication.
Reference:
Zongmin Zhu, Joshua M. Feinberg, Shucheng Xie, Mark D. Bourne, Chunju Huang, Chaoyong Hu, Hai Cheng. Holocene ENSO-related cyclic storms recorded by magnetic minerals in speleothems of central China. Proceedings of the National Academy of Sciences, 2017; 201610930 DOI: 10.1073/pnas.1610930114
A new research article, with lead authors from the University of Gothenburg, gives indications of the best places in Iceland to build thermal power stations.
In Iceland, heat is extracted for use in power plants directly from the ground in volcanic areas. Constructing a geothermal power station near a volcano can be beneficial, since Earth’s mantle is located relatively close to the crust in those areas, making the heat easily accessible. This means that the boreholes do not need to be very deep and the pipes to the power plant can be short.
But placing a power plant near an active volcano is not without risk, as an eruption can easily destroy any human-made construction in its way.
The scientists have now studied three different parts of the divergent ridge (area where the ocean plates are slowly sliding away from each other) that crosses Iceland from southwest to northeast. The slow movement and separation of the ocean plates can cause cracks in Earth’s crust, through which hot magma from the planet’s interior rises to the surface. As a result, a large number of volcanos have emerged along the divergent boundary.
‘The study includes data with extremely high precision. Data from 1967 to the present, together with the very best modelling software, have yielded the best picture to date of the anatomy of the divergent boundary,’ says Md. Tariqul Islam, lead author of the article, which has been published in Journal of Geophysical Research.
Have measured the movement of the ocean plates
One of the best and also most well-known sites for studying a divergent boundary can be found in the Thingvellir National Park in Iceland, adjacent to the country’s biggest lake. Movements smaller than one millimetre can be measured in Thingvellir.
‘When the ocean plates are pulled apart, there is a reduction in pressure at a depth of 10-40 km. This reduction lowers the melting point so that parts of the mantle melt and magma is formed. There are a number of active volcanos of this type along the divergent boundary.’
Using a geodetic GPS, the scientists have now been able to measure the movement of the plates over time. The data used in the study is based on measurements from almost 100 ‘fixed’ measurement points. The information from the measurement points have made it possible to draw maps that show in what way the plates are moving away from each other and how large the deformation zone is.
‘This is a start. The next step will be to use powerful computers to create high-resolution 3D models of the entire zone of divergence. This will enable us to see how the interaction between the different spreading segments and how the different volcanos affect each other,’ says Md. Tariqul Islam.
Reference:
Md. Tariqul Islam, Erik Sturkell, Peter LaFemina, Halldór Geirsson, Freysteinn Sigmundsson, Halldór Ólafsson. Continuous subsidence in the Thingvellir rift graben, Iceland: Geodetic observations since 1967 compared to rheological models of plate spreading. Journal of Geophysical Research: Solid Earth, 2016; 121 (1): 321 DOI: 10.1002/2015JB012306
Researchers find the East Pacific Rise is dynamic as heat is transferred, showing that plate dynamics are driven significantly by additional force of heat drawn from Earth’s core. Credit: Wikimedia Commons
For decades, scientists have theorized that the movement of Earth’s tectonic plates is driven largely by negative buoyancy created as they cool. New research, however, shows plate dynamics are driven significantly by the additional force of heat drawn from the Earth’s core.
The new findings also challenge the theory that underwater mountain ranges known as mid-ocean ridges are passive boundaries between moving plates. The findings show the East Pacific Rise, the Earth’s dominant mid-ocean ridge, is dynamic as heat is transferred.
David B. Rowley, professor of geophysical sciences at the University of Chicago, and fellow researchers came to the conclusions by combining observations of the East Pacific Rise with insights from modeling of the mantle flow there. The findings were published Dec. 23 in Science Advances.
“We see strong support for significant deep mantle contributions of heat-to-plate dynamics in the Pacific hemisphere,” said Rowley, lead author of the paper. “Heat from the base of the mantle contributes significantly to the strength of the flow of heat in the mantle and to the resultant plate tectonics.”
The researchers estimate up to approximately 50 percent of plate dynamics are driven by heat from the Earth’s core and as much as 20 terawatts of heat flow between the core and the mantle.
Unlike most other mid-ocean ridges, the East Pacific Rise as a whole has not moved east-west for 50 to 80 million years, even as parts of it have been spreading asymmetrically. These dynamics cannot be explained solely by the subduction — a process whereby one plate moves under another or sinks. Researchers in the new findings attribute the phenomena to buoyancy created by heat arising from deep in the Earth’s interior.
“The East Pacific Rise is stable because the flow arising from the deep mantle has captured it,” Rowley said. “This stability is directly linked to and controlled by mantle upwelling,” or the release of heat from Earth’s core through the mantle to the surface.
The Mid-Atlantic Ridge, particularly in the South Atlantic, also may have direct coupling with deep mantle flow, he added.
“The consequences of this research are very important for all scientists working on the dynamics of the Earth, including plate tectonics, seismic activity and volcanism,” said Jean Braun of the German Research Centre for Geosciences, who was not involved in the research.
The forces at work
Convection, or the flow of mantle material transporting heat, drives plate tectonics. As envisioned in the current research, heating at the base of the mantle reduces the density of the material, giving it buoyancy and causing it to rise through the mantle and couple with the overlying plates adjacent to the East Pacific Rise. The deep mantle-derived buoyancy, together with plate cooling at the surface, creates negative buoyancy that together explain the observations along the East Pacific Rise and surrounding Pacific subduction zones.
A debate about the origin of the driving forces of plate tectonics dates back to the early 1970s. Scientists have asked: Does the buoyancy that drives plates primarily derive from plate cooling at the surface, analogous with cooling and overturning of lakes in the winter? Or, is there also a source of positive buoyancy arising from heat at the base of the mantle associated with heat extracted from the core and, if so, how much does it contribute to plate motions? The latter theory is analogous to cooking oatmeal: Heat at the bottom causes the oatmeal to rise, and heat loss along the top surface cools the oatmeal, causing it to sink.
Until now, most assessments have favored the first scenario, with little or no contribution from buoyancy arising from heat at the base. The new findings suggest that the second scenario is required to account for the observations, and that there is an approximately equal contribution from both sources of the buoyancy driving the plates, at least in the Pacific basin.
“Based on our models of mantle convection, the mantle may be removing as much as half of Earth’s total convective heat budget from the core,” Rowley said. Much work has been performed over the past four decades to represent mantle convection by computer simulation. Now the models will have to be revised to account for mantle upwelling, according to the researchers.
“The implication of our work is that textbooks will need to be rewritten,” Rowley said.
The research could have broader implications for understanding the formation of the Earth, Braun said. “It has important consequences for the thermal budget of the Earth and the so-called ‘secular cooling’ of the core. If heat coming from the core is more important than we thought, this implies that the total heat originally stored in the core is much larger than we thought.
“Also, the magnetic field of the Earth is generated by flow in the liquid core, so the findings of Rowley and co-authors are likely to have implications for our understanding of the existence, character and amplitude of the Earth’s magnetic field and its evolution through geological time,” Braun added.
Reference:
David B. Rowley, Alessandro M. Forte, Christopher J. Rowan, Petar Glišović, Robert Moucha, Stephen P. Grand, Nathan A. Simmons. Kinematics and dynamics of the East Pacific Rise linked to a stable, deep-mantle upwelling. Science Advances, 2016; 2 (12): e1601107 DOI: 10.1126/sciadv.1601107
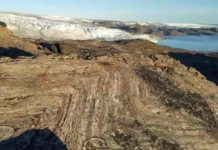
Photo shows Early Jurassic lake sediments (black shales) formed in the Tarim Basin, China. Credit: Oxford Science Blog
Geochemical and biological research offers academics a window into earth history, enabling them to piece together events that occurred before records began. Much of our understanding of past climate change is based on geology, in particular the study of sedimentary rocks deposited in the oceans.
The paper that first recognised and defined Oceanic Anoxic Events (OAEs), written by Oxford professor Hugh Jenkyns and an American colleague, is considered a seminal contribution to geological history, that led the way to numerous studies on the effects of oxygen starvation in the oceans.
The discovery of organic-rich sediments, often described as black shales, at numerous deep-sea drilling sites during the early 1970s, led to the wider acknowledgement of the oceanic impact of climate change. At certain intervals during the Jurassic era, huge bouts of volcanic activity triggered increased concentrations of atmospheric carbon dioxide. This then caused a knock-on greenhouse effect, raising the sea-surface temperature and reducing oxygen levels in large parts of the ocean.
At the same, oceans benefited from increased nutrient levels, and as a result marine algae and bacteria bloomed. As they died, these organisms were preserved in sediments that formed on the sea floor and over time changed into source rocks for oil. It is these phenomena that illustrate the causes and effects of OAEs.
New research, published in Nature Geoscience, has for the first time examined the impact of this type of sediment deposition in lakes. The study demonstrates that lake environments responded in a similar way to climate change, developing the same anoxic conditions as in the oceans.
Led by Earth Sciences post-graduate student Weimu Xu, the work offers insight into how environmental factors have affected lake formation throughout the ages. Weimu and the team studied sediments from one of the largest lakes in Earth history – double the size of England and three times the size of Lake Superior – the largest lake (in surface area) in the world today. This ancient lake formed rapidly in the Sichuan Basin, China, as a result of Toarcian (Early Jurassic) climate change, about 183 million years ago.
Weimu spoke with Science Blog about the study’s key findings and what they can tell us about climate change today.
What is the key finding that you would like people to take from this study?
The extreme effects of past climatic changes are not limited exclusively to oceans. By dating the lake sediments to the Early Jurassic (Toarcian) period, we were able to show that large lakes formed and were affected in the same way as oceans during an OAE.
As the climate warmed, the continents experienced increased rainfall, creating lake reservoirs, which essentially acted like mini-oceans. Lake organisms became more abundant, drawing-down massive amounts of carbon dioxide from the atmosphere, which was eventually deposited into sediments. Overtime, these sediments became source rocks for oil.
Lake environments represent their own unique challenges. Did you encounter any specifically?
The biggest challenge for us was establishing the age of the sediments found in the Sichaun Basin, and proving that they were of similar age to those that formed in the oceans during the Toarcian OAE. The wealth of organic matter found in marine environments makes it quite easy to date an event, by basing it on a fossil’s geological age. But lakes do not have such fossils, which makes it much harder to determine the age of the sediments found.
A study of this nature involves a massive amount of work. How did you manage such an extensive undertaking?
Fortunately I worked with a great team. This work was led by myself, co-designed by M. Ruhl, H.C. Jenkyns and S.P. Hesselbo and involved a total of 11 people. The project is a great example of collaborative research.
We used three distinct methodologies, which would be impossible for any one researcher to master. Colleagues from the University of Durham applied radio-isotopic dating to establish the age of the sediments and colleagues from the British Geological Survey studied the pollen, spores and algae preserved in the sediments. Finally, to give us even more detail to support the age of the sediments, together with colleagues from the University of Bristol and at Shell Global Solutions International B.V., we applied stable carbon-isotope to analyse the sediments, plant and algae remains. These varied techniques convincingly showed that the sediments found, had formed at the same time as the Toarcian OAE.
We were fortunate to be able to partner with experts in these three fields, and of course our industrial partner Shell.
How long did the research take to conduct?
The study lasted from the first sampling trip in November 2013 to completion of this manuscript in September 2016. We also had to factor in time to get permission to publish the findings, from the oil companies providing the data.
Are there any long-term impacts associated with your findings?
There are definite links between the climatic event identified in the Toarcian and present-day global warming. A better understanding of past climate systems could help predict environmental and ecological changes in a future greenhouse world. While the lake we studied existed in the Early Jurassic period, there are lakes today in African and British Columbia for example, that have been affected by global warming. They are becoming more and more anoxic and some are losing fishery stocks as a result. People fixate on warmth, but anoxia goes hand in hand with warmth.
There’s a certain irony in the fact that the conditions which created oil and gas deposits millions of years ago are being recreated much more rapidly by burning of these fossil fuels.
How would you like to see this work used in the future?
Our study directly links lake formation and sediment deposition to the Toarcian OAE. By studying other lake sediments that were around at that time, researchers could establish if they also link to this event. For a better understanding of major climatic change in other intervals of the Earth’s history, people can also look and see if there were other major lake reservoirs that acted similarly.
It would also be useful to understand the impact, not only of carbon deposition, but carbon burial, during times of major climatic change, and how that impacted coal formation. This is something I am very keen to focus on next.
Reference:
Weimu Xu et al. Carbon sequestration in an expanded lake system during the Toarcian oceanic anoxic event, Nature Geoscience (2017). DOI: 10.1038/ngeo2871