Home Blog Page 144

Understanding new evidence of the impact of climate change in the Early Jurassic Period

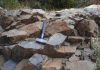
Photo shows Early Jurassic lake sediments (black shales) formed in the Tarim Basin, China. Credit: Oxford Science Blog

Geochemical and biological research offers academics a window into earth history, enabling them to piece together events that occurred before records began. Much of our understanding of past climate change is based on geology, in particular the study of sedimentary rocks deposited in the oceans.

The paper that first recognised and defined Oceanic Anoxic Events (OAEs), written by Oxford professor Hugh Jenkyns and an American colleague, is considered a seminal contribution to geological history, that led the way to numerous studies on the effects of oxygen starvation in the oceans.

The discovery of organic-rich sediments, often described as black shales, at numerous deep-sea drilling sites during the early 1970s, led to the wider acknowledgement of the oceanic impact of climate change. At certain intervals during the Jurassic era, huge bouts of volcanic activity triggered increased concentrations of atmospheric carbon dioxide. This then caused a knock-on greenhouse effect, raising the sea-surface temperature and reducing oxygen levels in large parts of the ocean.

At the same, oceans benefited from increased nutrient levels, and as a result marine algae and bacteria bloomed. As they died, these organisms were preserved in sediments that formed on the sea floor and over time changed into source rocks for oil. It is these phenomena that illustrate the causes and effects of OAEs.

New research, published in Nature Geoscience, has for the first time examined the impact of this type of sediment deposition in lakes. The study demonstrates that lake environments responded in a similar way to climate change, developing the same anoxic conditions as in the oceans.

Led by Earth Sciences post-graduate student Weimu Xu, the work offers insight into how environmental factors have affected lake formation throughout the ages. Weimu and the  team studied sediments from one of the largest lakes in Earth history – double the size of England and three times the size of Lake Superior – the largest lake (in surface area) in the world today. This ancient lake formed rapidly in the Sichuan Basin, China, as a result of Toarcian (Early Jurassic) climate change, about 183 million years ago.

Weimu spoke with Science Blog about the study’s key findings and what they can tell us about climate change today.

What is the key finding that you would like people to take from this study?

The extreme effects of past climatic changes are not limited exclusively to oceans. By dating the lake sediments to the Early Jurassic (Toarcian) period, we were able to show that large lakes formed and were affected in the same way as oceans during an OAE.

As the climate warmed, the continents experienced increased rainfall, creating lake reservoirs, which essentially acted like mini-oceans. Lake organisms became more abundant, drawing-down massive amounts of carbon dioxide from the atmosphere, which was eventually deposited into sediments. Overtime, these sediments became source rocks for oil.

Lake environments represent their own unique challenges. Did you encounter any specifically?

The biggest challenge for us was establishing the age of the sediments found in the Sichaun Basin, and proving that they were of similar age to those that formed in the oceans during the Toarcian OAE. The wealth of organic matter found in marine environments makes it quite easy to date an event, by basing it on a fossil’s geological age. But lakes do not have such fossils, which makes it much harder to determine the age of the sediments found.

A study of this nature involves a massive amount of work. How did you manage such an extensive undertaking?

Fortunately I worked with a great team. This work was led by myself, co-designed by M. Ruhl, H.C. Jenkyns and S.P. Hesselbo and involved a total of 11 people. The project is a great example of collaborative research.

We used three distinct methodologies, which would be impossible for any one researcher to master. Colleagues from the University of Durham applied radio-isotopic dating to establish the age of the sediments and colleagues from the British Geological Survey studied the pollen, spores and algae preserved in the sediments. Finally, to give us even more detail to support the age of the sediments, together with colleagues from the University of Bristol and at Shell Global Solutions International B.V., we applied stable carbon-isotope to analyse the sediments, plant and algae remains. These varied techniques convincingly showed that the sediments found, had formed at the same time as the Toarcian OAE.
We were fortunate to be able to partner with experts in these three fields, and of course our industrial partner Shell.

How long did the research take to conduct?

The study lasted from the first sampling trip in November 2013 to completion of this manuscript in September 2016. We also had to factor in time to get permission to publish the findings, from the oil companies providing the data.

Are there any long-term impacts associated with your findings?

There are definite links between the climatic event identified in the Toarcian and present-day global warming. A better understanding of past climate systems could help predict environmental and ecological changes in a future greenhouse world. While the lake we studied existed in the Early Jurassic period, there are lakes today in African and British Columbia for example, that have been affected by global warming. They are becoming more and more anoxic and some are losing fishery stocks as a result. People fixate on warmth, but anoxia goes hand in hand with warmth.

There’s a certain irony in the fact that the conditions which created oil and gas deposits millions of years ago are being recreated much more rapidly by burning of these fossil fuels.

How would you like to see this work used in the future?

Our study directly links lake formation and sediment deposition to the Toarcian OAE. By studying other lake sediments that were around at that time, researchers could establish if they also link to this event. For a better understanding of major climatic change in other intervals of the Earth’s history, people can also look and see if there were other major lake reservoirs that acted similarly.

It would also be useful to understand the impact, not only of carbon deposition, but carbon burial, during times of major climatic change, and how that impacted coal formation. This is something I am very keen to focus on next.

Reference:
Weimu Xu et al. Carbon sequestration in an expanded lake system during the Toarcian oceanic anoxic event, Nature Geoscience (2017). DOI: 10.1038/ngeo2871

Note: The above post is reprinted from materials provided by University of Oxford.

Researchers find seafloor valleys below West Antarctic glaciers

Representative Image

Glaciologists have uncovered large valleys in the ocean floor beneath some of the massive glaciers flowing into the Amundsen Sea in West Antarctica. Carved by earlier advances of ice during colder periods, the troughs enable warm, salty water to reach the undersides of glaciers, fueling their increasingly rapid retreat.

“These oceanic features are several hundreds to a thousand meters deeper than what we thought before,” said Romain Millan, a graduate student in Earth system science at UCI and lead author of the new study. “It gives new insight into the future fate of these glaciers and the potential influence of warm ocean water that can melt away ice from below.”

The discovery is the result of an analysis of gravity data from airborne NASA Operation IceBridge missions from 2009 to 2014 combined with ice motion measurements made by researchers at the University of California, Irvine (UCI), UCI’s own mass conservation algorithm, and existing bed topography and ice thickness information. The new study has been accepted for publication in Geophysical Research Letters, a journal of the American Geophysical Union.

In the new study, the researchers paid particular attention to sub-ice-shelf cavities in front of the Pine Island, Thwaites, Smith and Kohler glaciers in an area known as the Amundsen Sea Embayment. By obtaining a more high-resolution map of the ocean floor below the glaciers, they were able to detect an unmistakable cavity beneath the Pine Island Glacier and a slightly shallower depression beneath Thwaites Glacier.

“Based on our research, we now have a much clearer picture of what is hiding under these large glaciers located in a particularly vulnerable sector of West Antarctica,” Millan said.

Millan said the study’s most important findings were the gigantic submarine valleys under the Crosson and Dotson ice shelves. The channels start 1,200 meters (3,900 feet) below the masses of ice and slope up to points 500 meters (1,600 feet) beneath Crosson and 750 meters (2,500 feet) beneath Dotson.

Should glaciers in the Amundsen Sea Embayment region of Antarctica completely collapse, the researchers said, the global sea level could rise an additional 1.2 meters (4 feet). As bad as that sounds, they noted, there are some features of the ocean floor topography that might work to slow down the process of glacier retreat.

“We’ve revealed that West Antarctic glaciers include natural pathways for water intrusion, but all water sources are controlled by a 700-meter-deep [2,300-foot-deep] sill which blocks access to the truly warmest waters,” said Eric Rignot, a professor of Earth system science at UCI and co-author of the new study. “This is good news in terms of having these glaciers not fully exposed, but it makes the projections more challenging because all tiny details will be important in controlling ocean heat access to the glaciers.”

He said the findings will be instrumental in guiding future investigations of this region of Antarctica, in particular a major study of Thwaites Glacier by the National Science Foundation and the United Kingdom’s Natural Environment Research Council scheduled for 2018 to 2023.

Reference:
Romain Millan et al, Bathymetry of the Amundsen Sea Embayment sector of West Antarctica from Operation IceBridge gravity and other data., Geophysical Research Letters (2017). DOI: 10.1002/2016GL072071

Note: The above post is reprinted from materials provided by American Geophysical Union.

Conditions right for complex life may have come and gone in Earth’s distant past

This is a 1.9-billion-year-old stromatolite — or mound made by microbes that lived in shallow water — called the Gunflint Formation in northern Minnesota. The environment of the oxygen “overshoot” described in research by Michael Kipp, Eva Stüeken and Roger Buick may have included this sort of oxygen-rich setting that is suitable for complex life. Credit: Eva Stüeken

Conditions suitable to support complex life may have developed in Earth’s oceans — and then faded — more than a billion years before life truly took hold, a new University of Washington-led study has found.

The findings, based on using the element selenium as a tool to measure oxygen in the distant past, may also benefit the search for signs of life beyond Earth.

In a paper published Jan. 18 in the Proceedings of the National Academy of Sciences, lead author Michael Kipp, a UW doctoral student in Earth and Space Sciences, analyzed isotopic ratios of the element selenium in sedimentary rocks to measure the presence of oxygen in Earth’s atmosphere between 2 and 2.4 billion years ago.

Kipp’s UW coauthors are former Earth and space sciences postdoctoral researcher Eva Stüeken — now a faculty member at the University of St. Andrews in Scotland — and professor Roger Buick, who is also a faculty member with the UW Astrobiology Program. Their other coauthor is Andrey Bekker of the University of California, Riverside, whose original hypothesis this work helps confirm, the researchers said.

“There is fossil evidence of complex cells that go back maybe 1 ¾ billion years,” said Buick. “But the oldest fossil is not necessarily the oldest one that ever lived — because the chances of getting preserved as a fossil are pretty low.

“This research shows that there was enough oxygen in the environment to have allowed complex cells to have evolved, and to have become ecologically important, before there was fossil evidence.” He added, “That doesn’t mean that they did — but they could have.”

Kipp and Stüeken learned this by analyzing selenium traces in pieces of sedimentary shale from the particular time periods using mass spectrometry in the UW Isotope Geochemistry Lab, to discover if selenium had been changed by the presence of oxygen, or oxidized. Oxidized selenium compounds can then get reduced, causing a shift in the isotopic ratios which gets recorded in the rocks. The abundance of selenium also increases in the rocks when lots of oxygen is present.

Buick said it was previously thought that oxygen on Earth had a history of “none, then some, then a lot. But what it looks like now is, there was a period of a quarter of a billion years or so where oxygen came quite high, and then sunk back down again.”

The oxygen’s persistence over a long stretch of time is an important factor, Kipp stressed: “Whereas before and after maybe there were transient environments that could have occasionally supported these organisms, to get them to evolve and be a substantial part of the ecosystem, you need oxygen to persist for a long time.”

Stüeken said such an oxygen increase has been guessed at previously, but it was unclear how widespread it was. This research creates a clearer picture of what this oxygen “overshoot” looked like: “That it was moderately significant in the atmosphere and surface ocean — but not at all in the deep ocean.”

What caused oxygen levels to soar this way only to crash just as dramatically?

“That’s the million-dollar question,” Stüeken said. “It’s unknown why it happened, and why it ended.”

“It is an unprecedented time in Earth’s history,” Buick said. “If you look at the selenium isotope record through time, it’s a unique interval. If you look before and after, everything’s different.”

The use of selenium — named after the Greek word for moon — as an effective tool to probe oxygen levels in deep time could also be helpful in the search for oxygen — and so perhaps life — beyond Earth, the researchers said.

Future generations of space-based telescopes, they note, will give astronomers information about the atmospheric composition of distant planets. Some of these could be approximately Earth-sized and potentially have appreciable atmospheric oxygen.

“The recognition of an interval in Earth’s distant past that may have had near-modern oxygen levels, but far different biological inhabitants, could mean that the remote detection of an oxygen-rich world is not necessarily proof of a complex biosphere,” Kipp said.

Buick concluded, “This is a new way of measuring oxygen in a planet’s historical past, to see whether complex life could have evolved there and persisted long enough to evolve into intelligent beings.”

Reference:
Michael A. Kipp, Eva E. Stüeken, Andrey Bekker, and Roger Buick. Selenium isotopes record extensive marine suboxia during the Great Oxidation Event. Proceedings of the National Academy of Sciences, January 2017 DOI: 10.1073/pnas.1615867114

Note: The above post is reprinted from materials provided by University of Washington. Original written by Peter Kelley.

Fossils found reveal unseen ‘footprint’ maker

Fossil of Megistaspis trilobite with preserved digestive structures: crop and intestine with digestive caeca. Credit: University of Adelaide

Fossils found in Morocco from the long-extinct group of sea creatures called trilobites, including rarely seen soft-body parts, may be previously unseen animals that left distinctive fossil ‘footprints’ around the ancient supercontinent Gondwana.

The trilobites were a very common group of marine animals during the 300 million years of the Palaeozoic Era with hard, calcified, external armour-like skeletons over their bodies. They disappeared with a mass extinction event about 250 million years ago which wiped out about 96% of all marine species.

University of Adelaide-led research published in the journal Scientific Reports describes three specimens of the 480 million-year-old trilobite Megistaspis (Ekeraspis) hammondi, up to 30 centimetres long and with preserved soft-parts showing a unique combination of digestive structures and double-branched legs.

“One of the most striking aspects of the discovery is that the first three pairs of legs, those located in the head, bear short, strong spines, while those further back in the thorax and tail are smooth,” says Dr Diego García-Bellido, ARC Future Fellow with the University of Adelaide’s Environment Institute and South Australian Museum.

“We believe this specialised type of legs are the ones that produced the fossil traces named Cruziana rugosa, thought to be from a trilobite but the actual trace-maker was previously unknown. These marine animals ploughed the sediment in the sea floor for food with their forward legs, while holding their heads tilted downward, leaving behind a double groove with parallel scratches made by the spines on the legs.

“The legs we can see on these new fossils match the traces we’ve known as Cruziana rugosa.”

Dr García-Bellido, Juan Gutiérrez-Marco of the Spanish National Research Council and colleagues present for the first time the preserved gut with associated digestive structures plus a complete set of both branches of the trilobite legs.

Cruziana species are one of the most abundant trace fossils found in the lower Palaeozoic sediments across Gondwana but little was known of the particular process producing the distinct Cruziana rugosa traces, where imprints are aligned in sets of up to 12 parallel scratches.

The digestive structures seen also include a unique combination of features: a ‘crop’ together with several pairs of digestive glands or caeca in the upper parts of the digestive system. Other trilobite fossils have been seen with either a crop or the paired digestive caeca but, until now, they have never been found together.

Trilobites have three main parts: a head with eyes, antennae, mouth, and three pairs of appendages or legs; a thorax with many joined segments, each bearing a pair of legs; and a tail with a number of fused segments and several pairs of legs. Trilobite appendages are soft, with an outer branch which is a gill, and an inner branch used for walking and feeding. The preservation of their soft-body is extremely rare, restricted to only a couple of dozen cases, because their external ‘skin’ and internal anatomy was normally lost through scavenging and decay soon after death, or overprinted by the mineralised exoskeleton.

The research involved collaboration between the University of Adelaide/South Australian Museum, the Spanish Research Council and Spanish Geological Survey, and the Universities of Vila Real and Coimbra in Portugal.

Reference:
Juan C. Gutiérrez-Marco, Diego C. García-Bellido, Isabel Rábano, Artur A. Sá. Digestive and appendicular soft-parts, with behavioural implications, in a large Ordovician trilobite from the Fezouata Lagerstätte, Morocco. Scientific Reports, 2017; 7: 39728 DOI: 10.1038/srep39728

Note: The above post is reprinted from materials provided by University of Adelaide.

Inception of the last ice age

Credit/Illustration: H. Patton H. Patton

A new model reconstruction shows in exceptional detail the evolution of the Eurasian ice sheet during the last ice age. This can help scientists understand how climate and ocean warming can effect the remaining ice masses on Earth.

The Eurasian ice sheet was the third largest ice mass during the Last Glacial Maximum some 22,000 years ago. Alongside the Antarctic and North American ice sheets it lowered the global sea level by more than 120 metres. In volume it was almost three times greater than the modern day Greenland ice sheet.

At its peak there was continuous ice cover from present-day Ireland, across Scandinavia and all the way through to western Siberia in the Russian High Arctic.

Twice the Mediterranean

“By itself it lowered global sea level by more than 17 metres. However, despite its global influence, attempts to understand the climatic and oceanographic drivers behind its growth have remained poorly resolved.” says postdoc Henry Patton from the Centre for Arctic Gas Hydrate, Environment and Climate (CAGE)

Until now, that is. Patton and colleagues have recently published comprehensive, high-resolution model experiments, detailing the inception and evolution of the Eurasian ice sheet from its first steps 37,000 years ago through to its maximum extent some 15,000 years later.

They calculated that by that time the ice sheet had grown to a massive volume of more than 7 million cubic kilometres – twice the volume of the Mediterranean Sea. It had an average ice thickness of more than 1.3 km.

The results are published in Quaternary Science Reviews.

Three ice caps that merged

It all started some 37,000 years ago when the planet’s climate started getting colder. This process happened as part of the natural climate cycles on our planet, which are linked to Earth’s movements around the sun and around its own axis. For the last million years or so these cycles have repeated consistently every 100,000 years: 90,000 years of ice age followed by a roughly 10,000 year interglacial warm period.

“The Eurasian Ice Sheet started life off as a number of small and isolated ice caps scattered across Europe and the Arctic. Through time, and with the climate getting increasingly colder this ice grew, with the ice caps eventually merging together to form one coherent ice sheet. The weight of this ice was sufficient to warp the Earth’s crust, making dramatic changes to the coastline.” says Patton.

It is a slow process from human perspective, but from a geological point of view things do happen quite quickly: within 6,000 years these individual ice sheets were large enough to develop fast-flowing ice streams, and within 13,000 years they merged into one continuous ice mass.

“Our model allows us to appreciate the complexities and sensitivities of such a vast ice sheet. The climate that made this ice complex grow was significantly different to the climate we experience today. The issue is further complicated by the fact that once an ice sheet grows large enough, it also begins to heavily influence the regional climate patterns around it.”

Wet in the west, desert in the east

It takes more than just cold temperatures to make an ice sheet grow. It also depends a lot on the amount of snowfall, which enables the ice sheet to accumulate mass. Then, as today, Norway, Britain and Ireland were subject to relatively wet, maritime conditions, with the coastal mountains becoming the perfect setting for ice accumulation.

“Snowfall is a key factor for making an ice sheet grow. In the case of the Eurasian ice sheet complex, snowfall across the mountains of Western Europe was vital for allowing the various ice caps to initially expand.”

The Eurasian ice sheet had an enormous influence on the climate at the continental scale: it absorbed precipitation to such an extent that it created a rain-shadow effect effectively turning much of western Russia and Siberia into a frozen desert where glaciers could not grow.

“As the ice sheet grew thicker, less and less precipitation was able to reach the lee areas east of the complex. This created desert conditions similar to what we see in the Dry Valleys of Antarctica today.” Patton explains.

Traces on the ocean floor

Successfully reconstructing the evolution of an ice sheet through millennia depends on the quality and abundance of observational data available. Distributions of glacial sediments, radiocarbon dates, and geological features found on the landscape are all examples of data that can help guide modelling experiments. As the ice moved it also left traces on the ocean floor.

“Perhaps the most important advance to have aided this modelling work is the quantity and quality of geophysical data from beneath marine areas that we now have access too. Only 10-15 years ago we had a very limited understanding of what Eurasian ice was doing offshore, particularly in the Barents and Kara seas.”

Major portions of this ice sheet were grounded below sea level, just like in West Antarctica today. Understanding the climatic and oceanographic sensitivities of this Eurasian ice sheet, and how it impacted the environment, is thus important also for our present-day ice sheets.

The next step for Patton and colleagues will be to model the collapse of this Eurasian ice-sheet.

“One of the major questions facing us today is how the present ice sheets in Greenland and Antarctica will react to climate change. Simply put, the more we understand of the mechanisms that drove ice sheets to collapse in the past, the better we will be able to predict what will happen in the future.”

Reference:
Henry Patton et al, The build-up, configuration, and dynamical sensitivity of the Eurasian ice-sheet complex to Late Weichselian climatic and oceanic forcing, Quaternary Science Reviews (2016). DOI: 10.1016/j.quascirev.2016.10.009

Note: The above post is reprinted from materials provided by CAGE.

Simple fats, amino acids to explain how life began

Image of the supramolecular structures formed by fatty acids in an aqueous environment taken using the cryo electron microscopy technique-TEM. Credit: Adela Rendón, in collaboration with CIC-BioGUNE

Life is a process that originated 3.5 billion years ago. It emerged when the basic components of the cells that we know today, in other words, inanimate chemical molecules, gradually joined, merged, assembled themselves and interacted. At a given moment they became alive, or what amounts to the same thing, they turned into autonomous systems. As the years passed they gradually evolved until achieving their current complexity and diversity. A piece of research by the UPV/EHU is working on the start of this trajectory by studying how the chemical molecules assembled themselves so that life could begin.

DNA, RNA, proteins, membranes, sugars, …cells are made up of all kinds of components. In biology, and in the studies dealing with the origin of life specifically, it is very common to focus on one of these molecules and put forward hypotheses on how life originated by analysing the specific mechanisms related to it. “Basically, these studies are looking for the ‘molecule of life’, in other words, they set out to establish which was the most important molecule in making this milestone happen,” said Kepa Ruiz-Mirazo, researcher in the Biophysics Unit and of the UPV/EHU’s Department of Logic and Philosophy of Science. However, bearing in mind that “life involves activity among a huge variety of molecules and components, a change of approach has been taking place in recent years and research that takes into account various molecules at the same time is gaining strength,” he added.

Besides emerging in favour of this fresh approach, Ruiz-Mirazo’s group, in collaboration with the University of Montpellier, through an internship of the UPV/EHU PhD student Sara Murillo-Sánchez, has been able to show that interaction exists between some molecules and others. “Our group has expertise in research into membranes that are created in prebiotic environments, in other words, in the study of the dynamics that fatty acids, the precursors of current lipids, may have had. The Montpellier group for its part specialises in the synthesis of the first peptides. So when the knowledge of each group is put together, and when we experimentally blended the fatty acids and the amino acids, we could see that there was a strong synergy between them.”

As they were able to see, the catalysis of the reaction took place when the fatty acids formed compartments. As they are in an aqueous medium, and due to the hydrophobic nature of lipids, they tend to join with each other and form closed compartments; in other words, they take on the function of a membrane; “at that time the membranes obviously weren’t biological but chemical ones,” explained Ruiz-Mirazo. In their experiments they were able to see that the conditions offered by these membranes are favourable for amino acids. “The Montpellier group had the prebiotic reactions of the formation of dipeptides very well characterised, so they were able to see that this reaction took place more efficiently in the presence of fatty acids,” he added.

Bottom upwards, recreating evolution using simple molecules

Besides demonstrating the synergy between fatty acids and amino acids, Ruiz-Mirazo believes it is very important to have conducted the study using basic chemical components, in other words, molecular precursors. “Life emerged out of these basic molecules; therefore, to study its origin we cannot start from the complex phospholipids that are found in today’s membranes. We have demonstrated the formation of the first coming together and formation of chains on the basis of molecular precursors. Or to put it another way, we have demonstrated that it is possible to achieve diversity and complexity in biology by starting from chemistry.”

In his studies, in addition to the experimental work, Ruiz-Mirazo is working in another two spheres so in the end he is studying the origin of life from three pillars or perspectives: “firstly, we have the experimental field; another is based on theoretical models and computational simulations, which we use to analyse the results obtained in the experiments, and the third is a little broader, because we are studying from the philosophical viewpoint what life is, the influence that the conception held about life exerts on the experimental field, since each conception leads you to carry out a specific type of experiment,” he explained. “These three methodologies mutually feed each other: an idea that may emerge in the philosophical analysis leads you to carry out a new simulation, and the results of the simulations mark out the path for designing the experiments. Or the other way round. Most likely we will never manage to find the answer to how life began, but we are working on it: all of us living beings on Earth have the same origin and we want to know how it happened.”

Reference:
Sara Murillo-Sánchez, Damien Beaufils, Juan Manuel González Mañas, Robert Pascal, Kepa Ruiz-Mirazo. Fatty acids’ double role in the prebiotic formation of a hydrophobic dipeptide. Chem. Sci., 2016; 7 (5): 3406 DOI: 10.1039/C5SC04796J

Note: The above post is reprinted from materials provided by University of the Basque Country.

How to be winner in the game of evolution

Jellyfish, polyps and the like belong to a phylum called Cnidaria, one of about 30 major groups that make up the animal kingdom. Credit: Chai Seamaker/Shutterstock

A new study by University of Arizona biologists helps explain why different groups of animals differ dramatically in their number of species, and how this is related to differences in their body forms and ways of life.

For millennia, humans have marveled at the seemingly boundless variety and diversity of animals inhabiting the Earth. So far, biologists have described and catalogued about 1.5 million animal species, a number that many think might be eclipsed by the number of species still awaiting discovery.

All animal species are divided among roughly 30 phyla, but these phyla differ dramatically in how many species they contain, from a single species to more than 1.2 million in the case of insects and their kin. Animals have incredible variation in their body shapes and ways of life, including the plant-like, immobile marine sponges that lack heads, eyes, limbs and complex organs, parasitic worms that live inside other organisms (e.g. nematodes, platyhelminths), and phyla with eyes, skeletons, limbs and complex organs that dominate the land in terms of species numbers (arthropods) and body size (chordates).

Amidst this dazzling array of life forms, one question has remained as elusive as it is obvious: why is it that some groups on the evolutionary tree of animals have branched into a dizzying thicket of species while others split into a mere handful and called it a day?

From the beginnings of their discipline, biologists have tried to find and understand the patterns underlying species diversity. In other words, what is the recipe that allows a phylum to diversify into many species, or, in the words of evolutionary biologists, to be “successful?” A fundamental but unresolved problem is whether the basic biology of these phyla is related to their species numbers. For example, does having a head, limbs, and eyes allow some groups to be more successful and thus have greater species numbers?

In the new study, Tereza Jezkova and John Wiens, both in the University of Arizona’s Department of Ecology and Evolutionary Biology, have helped resolve this problem. They assembled a database of 18 traits, including traits related to anatomy, reproduction, and ecology. They then tested how each trait was related to the number of species in each phylum, and to how quickly species in each phylum multiplied over time (diversification). The results are published in the journal American Naturalist.

Jezkova and Wiens found that just three traits explained most variation in diversification and species numbers among phyla: the most successful phyla have a skeleton (either internal or external), live on land (instead of in the ocean), and parasitize other organisms. Other traits, including those that might seem more dramatic, had surprisingly little impact on diversification and species numbers: evolutionary accomplishments such as having a head, limbs, and complex organ systems for circulation and digestion don’t seem to be primary accessories in the evolutionary “dress for success.”

“Parasitism isn’t correlated with any of the other traits, so it seems to have a strong effect on its own,” said Wiens.

He explained that when a host species splits into two species, it takes its parasite population(s) with it.

“You can have a number of parasite species living inside the same host,” he said, “for example, there could be ten species of nematodes in one host species, and if that host species splits into two, there are 20 species of nematodes. So that really multiplies the diversity.”

The researchers used a statistical method called multiple regression analysis to tease out whether a trait such as parasitic lifestyle is a likely driver of species diversification.

“We tested all these unique traits individually,” Wiens explained, “for example, having a head, having eyes, where the species in a phylum tend to live, whether they reproduce sexually or asexually, whether they undergo metamorphosis or not; and from that we picked six traits that each had a strong effect on their own. We then fed those six traits into a multiple regression model. And then we asked, ‘what combination of traits explains the most variation without including any unnecessary variables?’ — and from that we could reduce it down to three key variables.”

The authors point out that the analysis does not make any assumptions about the fossil record, which is not a true reflection of past biodiversity as it does not reveal most soft-bodied animals or traits like a parasitic lifestyle.

“We wanted to know what explains the pattern of diversity in the species we see today,” said Wiens. “Who are the winners, and who are the losers?”

Marine biodiversity is in jeopardy from human activities such as acidification from carbon emissions, posing an existential threat to many marine animals, Wiens said.

“Many unique products of animal evolution live only in the oceans and could easily be lost, so groups that have survived for hundreds of millions of years could disappear in our lifetime, which is terrible. Many of the animals phyla that are losers in terms of present-day species numbers tend to be in the ocean, and because of human activity, they may go completely extinct.”

The study also suggests that man-made extinction may wage a heavy toll on Earth’s biodiversity due to the effect of secondary extinctions, Wiens explained.

“When a species goes extinct, all its associated species that live in it or on it, are likely to go extinct as well.”

Reference:
Tereza Jezkova, John J. Wiens. What Explains Patterns of Diversification and Richness among Animal Phyla? The American Naturalist, 2017; 000 DOI: 10.1086/690194

Note: The above post is reprinted from materials provided by University of Arizona.

First humans arrived in North America a lot earlier than believed

This horse mandible from Cave 2 shows a number of cut marks on the lingual surface. They indicate that the animal’s tongue was cut out with a stone tool. Credit: Image courtesy of Université de Montréal

The timing of the first entry of humans into North America across the Bering Strait has now been set back 10,000 years.

This has been demonstrated beyond a shadow of a doubt by Ariane Burke, a professor in Université de Montréal’s Department of Anthropology, and her doctoral student Lauriane Bourgeon, with the contribution of Dr. Thomas Higham, Deputy Director of Oxford University’s Radiocarbon Accelerator Unit.

The earliest settlement date of North America, until now estimated at 14,000 years Before Present (BP) according to the earliest dated archaeological sites, is now estimated at 24,000 BP, at the height of the last ice age or Last Glacial Maximum.

The researchers made their discovery using artifacts from the Bluefish Caves, located on the banks of the Bluefish River in northern Yukon near the Alaska border. The site was excavated by archaeologist Jacques Cinq-Mars between 1977 and 1987. Based on radiocarbon dating of animal bones, the researcher made the bold hypothesis that human settlement in the region dated as far back as 30,000 BP.

In the absence of other sites of similar age, Cinq-Mars’ hypothesis remained highly controversial in the scientific community. Moreover, there was no evidence that the presence of horse, mammoth, bison and caribou bones in the Bluefish Caves was due to human activity.

To set the record straight, Bourgeon examined the approximate 36,000 bone fragments culled from the site and preserved at the Canadian Museum of History in Gatineau — an enormous undertaking that took her two years to complete. Comprehensive analysis of certain pieces at UdeM’s Ecomorphology and Paleoanthropology Laboratory revealed undeniable traces of human activity in 15 bones. Around 20 other fragments also showed probable traces of the same type of activity.

“Series of straight, V-shaped lines on the surface of the bones were made by stone tools used to skin animals,” said Burke. “These are indisputable cut-marks created by humans.”

Bourgeon submitted the bones to further radiocarbon dating. The oldest fragment, a horse mandible showing the marks of a stone tool apparently used to remove the tongue, was radiocarbon-dated at 19,650 years, which is equivalent to between 23,000 and 24,000 cal BP (calibrated years Before Present).

“Our discovery confirms previous analyses and demonstrates that this is the earliest known site of human settlement in Canada,” said Burke. It shows that Eastern Beringia was inhabited during the last ice age.”

Beringia is a vast region stretching from the Mackenzie River in the Northwest Territories to the Lena River in Russia. According to Burke, studies in population genetics have shown that a group of a few thousand individuals lived in isolation from the rest of the world in Beringia 15,000 to 24,000 years ago.

“Our discovery confirms the ‘Beringian standstill [or genetic isolation] hypothesis,'” she said, “Genetic isolation would have corresponded to geographical isolation. During the Last Glacial Maximum, Beringia was isolated from the rest of North America by glaciers and steppes too inhospitable for human occupation to the West. It was potentially a place of refuge.”

The Beringians of Bluefish Caves were therefore among the ancestors of people who, at the end of the last ice age, colonized the entire continent along the coast to South America.

The results of Lauriane Bourgeon’s doctoral research were published in the January 6 edition of PLoS One under the title “Earliest Human Presence in North America Dated to the Last Glacial Maximum: New Radiocarbon Dates from Bluefish Caves, Canada.” The article is co-authored by Professor Burke and by Dr. Thomas Higham of Oxford University’s Radiocarbon Accelerator Unit, in the U.K.

Reference:
Lauriane Bourgeon, Ariane Burke, Thomas Higham. Earliest Human Presence in North America Dated to the Last Glacial Maximum: New Radiocarbon Dates from Bluefish Caves, Canada. PLOS ONE, 2017; 12 (1): e0169486 DOI: 10.1371/journal.pone.0169486

Note: The above post is reprinted from materials provided by Université de Montréal.

Study of microbes reveals new insight about Earth’s geology, carbon cycles

Anaerobic bacteria play a central role in cycling carbon and other key elements throughout Earth. A new study shows that the behavior of these microbes is significantly affected by the types of carbon “food” sources available to them. Credit: Argonne National Laboratory

Tiny microbes play a big role in cycling carbon and other key elements through our air, water, soil and sediment. Not only do microbes capture and release carbon, contributing to a cycle that is central to life on Earth, they also release compounds that can change existing minerals and form new ones — in turn shaping the geology of the world around us.

Grasping the biological, chemical and geological processes microbes engage in is critical to understanding and predicting global climate, greenhouse gas emissions, nutrient transport and other natural phenomena.

Researchers who study these processes at the Department of Energy’s (DOE) Argonne National Laboratory have discovered that these microbial communities are significantly affected by the types of carbon “food” sources available. Their findings, published in the journal PLOS ONE, reveal that the type of carbon source affects not only the composition and activity of natural microbial communities, but also in turn the types of mineral products that form in their environment.

“Our study demonstrates the close coupling between biological systems and the environment, two things that most people would consider separately,” said Argonne microbiologist Dion Antonopoulos, a co-author of the study. “We’ve illustrated that as microorganisms alter their environment, their environment then affects the type of microorganisms that are there and their activity.”

For their analysis, the researchers focused on microbial communities found beneath Earth’s surface that perform anaerobic respiration — a chemical process for releasing energy from carbon “food” sources that occurs through a complex series of reactions in an oxygen-free environment. Bacteria take in carbon and release various chemical byproducts into the environment; some byproducts from this process change the minerals found in the surrounding environment.

Researchers took these particular microbial communities and presented them with one of three carbon sources: glucose, a six-carbon sugar; lactate, a four-carbon compound; or acetate, a simple two-carbon compound.

“In addition to choosing acetate, lactate and glucose because of their relative range of complexity, we chose them because they are representative of the types of carbon molecules found, in varying degrees, in subsurface environments,” said Argonne physicist Kenneth Kemner, a co-author of the study.

After providing the bacteria these three food sources, the researchers spent weeks monitoring and measuring changes within these systems. Among other things, they measured the amount and rate at which glucose, lactate and acetate were used by bacteria, the mineral byproducts that formed in their environment and the types of microbes that were present at each time.

“Studying the growth of microbial communities is something many researchers have focused on, but the fact that we’re combining this with the study of changes in the chemistry of these systems, and doing so in a very synchronized way, is what makes this work novel,” said Argonne biogeochemist Ed O’Loughlin, another co-author in the study.

Analyzing these data side by side allowed researchers to see which types of microbes became more or less abundant given a specific set of environmental conditions. Overlapping these data also allowed them to observe how the microbial communities changed alongside changes in environmental conditions over time.

“Past studies used only a few samples and measured changes across just a few points in time, such as the beginning and end state. In our case, we’ve collected data across many more points in time, helping to better characterize the response of the system over time,” O’Loughlin said.

Their analysis showed that a distinct series of changes occurred consistently when microbes were exposed to lactate or acetate-rich environments. However, in glucose-rich environments, they observed varying patterns of changes.

“We think that, because glucose is a larger, more complex compound that can be broken down into many simpler compounds, this opens up more chemical pathways in the community through which it can be used, and that this diverse metabolic potential accounts for the different patterns we’re seeing,” said O’Loughlin.

“Finding out just what those parameters are that make a microbial community follow a particular pattern — that would be a direction for future research,” he said.

Reference:
Man Jae Kwon, Edward J. O’Loughlin, Maxim I. Boyanov, Jennifer M. Brulc, Eric R. Johnston, Kenneth M. Kemner, Dionysios A. Antonopoulos. Impact of Organic Carbon Electron Donors on Microbial Community Development under Iron- and Sulfate-Reducing Conditions. PLOS ONE, 2016; 11 (1): e0146689 DOI: 10.1371/journal.pone.0146689

Note: The above post is reprinted from materials provided by Argonne National Laboratory. Original written by Joan Koka.

Study tracks ‘memory’ of soil moisture

The SMAP observations are providing an unprecedented level of detailed, worldwide information on the amount of water in the top 2 inches (5 centimeters) of soil, collected globally every two to three days. Credit: NASA/JPL-Caltech

The top 2 inches of topsoil on all of Earth’s landmasses contains an infinitesimal fraction of the planet’s water—less than one-thousandth of a percent. Yet because of its position at the interface between the land and the atmosphere, that tiny amount plays a crucial role in everything from agriculture to weather and climate, and even the spread of disease.

The behavior and dynamics of this reservoir of moisture have been very hard to quantify and analyze, however, because measurements have been slow and laborious to make.

That situation changed with the launch in 2015 of a NASA satellite called SMAP (Soil Moisture Active Passive), designed to provide globally comprehensive and frequent measurements of the moisture in that top layer of soil. SMAP’s first year of observational data has now been analyzed and is providing some significant surprises that will help in the modeling of climate, forecasting of weather, and monitoring of agriculture around the world.

These new results are reported in the journal Nature Geoscience, in a paper by SMAP Science Team leader Dara Entekhabi, recent MIT graduate Kaighin McColl PhD ’16, and four others. Entekhabi is a professor in the Ralph M. Parsons Laboratory for Environmental Science and Engineering in MIT’s Department of Civil and Environmental Engineering.

The SMAP observations are providing an unprecedented level of detailed, worldwide information on the amount of water in those top 2 inches (5 centimeters) of soil, collected globally every two to three days. Entekhabi says this is important because this thin layer is a key part of the global water cycle over the continents, and also a key factor in the global energy and carbon cycles.

Precipitation on land, and the evaporation of that moisture from the land, “transfers large amounts of energy” between the continents and the atmosphere, Entekhabi says, and the Earth’s climate would be drastically different without this element. The oceans, containing 97 percent of Earth’s water, provide a major role in storing and releasing heat, but over land that role is provided by the moisture in the topmost layer of the soil, albeit through different mechanisms. That moisture “is a tiny, tiny fraction of the water budget, but it’s sitting at a very critical zone at the surface of the land, and plays a disproportionately critical role in the cycling of water,” he says. “It plays a significant role in moderating climate, on seasonal and annual timescales.”

Understanding these cycles better, thanks to the new data, could help make weather predictions more accurate over longer timescales, which could be an important boon for agriculture. Several federal agencies have already begun using the SMAP data, Entekhabi says, for example, to help make forecasting of drought and flood conditions more accurate.

“The satellite is providing an extraordinary quality of surface soil moisture information that makes this analysis possible,” he says. The satellite’s primary mission of three years is about halfway over, he says, but the team is working on applying for an extended mission that could last as much as a decade.

One of the big surprises from the new data is that this top level of soil preserves a “memory” for weather anomalies, more so than had been predicted from theory and earlier, sparser measurements. Memory refers to the persistence of effects from unusually high or low amounts of rainfall. Contrary to most researchers’ expectations, it turns out that these effects persist for a matter of days, rather than just a few hours. On average, about one-seventh of the amount of rain that falls is still present in that topmost layer of soil three days after it falls—and this persistence is greatest in the driest regions.

The data also show a significant feedback effect that can amplify the effects of both droughts and floods, Entekhabi says. When moisture evaporates from wet soil, it cools the soil in the process, but when the soil gets too dry that cooling diminishes, which can lead to hotter weather and heat waves that extend and deepen drought conditions. Such effects “had been speculated,” he says, “but hadn’t been observed directly.”

The ongoing SMAP mission also provides educational opportunities that help to verify and calibrate the satellite data. With minimal equipment, students can participate in hands-on lessons in data collection, using measurement methods that are considered the gold standard. For example, they can gather a sample of soil in a fixed volume such as a tuna can, and weigh it before and after drying it out. The difference between the two weights gives a precise measure of the soil’s moisture content in that volume, which can be compared with the satellite’s moisture measurement.

Even young students “can carry out ‘gold standard’ measurements, and all it takes is a kitchen scale and an oven,” Entekhabi says. “But it’s very labor-intensive. So we have engaged with schools around the world to do these measurements.”

Reference:
The global distribution and dynamics of surface soil moisture, Nature Geoscience, DOI:10.1038/ngeo2868

Note: The above post is reprinted from materials provided by Massachusetts Institute of Technology.

Angel Falls “World’s Highest Waterfall”

Angel Falls is a waterfall in Venezuela. It is the world’s highest uninterrupted waterfall, with a height of 979 meters (3,212 ft) and a plunge of 807 meters (2,648 ft). The waterfall drops over the edge of the Auyantepui mountain in the Canaima National Park (Spanish: Parque Nacional Canaima), a UNESCO World Heritage site in the Gran Sabana region of Bolívar State.

Deep mantle chemistry surprise: Carbon content not uniform

Olivine crystals containing melt inclusions (the dark spots on the interiors) sampled from the Mariana arc. These crystals were not part of this study, but illustrate what melt inclusions look like. Credit: Alison Shaw

Even though carbon is one of the most-abundant elements on Earth, it is actually very difficult to determine how much of it exists below the surface in Earth’s interior. Analysis by Carnegie’s Marion Le Voyer and Erik Hauri of crystals containing completely enclosed mantle magma with its original carbon content preserved has doubled the world’s known finds of mantle carbon. The findings are published in Nature Communications.

Overall, there is a lot about carbon chemistry that takes place below Earth’s crust that scientists still don’t understand. In particular, the amount of carbon in the Earth’s mantle has been the subject of hot debate for decades. This topic is of interest because the amount of carbon present in the mantle underpins our planet’s geological processes, including triggering volcanic activity and sustaining the biosphere. It also affects our atmosphere when carbon dioxide gas is released by eruptions; volcanic eruptions played a large role in pre-historic climate variations.

But it’s difficult to measure the amount of carbon that exists below the Earth’s surface. Scientists can study the igneous rocks that formed when mantle melts, called magma, rose to the surface, erupted as lava, and hardened again to create a rock that is called basalt. However, the process of ascent and eruption releases almost all the magma’s carbon as carbon dioxide gas, which makes the erupted basaltic rocks poor indicators of the amount of carbon that was in the magmas from which they formed.

“This is how explosive eruptions happen,” Hauri explained. “The sudden catastrophic loss of gas that, before the eruption, was dissolved into the magma at high pressure, but during eruption has nowhere else to go, leaving no post-eruption trace in the hardened basalt of the amount carbon once present.”

But Le Voyer, Hauri, and their team analyzed some basalt samples from the equatorial mid-Atlantic ridge that contained previously unstudied tiny magmatic inclusions, small pockets of pure magma that were completely trapped inside solid crystals that protected them from degassing during magma ascent and eruption. Analysis showed that these inclusions had trapped their original carbon content before being erupted on the seafloor.

“This is only the second time that samples of magma containing their original carbon content have ever been found and analyzed, doubling our knowledge of the region’s carbon chemistry,” Hauri said.

The very first samples containing their original carbon were also revealed at Carnegie, by Hauri and Brown University professor Alberto Saal, in 2002. Those samples came from the Pacific seafloor. Comparison of the data for these two samples revealed that the mantle’s carbon content is much less uniform than scientists had previously predicted, varying by as much as two orders of magnitude in different parts of the mantle.

“Our discovery that mantle carbon has a more complex distribution than previously thought has many implications for how mantle processes may vary by location,” added Le Voyer, who conducted this research as a postdoc at Carnegie and is now at the University of Maryland.

Note: The above post is reprinted from materials provided by Carnegie Institution for Science.

Modeling magma to find copper

This is an activ magmatic system. Credit: UNIGE

Copper is an essential element of our society with main uses in the field of electricity and electronics. About 70% of the copper comes from deposits formed several million years ago during events of magma degassing within the Earth’s crust just above subduction zones. Despite similar ore forming processes, the size of these deposits can vary orders of magnitude from one place to another, the main reason of which has remained unclear. A new study led by researchers from the Universities of Geneva (UNIGE, Switzerland) and the Saint-Etienne (France), to be published in Scientific Reports, suggests that the answer may come from the volume of magma emplaced in the crust and proposes an innovative method to better explore these deposits.

Magmas formed above subduction zones contain important amount of water that is essentially degassed during volcanic eruptions or upon magma cooling and solidification at depth. The water escaping from the crystallizing magma at several kilometers below surface carries most of the copper initially dissolved in the magma. On its way toward the surface the magmatic fluids cool and deposit copper in the fractured rocks forming giant metal deposits such as those exploited along the Andean Cordillera.

By modeling the process of magma degassing, the researchers could reproduce the chemistry of the fluids that form metal deposits. “Comparing the model results with available data from known copper deposits, we could link the timescales of magma emplacement and degassing in the crust, the volume of magma, and the size of the deposit”, explains Luca Caricchi, researcher at the UNIGE. The scientists also propose a new method to estimate the size of the deposits, based on high-precision geochronology, one of the specialties of the Department of Earth Sciences in UNIGE’s Science Faculty.

This technique is a new add-in in the prospector toolbox with the possibility to identify deposits with the best potential, early in the long and costly process of mineral exploration. It is anticipated that the computational approach developed in this study can also provide important insights on the role of magma degassing as a potential trigger for volcanic eruptions.

Reference:
Cyril Chelle-Michou et al. Tempo of magma degassing and the genesis of porphyry copper deposits, Scientific Reports (2017). DOI: 10.1038/srep40566

Note: The above post is reprinted from materials provided by University of Geneva.

How the darkness and the cold killed the dinosaurs

Tyrannosaurus Rex “Tristan”, on display at the Museum für Naturkunde – Leibniz Institute for Evolution and Biodiversity Science in Berlin with which PIK is cooperating. Credit: Carola Radke/Museum für Naturkunde

Sixty-Six million years ago, the sudden extinction of the dinosaurs started the ascent of the mammals, ultimately resulting in humankind’s reign on Earth. Climate scientists now reconstructed how tiny droplets of sulfuric acid formed high up in the air after the well-known impact of a large asteroid and blocking the sunlight for several years, had a profound influence on life on Earth. Plants died, and death spread through the food web. Previous theories focused on the shorter-lived dust ejected by the impact. The new computer simulations show that the droplets resulted in long-lasting cooling, a likely contributor to the death of land-living dinosaurs. An additional kill mechanism might have been a vigorous mixing of the oceans, caused by the surface cooling, severely disturbing marine ecosystems.

“The big chill following the impact of the asteroid that formed the Chicxulub crater in Mexico is a turning point in Earth history,” says Julia Brugger from the Potsdam Institute for Climate Impact Research (PIK), lead author of the study to be published in the Geophysical Research Letters. “We can now contribute new insights for understanding the much debated ultimate cause for the demise of the dinosaurs at the end of the Cretaceous era.” To investigate the phenomenon, the scientists for the first time used a specific kind of computer simulation normally applied in different contexts, a climate model coupling atmosphere, ocean and sea ice. They build on research showing that sulfur- bearing gases that evaporated from the violent asteroid impact on our planet’s surface were the main factor for blocking the sunlight and cooling down Earth.

In the tropics, annual mean temperature fell from 27 to 5 degrees Celsius

“It became cold, I mean, really cold,” says Brugger. Global annual mean surface air temperature dropped by at least 26 degrees Celsius. The dinosaurs were used to living in a lush climate. After the asteroid’s impact, the annual average temperature was below freezing point for about 3 years. Evidently, the ice caps expanded. Even in the tropics, annual mean temperatures went from 27 degrees to mere 5 degrees. “The long-term cooling caused by the sulfate aerosols was much more important for the mass extinction than the dust that stays in the atmosphere for only a relatively short time. It was also more important than local events like the extreme heat close to the impact, wildfires or tsunamis,” says co-author Georg Feulner who leads the research team at PIK. It took the climate about 30 years to recover, the scientists found.

In addition to this, ocean circulation became disturbed. Surface waters cooled down, thereby becoming denser and hence heavier. While these cooler water masses sank into the depths, warmer water from deeper ocean layers rose to the surface, carrying nutrients that likely led to massive blooms of algae, the scientists argue. It is conceivable that these algal blooms produced toxic substances, further affecting life at the coasts. Yet in any case, marine ecosystems were severely shaken up, and this likely contributed to the extinction of species in the oceans, like the ammonites.

“It illustrates how important the climate is for all lifeforms on our planet”

The dinosaurs, until then the masters of Earth, made space for the rise of the mammals, and eventually humankind. The study of Earth’s past also shows that efforts to study future threats by asteroids have more than just academic interest. “It is fascinating to see how evolution is partly driven by an accident like an asteroid’s impact — mass extinctions show that life on Earth is vulnerable,” says Feulner. “It also illustrates how important the climate is for all lifeforms on our planet. Ironically today, the most immediate threat is not from natural cooling but from human-made global warming.”

Reference:
Julia Brugger, Georg Feulner, Stefan Petri. Baby, it’s cold outside: Climate model simulations of the effects of the asteroid impact at the end of the Cretaceous. Geophysical Research Letters, 2016; DOI: 10.1002/2016GL072241

Note: The above post is reprinted from materials provided by Potsdam Institute for Climate Impact Research (PIK).

Ice Age ‘skeleton crew’ offers insights for today’s endangered species

Researchers tracked the history of some of the world’s largest mammals and the roles they played within their respective environments. Credit: Illustration by Matt Davis

The ghosts of Ice Age mammals can teach valuable, real-world lessons about what happens to an ecosystem when its most distinct species go extinct, according to a Yale University study.

Researcher Matt Davis tracked the history of some of the world’s largest mammals and the roles they played within their respective environments. The findings appear in the Jan. 11 online edition of the journal Proceedings of the Royal Society B.

On the plus side, Davis said, the Ice Age wasn’t as hard on functional diversity — the role that an animal plays within an ecosystem — as previously thought. Animals that survived the Ice Age, such as the beaver, proved to be just as distinct as those that did not survive. On the minus side, Davis found, our planet has reached a point where losing even a handful of key mammals will leave as much of a gap as all of the Ice Age mammal extinctions put together.

The planet lost about 38% of its large-mammal, functional diversity during the Ice Age. Those species included woolly mammoths, giant ground sloths, stout-legged llamas, and giant beavers.

“You can think of it like a big tent where every animal is holding a pole to keep the tent up,” said Davis, a graduate student in Yale’s Department of Geology and Geophysics. “We lost a lot of species when humans first arrived in North America, so part of our tent fell down — but not as big of a part as we previously thought. However, now we only have a few animals left holding up those poles. If they die, the whole tent could collapse.”

The study looked at 94 large mammal species in North America over the last 50,000 years. These included Columbian mammoths, Canadian lynx, long-horned bison, and sabertooths, as well as cougars, moose, coyotes, elk, raccoons, dogs, and cows.

One aim of the study was to examine the relationship between functional diversity and extinction risk: Were the most distinct species the ones most at risk? Davis found that for large Ice Age mammals in North America, distinct species with unique traits were not more likely to go extinct. That is why the Ice Age extinctions were not as harsh on the surrounding ecosystems, Davis said.

In the case of mammoths, nothing was able to replace their lost function — essentially, being really, really big — once they were gone. However, Davis found that European domestic animals, introduced later, did restore some functional diversity. Another example of this is burros, which came along after the extinction of Shasta ground sloths. Both the burro and the Shasta ground sloth share similar diets and body masses.

For today’s species, such redundancies in functionality are much less frequent, Davis explained. Vulnerable species like polar bears, jaguars, and giant anteaters have no functional equivalent.

“Examining the past through the fossil record actually allows us to better predict future extinctions,” Davis said. “We can’t understand how valuable or vulnerable species are today without considering the ‘ghosts’ of those species that died before them.”

Partial funding for the study came from the Yale Institute for Biospheric Studies, the Geological Society of America, the American Society of Mammalogists, and a Smithsonian Institution Predoctoral Fellowship.

Reference:
Matt Davis. What North America’s skeleton crew of megafauna tells us about community disassembly. Proceedings of the Royal Society B: Biological Sciences, 2017; 284 (1846): 20162116 DOI: 10.1098/rspb.2016.2116

Note: The above post is reprinted from materials provided by Yale University. Original written by Jim Shelton.

The world’s largest Amethyst geode

Name: The Empress of Uruguay
Tall: 3.27 Meters
Weigh: 2.5 Tonne

Named The Empress of Uruguay, this is the largest Amethyst Geode in the world. Standing a staggering 3.27 meters tall, the geode weighs 2.5 tonne! Each of the thousands of perfect crystals was formed inside the geode exactly as you see them now, 130 millions years ago.

Discovered in 2007, it took 3 months to extract the geode from the solid basalt which surrounded it. Fortunately it was offered to René as soon as it was excavated otherwise it may have been snapped up by an international natural history museum elsewhere in the world.

When you stand before her and gaze upon the deep purple crystals, you will understand why René did not hesitate for a moment to add this world class specimen to his already impressive collection.

It took a further 2 months to carefully remove small sections of crystals and polish the edge to reveal the opening. Each piece of the Empress was shipped to Atherton and sold in the gift shop.

Note: The above post is reprinted from materials provided by Crystal Cave.

Paleontologists classify mysterious ancient cone-shaped sea creatures

This illustration shows the hyolith Haplophrentis extending the tentacles of its feeding organ (lophophore) from between its shells. The paired spines, or ‘helens’, are rotated downwards to prop the animal up off the ocean floor. Credit: Danielle Dufault/ Royal Ontario Museum

One branch on the tree of life is a bit more crowded today. A team of scientists led by 20-year-old University of Toronto (U of T) undergraduate student Joseph Moysiuk has finally determined what a bizarre group of extinct cone-shaped animals actually are.

Known as hyoliths, these marine creatures evolved over 530 million years ago during the Cambrian period and are among the first animals known to have produced mineralized external skeletons.

Long believed to belong to the same family as snails, squid and other molluscs, a study published today in the scientific journal Nature shows that hyoliths are instead more closely related to brachiopods — a group of animals which has a rich fossil record, although few living species remain today.

Brachiopods have a soft body enclosed between upper and lower shells (valves), unlike the left and right arrangement of valves in bivalve molluscs. Brachiopods open their valves at the front when feeding, but otherwise keep them closed to protect their feeding apparatus and other body parts.

Although the skeletal remains of hyoliths are abundant in the fossil record, key diagnostic aspects of their soft-anatomy remained critically absent until now.

“Our most important and surprising discovery is the hyolith feeding structure, which is a row of flexible tentacles extending away from the mouth, contained within the cavity between the lower conical shell and upper cap-like shell,” said Moysiuk. “Only one group of living animals — the brachiopods — has a comparable feeding structure enclosed by a pair of valves. This finding demonstrates that brachiopods, and not molluscs, are the closest surviving relatives of hyoliths.

“It suggests that these hyoliths fed on organic material suspended in water as living brachiopods do today, sweeping food into their mouths with their tentacles,” Moysiuk said.

Moysiuk, who studies Earth sciences and ecology & evolutionary biology, completed this project as part of the Research Opportunity Program at U of T, a special undergraduate research program in the Faculty of Arts & Science.

The distinctive appearance and structure of the hyolith skeleton has obstructed previous attempts to classify these animals. All hyoliths had an elongated, bilaterally symmetrical cone-shaped shell and a smaller cap-like shell which covered the opening of the conical shell (known as an operculum). Some species also bore a pair of rigid, curved spines (known as helens) that protruded from between the conical shell and operculum — structures with no equivalents in any other group of animals.

Examination of the orientation of the helens in multiple hyolith specimens from the Burgess Shale suggests that these spines may have been used like stilts to lift the body of the animal above the sediment, elevating the feeding apparatus to enhance feeding.

Moysiuk and coauthors Martin Smith at Durham University in the United Kingdom, and Jean-Bernard Caron at the Royal Ontario Museum (ROM) and U of T were able to complete the descriptions based mainly on newly discovered fossils from the renowned Cambrian Burgess Shale in British Columbia.

“Burgess Shale fossils are exceptional because they show preservation of soft tissues which are not usually preserved in normal conditions,” said Caron, Moysiuk’s research supervisor, who is the senior curator of invertebrate palaeontology at the ROM and an associate professor in U of T’s Departments of Earth Sciences and Ecology & Evolutionary Biology.

“Although a molluscan affinity was proposed by some authors, this hypothesis remained based on insufficient evidence. Hyoliths became an orphaned branch on the tree of life, an embarrassment to paleontologists. Our most recent field discoveries were key in finally cracking their story, around 175 years after the first description of a hyolith.”

Caron led recent fieldwork activities to the Burgess Shale which resulted in the discovery of many specimens that form the basis of this study. The key specimens came from recently discovered deposits near Stanley Glacier and Marble Canyon in Kootenay National Park, about 40 kilometres southeast of the original Burgess Shale site in Yoho National Park.

The Burgess Shale is one of the most important fossil deposits for studying the origin and early evolution of animals that took place during the Cambrian period, starting about 542 million years ago. Hyoliths are just one of the profusion of animal groups that characterize the fauna of the ‘Cambrian Explosion’. They became a diverse component of marine ecosystems around the globe for more than 280 million years, only to go extinct 252 million years ago, prior to the evolution of the first dinosaurs.

“Resolving the debate over the hyoliths adds to our understanding of the Cambrian Explosion, the period of rapid evolutionary development when most major animal groups emerge in the fossil record,” said Smith, who started this research at the University of Cambridge and who is now a lecturer in paleontology at Durham University. “Our study reiterates the importance of soft tissue preservation from Burgess Shale-type deposits in illuminating the evolutionary history of creatures about which we still know very little.”

The Burgess Shale, from which the specimens were recovered from several locations, is part of the Canadian Rocky Mountain Parks World Heritage Site. It is one of the most important fossil deposits for understanding the origin and early evolution of animals that took place during the Cambrian Explosion starting about 542 million years ago.

Parks Canada protects this globally significant site, and supports peer-reviewed scientific research that continues to enhance our understanding of these rich paleontological deposits. This discovery adds another element to the dramatic story of early animal evolution that Parks Canada guides share enthusiastically with hundreds of park visitors every year.

Funding for the research was provided primarily by the Royal Ontario Museum and a Natural Sciences and Engineering Research Council of Canada Discovery Grant to Caron.

Reference:
Joseph Moysiuk, Martin R. Smith, Jean-Bernard Caron. Hyoliths are Palaeozoic lophophorates. Nature, 2017; DOI: 10.1038/nature20804

Note: The above post is reprinted from materials provided by University of Toronto.

Conifer cones bear their ages well, and still move it

Photographs of the Keteleeria sp. (left) and Pinus sp. 1 (middle) cones investigated in the study, and an x-ray-computed tomography image of the Pinus sp. 2 cone (right). Credit: © Plant Biomechanics Group

Fossil conifer cones can still move their individual seed scales after millions of years. This is the finding of a study conducted by the biologists Dr. Simon Poppinga and Prof. Dr. Thomas Speck from the Plant Biomechanics Group and Botanical Garden of the University of Freiburg.

The cones analyzed in the study therefore represent the oldest known plant structures that are still capable of movement and can also serve as a model for bioinspired technical applications with low maintenance requirements. The researchers published their findings in the journal Scientific Reports.

Cones from coniferous trees like pines open in response to dry conditions and close in response to wet conditions — a mechanism that enables them to release their seeds under favorable environmental conditions. In addition, the movement of the individual scales is passive, meaning that it does not require any metabolic energy.

These attributes have recently brought conifer cones to the attention of scientists, who aim to use them as biological models for the development of technical devices capable of autonomous movement.

Poppinga and Speck have now discovered that the scales continue to function in this way for an extremely long time: Fossil cones from the Eemian interglacial period, about 126,000 to 113,000 years ago, as well as the middle Miocene, about 16.5 to 11.5 million years ago, still react to changes in moisture by moving their scales. With the help of x-ray-computed tomography, the researchers demonstrated that the cones are preserved by coalification during the fossilization process and that the fossilized cones show only very few mineral inclusions. This ensures that the fine structures responsible for moisture-dependent movement remain intact.

Reference:
Simon Poppinga, Nikolaus Nestle, Andrea Šandor, Bruno Reible, Tom Masselter, Bernd Bruchmann, Thomas Speck. Hygroscopic motions of fossil conifer cones. Scientific Reports, 2017; 7: 40302 DOI: 10.1038/srep40302

Note: The above post is reprinted from materials provided by Albert-Ludwigs-Universität Freiburg.

Release of water shakes Pacific Plate at depth

The V-shape to the east of Australia is formed by the underwater Lau Ridge (left arm of the V) and the Tonga archipelago and trench (right arm). At the trench, the dense, cold Pacific plate dives beneath the Tongan and Australian plates to be devoured in the Earth’s mantle. The V is slowly opening wider because the trench is “rolling back” into the Pacific Plate faster in the north than in the south. Illustration: Shutterstock

Tonga is a seismologists’ paradise, and not just because of the white-sand beaches. The subduction zone off the east coast of the archipelago racks up more intermediate-depth and deep earthquakes than any other subduction zone, where one plate of Earth’s lithosphere dives under another, on the planet.

“Tonga is such an extreme place, and that makes it very revealing,” said S. Shawn Wei, a seismologist who earned his doctorate at Washington University in St. Louis and now is a postdoctoral fellow at the Scripps Institution of Oceanography in San Diego.

That swarm of earthquakes is catnip for seismologists because they still don’t understand what causes earthquakes to pop off at such great depths.

Below about 40 miles, the enormous heat and pressure in Earth’s interior should keep rock soft and pliable, more inclined to ooze than to snap. So triggering an earthquake at depth should be like getting molasses to shatter.

In the Jan. 11 issue of Science Advances, a team of seismologists from Washington University, Scripps Institution of Oceanography and Carnegie Institution for Science analyze the data from 671 earthquakes that occurred between 30 and 280 miles beneath the Earth’s surface in the Pacific Plate as it descended into the Tonga Trench.

Analyzing data from several seismic surveys with both ocean bottom seismometers and island-based seismic stations, they were surprised to find a zone of intense earthquake activity in the downgoing slab, which they call a seismic belt.

The pattern of the activity along the slab provided strong evidence that the earthquakes are sparked by the release of water at depth.

“It looks like the seismic belt is produced by the sudden flushing of water when the slab warms up enough that the hydrated minerals can decompose and give off their water,” said Doug Wiens, the Robert S. Brookings Distinguished Professor of earth and planetary sciences in Arts & Sciences at Washington University.

“The pressure of the fluid causes earthquakes in the same way that wastewater injected into deep wells causes them in Oklahoma,” Wiens said. “Although the details are very different when it’s many miles down, it’s the same physical process. ”

A champion subduction zone

The Tonga Trench holds a place of honor in the annals of seismology because this is where American scientists, invited to investigate the grumbling earth by the King of Tonga, got their first clear glimpse of a subduction zone in action.

The classic paper that scientists Bryan Isacks, Jack Oliver and Lynn Sykes published in 1968 led to the acceptance of the then speculative theory of plate tectonics.

In 1985, the Japanese seismologist Hitoshi Kawakatsu discovered something else interesting in Tonga: the descending slab has a double seismic zone. “There are two zones of earthquakes in the slab,” Wiens said. “One is in the top part of the slab and the other is toward the middle of the slab.”

Wiens, who has been studying the Tonga subduction zone since the early 1990s, says it is a great natural laboratory because its characteristics are so extreme. The ocean floor taking the dive there is older and colder than most other subducting slabs. It is also moving very fast.

“In the northern part of the Tonga Trench, the slab is moving 9 inches a year,” said Wiens. “The San Andreas Fault, by comparison, moves 2 inches a year.”

And the subducting slab has another useful quirk. It isn’t descending into the trench at uniform speed but instead going down much faster at the northern end of the trench than at the southern end.

This means that the slab warms up at different rates along its length. “It’s like pushing a cold bar of chocolate into a bubbling pan of pudding,” said Wiens. “If you push slowly, the chocolate has a chance to warm up and melt, but if you push fast, the chocolate stays cold longer.”

This is a perfect setup for studying temperature-dependent phenomenon.

The surprise

When Wei analyzed the data from Tonga, he saw the double seismic zone the Japanese scientist had discovered. “We’re pretty much to follow up on that 1985 paper,” he said.

“Where the double seismic zone started to break down in Tonga, however, we saw this really active area of earthquakes that we named the seismic belt,” Wiens said. “That was a surprise; we weren’t expecting it.”

Why the sudden burst of earthquakes as the slab descended? The telling clue was that the burst angled upward from north to south along the slab. The faster the slab was moving, the deeper the earthquakes, and the slower the slab, the shallower the earthquakes.

The angled seismic belt told the scientists that the mechanism triggering earthquakes was temperature sensitive. “We think the earthquakes occur when the mantle in the downgoing slab gets hot enough to release its water,” Wiens said.

“People have proposed this mechanism before, but this is the smoking gun, ” Wiens continued. “The seismicity is changing depth in a way that’s correlated with the subduction rate and the slab temperature. ”

The deep water cycle

But where does the water come from, and why is it released suddenly?

The interior of the Pacific plate is exposed to seawater as the plate is pulled under the Tonga Plate and faults open on its upper surface, Wei said. Seawater reacts with the rock to form hydrous minerals (minerals that include water in their crystal structure) in the serpentine family. The most abundant of these serpentine minerals is a green stone called antigorite.

But as the slab descends and the temperature and pressure increases, these hydrous minerals become unstable and break down through dehydration reactions, Wei said.

This sudden release of large amounts of water is what triggers the earthquakes.

“The temperature we predict in the earthquake locations strongly suggests that minerals dehydrate very deep in the Tonga subduction zone, said Peter van Keken, a staff scientist at the Carnegie Institution for Science and a co-author on the paper.

The “phase diagrams” for antigorite dehydration reactions overlap neatly with the pressure and temperature of the slab at the seismic belt.

But the phase diagrams aren’t that reliable at these extreme temperatures and depths. So Wei, for one, would like to see more laboratory data on the behavior of antigorite and other hydrous minerals at high temperature and pressure to nail down the mechanism.

For him, the most exciting part of the research is the evidence of water 180 miles beneath the surface.

” We currently don’t know how much water gets to the deep Earth or how deep the water can finally reach,” Wei said. “In other words, we don’t know how much water is stored in the mantle, which is a key factor for the Earth’s water budget.”

The water down there may be as important to us as the water up here. It is beginning to look like water is the lubricant that oils the machine that recycles Earth’s crust.

“The Tonga dataset is such a great treasure chest that we’ll be exploiting for many years to come,” said Wei. “Tonga has many more stories to tell us about the Earth’s interior.”

Reference:
“Slab temperature controls on the Tonga double seismic zone and slab mantle dehydration,” Science Advances, DOI: 10.1126/sciadv.1601755

Note: The above post is reprinted from materials provided by Washington University in St. Louis.

High rates of PTSD and other mental health problems after great east Japan earthquake

Japan Tsunami 2011

The devastating 2011 earthquake, tsunami, and resulting nuclear disaster in Japan had a high mental health impact — with some effects persisting several years later, according to a comprehensive research review in the January/February issue of the Harvard Review of Psychiatry, published by Wolters Kluwer.

Although symptoms of posttraumatic stress disorder (PTSD) related to the Great East Japan Earthquake seem to have improved over time, there is evidence of persistent problems with depression, reports the study by Dr. Shuntaro Ando of Tokyo Metropolitan Institute of Medical Science and colleagues. Their findings highlight specific areas and groups of disaster victims who may have a special need for long-term mental healthy support.

Evidence Shows Mental Health Impact of ‘Triple Disaster’

On March 11, 2011, a magnitude 9.0 earthquake occurred off the Pacific Coast of northeastern Japan. A resulting tsunami damaged the Fukushima-Daiichi Nuclear Power Plant, leading to a major nuclear disaster in addition to other local destruction. Four years after this unprecedented “triple disaster,” more than 80,000 people were still living in temporary housing.

To assess the mental health impact of the Great East Japan Earthquake, Dr. Ando and colleagues identified and analyzed 42 research papers reporting on the type, severity, and prevalence of mental health problems in areas affected by the disaster. The analysis included information on trends in mental health problems over time and risk factors for developing such problems.

In all studies that examined posttraumatic symptoms, the prevalence of PTSD was ten percent or higher. Depression and child behavior problems were also reported frequently — although estimates varied widely due to the use of differing measures and cutoff points.

In studies investigating trends in mental health problems over time, posttraumatic stress symptoms tended to improve, or in any case not to get worse. In contrast, depression symptoms tended to persist during follow-up.

Risk factors for mental health problems included resettlement of daily lives, pre-existing illness, and small social network size. The reported prevalence of post-traumatic stress reactions was higher in Fukushima prefecture, where the damaged nuclear power station was located.

Suicides increased initially, followed by a decrease in the two years after the earthquake. However, the suicide rate remained higher than the pre-disaster level in Fukushima, in contrast to neighboring prefectures.

Natural disasters are known to increase the risk of mental health problems, with the potential for long-term effects. Because of its magnitude and unique characteristics, the Great East Japan Earthquake might have an even greater mental health impact than previous disasters.

The results add to previous studies showing a high prevalence of PTSD and other mental health problems after this unique disaster. “The prevalence and severity of mental health problems seemed to be higher in Fukushima than in other prefectures, and some specific risk factors were reported for the region,” Dr. Ando and colleagues conclude. The results suggest the need for long-term mental health support in Fukushima — perhaps especially targeting evacuees who are still living in temporary housing.

Reference:
Shuntaro Ando, Hitoshi Kuwabara, Tsuyoshi Araki, Akiko Kanehara, Shintaro Tanaka, Ryo Morishima, Shinsuke Kondo, Kiyoto Kasai. Mental Health Problems in a Community After the Great East Japan Earthquake in 2011. Harvard Review of Psychiatry, 2017; 25 (1): 15 DOI: 10.1097/HRP.0000000000000124

Note: The above post is reprinted from materials provided by Wolters Kluwer Health.

Related Articles