Human-made earthquakes in Oklahoma, USA, are strongly linked to the depth at which wastewater from the oil and gas industry are injected into the ground, according to a new study led by the University of Bristol.
Oklahoma has been a seismic hotspot for the past decade, with the number of damaging earthquakes — including the magnitude 5.8 Pawnee earthquake in 2016 — regularly impacting on the lives of residents, leading to litigation against well operators.
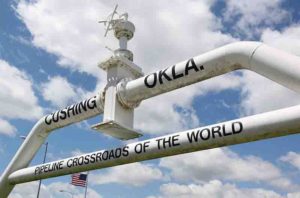
The human-made, or induced, earthquakes pose an increased risk to critical infrastructure such as a major commercial oil storage facility at Cushing, making them a national security threat.
The connection between ‘seismicity’ — the frequency of earthquakes — and deep fluid injection into underground rock formations is well established, but scientists, policymakers, and the oil and gas industry have been bewildered by the unprecedented surge in earthquake activity. At its peak, there has been an approximately 800-fold increase in the annual number of earthquakes in Oklahoma since 2011.
Oklahoma’s well operators have injected on average 2.3 billion barrels of fluids per year into the ground since 2011. Wastewater is routinely disposed of typically at depths one to two km below the ground surface, well below the level of fresh ground water supplies. Also, saltwater is injected deep underground to enable recovery of oil and gas.
Now a major study by the University of Bristol and involving the University of Southampton, Delft University of Technology and Resources for the Future, published today in the journal Science, shows conclusively that Oklahoma’s seismicity is strongly linked to fluid injection depth.
Lead author of the study, Dr Thea Hincks, Senior Research Associate at the University of Bristol’s School of Earth Sciences, said: “Our new modelling framework provides a targeted, evidential basis for managing a substantial reduction in induced seismicity in Oklahoma, with extensive possibilities for application elsewhere in the world. This marks a step forward in understanding the evolution of seismicity in the Oklahoma region.”
Using a powerful computer model incorporating injection well records and earthquake data from the US Geological Survey, the team examined the connections between injection volume, depth, and location, as well as geological features, over a six-year period.
The study used innovative new software, Uninet, which was developed by co-author Professor Roger Cooke’s group at Delft University of Technology and is freely available for academic users from LightTwist Software. Uninet has previously been used to develop causal risk models for the aviation industry.
The team found that the joint effects of depth and volume are critical, and that injection volume becomes more influential — and more likely to cause earthquakes — at depths where layered sedimentary rocks meet crystalline basement rocks. This is because deeper wells allow easier access for fluids into fractured basement rocks that are much more prone to earthquakes.
Dr Tom Gernon, Associate Professor in Earth Science at the University of Southampton, and co-author on the study, said: “The underlying causes of Oklahoma’s induced earthquakes are an open and complex issue, not least because there are over 10,000 injection wells, with many different operators and operating characteristics, all in an area of complex geology.
“Thanks to an innovative model capable of analysing large and complex data sets, our study establishes for the first time a clear link between seismicity and fluid injection depth.”
The study also shows how raising injection well depths to above the basement rocks in key areas could significantly reduce the annual energy released by earthquakes — thereby reducing the relative likelihoods of larger, damaging earthquakes. Current regulatory interventions include requiring operators to either reduce injection or raise wells above the basement, often by an unspecified amount.
Professor Willy Aspinall, of the University of Bristol and Aspinall & Associates, who conceived the study, added: “This new diagnostic finding has potential implications for scientists, regulators and civil authorities concerned about induced seismicity, both in the US and internationally. The research addresses a growing need for a broader understanding of how operational, spatial and geologic parameters combine to influence induced seismic risk.
“Our analysis allows regulatory actions to be evaluated on a rational, quantitative basis in terms of seismic effects.”
Thea Hincks and Willy Aspinall were supported in part by the CREDIBLE consortium (NERC Grant NE/J017299/1).
Reference:
Thea Hincks, Willy Aspinall, Roger Cooke, Thomas Gernon. Oklahoma’s induced seismicity strongly linked to wastewater injection depth. Science, 2018; eaap7911 DOI: 10.1126/science.aap7911
Note: The above post is reprinted from materials provided by University of Bristol.