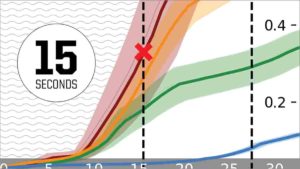
Scientists combing through databases of earthquakes since the early 1990s have discovered a possible defining moment 10-15 seconds into an event that could signal a magnitude 7 or larger megaquake.
Likewise, that moment — gleaned from GPS data on the peak rate of acceleration of ground displacement — can indicate a smaller event. GPS picks up an initial signal of movement along a fault similar to a seismometer detecting the smallest first moments of an earthquake.
Such GPS-based information potentially could enhance the value of earthquake early warning systems, such as the West Coast’s ShakeAlert, said Diego Melgar, a professor in the Department of Earth Sciences at the University of Oregon.
The physics-heavy analyses of two databases maintained by co-author Gavin P. Hayes of the U.S. Geological Survey’s National Earthquake Information Center in Colorado detected a point in time where a newly initiated earthquake transitions into a slip pulse where mechanical properties point to magnitude.
Melgar and Hayes also were able to identify similar trends in European and Chinese databases. Their study was detailed in the May 29 issue of the online journal Science Advances.
“To me, the surprise was that the pattern was so consistent, Melgar said. “These databases are made different ways, so it was really nice to see similar patterns across them.”
Overall, the databases contain data from more than 3,000 earthquakes. Consistent indicators of displacement acceleration that surface between 10-20 seconds into events were seen for 12 major earthquakes occurring in 2003-2016.
GPS monitors exist along many land-based faults, including at ground locations near the 620-mile-long Cascadia subduction zone off the U.S. Pacific Northwest coast, but their use is not yet common in real time hazard monitoring. GPS data shows initial movement in centimeters, Melgar said.
“We can do a lot with GPS stations on land along the coasts of Oregon and Washington, but it comes with a delay,” Melgar said. “As an earthquake starts to move, it would take some time for information about the motion of the fault to reach coastal stations. That delay would impact when a warning could be issued. People on the coast would get no warning because they are in a blind zone.”
This delay, he added, would only be ameliorated by sensors on the seafloor to record this early acceleration behavior.
Having these capabilities on the seafloor and monitoring data in real time, he said, could strengthen the accuracy of early warning systems. In 2016, Melgar, as a research scientist at Berkeley Seismological Laboratory in Berkeley, California, led a study published in Geophysical Research Letters that found real time GPS data could provide an additional 20 minutes of warning of a possible tsunami.
Japan already is laying fiber optic cable off its shores to boost its early warning capabilities, but such work is expensive and would be more so for installing the technology on the seafloor above the Cascadia fault zone, Meglar noted.
Melgar and Hayes came across the slip-pulse timing while scouring USGS databases for components that they could code into simulations to forecast what a magnitude 9 rupture of the Cascadia subduction zone would look like.
The subduction zone, which hasn’t had a massive lengthwise earthquake since 1700, is where the Juan de Fuca ocean plate dips under the North American continental plate. The fault stretches just offshore of northern Vancouver Island to Cape Mendocino in northern California.
Reference:
Diego Melgar and Gavin P. Hayes. Characterizing large earthquakes before rupture is complete. Science Advances, 2019 DOI: 10.1126/sciadv.aav2032
Note: The above post is reprinted from materials provided by University of Oregon.


