When Mount Tambora erupted in 1815, it spewed dust and sulfate aerosols into the stratosphere with a force more powerful than any eruption since. As the aerosols and particulates circulated around the globe, they cooled the planet, disrupting agriculture and leading to what became known as the “year without a summer.”
Scientists can read old descriptions of eruptions like Tambora and analyze ash deposits captured in polar ice, but consistently estimating the climate impact of past eruptions has been difficult. A new technique may change that.
The method, described this week in the Journal of Economic Surveys, combines statistical approaches used in economics with volcano and climate science, with the intention of picking out past eruptions from tree-ring temperature reconstructions going back millennia, and gauging their impact on the climate. It arose from a chance meeting at a conference between climate scientist Jason Smerdon, who was working with graduate student Lea Schneider on the volcanic impact on climate, and econometrics expert Felix Pretis.
The method resulting from their collaboration may help separate volcanic impacts on climate from random climate variability, and improve understanding of the effects of aerosols on temperature. The method may have a wide range of policy and science applications beyond volcanic eruptions, from pollution controls and calibrating climate models to assessing forecasts made by central banks and studying the diffusion of innovations in medicine, said Pretis, co-director of the Climate Econometrics research project at the Economics Department of the University of Oxford.
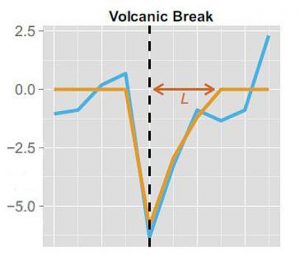
“In a climate time series, you often have lots of ups and downs and wiggles,” said Smerdon, a professor at Columbia University’s Lamont-Doherty Earth Observatory and head of the PaleoDynamics Lab there. “Often times, you would like to sweep over that time series to identify things that don’t match what you would expect–breaks that stand out against the background wiggles as statistically significant.” The impact of a large volcanic eruption on temperature over time has a fairly distinct signature, similar to a cursive letter “v.” It starts with rapid cooling over about a year, followed by a relaxation back to previous mean levels over the next three to four years.
The new method uses what is known as indicator saturation. In a nutshell, the approach defines the basic shapes of possible breaks that might be in the time series and then removes all the additional wiggles except for those that resemble the signature shape in a statistically significant way. The size of the v, or the magnitude of the cold spike in the temperature time series, is related to the impact of the eruption on the climate, and ultimately the eruption’s size and location.
To test the approach, the scientists used a Northern Hemisphere mean temperature time series from a global climate model simulation spanning the last 1,200 years. The method identified the biggest eruptions in the climate model 100 percent of the time. It consistently detected 74 percent of eruptions that deposited over 20 million metric tons of sulfate aerosols on the polar ice, and 57 percent of all global eruptions, including several that had little impact on Northern Hemisphere temperature.
Smerdon, Pretis and Schneider,a Ph.D. student at Johannes Gutenberg University, Mainz, Germany, are now working on applying the method to a new temperature time series developed from tree-ring density records from across the Northern Hemisphere. The result may help pinpoint previously unknown volcanic eruptions and gauge their magnitude.
“This is a much more rigorous way of testing your assumptions than looking at a time series and saying, ‘Well, I think something happened here,’ ” said Smerdon. “Sometimes it’s obvious, but statistics allows you to ask those questions objectively to make sure that you aren’t deceiving yourself.”
Allegra LeGrande of the NASA Goddard Institute for Space Studies, who examines the impact of volcanic aerosols on climate and was not involved in the paper, said: “If a technique existed to automatically pick out all the volcanic events from proxy records, we would be able to significantly improve our reconstructions of past volcanism and extend this reconstruction far back in time. We could develop better statistics for the frequency of large events.” LeGrande is co-hosting a workshop on Volcanic Impacts on Climate and Society at Lamont-Doherty Earth Observatory in June.
The new statistical tools are available through the software package OxMetrics and in the open-source statistical software environment R, accessible through climateeconometrics.org/tools. David Hendry, co-director of the Program for Economic Modelling at the Institute for New Economic Thinking, Oxford Martin School, was a co-author of the paper.
The paper, “Detecting volcanic eruptions in temperature reconstructions by designed break-indicator saturation,” is available at http://www.economics.ox.ac.uk/materials/papers/14402/paper-780.pdf
Note: The above post is reprinted from materials provided by The Earth Institute at Columbia University.


