One of the 24-plus faults that ruptured in the 2016 magnitude 7.8 Kaikōura earthquake has turned out to be even more unusual than scientists first thought and it may prompt a rethink about how seismic hazard is calculated.
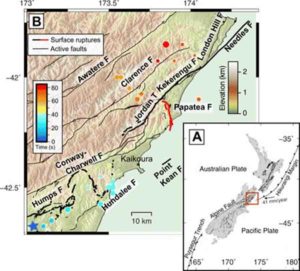
The Papatea Fault, unmapped before the quake and running along a similar path to the lower Clarence River in Marlborough, produced a 19km-long surface rupture and shunted a large area of mountainous country up by 8m in a matter of seconds.
A study published this week in the journal Science Advances indicates that the fault ruptured even though it hadn’t accumulated stress normally associated with fault rupturing.
Co-author and earthquake geologist at GNS Science Rob Langridge says it appears the fault suddenly became squeezed for room by the rupture of neighbouring faults causing it to break in “a very emphatic way.”
“The rupture of the Papatea Fault stands out for being one of the most dramatic elements of what was an unusual rupture sequence in the first place,” Dr. Langridge said.
“It produced the largest vertical movements of all the faults that ruptured during the earthquake and it has puzzled scientists because its rupture could not be fitted to standard models of fault rupture.”
However, the paper published this week used computer analysis of LIDAR images to come up with a solution to its unusual behavior. It was written by Canadian MSc student Anna Diederichs with colleague and geophysicist Ed Nissen, both of the University of Victoria in British Columbia. Three scientists from GNS Science, including Langridge, were co-authors.
“We discovered a number of unusual characteristics to this fault. Most unusually, the standard elastic rebound model of earthquake faulting did not fit the observed ground deformation,” Dr. Nissen said.
“We’ve concluded that the Papatea Fault did not release elastically stored tectonic strain as faults normally do during a rupture.”
Dr. Nissen said the findings indicate that some faults may fall outside typical fault behavior and conventional modeling may not capture the hazard they pose.
He said earthquake forecasting is based on the elastic strain cycle model where faults gradually accumulate strain until they fail, and then the cycle is repeated.
“However, the Papatea Fault does not seem to follow this model, and such faults may still need to be accounted for in earthquake forecast models.”
Going forward, he said this research finding could be considered when assessing the risk from faults that might have a low or unclear strain accumulation signal.
The research was based on computer analysis of pre- and post-earthquake LIDAR images of the fault rupture area. Fortuitously, Environment Canterbury collected LIDAR of the Clarence Valley area several years before the Kaikōura earthquake mainly for flood protection purposes. These images were compared with LIDAR images collected in the wake of the earthquake in 2016.
Reference:
A. Diederichs et al. Unusual kinematics of the Papatea fault (2016 Kaikōura earthquake) suggest anelastic rupture, Science Advances (2019). DOI: 10.1126/sciadv.aax5703
Note: The above post is reprinted from materials provided by University of Victoria.


