Home Blog Page 273

Mysterious volcanic eruption of 1808 described

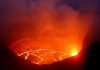
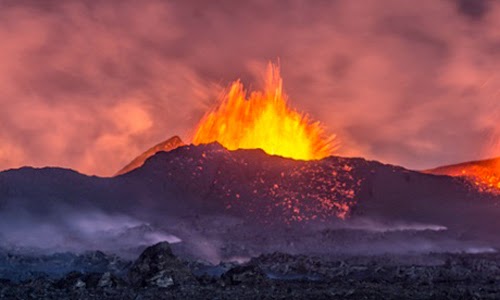
Image: The Indonesian volcano Anak Krakatau erupts at night (credit: Getty Images/Tom Pfeiffer/VolcanoDiscovery)

This eruption occurred just before the 1815 Tambora volcanic eruption which is famous for its impact on climate worldwide, with 1816 given memorable names such as ‘Eighteen-Hundred-and-Froze-to-Death’, the ‘Year of the Beggar’ and the ‘Year Without a Summer’ because of unseasonal frosts, crop failure and famine across Europe and North America. The extraordinary conditions are considered to have inspired literary works such as Byron’s ‘Darkness’ and Mary Shelley’s Frankenstein.

However, the global deterioration of the 1810s into the coldest decade in the last 500 years started six years earlier, with another large eruption. In contrast to Tambora, this so-called ‘Unknown’ eruption seemingly occurred unnoticed, with both its location and date a mystery. In fact the ‘Unknown’ eruption was only recognised in the 1990s, from tell-tale markers in Greenland and Antarctic ice that record the rare events when volcanic aerosols are so violently erupted that they reach Earth’s stratosphere.

Working in collaboration with colleagues from the School of Earth Sciences and PhD student Alvaro Guevara-Murua, Dr Caroline Williams, from the Department of Hispanic, Portuguese and Latin American Studies, began searching historical archives for references to the event.

Dr Williams said: “I spent months combing through the vast Spanish colonial archive, but it was a fruitless search — clearly the volcano wasn’t in Latin America. I then turned to the writings of Colombian scientist Francisco José de Caldas, who served as Director of the Astronomical Observatory of Bogotá between 1805 and 1810. Finding his precise description of the effects of an eruption was a ‘Eureka’ moment.”

In February 1809 Caldas wrote about a “mystery” that included a constant, stratospheric “transparent cloud that obstructs the sun’s brilliance” over Bogotá, starting on the 11 December 1808 and seen across Colombia. He gave detailed observations, for example that the “natural fiery colour [of the sun] has changed to that of silver, so much so that many have mistaken it for the moon”; and that the weather was unusually cold, the fields covered with ice and the crops damaged by frost.

Unearthing a short account written by physician José Hipólito Unanue in Lima, Peru, describing sunset after-glows (a common atmospheric effect caused by volcanic aerosols in the stratosphere) at the same time as Caldas’ “vapours above the horizon,” enabled the researchers to verify that the atmospheric effects of the eruption were seen at the same time on both sides of the equator.

These two 19th century Latin American scientists provide the first direct observations that can be linked to the ‘Unknown’ eruption. More importantly, the accounts date the eruption to within a fortnight of 4 December 1808.

Dr Erica Hendy said: “There have to be more observations hidden away, for example in ship logs. Having a date for the eruption will now make it much easier to track these down, and maybe even pinpoint the volcano. Climate modelling of this fascinating decade will also now be more accurate because the season of the eruption determines how the aerosols disperse around the globe and where climatic effects are felt.”

Alvaro Guevara-Murua added: “This study has meant delving into many fields of research — obviously paleoclimatology and volcanology, but also 19th century meteorology and Spanish colonial history — and has also needed rigorous precision to correctly translate the words of two scientists writing 200 years ago. Giving them a voice in modern science has been a big responsibility.”

One further question remains: why are there so few historical accounts of what was clearly a significant event with wide-reaching consequences? Perhaps, Dr Williams suggests, the political environment on both sides of the Atlantic at the beginning of the nineteenth century played a part.

“The eruption coincided with the Napoleonic Wars in Europe, the Peninsular War in Spain, and with political developments in Latin America that would soon lead to the independence of almost all of Spain’s American colonies. It’s possible that, in Europe and Latin America at least, the attention of individuals who might otherwise have provided us with a record of unusual meteorological or atmospheric effects simply turned to military and political matters instead,” she said.

Note : The above story is based on materials provided by University of Bristol.

Is Sahara Desert several million years older than previously thought?

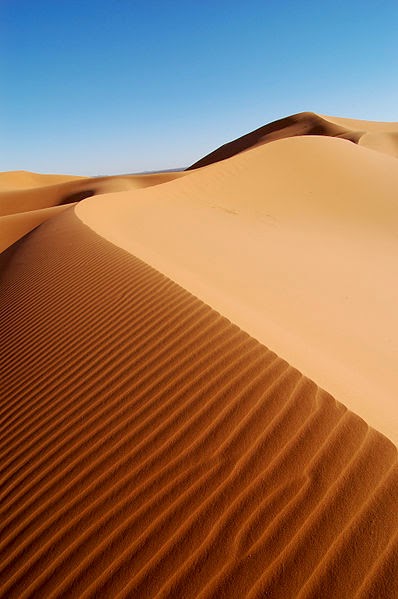
Sahara desert. Credit: © mrks_v / Fotolia

A team of scientists from Norway, France and China have revised the view that the Sahara desert has existed for only the last 2 to 3 million years.

The Sahara is the world’s largest subtropical desert. During the last decades, numerous scientific studies have probed its geological and archeological archives seeking to reveal its history. Despite some important breakthroughs, there are still basic questions that lack satisfactory answers.

For example, how old is the Sahara desert? It is widely believed that Sahara desert first appeared during the last 2 to 3 million years, but recent discoveries such as ancient sand dunes and dust records in marine cores push the possible onset of Saharan aridity back in time by several million years. Until now, however, there have been no good explanations for such an early Sahara onset.

This study pinpoints the Tortonian stage (~7-11 million years ago) as a pivotal period for triggering North African aridity and creating the Sahara desert. Using snapshot simulations with the Norwegian Earth System Model (NorESM) model suite, the international team explored the climate evolution of North Africa through major tectonic shifts over the last 30 million years. They found that the region undergoes aridification with the shrinkage of the Tethys — a giant ocean that was the origin of the modern Mediterranean, Black and Caspian Seas — during the Tortonian.

The simulations are the first to show that the Tethys shrinkage has two main consequences for North African climate. First, it weakens the African summer monsoon circulations and dries out North Africa. Second, it enhances the sensitivity of the African summer monsoon and its associated rainfall to orbital forcing. The Tortonian stage thus marks the time when North Africa shifted from a permanently lush, vegetated landscape to a landscape experiencing arid/humid cycles on orbital time scales.

Interestingly, these major changes in North African climate and environment are coincident with an important time period for the emergence of early hominids.

Note : The above story is based on materials provided by Uni Research.

Predict2D “Generate 2D vertical sections of sedimentary successions”

2D vertical sections of sedimentary successions.

A program to generate 2D vertical sections of sedimentary successions.

Summary

An earlier version of the parser which generates 2D vertical sections through sedimentary successions. The sections can be conditioned to 1D data (such as well data).

License & Copyright

Copyright © 2009 CSIRO

These programs are free software: you can redistribute them and/or modify them under the terms of the GNU General Public License as published by the Free Software Foundation, either version 3 of the License, or (at your option) any later version.

These programs are distributed in the hope that they will be useful, but WITHOUT ANY WARRANTY; without even the implied warranty of MERCHANTABILITY or FITNESS FOR A PARTICULAR PURPOSE. See the GNU General Public License for more details or go to www.gnu.org/licenses

Further Information

Hill, E.J. and Griffiths, C.M., 2007. Simulating Sedimentary Successions Using Syntactic Pattern Recognition Techniques. Mathematical Geology 39 (2), 141-157.

Hill, E.J. and Griffiths, C.M., 2008. Formal Description of Sedimentary Architecture of Analog Models for use in 2D Reservoir Simulation. Marine and Petroleum Geology 25, 131-141.

Downloads

Predict2D programs, User Manual and Java source code are all available on the Downloads page.

These programs require that you have the Java Virtual Machine running on your computer.

Program
Download Now ,Size : ~228.71 Kb
Manual
Download Now ,Size : ~1.20 Mb
Source Code
Download Now ,Size : ~88.31 Kb

Copyright © 2009 CSIRO

What set the Earth’s plates in motion? “The origin of plate tectonics”

The image shows a snapshot from the film after 45 million years of spreading. The pink is the region where the mantle underneath the early continent has melted, facilitating its spreading, and the initiation of the plate tectonic process. Credit: Patrice Rey, Nicolas Flament and Nicolas Coltice

The mystery of what kick-started the motion of our earth’s massive tectonic plates across its surface has been explained by researchers at the University of Sydney.

“Earth is the only planet in our solar system where the process of plate tectonics occurs,” said Professor Patrice Rey, from the University of Sydney’s School of Geosciences.

“The geological record suggests that until three billion years ago the Earth’s crust was immobile so what sparked this unique phenomenon has fascinated geoscientists for decades. We suggest it was triggered by the spreading of early continents then eventually became a self-sustaining process.”

Professor Rey is lead author of an article on the findings published in Nature on Wednesday, 17 September.

The other authors on the paper are Nicolas Flament, also from the School of Geosciences and Nicolas Coltice, from the University of Lyon.

There are eight major tectonic plates that move above Earth’s mantle at rates up to 150 millimetres every year.

In simple terms the process involves plates being dragged into the mantle at certain points and moving away from each other at others, in what has been dubbed ‘the conveyor belt’.

Plate tectonics depends on the inverse relationship between density of rocks and temperature.

At mid-oceanic ridges, rocks are hot and their density is low, making them buoyant or more able to float. As they move away from those ridges they cool down and their density increases until, where they become denser than the underlying hot mantle, they sink and are ‘dragged’ under.

But three to four billion years ago, Earth’s interior was hotter, volcanic activity was more prominent and tectonic plates did not become cold and dense enough to spontaneously sank.

“So the driving engine for plate tectonics didn’t exist,” said Professor Rey said.

“Instead, thick and buoyant early continents erupted in the middle of immobile plates. Our modelling shows that these early continents could have placed major stress on the surrounding plates. Because they were buoyant they spread horizontally, forcing adjacent plates to be pushed under at their edges.”

“This spreading of the early continents could have produced intermittent episodes of plate tectonics until, as the Earth’s interior cooled and its crust and plate mantle became heavier, plate tectonics became a self-sustaining process which has never ceased and has shaped the face of our modern planet.”

The new model also makes a number of predictions explaining features that have long puzzled the
geoscience community.

Video :


Reference:
Patrice F. Rey, Nicolas Coltice, Nicolas Flament. Spreading continents kick-started plate tectonics. Nature, 2014; 513 (7518): 405 DOI: 10.1038/nature13728

Note : The above story is based on materials provided by University of Sydney.

Scientists monitoring Hawaii lava undertake risks

This Monday, Sept. 15, 2014, photo provided by the U.S. Geological Survey shows geologists from the Hawaiian Volcano Observatory surveying the lava flow from the June 27th flow from the Kilauea volcano in Pahoa, Hawaii. On Tuesday, Sept. 16, 2014, Hawaii County spokesman Kevin Dayton said the slow-moving lava is expected to bypass homes in the Kaohe Homesteads subdivision, and the lava is about 19 days from reaching Pahoa Village Road. (AP Photo/U.S. Geological Survey)

New photos from the U.S. Geological Survey’s Hawaiian Volcano Observatory give a glimpse into the hazardous work scientists undertake to monitor lava that’s threatening to cross a major highway.

Photos taken this week include a shot of a geologist wearing protective clothing using a radar gun to measure the speed of lava flowing from Kilauea volcano. His measurements help Hawaii County Civil Defense officials prepare the lava, which the observatory estimates could cross the Puna district’s Highway 130 in about 13 days.

Observatory spokeswoman and geologist Janet Babb explains that those in her field have a fascination with the wonders of volcanos, but their hearts are heavy when they see the lava approach critical infrastructure and affect people’s lives.

County spokesman Kevin Dayton says the community is grateful for the geologists.

This Monday, Sept. 15, 2014, photo provided by the U.S. Geological Survey shows a geologist from the Hawaiian Volcano Observatory using a radar gun to measure the speed of the lava flow from the June 27th flow from the Kilauea volcano in Pahoa, Hawaii. On Tuesday, Sept. 16, 2014, Hawaii County spokesman Kevin Dayton said the slow-moving lava is expected to bypass homes in the Kaohe Homesteads subdivision, and the lava is about 19 days from reaching Pahoa Village Road. (AP Photo/U.S. Geological Survey)
This Monday, Sept. 15, 2014, photo provided by the U.S. Geological Survey shows a close view of the surface activity from the June 27th flow from the Kilauea volcano in Pahoa, Hawaii. On Tuesday, Sept. 16, 2014, Hawaii County spokesman Kevin Dayton said the slow-moving lava is expected to bypass homes in the Kaohe Homesteads subdivision, and the lava is about 19 days from reaching Pahoa Village Road. (AP Photo/U.S. Geological Survey)
This Monday, Sept. 15, 2014, photo provided by the U.S. Geological Survey shows the flow from the June 27th flow from the Kilauea volcano passing near the Kaohe Homesteads in Pahoa, Hawaii. On Tuesday, Sept. 16, 2014, Hawaii County spokesman Kevin Dayton said the slow-moving lava is expected to bypass homes in the Kaohe Homesteads subdivision, and the lava is about 19 days from reaching Pahoa Village Road. (AP Photo/U.S. Geological Survey)

Note : The above story is based on materials provided by © 2014 The Associated Press. All rights reserved.

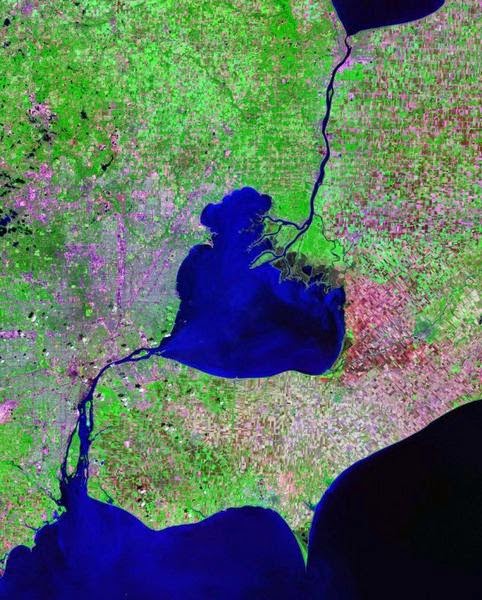
Saint Lawrence River

Map of the St. Lawrence/Great Lakes Watershed

The Saint Lawrence River is a large river flowing approximately from southwest to northeast in the middle latitudes of North America, connecting the Great Lakes with the Atlantic Ocean. It is the primary drainage conveyor of the Great Lakes Basin. The river traverses the Canadian provinces of Quebec and Ontario and forms part of the international boundary between Ontario, Canada, and New York State in the United States. This geographic entity is coterminous with the commercial Saint Lawrence Seaway.

Geography

The St. Lawrence River originates at the outflow of Lake Ontario between Kingston, Ontario, on the north bank, Wolfe Island in mid-stream, and Cape Vincent, New York. From there, it passes Gananoque, Brockville, Morristown, Ogdensburg, Massena, Cornwall, Montreal, Trois-Rivières, and Quebec City before draining into the Gulf of Saint Lawrence, one of the largest estuaries in the world. The estuary portion begins at the eastern tip of Île d’Orléans, just downstream from Quebec City. The river becomes tidal in the vicinity of Quebec City.

The river runs 3,058 kilometres (1,900 mi) from the farthest headwater to the mouth and 1,197 km (743.8 mi) from the outflow of Lake Ontario. The farthest headwater is the North River in the Mesabi Range at Hibbing, Minnesota. Its drainage area, which includes the Great Lakes and hence the world’s largest system of freshwater lakes, has a size of 1,344,200 square kilometres (518,998.5 sq mi), of which 839,200 km2 (324,016.9 sq mi) is in Canada and 505,000 km2 (194,981.6 sq mi) is in the United States. The basin covers parts of the provinces of Ontario and Quebec, and the states of Illinois, Indiana, Michigan, Minnesota, New York, Ohio, Pennsylvania, Vermont, and Wisconsin. The average discharge below the Saguenay River is 16,800 cubic metres per second (590,000 cu ft/s). At Quebec City, it is 12,101 m3/s (427,300 cu ft/s). The average discharge at the river’s source, the outflow of Lake Ontario, is 7,410 m3/s (262,000 cu ft/s).

The river includes Lake Saint-Louis south of Montreal, Lake Saint Francis at Salaberry-de-Valleyfield and Lac Saint-Pierre east of Montreal. It encompasses four archipelagoes: the Thousand Islands chain near Kingston, Ontario; the Hochelaga Archipelago, including the Island of Montreal and Île Jésus (Laval); the Lake St. Pierre Archipelago (Classified biosphere world reserve by the UNESCO in 2000)  and the smaller Mingan Archipelago. Other islands include Île d’Orléans near Quebec City, and Anticosti Island north of the Gaspé. It is the second longest river in Canada.

Lake Champlain and the Ottawa, Richelieu, Saguenay, and Saint-François rivers drain into the St. Lawrence.

The St. Lawrence River is in a seismically active zone where fault reactivation is believed to occur along late Proterozoic to early Palaeozoic normal faults related to the opening of Iapetus Ocean. The faults in the area are rift related and are called the Saint Lawrence rift system.

The St. Lawrence Valley is a physiographic province of the larger Appalachian division, containing the Champlain and Northern physiographic section.

Note : The above story is based on materials provided by Wikipedia

Impact that doomed the dinosaurs helped the forests bloom

Seen here is a Late Cretaceous specimen from the Hell Creek Formation, morphotype HC62, taxon Rhamnus cleburni. Specimens are housed at the Denver Museum of Nature and Science in Denver, Colorado. Credit: Benjamin Blonder, Doi: 10.1371/journal.pbio.1001949, CC

Some 66 million years ago, a 10-km diameter chunk of rock hit the Yukatan peninsula near the site of the small town of Chicxulub with the force of 100 teratons of TNT. It left a crater more than 150 km across, and the resulting megatsunami, wildfires, global earthquakes and volcanism are widely accepted to have wiped out the dinosaurs and made way for the rise of the mammals. But what happened to the plants on which the dinosaurs fed?

A new study led by researchers from the University of Arizona reveals that the impact that spelled doom for the dinosaurs also decimated the evergreen flowering plants to a much greater extent than their deciduous peers. They hypothesize that the properties of deciduous plants made them better able to respond rapidly to chaotically varying post-apocalyptic climate conditions. The results are publishing on September 16 in the open access journal PLOS Biology.

Applying biomechanical formulae to a treasure trove of thousands of fossilized leaves of angiosperms — flowering plants excluding conifers — the team was able to reconstruct the ecology of a diverse plant community thriving during a 2.2 million-year period spanning the cataclysmic impact event, believed to have wiped out more than half of plant species living at the time. The fossilized leaf samples span the last 1,400,000 years of the Cretaceous and the first 800,000 of the Paleogene.

The researchers found evidence that after the impact, fast-growing, deciduous angiosperms had replaced their slow-growing, evergreen peers to a large extent. Living examples of evergreen angiosperms, such as holly and ivy, tend to prefer shade, don’t grow very fast and sport dark-colored leaves.

“When you look at forests around the world today, you don’t see many forests dominated by evergreen flowering plants,” said the study’s lead author, Benjamin Blonder. “Instead, they are dominated by deciduous species, plants that lose their leaves at some point during the year.”

Blonder and his colleagues studied a total of about 1,000 fossilized plant leaves collected from a location in southern North Dakota, embedded in rock layers known as the Hell Creek Formation, which at the end of the Cretaceous was a lowland floodplain crisscrossed by river channels. The collection consists of more than 10,000 identified plant fossils and is housed primarily at the Denver Museum of Nature and Science. “When you hold one of those leaves that is so exquisitely preserved in your hand knowing it’s 66 million years old, it’s a humbling feeling,” said Blonder.

“If you think about a mass extinction caused by catastrophic event such as a meteorite impacting Earth, you might imagine all species are equally likely to die,” Blonder said. “Survival of the fittest doesn’t apply — the impact is like a reset button. The alternative hypothesis, however, is that some species had properties that enabled them to survive.

“Our study provides evidence of a dramatic shift from slow-growing plants to fast-growing species,” he said. “This tells us that the extinction was not random, and the way in which a plant acquires resources predicts how it can respond to a major disturbance. And potentially this also tells us why we find that modern forests are generally deciduous and not evergreen.”

Previously, other scientists found evidence of a dramatic drop in temperature caused by dust from the impact. “The hypothesis is that the impact winter introduced a very variable climate,” Blonder said. “That would have favored plants that grew quickly and could take advantage of changing conditions, such as deciduous plants.”

“We measured the mass of a given leaf in relation to its area, which tells us whether the leaf was a chunky, expensive one to make for the plant, or whether it was a more flimsy, cheap one,” Blonder explained. “In other words, how much carbon the plant had invested in the leaf.” In addition the researchers measured the density of the leaves’ vein networks, a measure of the amount of water a plant can transpire and the rate at which it can acquire carbon.

“There is a spectrum between fast- and slow-growing species,” said Blonder. “There is the ‘live fast, die young’ strategy and there is the ‘slow but steady’ strategy. You could compare it to financial strategies investing in stocks versus bonds.” The analyses revealed that while slow-growing evergreens dominated the plant assemblages before the extinction event, fast-growing flowering species had taken their places afterward.

Note : The above story is based on materials provided by PLOS.

Rushed evacuations as Philippine volcano spews lava

Lava flows from the crater of Mayon volcano, as seen from Legazpi City, Albay province, southeast of Manila, on September 17, 2014

Lava cascaded down the Philippines’ most active volcano on Wednesday as authorities rushed to evacuate thousands ahead of a possible deadly eruption.

Mostly women, children and the elderly carrying bags of clothes were hauled out of farming villages near Mayon volcano’s slopes on board army trucks and minibuses.

Soldiers went from house to house asking residents to evacuate, after authorities on Monday raised the third highest alert in a five-step scale, meaning a full-scale eruption is possible “within weeks”.

Before dawn Wednesday, Mayon’s crater glowed red as molten rocks flowed as far as halfway down its slopes.

The volcano’s world-renowned perfect cone appeared to have been deformed, swollen with lava that had risen from the Earth’s core.

At least 8,000 of the target 50,000 people had been moved to temporary shelters, with the operation expected to run for three days, regional civil defence director Bernardo Alejandro told AFP.

Map of the Philippines locating Mount Mayon, which continues to spew more lava on Wednesday

However he said the evacuation operation was sapping precious disaster-relief funds and manpower in Albay province, which is regularly battered by typhoons at this time of year.

“The province can sustain them (in evacuation centres) for not more than a month… we cannot exhaust all our disaster funds on Mayon,” Alejandro said.

The deadliest and most powerful of the roughly 20 typhoons that batter the Philippines every year happen towards the end of the year, bringing floods, landslides and storm surges to eastern provinces such as Albay that face the Pacific Ocean.

State volcanology agency director Renato Solidum said more magma was moving up the crater each day, although for the time being the alert level would remain at three. Level five means an eruption is occurring.

The 2,640-metre (8,070-foot) Mayon, located about 330 kilometres (200 miles) southwest of Manila, is a draw for local and foreign tourists but an enduring danger for anyone getting too close.

Four foreign tourists and their local tour guide were killed when Mayon last erupted, in May 2013.

In December 2006, 1,000 people died as a strong typhoon hit near Mayon, unleashing an avalanche of volcanic mud from an eruption four months earlier.

In 1814, more than 1,200 people were killed when lava flows buried the town of Cagsawa.

Note : The above story is based on materials provided by © 2014 AFP

Three extinct squirrel-like species discovered

This reconstruction shows arboreal mammals in a Jurassic forest. The three animals on the left side represent the three new species of euharamiyidan mammals. The other two represent a gliding species and another euharamiyidan, respectively, that were reported earlier. Credit: Zhao Chuang

Paleontologists have described three new small squirrel-like species that place a poorly understood Mesozoic group of animals firmly in the mammal family tree. The study, led by scientists at the American Museum of Natural History and the Chinese Academy of Sciences, supports the idea that mammals — an extremely diverse group that includes egg-laying monotremes such as the platypus, marsupials such as the opossum, and placentals like humans and whales — originated at least 208 million years ago in the late Triassic, much earlier than some previous research suggests.

The study is published today in the journal Nature.

“For decades, scientists have been debating whether the extinct group, called Haramiyida, belongs within or outside of Mammalia,” said co-author Jin Meng, a curator in the Museum’s Division of Paleontology. “Previously, everything we knew about these animals was based on fragmented jaws and isolated teeth. But the new specimens we discovered are extremely well preserved. And based on these fossils, we now have a good idea of what these animals really looked like, which confirms that they are, indeed, mammals.”

The three new species — Shenshou lui, Xianshou linglong, and Xianshou songae — are described from six nearly complete 160-million-year-old fossils found in China. The animals, which researchers have placed in a new group, or clade, called Euharamiyida, likely looked similar to small squirrels. They weighed between 1 and 10 ounces and had tails and feet that indicate that they were tree dwellers.

“They were good climbers and probably spent more time than squirrels in trees,” Meng said. “Their hands and feet were adapted for holding branches, but not good for running on the ground.”

The members of Euharamiyida likely ate insects, nuts, and fruit with their “strange” teeth, which have many cusps, or raised points, on the crowns. Mammals are thought to evolve from a common ancestor that had three cusps; human molars can have up to five. But the newly discovered species had two parallel rows of cusps on each molar, with up to seven cusps on each side. How this complex tooth pattern evolved in relation to those of other mammals has puzzled scientist for many decades.

Despite unusual tooth patterning, the overall morphology, or physical characteristics, seen in the new haramiyidan fossils is mammalian. For example, the specimens show evidence of a typical mammalian middle ear, the area just inside the eardrum that turns vibrations in the air into ripples in the ear’s fluids. The middle ears of mammals are unique in that they have three bones, as evidenced in the new fossils.

However, the placement of the new species within Mammalia poses another issue: Based on the age of the Euharamiyida species and their kin, the divergence of mammals from reptiles had to have happened much earlier than some research has estimated. Instead of originating in the middle Jurassic (between 176 and 161 million years ago), mammals likely first appeared in the late Triassic (between 235 and 201 million years ago). This finding corresponds with some studies that used DNA data.

“What we’re showing here is very convincing that these animals are mammals, and that we need to turn back the clock for mammal divergence,” Meng said. “But even more importantly, these new fossils present a new suite of characters that might help us tell many more stories about ancient mammals.”

Note : The above story is based on materials provided by American Museum of Natural History.

Carbon injection initiative supported by new research

Carbon dioxide is absorbed by basalt lava rock

Worldwide attempts to tackle global warming by injecting carbon dioxide into underground volcanic rock have been informed by new research that shows the process happens naturally on a massive scale over millions of years.

Industrial-scale injection of carbon dioxide into naturally occurring basalt lava rock is a strategy being trialled at sites around the world, including Iceland, India and the US.

A study by Geoscientists at the University of Aberdeen revealed that this process has happened in nature in the past and the information could give an idea of how much CO2 the rocks could potentially hold. The findings have been published in the Transactions of the Royal Society of Edinburgh.

“Basalt lava is created when volcanoes erupt,” explains Professor John Parnell from the University of Aberdeen. “In fact, a significant amount of the CO2 in our atmosphere, up to 150 million tonnes every year, comes from volcanoes but the basalt lavas that these eruptions produce absorb a significant proportion of this. It’s a sort of self-regulating mechanism – nature takes care of her own problem.

“The magnesium and calcium in the basalt lava reacts with the CO2 in the atmosphere to form chalky materials similar to limestone, and during this process the carbon is removed from the air and locked away in carbonate minerals.

“What’s significant is that we’ve shown that it has, and can, happen on a really big scale and this gives us encouragement. We’d never previously measured numbers for what had happened in the geological past.”

In July, 2013 researchers from the US Department of Energy injected 1,000 tonnes of CO2 into an underground basalt formation at one of the test sites near Wallula, Washington, in the US. This was only the second time the process had been tested in the field, following the 2012 project being run in Reykjavic by a consortium of US and European scientists. Early indications show that the process has significant potential.

The basalt lavas studied in the Aberdeen-based project are around 400 million years old and belong to the geological period known as Devonian or Old Red Sandstone. There are large amounts of the rock in Scotland, including in Angus, Stirlingshire, Perthshire, Lanarkshire, and Argyll around Oban.

“We’ve examined these rocks and looked at the minerals that have formed due to the reaction with CO2 at that time. From this we’ve made a lot of measurements which has allowed us to do some quantitative calculations to get an idea of rock’s capacity to soak up the CO2.

“We can use this data as a frame of reference for what could be possible on an industrial scale. There are many different options for soaking up carbon dioxide and our work supports the view that reacting it with basalt is a very fruitful way of soaking it up and is something that could be done on a large scale, because there are huge areas of basalt lava on the planet.

“However it’s difficult to compare the two fully, as the timescale over which it’s happened is far different. Man wants to do it over years, whilst nature has done it over tens of thousands of years.”

Note : The above story is based on materials provided by University of Aberdeen

Study on global carbon cycle may require reappraisal of climate events in Earth’s history

This photo shows roots casts observed between 131-132 meters below the mud pit. These casts are situated 0.2 meters below the subaerial exposure surface (not shown). Root casts are the darker grey irregular shapes observed in the photo with round, unfilled pore spaces. Scale bar on the right are 1 cm increments. Credit: UM Rosenstiel School of Marine and Atmospheric Science

A recent study of the global carbon cycle offers a new perspective of Earth’s climate records through time. Scientists at the University of Miami (UM) Rosenstiel School of Marine and Atmospheric Science suggest that one of the current methods for interpreting ancient changes in the concentration of carbon dioxide in the atmosphere and oceans may need to be re-evaluated.

The UM Rosenstiel School researchers measured the abundance of carbon-12 and carbon-13 isotopes in both the organic matter and carbonate sediments found in a nearly 700-meter marine sediment core from the Great Bahama Bank. The analyses showed a change to lower amounts of the rare isotope of carbon (carbon-13) in both the organic and inorganic materials as a result of several periods of sub-aerial exposure during the Pleistocene ice ages, which took place over the past two million years.

“Without geological context, classical interpretations of this dataset would suggest that there was a significant change in global carbon cycling, or a very large change in the concentration of atmospheric CO2 during the past five-million years,” said Amanda Oehlert, UM Rosenstiel School alumna and lead author of the study. “These findings show how important it is to understand the geological context of carbon isotope records.”

Scientists refer to the global carbon cycle as the natural processes by which carbon is cycled through the different components of Earth, including the mantle, atmosphere, plants, the oceans, and sediments.

The results showed that post-depositional changes in sediments could cause carbonate and organic values to covary through time, a process that had never been observed before, and has been considered impossible. The new findings suggest that similar trends in carbon isotopes values through time do not always provide conclusive information about the amount of CO2  — in the atmosphere or how carbon was cycled through the atmosphere and oceans.

Current scientific theory suggests that post-depositional physical, chemical, or biological processes produce contrasting carbonate and organic carbon isotope records. Currently, carbon isotope records of carbonate and organic material that show the same trends through time, or those that are highly correlated, are considered accurate records of changes in the global carbon cycle and concentrations of CO2 in the atmosphere and oceans.

“The observation that simultaneous changes in the amount of carbon-13 in carbonate and organic carbon isotope records can be caused by post-depositional changes is in direct contrast to current interpretations of these paired records,” said Oehlert. “These findings highlight the importance of understanding where and how the sediments and organic matter were originally produced, how they were transported to the sea floor, and what physical, chemical or biological changes may have happened to them after they were deposited.”

Scientists evaluate how the global carbon cycle changes through time by studying accumulations of carbonate skeletons and organic matter produced by marine organisms. Understanding the dynamics of the global carbon cycle is fundamental to estimations of atmospheric CO2, and consequently, how Earth’s climate may have changed through geologic history.

Note : The above story is based on materials provided by University of Miami Rosenstiel School of Marine & Atmospheric Science.

How a change in slope affects lava flows

When exposed to the elements, flowing lava will form a crust at its surface. Credit: Scott Rowland

As soon as lava flows from a volcano, exposure to air and wind causes it to start to cool and harden. Rather than hardening evenly, the energy exchange tends to take place primarily at the surface. The cooling causes a crust to form on the outer edges of the lava flow, insulating the molten lava within. This hardened lava shell allows a lava flow to travel much further than it would otherwise, while cracks in the lava’s crust can cause it to draw up short.

When there is a break in the terrain—a sharp change in slope, a valley, or a rock wall, for example—the smooth lava flow is disrupted. Pulses in flow volume or the formation of turbulent eddies caused by these topographic features can make the hard lava shell crack. Using observations from historical eruptions and a simple mechanical model, Glaze et al. studied how changes in slope can affect lava flows. This was featured in a recent study in the Journal of Geophysical Research: Solid Earth.

The increase in flow velocity from a steepening slope is often quite minor, as most of the energy goes into vertical rotation of the lava, just as with a rock rolling down a hill. The authors’ model considers factors such as temperature, depth and flow velocity, along with the effect of lava viscosity, to calculate how a change in slope affects the formation of vertical eddies created by tumbling lava. The authors’ model allowed them to determine how far downstream the turbulence persists before the lava returns to a more streamlined flow.

More information:
Glaze, L. S., S. M. Baloga, S. A. Fagents, and R. Wright (2014), The influence of slope breaks on lava flow surface disruption, J. Geophys. Res. Solid Earth, 119, 1837, DOI: 10.1002/2013JB010696

Note : The above story is based on materials provided by Wiley

Early Earth less ‘Hellish’ than previously thought

Calvin Miller at the Kerlingarfjoll volcano in central Iceland. Some geologists have proposed that the early Earth may have resembled regions like this. Credit: Tamara Carley / Vanderbilt

Conditions on Earth for the first 500 million years after it formed may have been surprisingly similar to the present day, complete with oceans, continents and active crustal plates.

This alternate view of Earth’s first geologic eon, called the Hadean, has gained substantial new support from the first detailed comparison of zircon crystals that formed more than 4 billion years ago with those formed contemporaneously in Iceland, which has been proposed as a possible geological analog for early Earth.

The study was conducted by a team of geologists directed by Calvin Miller, the William R. Kenan Jr. Professor of Earth and Environmental Sciences at Vanderbilt University, and published online this weekend by the journal Earth and Planetary Science Letters in a paper titled, “Iceland is not a magmatic analog for the Hadean: Evidence from the zircon record.”

From the early 20th century up through the 1980’s, geologists generally agreed that conditions during the Hadean period were utterly hostile to life. Inability to find rock formations from the period led them to conclude that early Earth was hellishly hot, either entirely molten or subject to such intense asteroid bombardment that any rocks that formed were rapidly remelted. As a result, they pictured the surface of the Earth as covered by a giant “magma ocean.”

This perception began to change about 30 years ago when geologists discovered zircon crystals (a mineral typically associated with granite) with ages exceeding 4 billion years old preserved in younger sandstones. These ancient zircons opened the door for exploration of the Earth’s earliest crust. In addition to the radiometric dating techniques that revealed the ages of these ancient zircons, geologists used other analytical techniques to extract information about the environment in which the crystals formed, including the temperature and whether water was present.

Since then zircon studies have revealed that the Hadean Earth was not the uniformly hellish place previously imagined, but during some periods possessed an established crust cool enough so that surface water could form — possibly on the scale of oceans.

Accepting that the early Earth had a solid crust and liquid water (at least at times), scientists have continued to debate the nature of that crust and the processes that were active at that time: How similar was the Hadean Earth to what we see today?

Two schools of thought have emerged: One argues that Hadean Earth was surprisingly similar to the present day. The other maintains that, although it was less hostile than formerly believed, early Earth was nonetheless a foreign-seeming and formidable place, similar to the hottest, most extreme, geologic environments of today. A popular analog is Iceland, where substantial amounts of crust are forming from basaltic magma that is much hotter than the magmas that built most of Earth’s current continental crust.

“We reasoned that the only concrete evidence for what the Hadean was like came from the only known survivors: zircon crystals — and yet no one had investigated Icelandic zircon to compare their telltale compositions to those that are more than 4 billion years old, or with zircon from other modern environments,” said Miller.

In 2009, Vanderbilt doctoral student Tamara Carley, who has just accepted the position of assistant professor at Layfayette College, began collecting samples from volcanoes and sands derived from erosion of Icelandic volcanoes. She separated thousands of zircon crystals from the samples, which cover the island’s regional diversity and represent its 18 million year history.

Working with Miller and doctoral student Abraham Padilla at Vanderbilt, Joe Wooden at Stanford University, Axel Schmitt and Rita Economos from UCLA, Ilya Bindeman at the University of Oregon and Brennan Jordan at the University of South Dakota, Carley analyzed about 1,000 zircon crystals for their age and elemental and isotopic compositions. She then searched the literature for all comparable analyses of Hadean zircon and for representative analyses of zircon from other modern environments.

“We discovered that Icelandic zircons are quite distinctive from crystals formed in other locations on modern Earth. We also found that they formed in magmas that are remarkably different from those in which the Hadean zircons grew,” said Carley.

Most importantly, their analysis found that Icelandic zircons grew from much hotter magmas than Hadean zircons. Although surface water played an important role in the generation of both Icelandic and Hadean crystals, in the Icelandic case the water was extremely hot when it interacted with the source rocks while the Hadean water-rock interactions were at significantly lower temperatures.

“Our conclusion is counterintuitive,” said Miller. “Hadean zircons grew from magmas rather similar to those formed in modern subduction zones, but apparently even ‘cooler’ and ‘wetter’ than those being produced today.”

Note : The above story is based on materials provided by Vanderbilt University. The original article was written by David Salisbury.

Gas leaks from faulty wells linked to contamination in some groundwater

As researchers study hydraulic fracturing, a team led by Thomas Darrah at The Ohio State University has identified a key source of groundwater contamination (labeled 5, center right) caused by faulty well casings. Credit: Image courtesy of Thomas Darrah, The Ohio State University

A study has pinpointed the likely source of most natural gas contamination in drinking-water wells associated with hydraulic fracturing, and it’s not the source many people may have feared.

What’s more, the problem may be fixable: improved construction standards for cement well linings and casings at hydraulic fracturing sites.

A team led by a researcher at The Ohio State University and composed of researchers at Duke, Stanford, Dartmouth, and the University of Rochester devised a new method of geochemical forensics to trace how methane migrates under the earth. The study identified eight clusters of contaminated drinking-water wells in Pennsylvania and Texas.

Most important among their findings, published this week in the Proceedings of the National Academy of Sciences, is that neither horizontal drilling nor hydraulic fracturing of shale deposits seems to have caused any of the natural gas contamination.

“There is no question that in many instances elevated levels of natural gas are naturally occurring, but in a subset of cases, there is also clear evidence that there were human causes for the contamination,” said study leader Thomas Darrah, assistant professor of earth sciences at Ohio State. “However our data suggests that where contamination occurs, it was caused by poor casing and cementing in the wells,” Darrah said.

In hydraulic fracturing, water is pumped underground to break up shale at a depth far below the water table, he explained. The long vertical pipes that carry the resulting gas upward are encircled in cement to keep the natural gas from leaking out along the well. The study suggests that natural gas that has leaked into aquifers is the result of failures in the cement used in the well.

“Many of the leaks probably occur when natural gas travels up the outside of the borehole, potentially even thousands of feet, and is released directly into drinking-water aquifers” said Robert Poreda, professor of geochemistry at the University of Rochester.

“These results appear to rule out the migration of methane up into drinking water aquifers from depth because of horizontal drilling or hydraulic fracturing, as some people feared,” said Avner Vengosh, professor of geochemistry and water quality at Duke.

“This is relatively good news because it means that most of the issues we have identified can potentially be avoided by future improvements in well integrity,” Darrah said.

“In some cases homeowner’s water has been harmed by drilling,” said Robert B. Jackson, professor of environmental and earth sciences at Stanford and Duke. “In Texas, we even saw two homes go from clean to contaminated after our sampling began.”

The method that the researchers used to track the source of methane contamination relies on the basic physics of the noble gases (which happen to leak out along with the methane). Noble gases such as helium and neon are so called because they don’t react much with other chemicals, although they mix with natural gas and can be transported with it.

That means that when they are released underground, they can flow long distances without getting waylaid by microbial activity or chemical reactions along the way. The only important variable is the atomic mass, which determines how the ratios of noble gases change as they tag along with migrating natural gas. These properties allow the researchers to determine the source of fugitive methane and the mechanism by which it was transported into drinking water aquifers.

The researchers were able to distinguish between the signatures of naturally occurring methane and stray gas contamination from shale gas drill sites overlying the Marcellus shale in Pennsylvania and the Barnett shale in Texas.

The researchers sampled water from the sites in 2012 and 2013. Sampling sites included wells where contamination had been debated previously; wells known to have naturally high level of methane and salts, which tend to co-occur in areas overlying shale gas deposits; and wells located both within and beyond a one-kilometer distance from drill sites.

As hydraulic fracturing starts to develop around the globe, including countries South Africa, Argentina, China, Poland, Scotland, and Ireland, Darrah and his colleagues are continuing their work in the United States and internationally. And, since the method that the researchers employed relies on the basic physics of the noble gases, it can be employed anywhere. Their hope is that their findings can help highlight the necessity to improve well integrity.

Note: The above story is based on materials provided by Ohio State University. The original article was written by Pam Frost Gorder.

Martian meteorite yields more evidence of the possibility of life on Mars

Is there, or was there once, life on Mars? Credit: NASA/JPL/MSSS

A tiny fragment of Martian meteorite 1.3 billion years old is helping to make the case for the possibility of life on Mars, say scientists.

The finding of a ‘cell-like’ structure, which investigators now know once held water, came about as a result of collaboration between scientists in the UK and Greece. Their findings are published in the latest edition of the journal Astrobiology.

While investigating the Martian meteorite, known as Nakhla, Dr Elias Chatzitheodoridis of the National Technical University of Athens found an unusual feature embedded deep within the rock. In a bid to understand what it might be, he teamed up with long-time friend and collaborator Professor Ian Lyon at the University of Manchester.

Professor Lyon, based in Manchester’s School of Earth, Atmospheric and Environmental Sciences explains: “In many ways it resembled a fossilized biological cell from Earth but it was intriguing because it was undoubtedly from Mars. Our research found that it probably wasn’t a cell but that it did once hold water, water that had been heated, probably as a result of an asteroid impact.”

These findings are significant because they add to increasing evidence that beneath the surface, Mars does provide all the conditions for life to have formed and evolved. It also adds to a body of evidence suggesting that large asteroids hit Mars in the past and produce long-lasting hydrothermal fields that could sustain life on Mars, even in later epochs, if life ever emerged there.

As part of the research, the feature was imaged in unprecedented detail by Dr Sarah Haigh of The University of Manchester whose work usually involves high resolution imaging for next generation electronic devices ,which are made by stacking together single atomic layers of graphene and other materials with the aim of making faster, lighter and bendable mobile phones and tablets. A similar imaging approach was able to reveal the atomic layers of materials inside the meteorite.

Together their combined experimental approach has revealed new insights into the geological origins of this fascinating structure.

Professor Lyon said: “We have been able to show the setting is there to provide life. It’s not too cold, it’s not too harsh. Life as we know it, in the form of bacteria, for example, could be there, although we haven’t found it yet. It’s about piecing together the case for life on Mars — it may have existed and in some form could exist still.”

Now, the team is using these and other state-of-the-art techniques to investigate new secondary materials in this meteorite and search for possible bio signatures which provide scientific evidence of life, past or present. Professor Lyon concluded: “Before we return samples from Mars, we must examine them further, but in more delicate ways. We must carefully search for further evidence.”

Note : The above story is based on materials provided by Manchester University.

‘Jaws’ lived in Doncaster, England

Shark egg case. Credit: Image courtesy of Manchester University

Sharks, swamps and a tropical rainforest teeming with life — it’s not what comes to mind when you think of Yorkshire. But for the first time evidence of Doncaster’s 310-million-year-old past, including a fossilised shark egg case, has been discovered in a derelict mining tip.

Some of the fossilised plants and creatures may even be new to science, and as well as the egg case, several horseshoe crabs and some previously unrecorded seed pods are amongst the finds. All had been preserved in rocks that formed within the coal and shale deposits in what is one of only a small handful of similar fossil locations left in the UK. The findings have been published in the international journal, Geological Journal.

Palaeontologist Dean Lomax, a visiting scientist at the University of Manchester’s School of Earth, Atmospheric and Environmental Sciences, said: “The fossils unlock a window into a long distant past, buried deep beneath residents’ feet. They are proof that parts of Yorkshire were once a tropical water-logged forest, teeming with life that may have looked something similar to today’s Amazon delta, a mix of dense forest, lakes, swamps and lagoons.

“The shark egg case is particularly rare and significant, because it’s soft bodied and an unusual object to find fossilised. We hope that future organised collecting of the site may reveal further rare discoveries, such as dragonflies, beetles, spiders and further evidence of vertebrates. And who knows, maybe we will even find the actual shark.”

After visits to all the redundant pit tips by Lomax, along with Peter Robinson from Doncaster Heritage Services and local fossil collector Brian Williams, Edlington was identified as being the only tip in the borough where fossils could potentially still be collected, as all of the others have been landscaped and turned into parks.

Peter Robinson said: “For all three of us this site and the fossils we’ve discovered here are very close to our hearts. We are all locally born and bred and take great pride in uncovering, interpreting and preserving a very important piece of the borough’s geological past. For me this site is particularly special as my father, Michael Robinson, was the National Coal Board’s geologist for Yorkshire Main and it is his bore core samples and records which are helping us understand the geological layers that these fossils came from.”

“We hope this important discovery will encourage ex-miners from the borough to bring forward and donate fossil specimens from the now defunct collieries, which were collected whilst extracting coal from the pit face. We have heard many stories of some of the wonderful fossils that have been found.”

The fossils are being stored at Doncaster Museum where they have been integrated into the museum’s fossil collection.

Note : The above story is based on materials provided by Manchester University.

3-D printing of rocks and fossils

Iowa State University’s Franek Hasiuk uses his GeoFabLab to print 3-D models for his geoscience research and teaching. Here, he shows a 3-D printed reservoir rock (left) and an idealized model of rock porosity. Credit: Amy Vinchattle

Franek Hasiuk grabbed a little red ball and said it’s not every day you pick up Mars.

But there it was, a Mars model about the size of a golf ball and just detailed enough to show Olympus Mons, a Martian volcano nearly 14 miles high and three times the height of Mt. Everest.

“You get a sense of how high it sticks up from the rest of the planet,” said Hasiuk, an Iowa State University assistant professor of geological and atmospheric sciences and David Morehouse Faculty Fellow. “It’s just spectacular.”

That little globe is just one product of Hasiuk’s Geological Fabrication Laboratory (or GeoFabLab), a narrow corner room in the basement of Iowa State’s Science Hall. The lab specializes in 3-D scanning and printing — as it says on the lab website, it’s all about “making things geological!”

Hasiuk, who came to Iowa State two years ago from the oil and gas industry, said a research and teaching goal has been to find “projects that students could work on that would make them interesting to industry — and employable.”

When he worked in industry, Hasiuk used 2-D CT scans to study the pores within limestone reservoir rocks. It’s a major industry challenge to understand fluid flow through the pore networks of rocks so oil can be extracted from the smallest pores.

When Hasiuk arrived on campus, he found researcher Joseph Gray and the CT tools at the Center for Nondestructive Evaluation. That led to 3-D scans and then 3-D prints of rock porosity.

“We’re taking really small holes in rock and then printing them at magnification,” Hasiuk said. “We’re not getting perfect photocopying yet, but we’re getting there.”

With better scans, data management and 3-D prints, “We can make models of pore networks and see how fluids flow through them,” he said. “Eventually, we’ll get to the point of making predictions and increasing the accuracy of predictions. What geology does for the economy is reduce uncertainty when you need to get something from underground — like oil and gas.”

Hasiuk said the oil and gas industry is showing significant interest in the research project.

Communicating geology While printing the reservoir rocks, Hasiuk discovered something about the tools he was using:

“3-D printing is a great communication tool,” he said. “You don’t have to teach someone a shape. You can understand by touching.”

And so he’s also using the GeoFabLab’s scanner and two 3-D printers (purchased with his faculty startup package and student computer fees) to print materials for geology classes.

As he wrote in a paper (“Making Things Geological: 3-D Printing in the Geosciences”) published this summer by the Geological Society of America, “Geoscientists are some of the most prolific producers of three-dimensional (3-D) data. These data do not belong in our computers — they belong in our hands.”

“Importantly,” he wrote, “3-D printing produces tangible objects that are obviously intuitive to students, non-geoscientists, and decision makers.”

In his own classes, Hasiuk has printed plastic fossils, crystals, dinosaur bones and even the topography of Ames south of campus, including Jack Trice Stadium. To spread the word about 3-D printing for classrooms, he’s made the data for about 100 of his 3-D models available on the Internet. And he’s collaborated with the Science Education Resource Center at Carleton College in Northfield, Minn.

Hasiuk notes that it makes a lot of sense to replace fragile, $10 to $50 classroom specimens with 25-cent pieces of printed plastic. But that’s not the first point he makes about the advantages of printing 3-D models for the classroom.

“These sort of things get people engaged,” said Hasiuk, pointing to a T. rex skull with a moving jawbone that he printed in Iowa State cardinal and gold. “These are chomp-able, flexible fossils. Using this technology, the GeoFabLab can bring dead things to life.”

Note : The above story is based on materials provided by Iowa State University.

Debris Flow

Debris flows are fast moving, liquefied landslides of mixed and unconsolidated water and debris that look like flowing concrete. They are defined by their non-newtonian flow dynamics, and behave as Bingham plastics. This characteristic can lead to the formation of levees at the margins of unconstrained debris flows as the margins of the flow freeze.

Asian monsoon much older than previously thought

These 35-million-year-old snail fossils in Myanmar contain the record of the past climate in their shells. Analyses by University of Arizona geoscientist Alexis Licht and his colleagues show these snails lived in a monsoon climate that had dry winters and very rainy summers. These freshwater gastropods from the Yaw formation (37-34 million years ago) were sampled near the town of Kalewa in central Myanmar. Credit: Alexis Licht 2012

The Asian monsoon already existed 40 million years ago during a period of high atmospheric carbon dioxide and warmer temperatures, reports an international research team led by a University of Arizona geoscientist.

Scientists thought the climate pattern known as the Asian monsoon began 22-25 million years ago as a result of the uplift of the Tibetan Plateau and the Himalaya Mountains.

“It is surprising,” said lead author Alexis Licht, now a research associate in the UA department of geosciences. “People thought the monsoon started much later.”

The monsoon, the largest climate system in the world, governs the climate in much of mainland Asia, bringing torrential summer rains and dry winters.

Co-author Jay Quade, a UA professor of geosciences, said, “This research compellingly shows that a strong Asian monsoon system was in place at least by 35-40 million years ago.”

The research by Licht and his colleagues shows the earlier start of the monsoon occurred at a time when atmospheric CO2 was three to four times greater than it is now. The monsoon then weakened 34 million years ago when atmospheric CO2 then decreased by 50 percent and an ice age occurred.

Licht said the study is the first to show the rise of the monsoon is as much a result of global climate as it is a result of topography. The team’s paper is scheduled for early online publication in the journal Nature on Sept. 14.

“This finding has major consequences for the ongoing global warming,” he said. “It suggests increasing the atmospheric CO2 will increase the monsoonal precipitation significantly.”

Unraveling the monsoon’s origins required contributions from three different teams of scientists that were independently studying the environment of 40 million years ago.

All three investigations showed the monsoon climate pattern occurred 15 million years earlier than previously thought. Combining different lines of evidence from different places strengthened the group’s confidence in the finding, Licht said. The climate modeling team also linked the development of the monsoon to the increased CO2 of the time.

Licht and his colleagues at Poitiers and Nancy universities in France examined snail and mammal fossils in Myanmar. The group led by G. Dupont-Nivet and colleagues at Utrecht University in the Netherlands studied lake deposits in Xining Basin in central China. J.-B. Ladant and Y. Donnadieu of the Laboratory of Sciences of the Climate and Environment (LSCE) in Gif-sur-Yvette, France, created climate simulations of the Asian climate 40 million years ago.

A complete list of authors of the group’s publication, “Asian monsoons in a late Eocene greenhouse world,” is at the bottom of this release, as is a list of funding sources.

Licht didn’t set out to study the origin of the monsoon.

He chose his study site in Myanmar because the area was rich in mammal fossils, including some of the earliest ancestors of modern monkeys and apes. The research, part of his doctoral work at the University of Poitiers, focused on understanding the environments those early primates inhabited. Scientists thought those primates had a habitat like the current evergreen tropical rain forests of Borneo, which do not have pronounced differences between wet and dry seasons.

To learn about the past environment, Licht analyzed 40-million-year-old freshwater snail shells and teeth of mammals to see what types of oxygen they contained. The ratio of two different forms of oxygen, oxygen-18 and oxygen-16, shows whether the animal lived in a relatively wet climate or an arid one.

“One of the goals of the study was to document the pre-monsoonal conditions, but what we found were monsoonal conditions,” he said.

To his surprise, the oxygen ratios told an unexpected story: The region had a seasonal pattern very much like the current monsoon – dry winters and very rainy summers.

“The early primates of Myanmar lived under intense seasonal stress – aridity and then monsoons,” he said. “That was completely unexpected.”

The team of researchers working in China found another line of evidence pointing to the existence of the monsoon about 40 million years ago. The monsoon climate pattern generates winter winds that blow dust from central Asia and deposits it in thick piles in China. The researchers found deposits of such dust dating back 41 million years ago, indicating the monsoon had occurred that long ago.

The third team’s climate simulations indicated strong Asian monsoons 40 million years ago. The simulations showed the level of atmospheric CO2 was connected to the strength of the monsoon, which was stronger 40 million years ago when CO2 levels were higher and weakened 34 million years ago when CO2 levels dropped.

Licht’s next step is to investigate how geologically short-term increases of atmospheric CO2 known as hyperthermals affected the monsoon’s behavior 40 million years ago.

“The response of the monsoon to those hyperthermals could provide interesting analogs to the ongoing global warming,” he said.

More information:
Asian monsoons in a late Eocene greenhouse world, Nature, DOI: 10.1038/nature13704

Note : The above story is based on materials provided by University of Arizona

Fossil record reveals microbial life following mass extinctions

An example of fossilized wrinkles taken at the Upper Cambrian Big Cove Member of the Petit Jardin Formation, near Marches Point on the Port au Port Peninsula in western Newfoundland. Credit: S. Pruss

Take a walk along any sandy shoreline, and you’re bound to see a rippled pattern along the seafloor, formed by the ebb and flow of the ocean’s waves.

Geologists have long observed similar impressions—in miniature—embedded within ancient rock. These tiny, millimeter-wide wrinkles have puzzled scientists for decades: They don’t appear in any modern environment, but seem to be abundant much earlier in Earth’s history, particularly following mass extinctions.

Now MIT researchers have identified a mechanism by which such ancient wrinkles may have formed. Based on this mechanism, they posit that such fossilized features may be a vestige of microbial presence—in other words, where there are wrinkles, there must have been life.

“You have about 3 billion years of Earth’s history where everything was microbial. The wrinkle structures were present, but don’t seem to have been all that common,” says Tanja Bosak, the Alfred Henry and Jean Morrison Hayes Career Development Associate Professor in MIT’s Department of Earth, Atmospheric and Planetary Sciences. “But it seems they become really abundant at the time when early animals were around. Knowing the mechanism of these features gives us a better sense of the environmental pressures these early animals were experiencing.”

Bosak and her colleagues have published their study, led by postdoc Giulio Mariotti, in the journal Nature Geoscience.

Sedimentary footprints

Ancient sedimentary wrinkles can be found in rocks up to 575 million years old—from a time when the earliest animals may have arisen—in places such as Australia, Africa, and Canada.

“Some of them look like wave ripples, and others look like raindrop impressions,” Mariotti says. “They’re shapes that remain in the sediment, like the footprint of a dinosaur.”

Researchers have put forth multiple theories for how these shapes may have arisen. Some believe that ocean waves may have created such patterns, while others think the answer may lie in ancient sea foam.

But the prevailing theory involves the presence of microbes: In a post-extinction world, microbial mats likely took over the seafloor in wide, leathery patches that were tough enough to withstand the overlying flow. As these mats were destroyed, they left small, lightweight microbial aggregates that shifted the underlying sand, creating wavelike patterns that were later preserved in sediment.

A fragmentary sweet spot

To test this last theory, Mariotti attempted to recreate the wrinkled patterns by growing microbial mats in custom-built wave tanks, partially filled with sand. To track his progress, he set up a camera to take time-lapse images of the tank. His initial results were successful—although, he admits, accidental.

“I reproduced something that looked like wrinkle structures, although at first it wasn’t on purpose,” Mariotti says.

Taken about two hours into the experiment, this animation shows a close-up view of microbial aggregates rolling over a small ripple, or wrinkle structure.

In his first attempts to seed a tank with microbes, Mariotti obtained fragments of microbial mats from another wave tank in which microbes were growing at a moderate rate. After a few days, he spotted tiny, millimeter-wide ripples in the sand. Looking back at the time-lapse images, he discovered the mechanism: Fragments of microbial mats were rolling along the surface and, within a few hours, rearranging sediments to create wavelike patterns in the sand.

Mariotti followed up on the observation with more controlled experiments with various wave conditions and microbial fragments, confirming that fragments, and not whole microbes, were forming the wrinkled features in the sediment.
The results led the group to raise another question: What might have created such microbial fragments? Bosak says the likely answer is the early appearance of small animals, which may have grazed on microbial mats, ripping them into fragments in the process.

“What we’re suggesting is that there may be some sort of sweet spot: You can’t have too many animals feeding, because then you lose microbial mats completely, but you need enough to produce these fragments,” Bosak says. “And that sweet spot could occur after a large marine extinction event.”

Mariotti says the mechanism he’s identified may shed light on the environmental conditions early animals faced as they tried to gain a foothold following an extinction event. For example, early animals may have thrived in protected environments such as shallow lagoons, where microbial fragments might best create wrinkled patterns.

“You need an environment where there’s not much energy, but still some wave motion, and close enough to the photic zone where you have light, so that microbial mats can grow,” Mariotti says. “Our finding may change how we see early animals.”

David Bottjer, a professor of earth sciences at the University of Southern California, says knowing the mechanism by which these wrinkle structures formed is important not just for understanding life on Earth, but life on other planets as well.

“It has been suggested that if a Martian rover was scanning sedimentary rocks that had been deposited underwater, and it saw wrinkle structures, that this could mean that there was microbial life present when the rocks were deposited,” says Bottjer, who was not involved in the work. “This study provides experimental evidence that, indeed, microbial fragments derived from microbial mats would be necessary to produce wrinkle structures. So, as a ‘biomarker’ indicating that microbial life would have existed on Mars, this strengthens the case for wrinkle structures, if they are found.”

Video :

Note : The above story is based on materials provided by Massachusetts Institute of Technology

Related Articles