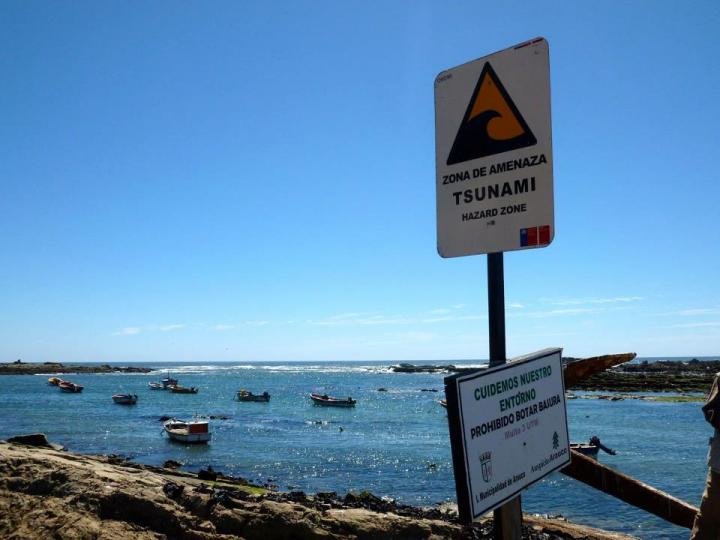
Tsunami warning/evacuation sign from the Chile coast. Credit: Dr. Stephen Hicks
Seismologists at the University of Liverpool studying the 2011 Chile earthquake have discovered a previously undetected earthquake which took place seconds after the initial rupture.
This newly discovered phenomena which they called a `closely-spaced doublet’ presents a challenge to earthquake and tsunami early warning systems as it increases the risk of larger-than-expected tsunamis in the aftermath of a typical subduction earthquake.
In a study published in Nature Geoscience, University researchers analysed in detail the seismic wave recordings from 2 January 2011 when an earthquake of magnitude 7 occurred in Chile along the plate boundary separating the subducting Nazca plate from the South American continent.
They discovered that just 12 seconds later and 30 km further offshore, a second rupture of a similar size, which was un-detected by national and global earthquake monitoring centres, occurred along an extensional (pull-apart) fault in the middle of the South American plate beneath the Pacific Ocean.
Liverpool seismologist, Professor Andreas Rietbrock, said: “Real-time global seismic monitoring and early warning events have come a long way and it is possible for a magnitude 5 or greater earthquake to be detected within a matter of minutes. Therefore, it is striking that an earthquake with magnitude close to 7 was effectively hidden from our standard monitoring systems.”
“Previous doublet events have been documented in subduction zones before, but such instantaneous triggering of large ruptures at close distances has no known precedent. Such triggered events dramatically complicate potential earthquake impact assessments and tsunami early warning systems as the risk of a larger than expected tsunami is higher following a typical subduction earthquake.”
Dr Stephen Hicks, who was part of the research team, said: “We believe that seismic waves travelling outward from the first rupture immediately shook up and weakened the shallower second fault, causing the hidden rupture. Scientists believe that the overlying plate at collisional plate boundaries is broken up on a large scale and contains networks of faults. It is plausible that similar closely-spaced doublets may occur elsewhere around the Pacific Ring of Fire. ”
Professor Rietbrock added: “This work challenges the commonly-held notion that slip during large earthquakes may only occur along a single fault. The result was surprising as there was no indication of such a complicated rupture from global earthquake monitoring systems. ”
“Our findings present a concern for tsunami early warning systems. Without real-time monitoring of seismometers located close to the fault, it is possible that tsunami and shaking hazard from future subduction earthquakes may be underestimated.”
As part of the University’s Liverpool Earth Observatory, seismologists are installing a seismic network in Southern Peru in close collaboration with the Geophysical Institute of Peru.
This area along the South American continental margin has the potential for a large magnitude 8+ earthquake and it is important to understand the associated seismic and tsunami hazard.
Reference:
Stephen P. Hicks, Andreas Rietbrock. Seismic slip on an upper-plate normal fault during a large subduction megathrust rupture. Nature Geoscience, 2015; DOI: 10.1038/ngeo2585
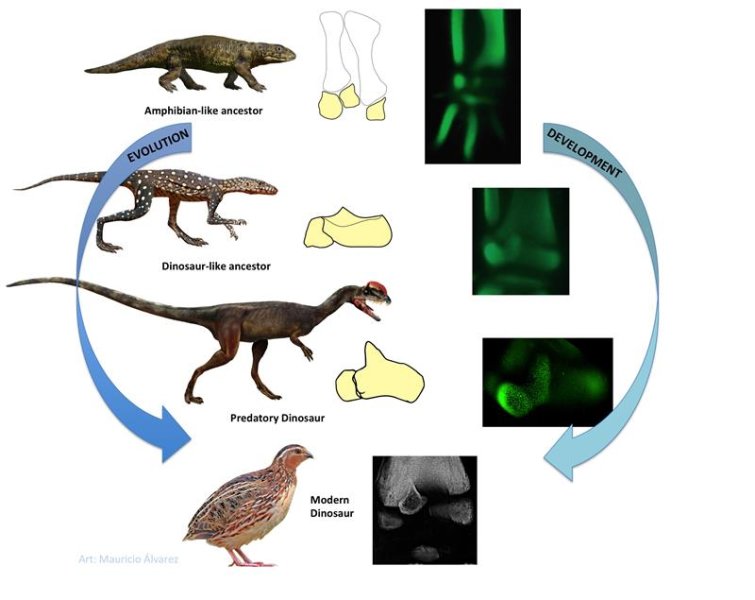
Like modern amphibians, the remote ancestors of birds once had three bones in their upper ankle. When these evolved into landegg-laying animals, only two bones were present in this region. In dinosaurs, one of these, the anklebone, presents a pointed upward projection, the “ascending process”. This trait is also present in birds, which are living dinosaurs. A new detailed embryological study in birds reveals that their ankle has re-evolved an amphibian-like developmental pattern, with three separate elements, one of which becomes the dinosaurian ascending process Credit: Image courtesy of Universidad de Chile
In the 19th century, Darwin’s most vocal scientific advocate was Thomas Henry Huxley, who is also remembered as a pioneer of the hypotheses that birds are living dinosaurs. He noticed several similarities of the skeleton of living birds and extinct dinosaurs, among them, a pointed portion of the anklebone projecting upwards onto the shank bone (aka drumstick). This “ascending process” is well known to specialists as a unique trait of dinosaurs. However, until the late 20th century, many scientists were doubtful about the dinosaur-bird link. Some pointed out that the ascending process in most birds was a projection of the neighbouring heel bone, rather than the anklebone. If so, it would not be comparable, and would not support the dinosaur-bird link.
Some argued that in bird embryos, the ascending process develops from the anklebone in dinosaur-like fashion, while others considered that its development in birds is unique and different from dinosaurs. Nowadays, the dinosaur-bird link is mainstream science, thanks to new methods of data analysis, and a dense series of intermediate fossils (including feathered dinosaurs). However, the disagreements about the composition and embryology of the avian ankle were never clarified fully. A new study in Nature Communications by Luis Ossa, Jorge Mpodozis and Alexander Vargas, from the University of Chile, provides a careful re-examination of ankle development in 6 different major groups of birds, selected specifically to clarify conditions in their last common ancestor. It also utilizes new techniques that allow three-dimensional analysis of fluorescent embryonic skeletons, using advanced spin-disc confocal microscopy and software.
This work has revealed that the ascending process does not develop from either the heel bone or the ankle bone, but from a third element, the intermedium. In the ancient lineage of paleognath birds (such as tinamous, ostriches and kiwis) the intermedium comes closer to the anklebone, producing a dinosaur-like pattern. However, in the other major avian branch (neognaths), which includes most species of living birds, it comes closer to the heel bone; that creates the impression it is a different structure, when it is actually the same. “It puts the final nail in the anti-dinosaur coffin” says Jacques Gauthier, a vertebrate paleontologist and professor at Yale University “The dinosaurian ascending process is retained in all birds, though it has changed its association from ankle to heel bones in neognath birds.”
More remarkably, however, this finding reveals an unexpected evolutionary transformation in birds. In embryos of the landegg-laying animals, the amniotes (which include crocodilians, lizards, turtles, and mammals, who secondarily evolved live birth) the intermedium fuses to the anklebone shortly after it forms, disappearing as a separate element. This does not occur in the bird ankle, which develops more like their very distant relatives that still lay their eggs in water, the amphibians. Since birds clearly belong within landegg-laying animals, their ankles have somehow resurrected a long-lost developmental pathway, still retained in the amphibians of today — a surprising case of evolutionary reversal. The study also presented fossil evidence from juvenile specimens of toothed birds from the Cretaceous period. These show that, at this early stage of bird evolution, the ascending process already developed separately.
Evolutionary reversions have always generated much discussion among scientists, because ancient traits can occasionally re-appear in a highly transformed context. A recent paper in BMC Evolutionary Biology (Diaz and Trainor, 2015) has revealed that chameleons also re-evolved an independent intermedium, in the specialized functional context of a climbing reptile. The reappearance of this long-lost developmental pattern in highly evolved organisms like birds and chameleons could be compared to finding primitive clockwork gears inside your latest smartphone. These intriguing discoveries are bound to renew discussion about the interplay between the evolution of new functions and the resurrection of old developmental patterns.
Reference:
Luis Ossa-Fuentes, Jorge Mpodozis, Alexander O Vargas. Bird embryos uncover homology and evolution of the dinosaur ankle. Nature Communications, 2015; 6: 8902 DOI: 10.1038/ncomms9902
Note: The above post is reprinted from materials provided by Universidad de Chile.
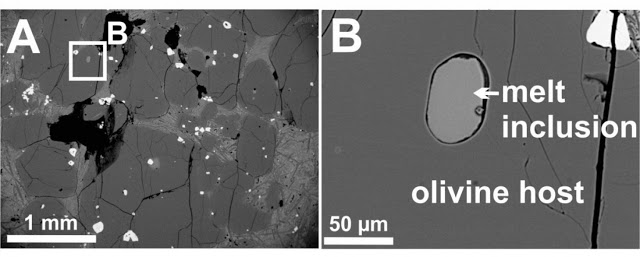
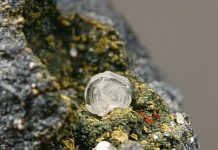
These olivine grains contain trapped pockets of glass, known as melt inclusions (image B), and this glass contains tiny amounts of water sourced from the mantle plume. Credit: Lydia J. Hallis
Scientists have long debated the origins of Earth’s water. It made human life possible, distinguishing our lush planet from the barren ones that surround us. But how did it get here? While it seems likely that the water in our solar system is very old, scientists aren’t sure whether Earth formed with water molecules on it or those molecules arrived later, hitching a ride on an asteroid that collided with us.
In a study published Thursday in Science, researchers present new evidence that Earth has had its water since the very beginning — no asteroids required.
The researchers suggest that the H2O-rich grains of dust that helped form the planet were able to retain that liquid water as Earth was born.
To find evidence of this ancient water, they had to find the most pristine possible samples of an infant Earth. That’s a tall order, since Earth is a living, dynamic world — you can’t pick up a rock and assume that it’s anything like it was 4.6 billion years ago.
But if you can get rocks straight from a relatively untouched region of the Earth’s mantle, that’s another story. And luckily these scientists had just the thing: volcanic rocks taken from the arctic Baffin Island in 1985.
“On their way to the surface, these rocks were never affected by sedimentary input from crustal rocks, and previous research shows their source region has remained untouched since Earth’s formation,” lead study author Lydia Hallis, a researcher at the University of Glasgow, said in a statement. “Essentially, they are some of the most primitive rocks we’ve ever found on Earth’s surface, and so the water they contain gives us an invaluable insight into Earth’s early history and where its water came from.”
Then Hallis and her colleagues turned to a classic test for water origin. They looked for deuterium, a modified form of hydrogen that creates what we call “heavy water.” Scientists have found that the ratio of deuterium to hydrogen creates a unique signature in the water of every planet, comet, or asteroid. So if Earth’s earliest water seemed especially similar to something we’d expect from a chunk of asteroid, for example, we’d suspect that our first water had been delivered by a violent collision.
In this case, however, the scientists found water that was very poor in deuterium.
According to Hallis, this makes it more likely that Earth’s water came from the dust that formed our solar system’s planets. A lot of this liquid would have evaporated as these dust particles fused together to give birth to Earth, but these findings suggest that enough of it remained to seed our planet with water.
There are still plenty of questions to answer about the serendipitous wetness of our planet. Since water is necessary for life (at least as we know it), figuring out just how lucky we were to end up on a planet covered in ocean could help scientists determine how likely life is out in the rest of the universe.
Note: The above post is reprinted from materials provided by The Washington Post. The original article was written by Rachel Feltman.
Volcano enthusiasts have enlisted the help of a University of Manchester academic to come up with a list of the top ten most dangerous volcanoes in the world.
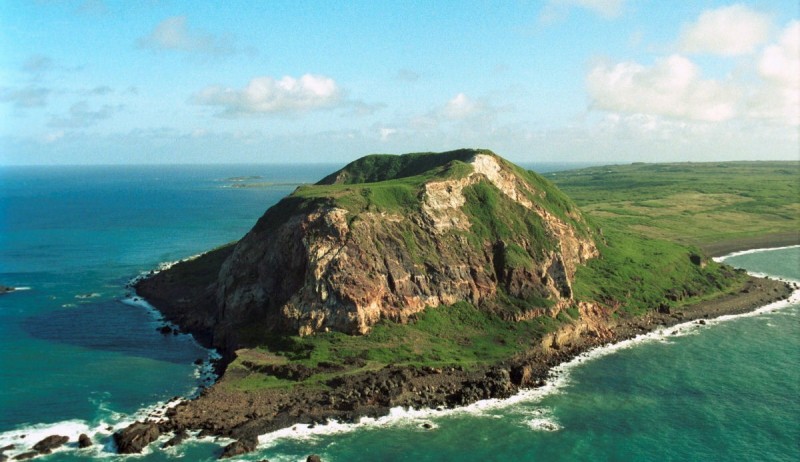
And the Japanese island of Iwo Jima, which was invaded by the US army during the Second World War, has been identified in the number one spot.
Published as a series of blogs on the Volcano café website, the list includes volcanoes which have a realistic chance of erupting in the next 100 years and which risk causing the deaths of 1,000,000 people or more. It includes volcanoes from all over the world, including South and Central America, Africa, Asia and Europe.
The point of the list is to try to highlight those volcanoes that are not studied very well, but which could pose a big threat to regional and world stability, should they erupt. Professor Albert Zijlstra, of The University of Manchester explains the motivation behind the list. He said: “There are parts of the world where monitoring of volcanoes is very poor, and many of these poorly watched volcanoes are close to populated areas.
“The last time such a list was made was 25 years ago and that list mainly included volcanoes that are accessible to study in developed countries. Our new list looks all over the world, including in less developed countries. We have created this list to try to highlight the need for better monitoring and preparedness in many areas of the world.
There hasn’t been a major eruption for 200 years, since Tambora in 1815 (“the year without summer”), and there has never been a large eruption in a modern, developed country. There is a chance of perhaps 1 in 3 that there will such an eruption this century. ”
The island of Iwo Jima is about twenty metres higher than it was in 1945 due to a growing magma chamber underneath. The beach where the American forces landed in 1945 is now 17 meters above the ocean surface. The island has been pushed up by 1 meter every 4 years since several hundred years. It is only a matter of time before the whole island explodes. Although few people live on Iwo Jima itself, a large eruption would cause a tsunami that could devastate southern Japan and coastal China including Shanghai and Hong Kong. The team estimates that in Japan the tsunami could be 25 meters high. The eruption of the similar sized Kuwae volcano in Vanatua in 1458 caused a tsunami 30 meters high in northern New Zealand, and lead to the cultural collapse of Polynesia.
After Iwo Jima the second most dangerous volcano has been named as Apoyeque in Nicaragua, which is next to its capital Managua, with a population of more than 2m. Apoyeque has the threat of an underwater eruption, which could cause a large lake tsunami, as well as the danger posed by the eruption itself. It has had major eruptions every 2000 years. The last one was 2000 years ago.
In third place is Campei Flegrei near Naples in Italy, which poses even more of a threat to the city than Vesuvius. It erupts less frequently than Vesuvius, but is much closer to the city and has the potential for much larger eruptions. The western suburbs of Naples, a city of 4.4 million, are build inside its caldera. .
Other volcanoes in the list are in Indonesia, the Philippines, Mexico, and Cameroon.
Henrik Lovën, previously a major in the Swedish army and keen amateur volcanologist, helps to run the Volcano Café site and contributed to the top ten list.
He said: “We want to raise awareness that there are many volcanoes that could erupt and that are not being monitored properly. Hopefully the people who live near the volcanoes in this list will get more help to help them prepare for an eruption.”
The full top ten list is:
Iwo Jima, Japan. Candidate for a very large eruption. Affected: Japan, Philippines, coastal China
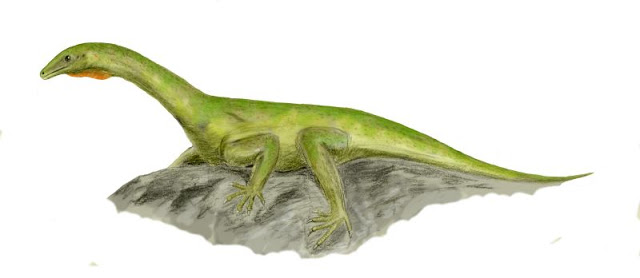
A typical protorosaur (in this case, Protorosaurus itself). Credit: Nobu Tamura, CC-BY
Everyone likes “gross” fossils. Fossil poo always gets attention, and infected bones are cool to look at, but vomit is fairly unusual in the fossil record. One of the best known examples (at least to paleontologists with a very narrow range of interests) is around 220 million years old, from northern Italy. Not only was it interpreted as prehistoric throw-up, but the contents were identified as a rare animal indeed–tiny, fragile bones from a winged pterosaur. This is potentially quite exciting, because pterosaurs of that age are poorly known. Such an unusual specimen warranted a second look!
Yesterday in PLOS ONE, a team of researchers (including one of the scientists from the original 1989 study) published a reinterpretation of that infamous pterosaur-containing vomit. And…it may not have a pterosaur after all.
First things first, let’s address the nature of the vomity fossil. The technical term is “gastric pellet.” Gastric pellets are composed of indigestible bones and tissue regurgitated by an animal (typically a predator). Owl pellets are probably the best known example, but a number of other animals produce them. In the fossil record, gastric pellets are distinguished from poo (which also contains indigestible bits) by the degree of damage to the contents, among other criteria. Something regurgitated out the front end will have less damage from digestive acids and enzymes than something excreted out the back end. Coprolites will also often be accompanied by a mass of mineralized bits and pieces, lacking in the Italian specimen. Tight clumping of bones can help differentiate a gastric pellet from random skeletal accumulations brought together by currents or from the decay of a single organism. Overall, the authors of the PLOS ONE paper upheld the nature of the Italian fossil as a gastric pellet.
The next question concerns the identity of the bones in the gastric pellet. The original research team tentatively identified the bones as pterosaur based on their size and shape–the number and shape of long, slender bones seemed to match the wing bones of a pterosaur. Restudy of the bones, however, suggested that some of the long bones could just as easily have come from some other reptiles around at the same time. Critically, a vertebra and tail bone (hemapophysis, also known as a chevron or haemal arch) were found to be a very poor match for those known in pterosaurs. Former “wing bones” were also reinterpreted as broken ribs or other limb bones, not necessarily from pterosaurs. A number of other presumed pterosaur features were found to be either ambiguous or found across enough other animals to be uninformative.
So if they’re not pterosaur, what did the bones come from? In terms of size and shape, the best candidate is one of the small lizard-like animals of the time, particularly a group called protosaurs. The preserved bones in the gastric pellet aren’t quite complete enough to be certain, but odds are good. Even so, the producer of the pellet itself remains a mystery.
Reference:
Borja Holgado et al. A Reappraisal of the Purported Gastric Pellet with Pterosaurian Bones from the Upper Triassic of Italy, PLOS ONE (2015). DOI: 10.1371/journal.pone.0141275
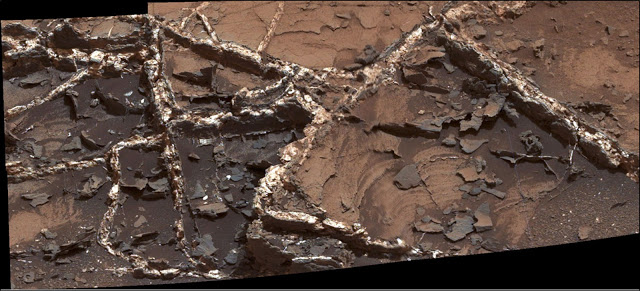
Prominent mineral veins at the “Garden City” site examined by NASA’s Curiosity Mars rover vary in thickness and brightness, as seen in this image from Curiosity’s Mast Camera (Mastcam). Credit: NASA/JPL-Caltech/MSSS
Scientists now have a better understanding about a site with the most chemically diverse mineral veins NASA’s Curiosity rover has examined on Mars, thanks in part to a valuable new resource scientists used in analyzing data from the rover.
Curiosity examined bright and dark mineral veins in March 2015 at a site called “Garden City,” where some veins protrude as high as two finger widths above the eroding bedrock in which they formed.
The diverse composition of the crisscrossing veins points to multiple episodes of water moving through fractures in the bedrock when it was buried. During some wet periods, water carried different dissolved substances than during other wet periods. When conditions dried, fluids left clues behind that scientists are now analyzing for insights into how ancient environmental conditions changed over time.
“These fluids could be from different sources at different times,” said Diana Blaney, a Curiosity science team member at NASA’s Jet Propulsion Laboratory, Pasadena, California. “We see crosscutting veins with such diverse chemistry at this localized site. This could be the result of distinct fluids migrating through from a distance, carrying chemical signatures from where they’d been.”
Researchers used Curiosity’s laser-firing Chemistry and Camera (ChemCam) instrument to record the spectra of sparks generated by zapping 17 Garden City targets with the laser. The unusually diverse chemistry detected at Garden City includes calcium sulfate in some veins and magnesium sulfate in others. Additional veins were found to be rich in fluorine or varying levels of iron.
As researchers analyzed Curiosity’s observations of the veins, the ChemCam team was completing the most extensive upgrade to its data-analysis toolkit since Curiosity reached Mars in August 2012. They more than tripled — to about 350 — the number of Earth-rock geochemical samples examined with a test version of ChemCam. This enabled an improvement in their data interpretation, making it more sensitive to a wider range of possible composition of Martian rocks.
Blaney said, “The chemistry at Garden City would have been very enigmatic if we didn’t have this recalibration.”
The Garden City site is just uphill from a mudstone outcrop called “Pahrump Hills,” which Curiosity investigated for about six months after reaching the base of multi-layered Mount Sharp in September 2014. The mission is examining ancient environments that offered favorable conditions for microbial life, if Mars has ever hosted any, and the changes from those environments to drier conditions that have prevailed on Mars for more than 3 billion years. Curiosity has found evidence that base layers of Mount Sharp were deposited in lakes and rivers. The wet conditions recorded by the Garden City veins existed in later eras, after the mud deposited in lakes had hardened into rock and cracked.
Eye-catching geometry revealed in images of the veins offers additional clues. Younger veins continue uninterrupted across intersections with veins that formed earlier, indicating relative ages.
ChemCam provides the capability of making distinct composition readings of multiple laser targets close together on different veins, rather than lumping the information together. The chemistry of these veins is also related to mineral alteration observed at other places on and near Mount Sharp. What researchers learned here can be used to help understand a very complex fluid chemical history in the region. Since leaving Garden City, Curiosity has climbed to higher, younger layers of Mount Sharp.
Today, Blaney presented findings from ChemCam’s Garden City investigations at the annual meeting of the American Astronomical Society’s Division for Planetary Science, in National Harbor, Maryland.
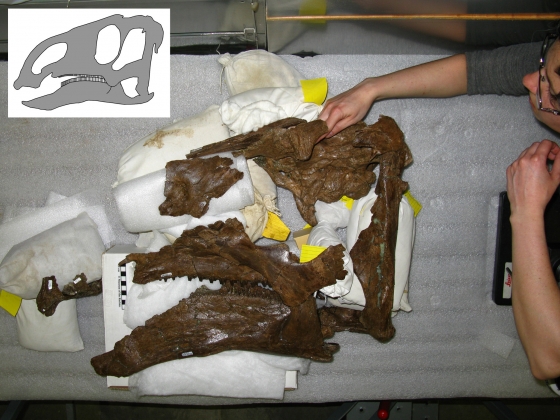
Elizabeth Freedman Fowler, an adjunct professor at Montana State University, looks over an assemblage of the skull of the Probrachylophosaurus, a new type of duckbilled dinosaur discovered by Freedman Fowler and a team from MSU’s Museum of the Rockies. Courtesy photo illustration, photo by Denver Fowler. Credit: Elizabeth Freedman Fowler
A previously undiscovered dinosaur species, first uncovered and documented by an adjunct professor at Montana State University, showcases an evolutionary transition from an earlier duckbilled species to that group’s descendants, according to a paper published in the journal PLOS ONE.
The paper was written by that professor, Elizabeth Freedman Fowler, and her mentor, MSU paleontologist Jack Horner, Montana University System Regents Professor and curator of paleontology at MSU’s Museum of the Rockies. Their findings highlight how the new species of duckbilled dinosaur neatly fills a gap that had existed between an ancestral form with no crest and a descendant with a larger crest, providing key insight into the evolution of elaborate display structures in these gigantic extinct herbivores.
“It is really gratifying to see Dr. Freedman Fowler’s work, which is essentially her dissertation, published in PLOS ONE,” Horner said. “It is confirmation that she is an excellent paleontologist, helping further cement MSU’s reputation for offering graduate students a chance to be part of something extraordinary.”
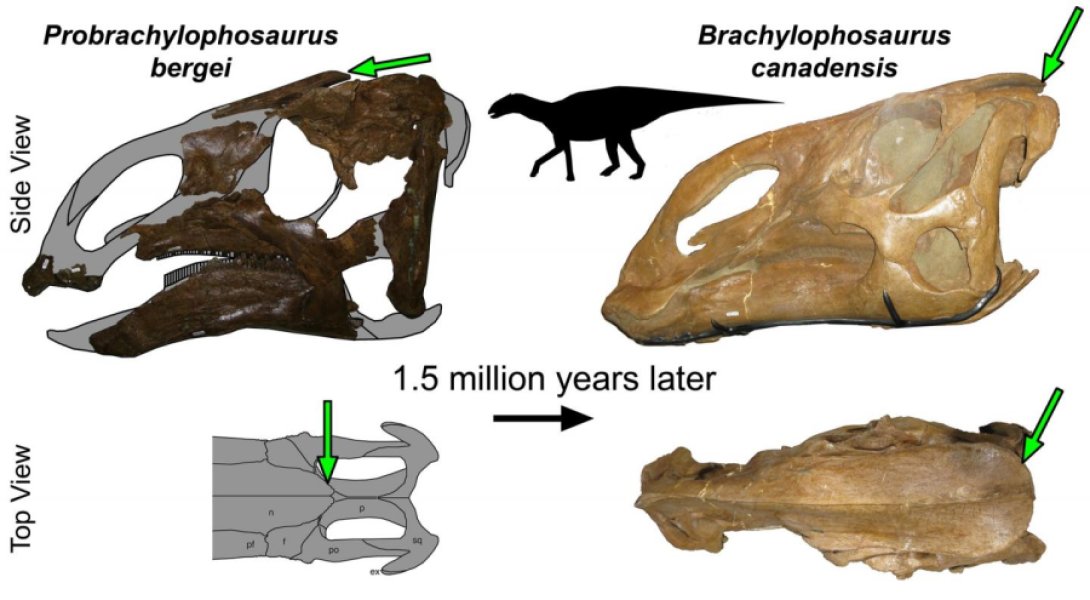
In their paper, Freedman Fowler and Horner named the dinosaur Probrachylophosaurus bergei and suggest it is a previously missing link between a preceding species, Acristavus, which lived about 81 million years ago, and later form Brachylophosaurus, which lived about 77.5 million years ago.
“The crest of Probrachylophosaurus is small and triangular, and would have only poked up a little bit on the top of the head, above the eyes,” said Freedman Fowler, who received her doctorate in paleontology from MSU’s Earth Sciences Department in 2015. She also serves as curator of paleontology at the Great Plains Dinosaur Museum in Malta.
The other bones in its skull are very similar to those of Acristavus and Brachylophosaurus, Freedman Fowler said. However, Acristavus does not have a crest; the top of its skull is flat, while Brachylophosaurus has a large flat paddle-shaped crest that completely covers the back of the top of its skull.
“Probrachylophosaurus is therefore exciting because its age — 79 million years ago — is in between Acristavus and Brachylophosaurus, so we would predict that its skull and crest would be intermediate between these species. And it is,” Freedman Fowler said. “It is a perfect example of evolution within a single lineage of dinosaurs over millions of years.”
During the summer of 2007, Freedman Fowler was leading a crew from the Museum of the Rockies in excavating a bed of earth near the town of Rudyard in north central Montana. The site contained fossils of duckbilled dinosaurs. A visiting school group discovered bones poking out of an old quarry originally worked by a group from the University of California Berkeley in 1981.
Horner recognized that some of the new bones were parts of a skull, which is the most crucial part of the skeleton for identifying the species. Hopeful that more of the skull might be found, he asked Freedman Fowler to switch her crew over to the old Berkeley quarry to see what else might emerge.
“The first bones we uncovered were the pelvis and parts of the legs; which were so large it led to the site being given the nickname ‘Superduck,'” Freedman Fowler said.
After returning to the lab to clean and identify everything the crew had collected, Freedman Fowler and Horner discovered they had most of the skull and postcranium of a new kind of dinosaur.
A nearby site also revealed a fragmentary juvenile of the transitional Probrachylophosaurus, which suggests that successive generations of the Brachylophosaurus lineage grew larger crests by changing the timing or pace of crest development during growth into adulthood. This change in the timing or rate of development is called heterochrony, a process which is being increasingly recognized as a major driving force in evolution.
“Heterochrony is key to understanding how evolution actually occurs in these dinosaurs, but to study heterochrony we need large collections of dinosaurs with multiple growth stages, and a really precise time framework for the rock formations that we collect them from,” said Freedman Fowler.
It is research that has become increasingly possible with recent technical advances in the radiometric dating of rocks coupled with increased intensity of fossil collecting in North America, she added.
“The Late Cretaceous of western North America is the only place in the world where we can do these kinds of intense paleobiological studies on dinosaurs,” Freedman Fowler said. “Nowhere else combines the precise dating of rocks coupled with an exceptional fossil record that has been so extensively collected.”
Horner agreed, adding that he’d begun digging fossils in this particular location at the beginning of his career.
“It is really exciting to see that we are still making significant discoveries there,” Horner said. “And it’s great to see our graduate students taking the lead in pushing for even more.”
The description of Probrachylophosaurus bergei detailed in PLOS ONE is just the first in a series of papers Freedman Fowler and Horner expect to publish based on specimens resulting from the fieldwork in the Judith River Formation.
Reference:
Elizabeth A. Freedman Fowler, John R. Horner. A New Brachylophosaurin Hadrosaur (Dinosauria: Ornithischia) with an Intermediate Nasal Crest from the Campanian Judith River Formation of Northcentral Montana. PLOS ONE, 2015; 10 (11): e0141304 DOI: 10.1371/journal.pone.0141304
The DST_NRF Centre of Excellence in Paleosciences and the Evolutionary Studies Institute (ESI) at Wits University revealed its latest dinosaur find yesterday, 10 November 2015 at the Origins Centre.
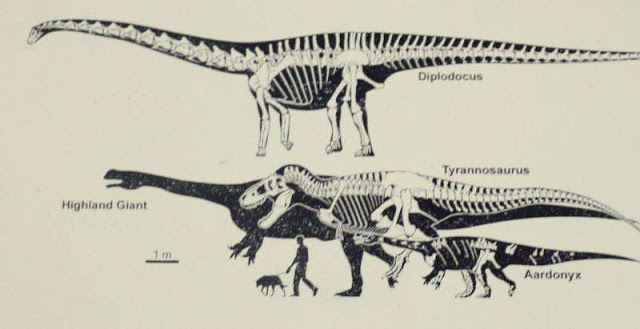
A group of Wits Researchers based at the ESI revealed a thighbone of a 200-million-year-old “Highland Giant”. The dinosaur is thought to be the largest animal ever found in South Africa’s Karoo and is estimated to have weighed10-tonnes and fed on plants.
The discovery of the giant femur dates back to over 20 years ago when the first part of this giant animal were found during excavations under the Caledon River for the Lesotho Highlands Water Project.
The bones were put together in a collection and it was later discovered that they belonged to a single giant. Some of the bones found include an elbow, vertebrae and some claw pieces.
The 200-million-year old dinosaur is yet unnamed.
“This is the biggest dinosaur we have ever found. We do not know what the species is, hopefully we will know in a year or so. We not are not sure if this is a new species. We are not sure if this is the biggest discovered species ever found,” says Dr Jonah Choiniere, Senior Researcher from the ESI.
Choiniere announced the new find and also showed some of the recent discoveries of early dinosaurs which contribute significantly to the rich palaeontology history of South Africa.
The Wits announcements coincided with the celebration of UNESCO’s World Science Day for Peace and Development. The unveiling was accompanied by the launch of a poster of South African dinosaurs.
The poster portrays a colourful wonderland that was South Africa some 200-million-years-ago when continents were splitting apart and early dinosaurs roamed the Earth. The poster was designed by Maggie Newman.
In addition to dinosaurs, the poster also depicts the flora of the time and other animals.
The original fossils of the dinosaur depicted in the poster are on display at institutions and museums around the country.
“We think that this poster will show young learners…. ‘yes, South Africa does have dinosaurs’. And we hope that it will get them excited about studying the science behind South Africa’s incredible paleosciences heritage,” says Choiniere.
The poster is available for free and upon request to all visitors to the Origins Centre while stocks last and it will also be distributed to science centres, museums and visiting schools in the country.
Choiniere also gave an informal tour of the new and revamped James Kitching Gallery which houses dinosaur and pre-dinosaur fossils .
The Kitching Gallery is open to the public and is adjacent to the Origins Centre at the Wits Braamfontein Campus East.
The new dinosaur specimen and many other discoveries will be on display at the Kitching Gallery until the middle of January 2016.
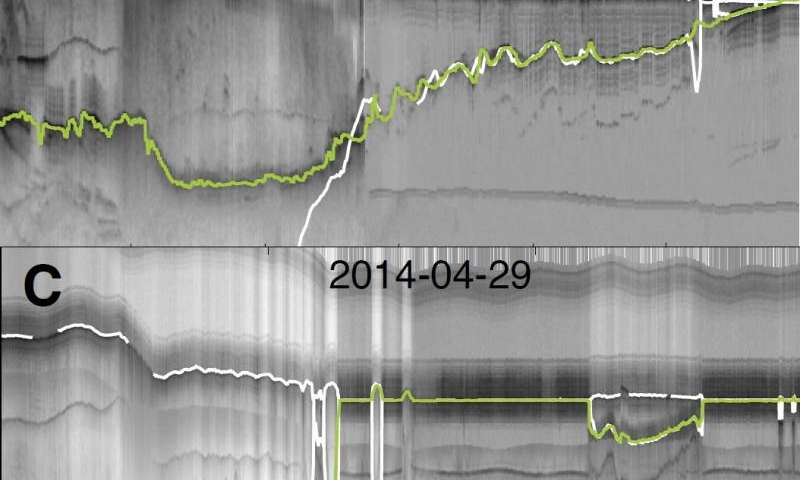
Radar depth-sounder data from before and after the breakup of the Zachariæ Isstrøm ice shelf. The green line reveals the ice bottom, and loss of ice between 1999-2014. The white line represents hydrostatic equilibrium estimates of the ice bottom. Credit: University of Kansas
A study appearing in Science magazine today shows a vast ice sheet in northeast Greenland has begun a phase of speeded-up ice loss, contributing to destabilization that will cause global sea-level rise for “decades to come.”
A team of scientists, including a researcher from the University of Kansas-based Center for Remote Sensing of Ice Sheets (CReSIS), found that since 2012 warmer air and sea temperatures have caused the Zachariæ Isstrøm ice sheet to “retreat rapidly along a downward-sloping, marine-based bed.”
By itself, the Zachariæ Isstrøm glacier holds enough water to trigger a half-meter rise in ocean levels around the world.
“The acceleration rate of its ice velocity tripled, melting of its residual ice shelf and thinning of its grounded portion doubled, and calving is occurring at its grounding line,” the authors wrote.
“Ice loss is happening fast in glaciological terms, but slow in human terms—not all in one day or one year,” said John Paden, associate scientist for CReSIS and courtesy associate professor of electrical engineering and computer science at KU, who helped analyze data about the thickness of the glacier’s ice for the study.
Paden’s collaborators include J. Mouginot, E. Rignot, B. Scheuchl, M. Morlighem and A. Buzzi from the University of California Irvine, along with I. Fenty and A. Khazendar of the California Institute of Technology.
“Within a few generations, ice loss could make a substantial difference in sea levels,” Paden said. “When you add up all the glaciers that are retreating, it will make a difference to a large number of people. Sea level has increased some over the last century, but only a small number of people have been affected compared to what is likely to come.”
Paden crunched data acquired by CReSIS during NASA’s Operation IceBridge and previous NASA flights over Greenland, including decades-old measurements of Zachariæ Isstrøm. The sensor development and data processing tools used to do this were funded through National Science Foundation and NASA grants, with the support of many CReSIS collaborators.
“There are several other sources of data, but one of them is the Landsat satellite imagery that goes back to 1975,” Paden said. “With that, you can look at what the ice shelf is doing, how it’s shrinking over time. Satellite optical and radar imagery were used to measure surface-velocity changes over time and to measure the position of the grounding line based on tidal changes.”
Paden said the “grounding line,” or the boundary between land and sea underneath a glacier, is a zone of special interest.
“The grounding line is where the ice sheet starts to float and is where the ice flux was measured,” Paden said. “The grounding line is a good place to determine thickness across the ice. The terminus of Zachariæ Isstrøm is now at the grounding line—the ocean is right up against the grounded part of the glacier.”
While air temperatures have warmed, causing boosted surface runoff, Paden said ice loss from calving off the front of the glacier into the ocean accounts for most of the ice mass reduction from Zachariæ Isstrøm.
“Ice floating out into the ocean and melting is greater than the ice lost from surface melting,” he said.
A neighboring glacier with an equal amount of ice, named Nioghalvfjersfjorden, is also melting fast but receding gradually along an uphill bed, according to the researchers. Because Zachariæ Isstrøm is on a downslope, it’s disappearing faster.
“The downward slope combined with warming ocean temperatures is what seems to be causing the acceleration now and why we predict it will continue to accelerate over the next few decades,” Paden said. “Until its grounding line is pinned on an upslope bed, then the dynamic effect is expected to decrease.”
Together, the ice in Zachariæ Isstrøm and Nioghalvfjersfjorden represent a 1.1-meter rise in sea levels worldwide. According to the KU researcher, the team’s work is intended to inform people in coastal areas who need to make choices about the future.
“From a societal standpoint, the reason why there’s so much focus on ice sheets is because predicted sea level rise will affect nearly every coastal country—the United States for sure, and low-lying countries with limited resources are likely to be the worst off. Mass displacements of potentially millions of people will affect countries that have no coastlines. We study this to have an understanding of how soon things are likely to happen and to help us use our limited resources mitigate the problem.”
Reference:
“Fast retreat of Zachariæ Isstrøm, northeast Greenland,” by J. Mouginot et al. DOI: 10.1126/science.aac7111
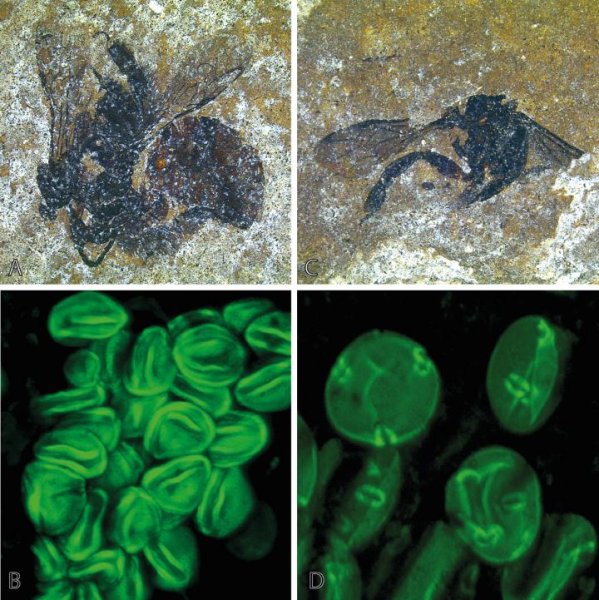
This image shows two fossilized bees and a few sample pollen types that were stuck to their back legs. Credit: Copyright AG Wappler/Uni Bonn
The ancestors of honeybees, living 50 million years ago, were fairly choosy when it came to feeding their offspring. This is shown in a study sponsored by the University of Bonn, which also included researchers from Austria and the United States. According to the study, the pollen that these insects collected for their larvae always originated from the same plants. When it came to their own meals, they were less picky — on their collection flights, they ate pretty much everything that turned up in front of their mouth parts. The findings from this study have now appeared in Current Biology.
The paleontologists studied fossilized bees from two different locations: the Messel Pit near Darmstadt and Eckfeld Maar in the Vulkaneifel. Both are former volcanic crater lakes, so deep that there was no oxygen to be found at the bottom. Any animals or plants that fell into the water were thus outstandingly preserved in the bottom sediment.
Nearly 50 million years ago, numerous bees met this very fate. Many of them were very well preserved in the oil shale rock. “For the first time, we are taking advantage of this circumstance in order to get a closer look at the pollen on the bees’ bodies,” explains Dr. Torsten Wappler. Dr. Wappler, an associate professor at the Steinmann Institute for Geology, Mineralogy and Paleontology at the University of Bonn, is the first author of the study.
Bees were both generalists and specialists
In their analyses, the researchers noticed a strange pattern: the pollen near the hymenoperans’ heads, chests and abdomens came from completely different plants. The pollen on their back legs, on the other hand, mainly came from evergreen bushes, which produce very similar blossoms.
The back legs of the long-extinct hymenoptera featured characteristic structures. The bees used them as transport containers (today’s honeybees have a very similar arrangement on their back legs). The insects used their front legs to comb pollen grains out of their body hair, and then transferred the pollen to their back legs.
However, this only worked if their front legs could reach the pollen easily — we human beings have trouble scratching between our shoulder blades, after all. “The bushes where the worker bees collected food for their larvae all had a similar blossom structure,” explains Dr. Wappler. “After they visited those blossoms, the pollen mainly stuck to parts of their bodies where it was easy to transfer to their legs.”
The prehistoric bees seemed to know which plants would give them a successful harvest, and they mainly targeted those blossoms. If they got hungry on the way, they landed on plants along their flight path and sipped the nectar. The pollen that stuck to their bodies shows how undiscriminating they were in their snacking.
Searching for food without wasting time
“This was a good strategy for the bees,” points out Dr. Wappler. “When they were looking for food for the larvae, they visited blossoms that offered a high yield with little effort. On the way there, on the other hand, they ate whatever they happened to find. So they didn’t waste any time looking for especially delicious or nutritious food.”
There was one thing that especially surprised the researchers: the bees from Eckfeld Maar were 44 million years old, while those from Messel were 48 million years old. Nonetheless, they had very similar pollen patterns on their legs and bodies. Even among the precursors of today’s bumblebees, the distribution was very similar. The dual strategy thus seems to have been common in various species, and stayed consistent for millions of years.
Even today, our honeybees use a similar approach. It is possible that the very first bees, which populated the earth about 100 million years ago, did the same thing. “Unfortunately there are no finds from that era that would allow us to analyze the pollen,” says Dr. Wappler.
Reference:
Torsten Wappler, Conrad C. Labandeira, Michael S. Engel, Reinhard Zetter, Friðgeir Grímsson. Specialized and Generalized Pollen-Collection Strategies in an Ancient Bee Lineage. Current Biology, 2015; DOI: 10.1016/j.cub.2015.09.021
The discovery of a tiny, 170-million-year-old fossil on the Isle of Skye, off the north-west coast of the UK, has led Oxford University researchers to conclude that three previously recognised species are in fact just one.
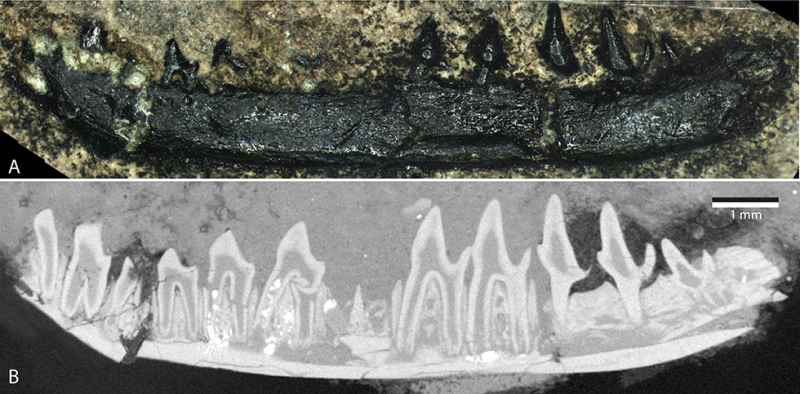
During a fossil-hunting expedition in Scotland last year, a team of researchers from the University’s Department of Earth Sciences discovered the fossilised remains of a mouse-sized mammal dating back around 170 million years to the Middle Jurassic period. The new find – a tiny lower jaw bearing 11 teeth – shows that that three species previously described on the basis of individual fossilised teeth actually belong to just one species.
The United Kingdom has yielded many important mammalian fossils from the Middle Jurassic, a period dating between 176 and 161 million years ago, with most being found in the Scottish Isles and around Oxfordshire. Indeed, specimens obtained from Kirtlington Quarry – just 10 miles north of Oxford – have provided some of the richest Middle Jurassic mammal records to date. Included among those are a large number of teeth, each found in isolation, that had been thought to include at least three distinct species of what are known as ‘stem therians’ – ancient relatives of many modern mammals, including rodents and marsupials.
Now, though, the team from Oxford has discovered a fossil which refutes those claims. The team found the 10 millimetre-long fossilised jaw at a site on the west coast of the Isle of Skye. ‘We spent five days exploring the locality, finding nothing especially exciting, and were walking back along the beach to the house where we were staying,’ recalls Dr Roger Close, the lead author of the study. ‘Then, by chance, we spotted this specimen on the surface of a boulder.’
After carefully removing the specimen – a complete left lower jaw of a small mammal – the team carried out a series of analyses to determine its origins. First, they performed a high-resolution x-ray CT scan at the Natural History Museum in London, providing an incredibly detailed 3D model of the fossil that allowed the researchers to glean much more information about its anatomy than could ever be possible by visual inspection. ‘Over half of the fossil is still buried in the rock,’ explains Dr Close. ‘The CT scan allows us to virtually remove this, and explore the whole specimen in exquisite detail.’
From there, they systematically compared the shape of each and every tooth present in the jaw to those found in all similar specimens discovered in the past. They were surprised to find that the new jaw resembled not one species, but three: Palaeoxonodon ooliticus, Palaeoxonodon freemani and Kennetheridium leesi, all known from isolated teeth preserved in rocks of the same age from Oxfordshire.
Differences in tooth shape that had been thought to distinguish three different species were in fact all present in the single lower jaw found on the Isle of Skye. ‘In effect, we’ve “undiscovered” two species,’ explains Dr Close. ‘The new find shows that we should be cautious about naming new types of animals on the basis of individual teeth.’ In a paper published in Palaeontology, the team identifies their find as Palaeoxonodon ooliticus – the name given to the first of the three species to be described back in the late 1970s.
Palaeoxonodon has long been recognised as an important species for understanding the evolution of molar teeth in modern mammals, and this latest discovery sheds more light on the subject. The species appears to show an intermediate step in the evolution of what are known as ‘tribosphenic’ molars – a kind of pestle-and-mortar geometry that is particularly well suited to processing food.
‘Towards the front, three sharp cusps allow the animal to slice up the food, while at the back a flatter, grinding surface crushes it,’ explains Dr Close. ‘It’s an evolutionary innovation that allowed much more versatile ways of feeding to evolve, and it may well have contributed to the long-term success of this group of mammals.’
Reference:
A report of the research, titled ‘A lower jaw of Palaeoxonodon from the Middle Jurassic of the Isle of Skye, Scotland, sheds new light on the diversity of British stem therians. DOI: 10.1111/pala.12218
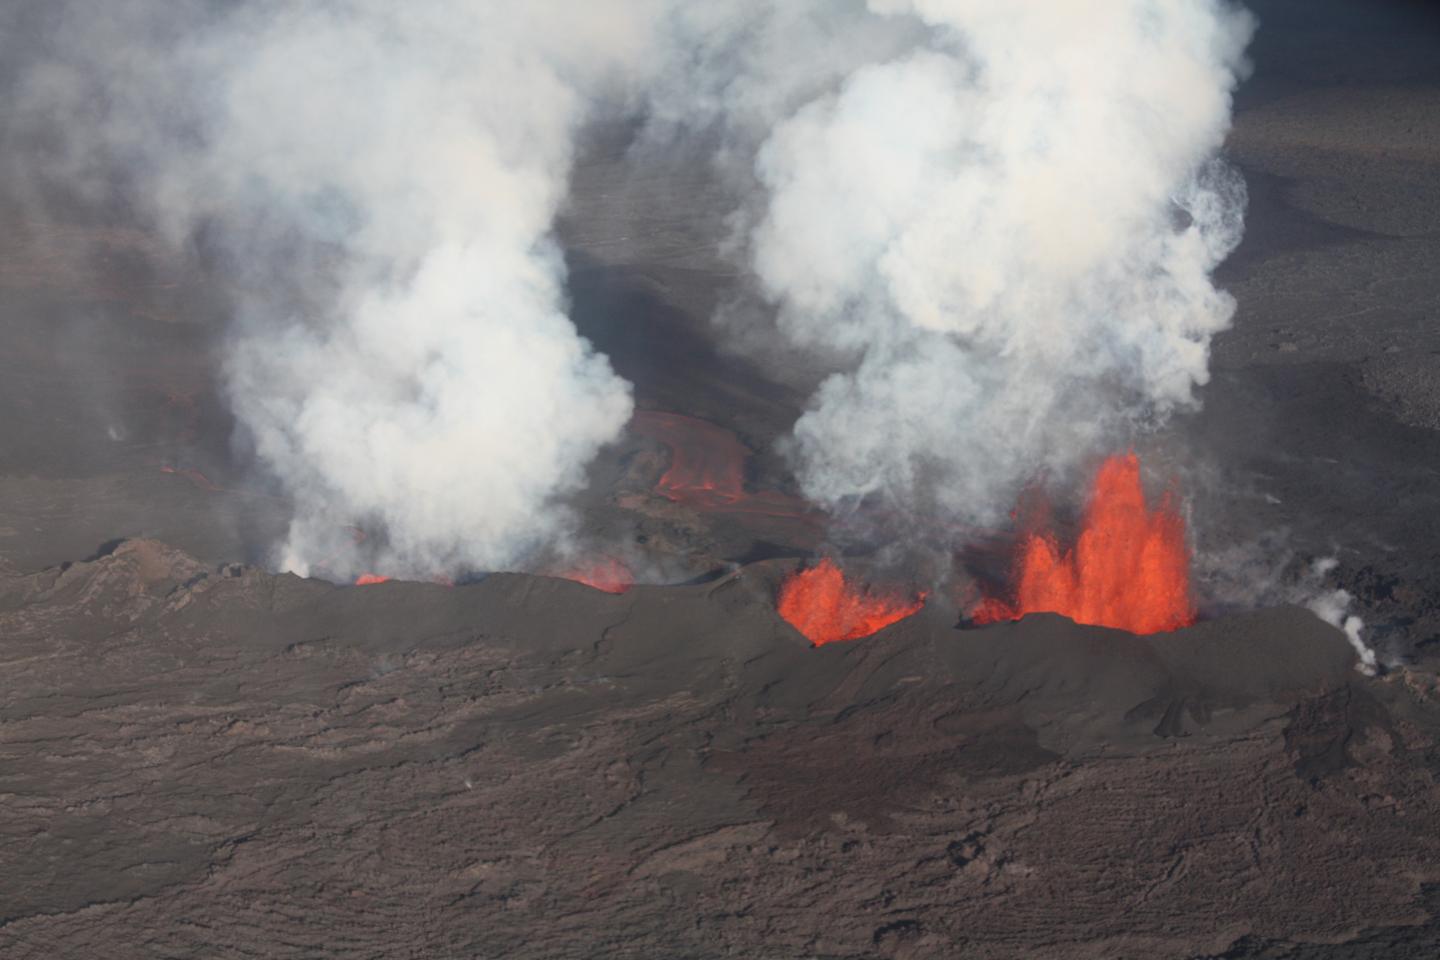
An aerial photograph showing the most recent eruption at the Holuhraun lava field in Iceland. This eruption was fed directly from the Iceland mantle plume, and a proportion of the gas emitted is thought to be water vapor sourced from this plume. We measured Baffin Island and Icelandic rocks where plume water was trapped inside the rocks, rather than being degassed into the atmosphere. Credit: Magnús Tumi Guðmundsson
Analysis of lava from deep within Earth’s mantle suggests that water-soaked dust grains present early in the solar system, as the planets were just beginning to form, are the source of our planet’s water. The lava samples, which offer a highly “pristine” representation of a newborn Earth, add intriguing details to the debate surrounding the planet’s water origins.
Researchers can learn about the origins of water on any planetary body by studying the water’s deuterium/hydrogen (D/H) ratio, the ratio of hydrogen atoms that have one neutron or no neutron, respectively. Different factors, like tectonic mixing, can affect this ratio over time. Only areas deep within Earth that have not been affected by these processes are likely to preserve Earth’s initial D/H ratio, yet such samples are hard to come by.
Here, deep lava flows that churned up basalt from the mantle to the surface of Baffin Island, Canada, provided Lydia Hallis and colleagues with relatively unaltered samples, as confirmed by their helium, neon and lead compositions. Analysis of the basalt’s D/H ratio revealed lower amounts of deuterium than found in previous studies, providing a new baseline for Earth’s original D/H signature. The authors suggest that one possibility for this lower D/H ratio is that the water-soaked dust particles present in the early solar system were embedded within the Earth during its formation. This research appears in the 13 November 2015 issue of Science.
Reference:
Lydia J. Hallis, Gary R. Huss, Kazuhide Nagashima, G. Jeffrey Taylor, Sæmundur A. Halldórsson, David R. Hilton, Michael J. Mottl, Karen J. Meech. Evidence for primordial water in Earth’s deep mantle. DOI: 10.1126/science.aac4834
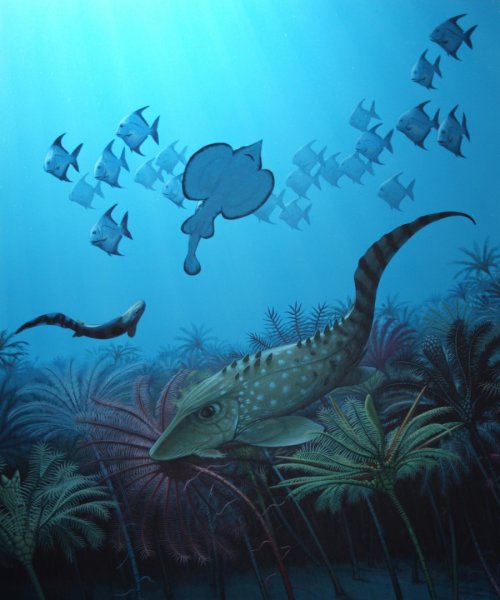
After the Hangenberg mass extinction, small fish dominated the oceans while larger fish mostly died out. Credit: Bob Nicholls
When times are good, it pays to be the big fish in the sea; in the aftermath of disaster, however, smaller is better.
According to new research led by the University of Pennsylvania’s Lauren Sallan, a mass extinction 359 million years ago known as the Hangenberg event triggered a drastic and lasting transformation of Earth’s vertebrate community. Beforehand, large creatures were the norm, but, for at least 40 million years following the die-off, the oceans were dominated by markedly smaller fish.
“Rather than having this thriving ecosystem of large things, you may have one gigantic relict, but otherwise everything is the size of a sardine,” said Sallan, an assistant professor in Penn’s Department of Earth and Environmental Science in the School of Arts & Sciences.
The finding, which suggests that small, fast-reproducing fish possessed an evolutionary advantage over larger animals in the disturbed, post-extinction environment, may have implications for trends we see in modern species today, such as in fish populations, many of which are crashing due to overfishing. The research is reported in Science.
Paleontologists and evolutionary biologists have long debated the reasons behind changes in animal body sizes. One of the main theories is known as Cope’s rule, which states that the body size of a particular group of species tends to increase over time because of the evolutionary advantages of being larger, which including avoiding predation and being better able to catch prey.
Other theories suggest that animals tend to be larger in the presence of increased oxygen, or in colder climates.
Still another idea, known as the Lilliput Effect, holds that after mass extinctions, there is a temporary trend toward small body size. But this theory has only been supported with a limited number of species and is highly debated.
The lack of a firm understanding of body-size trends following mass extinctions, is, according the paper, “a glaring oversight considering current declines in global fish populations.”
To sort out the body-size trends around the Hangenberg Event, Sallan and her coauthor, Andrew K. Galimberti, now a graduate student at the University of Maine, amassed a dataset of 1,120 fish fossils spanning the period from 419 to 323 million years ago. They gathered body-size information from published papers, museum specimens, photographs and bits of fossils for which, based on traits known about the species, they could extrapolate a full size.
Their analysis of these fossils revealed that, in line with Cope’s rule, vertebrates gradually increased in size during the Devonian Period, from 419 to 359 million years ago.
By the end of the Devonian, “there were fish called arthrodire placoderms with large slashing jaws that were the size of school buses, and there were relatives of living tetrapods, or land-dwelling vertebrates, that were almost as large,” Sallan said. “You had some vertebrates that are small, but the majority of residents in ecosystems, from bottom dweller to apex predator, were a meter or more long.”
Then came the mass extinction, which decimated life on the planet. More than 97 percent of vertebrate species were wiped out. Sallan and Galimberti found that, following the extinction event, body size declined and continued downward for much longer than they expected — at least 40 million years.
“Some large species hung on, but most eventually died out,” Sallan said. “So the end result is an ocean in which most sharks are less than a meter and most fishes and tetrapods are less than 10 centimeters, which is extremely tiny. Yet these are the ancestors of everything that dominates from then on, including humans.”
To see if the existing theories relating body size to atmospheric oxygen or temperature could explain their findings, the researchers mapped the body-size trends against climate models of the time period.
“There was no association with either temperature or oxygen, which overturns everything that has been assumed in vertebrates both today and in the past,” Sallan said. “Instead it tells us that these trends must be based entirely on ecological factors.”
The researchers performed further analyses to ensure that sampling biases didn’t affect their study and confirmed that the trends were reflected within major lineages as well as within individual ecosystems.
Sallan said their results suggest that the mass extinction triggered a lasting Lilliput Effect, in which smaller organisms are favored.
“Before the extinction, the ecosystem is stable and thriving so that organisms can spend the time to grow to large sizes before they reproduce, for example,” Sallan said. “But, in the aftermath of the extinction, that ends up being a bad strategy in the long term. So tiny, fast-reproducing fish take over the entire world.”
This pattern mirrors biological succession seen in plant species after a disturbance. Following a forest fire, for example, fast-growing grasses may be the first to colonize an area, followed by shrubs, and only later will large trees come to thrive. While that process occurs on a small scale and may take only decades, it matches the ecosystem and global-scale processes the researchers observed as having occurred during millions of years in the oceans.
With many global fish populations in danger and with some ecologists concerned the planet is on the brink of a sixth major extinction event, this time caused by humans, Sallan said the results should raise alarm about how long large species might take to recover.
“It doesn’t matter what is eliminating the large fish or what is making ecosystems unstable,” she said. “These disturbances are shifting natural selection so that smaller, faster-reproducing fish are more likely to keep going, and it could take a really long time to get those bigger fish back in any sizable way.”
The study was supported by the University of Pennsylvania, Kalamazoo College, the University of Michigan and the Michigan Society of Fellows.
Video
According to new research led by the University of Pennsylvania’s Lauren Sallan, a mass extinction 359 million years ago known as the Hangenberg event triggered a drastic and lasting transformation of Earth’s vertebrate community. Beforehand, large creatures were the norm, but, for at least 40 million years following the die-off, the oceans were dominated by markedly smaller fish.
The finding, which suggests that small, fast-reproducing fish possessed an evolutionary advantage over larger animals in the disturbed, post-extinction environment, may have implications for trends we see in modern species today, such as in fish populations, many of which are crashing due to overfishing.
Reference:
L. Sallan, A. K. Galimberti. Body-size reduction in vertebrates following the end-Devonian mass extinction. Science, 2015; 350 (6262): 812 DOI: 10.1126/science.aac7373
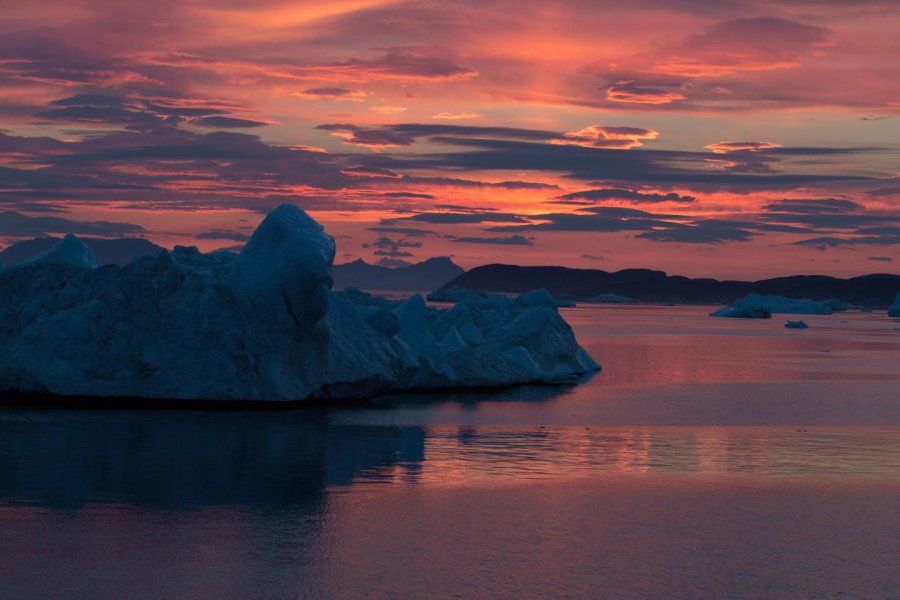
The setting sun paints a dramatic sky over icebergs in a fjord off west Greenland. UC Irvine glaciologists aboard the MV Cape Race in August 2014 mapped for the first time remote Greenland fjords and ice melt that is raising sea levels around the globe. Credit: Maria Stenzel/for UC Irvine
A glacier in northeast Greenland that holds enough water to raise global sea levels by more than 18 inches has come unmoored from a stabilizing sill and is crumbling into the North Atlantic Ocean. Losing mass at a rate of 5 billion tons per year, glacier Zachariae Isstrom entered a phase of accelerated retreat in 2012, according to findings published in the current issue of Science.
“North Greenland glaciers are changing rapidly,” said lead author Jeremie Mouginot, an assistant researcher in the Department of Earth System Science at the University of California, Irvine. “The shape and dynamics of Zachariae Isstrom have changed dramatically over the last few years. The glacier is now breaking up and calving high volumes of icebergs into the ocean, which will result in rising sea levels for decades to come.”
The research team used data from aerial surveys and satellite-based observations acquired by multiple international space agencies.
The highly sensitive radar sounder, gravimeter and laser profiling systems, coupled with radar and optical images from space, monitor and record changes in the shape, size and position of glacial ice over long time periods, providing precise data on the state of Earth’s polar regions.
The scientists determined that the bottom of Zachariae Isstrom is being rapidly eroded by warmer ocean water mixed with growing amounts of meltwater from the ice sheet surface. “Ocean warming has likely played a major role in triggering [the glacier’s] retreat,” Mouginot said, “but we need more oceanographic observations in this critical sector of Greenland to determine its future.”
“Zachariae Isstrom is being hit from above and below,” said senior author Eric Rignot, Chancellor’s Professor of Earth system science at UCI. “The top of the glacier is melting away as a result of decades of steadily increasing air temperatures, while its underside is compromised by currents carrying warmer ocean water, and the glacier is now breaking away into bits and pieces and retreating into deeper ground.”
Zachariae Isstrom neighbors another large glacier, this one named Nioghalvfjerdsfjorden, that also is melting rapidly but is receding at a slower rate because it’s protected by an inland hill. The two glaciers make up 12 percent of the Greenland ice sheet and would boost global sea levels by more than 39 inches if they fully collapsed.
“Not long ago, we wondered about the effect on sea levels if Earth’s major glaciers were to start retreating,” Rignot noted. “We no longer need to wonder; for a couple of decades now, we’ve been able to directly observe the results of climate warming on polar glaciers. The changes are staggering and are now affecting the four corners of Greenland.”
Reference:
J. Mouginot, E. Rignot, B. Scheuchl, I. Fenty, A. Khazendar, M. Morlighem, A. Buzzi, and J. Paden. Fast retreat of Zachariæ Isstrøm, northeast Greenland. Science, 12 November 2015 DOI: 10.1126/science.aac7111
This is a Probrachylophosaurus visual abstract. Credit: Elizabeth Freedman Fowler
The newly described Probrachylophosaurus bergei, a member of the Brachylophosaurini clade of dinosaurs, has a small flat triangular bony crest extending over the skull and may represent the transition between a non-crested ancestor, such as Acristavus, and the larger crests of adult Brachylophosaurus, according to a study published November 11, 2015 in the open-access journal PLOS ONE by Elizabeth Freedman Fowler and John Horner from Montana State University, USA.
Brachylophosaurini is a clade of hadrosaurine dinosaurs currently known from the Late Cretaceous of North America. Its members include Acristavus gagslarsoni (lived ca. ~81-80 million years ago), which lacks a nasal crest, and Brachylophosaurus canadensis (lived ca. ~77.8 million years ago), which possesses a flat paddle-shaped nasal crest projecting back over the top of its skull. The authors of this study describe a new brachylophosaurin hadrosaur, Probrachylophosaurus bergei, from the Judith River Formation in northcentral Montana, dated to ~79.8-79.5 million years ago, and compared its skull and body shape to related dinosaurs.
Elizabeth Freedman Fowler notes: “This part of the Judith River Formation represents a slice of time intermediate between areas where lots of dinosaur fossils have been collected in the past. The new species that we find here are ‘missing links’ between known dinosaur species, so it’s a really exciting field area.”
Probrachylophosaurus’ head shape, most notably the bony triangular nasal crest, falls between Acristavus and Brachylophosaurus. The nasal crest of Probrachylophosaurus is proposed to represent a transitional nasal shape between the non-crested ancestor, such as Acristavus, and the large flat posteriorly oriented nasal crest of adult Brachylophosaurus. Because Probrachylophosaurus is estimated to have lived between the time of the Acristavus and Brachylophosaurus, and have a nose shape intermediate between them, Probrachylophosaurus is hypothesized to be an intermediate member of the Acristavus-Brachylophosaurus evolutionary lineage.
Reference:
Elizabeth A. Freedman Fowler, John R. Horner. A New Brachylophosaurin Hadrosaur (Dinosauria: Ornithischia) with an Intermediate Nasal Crest from the Campanian Judith River Formation of Northcentral Montana. PLOS ONE, 2015; 10 (11): e0141304 DOI: 10.1371/journal.pone.0141304
Note: The above post is reprinted from materials provided by PLOS.
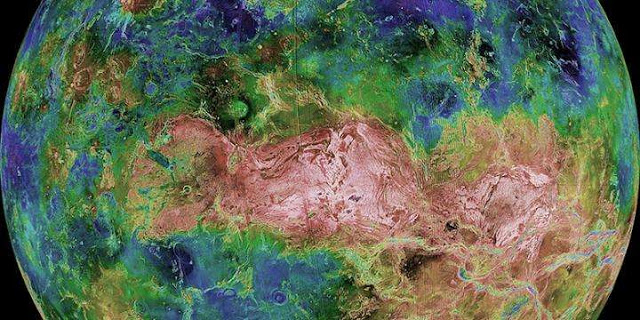
Venus as a model: Today this planet looks like the Earth might have looked before the onset of plate tectonics. Credit: NASA/JPL
“Knowing what a chicken looks like and what all the chickens before it looked like doesn’t help us to understand the egg,” says Taras Gerya. The ETH Professor of Geophysics uses this metaphor to address plate tectonics and the early history of the Earth. The Earth’s lithosphere is divided into several plates that are in constant motion, and today’s geologists have a good understanding of what drives these plate movements: heavier ocean plates are submerged beneath lighter continental plates along what are known as subduction zones. Once the movement has begun, it is perpetuated due to the weight of the dense subducting plate.
But just as in the past, earth scientists still do not understand what triggered plate tectonics in the first place, nor how the first subduction zone was formed. A weak spot in the Earth’s lithosphere was necessary in order for parts of the Earth’s crust to begin their descent into the Earth’s mantle. Was this weak spot caused by a gigantic meteorite that effectively smashed a hole in the Earth’s lithosphere? Or did mantle convection forces shatter the lithosphere into moving parts?
Venus as a model
Gerya is not satisfied with any of these potential explanations. “It’s not trivial to draw conclusions about what set the tectonic movements in motion,” he says. The ETH professor therefore set out to find a new, plausible explanation.
Among other things, he found inspiration in studies about the surface of the planet Venus, which has never had plate tectonics. Gerya observed (and modelled) huge, crater-like circles (coronae) on Venus that may also have existed on the Earth’s surface in the early period (Precambrian) of the Earth’s history before plate tectonics even began. These structures could indicate that mantle plumes once rose from Venus’ iron core to the outer layer, thus softening and weakening the planet’s surface. Plumes form in the deep interior of the planet. They rise up to the lithosphere, bringing with them hot partially molten mantle material that causes the lithosphere to weaken and deform. Halted by the resistance of the hard lithosphere, the material begins to spread, taking on a mushroom-like shape.
Such plumes also likely existed in the Earth’s interior and could have created the weaknesses in the Earth’s lithosphere needed to initiate plate tectonics on Earth.
Mantle plumes create weaknesses
The ETH geophysicist worked with his team to develop new computer models that he then used to investigate this idea for the first time in high resolution and in 3D. The corresponding publication has recently been published in Nature.
The simulations show that mantle plumes and the weaknesses they create could have actually initiated the first subduction zones.
In the simulations, the plume weakens the overlying lithosphere and forms a circular, thinning weak point with a diameter of several dozen to hundreds of kilometres. This is stretched over time by the supply of hot material from the deep mantle. “In order to make a ring larger, you have to break it,” explains the researcher. This also applies to the Earth’s surface: the ring-shaped weaknesses can (in the model) only be enlarged and subducted if the margins are torn.
Water lubricates the plate margin
The tears spread throughout the lithosphere, large slabs of the heavier rigid lithosphere plunge into the soft mantle, and the first plate margins emerge. The tension created by the plunging slabs ultimately sets the plates in motion. They plunge, well lubricated by the buried seawater of the ocean above. Subduction has begun – and with it, plate tectonics. “Water acts as a lubricant and is an absolute necessity in the initiation of a self-sustaining subduction,” says Gerya.
In their simulations, the researchers compare different temperature conditions and lithosphere states. They came to the conclusion that plume-induced plate tectonics could plausibly develop under the conditions that prevailed in the Precambrian around three billion years ago. Back then the Earth’s lithosphere was already thick and cool, but the mantle was still very hot, providing enough energy to significantly weaken the lithosphere above the plumes.
Had the lithosphere instead being thin and warm, and therefore soft, the simulations show that a ring-shaped rapidly descending structure called drip would simply have formed around the plume head. While this would have steadily sunk into the mantle, it would not have caused the soft lithosphere to subduct and tear and therefore would not have produced plate margins. Likewise, the computer simulations showed that under today’s conditions, where there is less temperature difference between lithosphere and plume material, plume-induced subduction is hard to initiate because the lithosphere is already too rigid and the plumes are barely able to weaken it sufficiently.
Dominant mechanism
“Our new models explain how plate tectonics came about,” says the geophysicist. Plume activity was enough to give rise to today’s plate mosaic. He calls the power of the plumes the dominant trigger for global plate tectonics.
The simulations can also explain how so-called triple junctions, i.e. zones in which three plates come together, are nucleated by multi-directional stretching of the lithosphere induced by plumes. One such example of a triple junction can be found in the Horn of Africa where Ethiopia, Eritrea and Djibouti meet.
A possible plume-weakened zone analogous to a starting point for global plate tectonics likely exists in the modern world: the researchers see such a zone in the Caribbean plate. Its shape, location and spread correspond largely to the new model simulations.
Indeed it is arguably impossible to prove how global plate tectonics started on Earth based solely on observations: there is no geophysical and only a small amount of geological data from the Earth’s early years, and laboratory experiments are not possible for extremely large-scale and very long-term tectonic processes, says the ETH researcher. “Computer models are therefore the only way we can reproduce and understand the events of the Earth’s early history.”
Reference:
T. V. Gerya et al. Plate tectonics on the Earth triggered by plume-induced subduction initiation, Nature (2015). DOI: 10.1038/nature15752
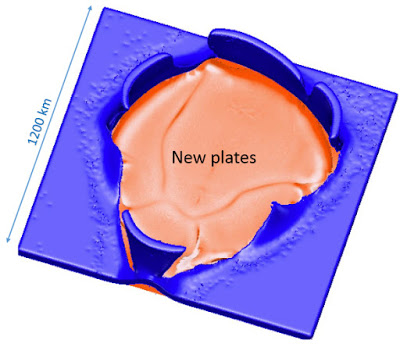
View from the deep Earth of the broken outer shell of the early Earth (blue) and forming of new lithospheric plates (red) as a result of mantle plume-lithosphere interaction in a 3D numerical model Credit: GFZ
Our planet Earth is the only planet in the Solar System that possesses Plate Tectonics. The Earth’s surface is in a constant state of change; the tectonic plates together with the oceans and continents continuously slide along one another, collide or sink into the Earth’s mantle. However, it still remains unclear how Plate Tectonics started on Earth.
An international research team combining modeling experts from the ETH Zürich, the GFZ German Research Centre for Geosciences, and geologists from the University of Texas and Korea University in Seoul have proposed an answer to this question in a recent publication in the journal Nature. Based on advanced high-resolution numerical modeling and geological observations they demonstrate that a hot mantle plume rising to the lithosphere from the deep mantle might have broken the intact outer shell of the early Earth and induced the first large-scale sinking of lithospheric plates, a key process of Plate Tectonics called subduction.
The rigid outer shell of present-day Earth that includes crust and uppermost mantle, i.e. the lithosphere is divided into several plates. Lithospheric plates slide along their boundaries or colliding with each other and some of them, which are cold and heavy enough, sink into the deep mantle. This process, called subduction is the key process of Plate Tectonics responsible for the recycling of the materials of Earth’s crust into the deep mantle and for an efficient cooling of the Earth interior. However, subduction and Plate Tectonics was not always taking place on Earth. During the first 1 or 2 billion years of the 4.5 billion years Earth’s history, the tectonic process was very different, probably similar to present-day Venus, where the lithosphere is not broken into plates and no subduction occurs. So how did the first subduction and Plate Tectonics develop on Earth?
“Three conditions must have been met for the mantle plume to start first long-lived subduction and Plate Tectonics on Earth”, says Stephan Sobolev, Head of Geodynamic Modeling Section at GFZ and Professor of Geodynamics at University of Potsdam. “First, the mantle plume had to be large and hot enough to produce a lot of melt. These melts intruded into the lithosphere above the plume making it mechanically weak and allowing the plume to penetrate into the crust. Second, the lithosphere had to be thick and heavy enough to sink into the mantle”. In the beginning the broken lithosphere around the plume was probably pushed down by the load of the plume material spreading above it and then the sinking parts of the heavy lithosphere pulled down the adjacent lithosphere. “Finally there had to be liquid water in the ocean to lubricate, in a way, the surface of the sinking lithospheric plate” adds Sobolev. “This allowed it to sink deep into the Earth”.
All these conditions were fulfilled sometime in early Earth history, but were never met for other planets of the Solar System. For instance on Venus, which is most similar to the Earth, hot mantle plumes are probably quite common, but the lithosphere is too hot and light and there is no liquid water at the hot surface of Venus.
It was most likely not just an interaction of a single mantle plume with the early Earth lithosphere, but rather a number of such interactions that were responsible for the triggering of Plate Tectonics on Earth. The vigorous inner life of our unique planet created a number of “plate tectonic windows” as shown in the Figure, which joined after some time and induced global Plate Tectonics.
Reference:
T.V. Gerya , R.J. Stern, M. Baes, S.V. Sobolev and S.A. Whattam, Plate tectonics on the Earth triggered by plume-induced subduction initiation, Nature, 12.11.2015, DOI: 10.1038/nature15752
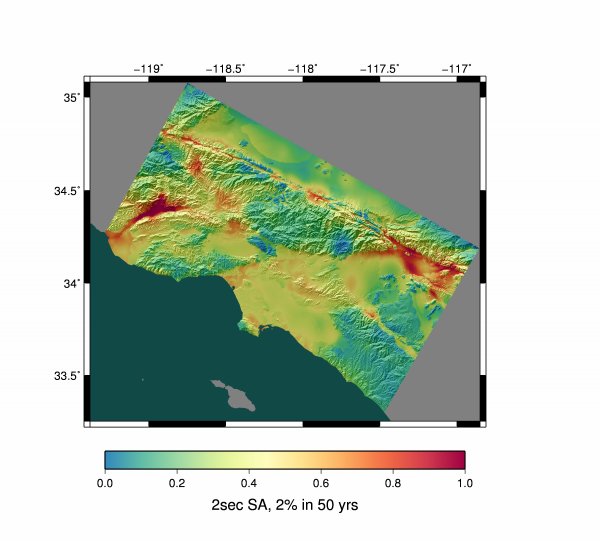
The CyberShake seismic hazard map shows the magnitude, or level of shaking, for the Los Angeles region, defined by the amount of change of a surface or structure in a 2-second period, with a 2% probability of increasing within the next 50 years. The map provides engineers with vital information needed to design more seismically safe structures. Credit: Scott Callaghan, Kevin Milner, and Thomas H. Jordan (Southern California Earthquake Center)
The San Andreas Fault system, which runs almost the entire length of California, is prone to shaking, causing about 10,000 minor earthquakes each year just in the southern California area.
However, cities that line the fault, like Los Angeles and San Francisco, have not experienced a major destructive earthquake — of magnitude 7.5 or more — since their intensive urbanizations in the early twentieth century. With knowledge that large earthquakes occur at about 150-year intervals on the San Andreas, seismologists are certain that the next “big one” is near.
The last massive earthquake to hit San Francisco, having a 7.8 magnitude, occurred in 1906, taking 700 lives and causing $400 million worth of damage. Since then, researchers have collected data from smaller quakes throughout California, but such data doesn’t give emergency officials and structural engineers the information they need to prepare for a quake of magnitude 7.5 or bigger.
With this in mind, a team led by Thomas Jordan of the Southern California Earthquake Center (SCEC), headquartered at the University of Southern California (USC) in Los Angeles, is using the Titan supercomputer at the US Department of Energy’s (DOE’s) Oak Ridge National Laboratory (ORNL) to develop physics-based earthquake simulations to better understand earthquake systems, including the potential seismic hazards from known faults and the impact of strong ground motions on urban areas.
“We’re trying to solve a problem, and the problem is predicting ground shaking in large earthquakes at specific sites during a particular period of time,” Jordan said.
Ground shaking depends upon the type of earthquake, the way a fault ruptures, and how the waves propagate, or spread, through all 3-D structures on Earth.
Clearly, understanding what might happen in a particular area is no simple task. In fact, the prediction involves a laundry list of complex inputs that could not be calculated all together without the help of Titan, a 27-petaflop Cray XK7 machine with a hybrid CPU-GPU architecture. Titan is managed by the Oak Ridge Leadership Computing Facility (OLCF), a DOE Office of Science User Facility located at ORNL.
Running on Titan, the team uses SCEC’s CyberShake — a physics-based computational approach that integrates many features of an earthquake event — to calculate a probabilistic seismic hazard map for California. In May, Jordan’s team completed its highest resolution CyberShake map for Southern California using the OLCF’s Titan.
Shaking It Up
One of the most important variables that affects earthquake damage to buildings is seismic wave frequency, or the rate at which an earthquake wave repeats each second. With greater detail and increases in the simulated frequency — from 0.5 hertz to 1 hertz — the latest CyberShake map is the most useful one to date and serves as an important tool for engineers who use its results to design and build critical infrastructure and buildings.
Building structures respond differently to certain frequencies. Large structures like skyscrapers, bridges, and highway overpasses are sensitive to low-frequency shaking, whereas smaller structures like homes are more likely to be damaged by high-frequency shaking, which ranges from 2 to 10 hertz and above.
High-frequency simulations are more computationally complex, however, limiting the information that engineers have for building safer structures that are sensitive to these waves. Jordan’s team is attempting to bridge this gap.
“We’re in the process of trying to bootstrap our way to higher frequencies,” Jordan said.
Let’s Get Physical
The process that Jordan’s team follows begins with historical earthquakes.
“Seismology has this significant advantage of having well-recorded earthquake events that we can compare our simulations against,” said Philip Maechling, team member and computer scientist at USC. “We develop the physics codes and the 3-D models, then we test them by running a simulation of a well-observed historic earthquake. We compare the simulated ground motions that we calculate against what was actually recorded. If they match, we can conclude that the simulations are behaving correctly.”
The team then simulates scenario earthquakes, individual quakes that have not occurred but that are cause for concern. Because seismologists cannot get enough information from scenario earthquakes for long-term statements, they then simulate all possible earthquakes by running ensembles, a suite of simulations that differ slightly from one another.
“They’re the same earthquake with the same magnitude, but the rupture characteristics — where it started and how it propagated, for example — will change the areas at Earth’s surface that are affected by this strong ground motion,” Maechling said.
As the team increased the maximum frequency in historic earthquake simulations, however, they identified a threshold right around 1 hertz, at which their simulations diverged from observations. The team determined it needed to integrate more advanced physics into its code for more realistic results.
“One of the simplifications we use in low-frequency simulations is a flat simulation region,” Maechling said. “We assume that Earth is like a rectangular box. I don’t know if you’ve been to California, but it’s not flat. There are a lot of hills. This kind of simplifying assumption worked well at low frequencies, but to improve these simulations and their results, we had to add new complexities, like topography. We had to add mountains into our simulation.”
Including topography — the roughness of Earth’s surface — the team’s simulations now include additional geometrical and attenuation (gradual dampening of the shaking due to loss of energy) effects — near-fault plasticity, frequency-dependent attenuation, small-scale near-surface heterogeneities, near-surface nonlinearity, and fault roughness.
On Titan, the team introduced and tested the new physics calculations individually to isolate their effects. By the end of 2014, the team updated the physics in its code to get a complete, realistic simulation capability that is now able to perform simulations using Earth models near 4 hertz.
“The kind of analysis we’re doing has been done in the past, but it was using completely empirical techniques — looking at data and trying to map observations onto new situations,” Jordan said. “What we’re doing is developing a physics-based seismic hazard analysis, where we get tremendous gains by incorporating the laws of physics, to predict what will be in the future. This was impossible without high-performance computing. We are at a point now where computers can do these calculations using physics and improve our ability to do the type of analysis necessary to create a safe environment for society.”
Movers and Shakers
With the new physics included in SCEC’s earthquake code — the Anelastic Wave Propagation by Olsen, Day, and Cui (AWP-ODC) — Jordan’s team was able to run its first CyberShake hazard curve on Titan for one site at 1 hertz, establishing the computational technique in preparation for a full-fledged CyberShake map.
A seismic hazard curve provides all the probabilities that an earthquake will occur at a specific site, within a given time frame, and with ground shaking exceeding a given threshold.
The team used the US Geologic Survey’s (USGS’s) Uniform California Earthquake Forecast — which identifies all possible earthquake ruptures for a particular site — for generating CyberShake hazard curves for 336 sites across southern California.
This May, the team calculated hazard curves for all 336 sites needed to complete the first 1 hertz urban seismic hazard map for Los Angeles. With double the maximum simulated frequency from last year’s 0.5 hertz map, this map proves to be twice as accurate.
The map will be registered into the USGS Urban Seismic Hazard Map project, and when it passes the appropriate scientific and technical review, its results will be submitted for use in the 2020 update of the Recommended Seismic Provisions of the National Earthquake Hazards Reduction Program.
This major milestone in seismic hazard analysis was possible only with the help of Titan and its GPUs.
“Titan gives us the ability to submit jobs onto many GPU-accelerated nodes at once,” Jordan said. “There’s nothing comparable. Even with other GPU systems, we can’t get our jobs through the GPU queue fast enough to keep our research group busy. Titan is absolutely the best choice for running our GPU jobs.”
Yifeng Cui, team member and computational scientist at the San Diego Supercomputer Center, modified AWP-ODC to take advantage of Titan’s hybrid architecture, thereby improving performance and speed-up. He was awarded NVIDIA’s 2015 Global Impact Award for his work.
“It’s fantastic computer science,” Jordan said. “What Yifeng has done is get in and really use the structure of Titan in an appropriate way to speed up what are very complicated codes. We have to manipulate a lot of variables at each point within these very large grids and there’s a lot of internal communication that’s required to do the calculations.”
Using Cui’s GPU-accelerated code on Titan, the team ran simulations 6.3 times more efficiently than the CPU-only implementation, saving them 2 million core hours for the project. Completion of the project required about 9.6 million core hours on Titan.
“The computational time required to do high-frequency simulations takes many node hours,” Maechling said. “It could easily take hundreds of thousands of node hours. That’s a huge computational amount that well exceeds what SCEC has available at our university. These pushing-to-higher-frequency earthquake simulations require very large computers because the simulations are computationally expensive. We really wouldn’t be able to do these high-frequency simulations without a computer like Titan.”
With Titan, Jordan’s team plans to push the maximum simulated frequency above 10 hertz to better inform engineers and emergency officials about potential seismic events, including the inevitable “big one.”
“We have the potential to have a positive impact and to help reduce the risks from earthquakes,” Maechling said. “We can help society better understand earthquakes and what hazards they present. We have the potential to make a broad social impact through safer environment.”
Video
Click on image above to view an animation of the wave propagation during a simulated Magnitude 7.8 earthquake rupturing the San Andreas Fault from southwest to northeast. Red/blue colors reflect the intensity of shaking; green indicates areas of permanent ground deformation. The colored vertical “signals” show the evolution of seismograms at three locations.
Credit: Animation courtesy of Daniel Roten, San Diego State University
A gas and particle rich plume emanates from molten lava beneath Halema’uma’u Crater at the summit of K?lauea Volcano on the Island of Hawai’i. Vog is created when volcanic plumes react in the atmosphere. Credit: USGS, Michael Poland.
A paper published this month in the Bulletin of the American Meteorological Society details the development and utility of a computer model for the dispersion of volcanic smog or “vog,” which forms when volcanic sulfur dioxide gas interacts with water and coverts it to acid sulfate aerosol particles in the atmosphere.
Vog poses a serious threat to the health of Hawai’i’s people as well as being harmful to the state’s ecosystems and agriculture. Even at low concentrations, which can be found far from the volcano, vog can provoke asthma attacks in those with prior respiratory conditions. It also damages vegetation and crops downwind from the volcano.
Scientists from the UH Mānoa School of Ocean and Earth Science and Technology (SOEST), under the leadership of Dr. Steve Businger, and in collaboration with researchers at the Hawaiian Volcano Observatory, developed a computer model for predicting the dispersion of vog. The vog model uses measurements of the amount of sulfur dioxide (SO2) emitted by Kilauea, along with predictions of the prevailing winds, to forecast the movement of vog around the state.
The team of scientists developed an ultraviolet spectrometer array to provide near real-time volcanic gas emission rate measurements; developed and deployed SO2 and meteorological sensors to record the extent of Kīlauea’s gas plume (for model verification); and developed web-based tools to share observations and model forecasts, providing useful information for safety officials and the public, and raising awareness of the potential hazards of volcanic emissions to respiratory health, agriculture and general aviation.
“Comparisons between the model output and vog observations show what users of the vog model forecasts have already guessed — that online model data and maps depicting the future location and dispersion of the vog plume over time are sufficiently accurate to provide very useful guidance, especially to those among us who suffer allergies or respiratory conditions that make us sensitive to vog,” said Businger.
Kilauea volcano, the most active volcano on earth, is situated on Hawai’i Island. The current eruption has been ongoing since 1983, while a new summit eruption began in 2008. The most significant effect of this new eruption has been a dramatic increase in the amount of volcanic gas that is emitted into Hawai’i’s atmosphere. While the effects of lava eruption are limited to the southeastern sector of the Big Island, the volcanic gas emitted by Kilauea is in no way constrained; it is free to spread across the entire state.
Said Businger, “Higher gas fluxes from Kilauea appear to be the new norm. For the State of Hawai’i to understand the effects of vog and then come up with strategies to efficiently mitigate its effects, accurate forecasts of how vog moves around the state are vital.”
The American Recovery Act award that originally funded the development of the vog model program has long since expired. Funding for a PhD candidate, Andre Pattantyus, to help keep the online vog products available has been provided by SOEST and the Joint Institute for Marine and Atmospheric Research (JIMAR) at UH SOEST. Because Andre Pattantyus, the lead vog modeler, is set to graduate this winter, the vog program is at a crossroads. Businger is working with stakeholders that include federal, state, commercial and private interests to jointly fund an ongoing vog and dispersion modeling capability for the residents of Hawai’i.
Public support of the vog modeling program is critical for the program to continue providing vog plume predictions in future.
Reference:
Steven Businger, Roy Huff, Andre Pattantyus, Keith Horton, A. Jeff Sutton, Tamar Elias, Tiziana Cherubini. Observing and Forecasting Vog Dispersion from Kīlauea Volcano, Hawaii. Bulletin of the American Meteorological Society, 2015; 96 (10): 1667 DOI: 10.1175/BAMS-D-14-00150.1
The anticipated melting of the massive West Antarctic Ice Sheet could be slowed by two big factors that are largely overlooked in current computer models, according to a new study.
The findings, published online in Nature Communications, suggest that the impact on global sea levels from the retreating ice sheet could be less drastic — or at least more gradual — than recent computer simulations have indicated.
Over the past year, numerous studies have warned that parts of the West Antarctic Ice Sheet are on the verge of a runaway retreat. Just last week a high-profile research paper forecast that this could lead eventually to a rise in global sea levels of as much as three metres.
The authors of the new Nature Communications paper, however, focus on two geophysical elements that they say aren’t adequately reflected in computer simulations for this region: the surprisingly powerful gravitational pull of the immense ice sheet on surrounding water, and the unusually fluid nature of the mantle beneath the bedrock that the ice sits on.
“The fate of the polar ice sheets in a warming world is a major concern for policy makers — and attention is rightly focused on the importance of restraining CO2 emissions and preparing for rising sea levels,” says lead author Natalya Gomez, an assistant professor of Earth and Planetary Sciences at McGill University in Montreal. “But our study shows that for Antarctica, in particular, computer models also need to take into account how gravitational effects and variations in Earth structure could affect the pace of future ice-sheet loss.”
The gravity effect
Most people think of gravity as the force that keeps our feet on the ground. But any large body — such as a massive expanse of ice — exerts a gravitational pull on other bodies, including water.
As the West Antarctic Ice Sheet melts, the researchers project, the reduction in its mass would reduce the gravitational pull to such an extent that it would lower sharply the sea level near the ice. This, in turn, would slow the projected pace of retreat of the ice sheet.
The elasticity effect
Gomez and co-authors David Pollard of Pennsylvania State University and David Holland of New York University also factor another important variable into their simulations. When an ice sheet retreats, the solid Earth beneath it, freed from the load of the ice, rebounds upward. This rebound occurs in two parts: an elastic component that happens right away, and a viscous component that happens over hundreds to thousands of years. (The Earth’s interior — or mantle — flows like a fluid but very slowly because it is very viscous).
The West Antarctic sits atop a region where the mantle flows more easily than in other parts of the Earth. So the land there will pop up faster than scientists — and their computer models — would expect based on the average viscosity of the Earth’s mantle.
“Our simulations show that when we assume a structure for the Earth’s interior that resembles the structure underneath the West Antarctic, the Earth’s surface rebounds higher and more quickly near the edge of the retreating ice sheet,” says co-author Holland of NYU. “This makes the water along that edge shallower, which slows the retreat of the ice sheet.”
CO2 emissions a crucial factor
The researchers’ simulations also confirm that the levels of future CO2 emissions will be a crucial factor in the pace of retreat for the region’s ice. “The lower the levels of CO2 in the atmosphere, the more the geophysical factors will be able to help stem the ice’s retreat,” Gomez says. “The greater the emissions, the more the geophysical forces risk being overwhelmed by the strength of warming.”
Reference:
Natalya Gomez, David Pollard, David Holland. Sea-level feedback lowers projections of future Antarctic Ice-Sheet mass loss. Nature Communications, 2015; 6: 8798 DOI: 10.1038/ncomms9798