New experiments indicate that it’s possible the Moon’s interior rock may contain some water, in contrast to prior findings that indicated the lunar subsurface is totally dry. Credit: NASA/Goddard/Lunar Reconnaissance Orbiter
Scientists have long wondered if water lurks beneath the Moon’s surface. Many thought the scalding impact that formed the Moon long ago would have reduced or eliminated most volatile elements, including chlorine, and the hydrogen necessary to form water. Also, persuasive 2010 work on chlorine isotopes points to a bone-dry interior, despite signatures of water and other volatiles in lunar volcanic glasses. Now new experimental findings presented Thursday at the 2015 American Geophysical Union Fall Meeting in San Francisco, Calif., suggest that lunar subsurface water, today or in the past, remains a possibility after all.
Simulated Magma Cooling
A sinuous channel created by a lava flow on the lunar surface indicates past volcanic activity on the Moon. New experiments suggest that if lunar magmas had contained water, they would have lost it quickly upon reaching the surface. Credit: NASA/GSFC/Arizona State University
Knowing that compositions of lunar magmas offer snapshots of the Moon’s interior, a team of scientists has recreated lunar subsurface conditions in the lab to investigate the fates of possible interior water and other volatiles that such magmas may have contained.
The researchers used an apparatus called a piston cylinder to melt pieces of synthetic magma based on the chemical recipes of soil samples collected by Apollo 14. The tests subjected the rocks to the temperatures and pressures expected 100 kilometers beneath the lunar surface. Once the simulated magma melted at 1400°C, the researchers allowed it to cool and crystallize at varying rates: from 10 minutes to 6 hours.
“We simulated magma coming to the surface, then cooled it quickly or slowly,” said Gokce Ustunisik, a research and education fellow in the Department of Earth and Planetary Sciences at the American Museum of Natural History in New York City and lead author of the study. As the faux magma cooled, the team measured chemical ratios and abundances, which “told us how volatiles escaped,” she added.
Water was the quickest to go. After only 10 minutes, 95% had evaporated, compared to 63% of chlorine and 38% of fluorine. After the water had vanished, the other chemicals “played their own game,” Ustunisik said. For longer-cooling magma, most of the volatiles were gone by the 6-hour mark: 95% of the chlorine had evaporated, and 71% of fluorine had vaporized.
No Water or Escaped Water?
The rapid water loss could answer why scientists haven’t seen much water in soil samples collected from the Moon even if water was present in the Moon’s subsurface, Ustunisik explained. Even if magma had cooled very quickly, water still would have escaped, she said.
This experiment “threw a monkey wrench” into the idea that previous analyses, based on chlorine isotopes, are sufficient to infer the Moon is anhydrous, said Ricardo Arevalo, a NASA researcher studying mantle-derived materials at Goddard Space Flight Center in Greenbelt, Md., who was not involved in the study. “It’s more complicated than that.”
Scientists from the American Museum of Natural History in New York City; Stony Brook University in Stony Brook, N.Y.; and the University of New Mexico in Albuquerque collaborated on this new study.
Using mathematical models, scientists have ‘looked’ into the interior of super-Earths and discovered that they may contain compounds that are forbidden by the classical rules of chemistry — these substances may increase the heat transfer rate and strengthen the magnetic field on these planets. The findings have been presented in a paper published in the journal Scientific Reports.
The authors of the paper are a group of researchers from MIPT led by Artem Oganov, a professor of the Skolkovo Institute of Science and Technology and the head of the MIPT Laboratory of Computer Design. In a previous study, Oganov and his colleagues used an algorithm created by Oganov called USPEX to identify new compounds of sodium and chlorine, as well as other exotic substances.
In their latest paper, the researchers attempted to find out which compounds may be formed by silicon, oxygen, and magnesium at high pressures. These particular elements were not chosen by chance.
“Earth-like planets consist of a thin silicate crust, a silicate-oxide mantle — which makes up approximately 7/8 of the Earth’s volume and consists more than 90% of silicates and magnesium oxide — and an iron core. We can say that magnesium, oxygen, and silicon form the basis of chemistry on Earth and on Earth-like planets,” says Oganov.
Using the USPEX algorithm, the researchers investigated various structural compositions of Mg-Si-O that may occur at pressures ranging from 5 to 30 million atmospheres. Such pressures may exist in the interior of super-Earths — planets with a solid surface mass several times greater than the mass of the Earth. There are no planets like this in the solar system, but astronomers know of planets orbiting other stars that are not as heavy as the gas giants, but are considerably heavier than the Earth. They are called super-Earths. These planets include the recently discovered Gliese 832c, which is five times heavier than the Earth, or the mega-Earth Kepler-10c, which is 17 times heavier than the Earth.
The results of the computer modelling show that the interior of these planets may contain the “exotic” compounds MgSi3O12 and MgSiO6. They have many more oxygen atoms than the MgSiO3 on Earth.
In addition, MgSi3O12 is a metal oxide and a conductor, whereas other substances consisting of Mg-Si-O atoms are dielectrics or semiconductors. “Their properties are very different to normal compounds of magnesium, oxygen, and silicon – many of them are metals or semiconductors. This is important for generating magnetic fields on these planets. As magnetic fields produce electrical currents in the interiors of a planet, high conductivity could mean a significantly more powerful magnetic field,” explains Oganov.
A more powerful magnetic field means more powerful protection from cosmic radiation, and consequently more favourable conditions for living organisms. The researchers also predicted new magnesium and silicon oxides that do not fit in with the rules of classical chemistry — SiO, SiO3, and MgO3, in addition to the oxides MgO2 and Mg3O2 previously predicted by Oganov at lower pressures.
The computer model also enabled the researchers to determine the decomposition reactions that MgSiO3 undergoes at the ultra-high pressures on super-Earths — post-perovskite.
“This affects the boundaries of the layers in the mantle and their dynamics. For example, an exothermic phase change speeds up the convection of the mantle and the heat transfer within the planet, and an endothermic phase change slows them down. This means that the speed of motion of lithospheric plates on the planet may be higher,” says Oganov.
Convection, which determines plate tectonics and the mixing of the mantle, can either be faster (speeding up the mixing of the mantle and heat transfer) or slower. In endothermic change, a possible scenario could be the disintegration of a planet into several independently convecting layers, he noted.
The fact that the Earth’s continents are in constant motion, “floating” on the surface of the mantle, is what gives volcanism and a breathable atmosphere. If continental drift were to stop, it could have disastrous consequences for the climate.
Reference:
Haiyang Niu, Artem R. Oganov, Xing-Qiu Chen & Dianzhong Li. Prediction of novel stable compounds in the Mg-Si-O system under exoplanet pressures. DOI:10.1038/srep18347
This Diagram depicts some of the differences between Asymmetrical, Symmetrical, and OVERTURNED folds. Credit: W. H. Freeman and Company
A wave-like geologic structure that forms when rocks deform by bending instead of breaking under compressional stress. Anticlines are arch-shaped folds in which rock layers are upwardly convex. The oldest rock layers form the core of the fold, and outward from the core progressively younger rocks occur.
A syncline is the opposite type of fold, having downwardly convex layers with young rocks in the core. Folds typically occur in anticline-syncline pairs. The hinge is the point of maximum curvature in a fold. The limbs occur on either side of the fold hinge. The imaginary surface bisecting the limbs of the fold is called the axial surface. The axial surface is called the axial plane in cases where the fold is symmetrical and the lines containing the points of maximum curvature of the folded layers, or hinge lines, are coplanar.
Concentric folding preserves the thickness of each bed as measured perpendicular to original bedding. Similar folds have the same wave shape, but bed thickness changes throughout each layer, with thicker hinges and thinner limbs.
Folds form under varied conditions of stress, hydrostatic pressure, pore pressure, and temperature gradient, as evidenced by their presence in soft sediments, the full spectrum of metamorphic rocks, and even as primary flow structures in some igneous rocks. A set of folds distributed on a regional scale constitutes a fold belt, a common feature of orogenic zones. Folds are commonly formed by shortening of existing layers, but may also be formed as a result of displacement on a non-planar fault (fault bend fold), at the tip of a propagating fault (fault propagation fold), by differential compaction or due to the effects of a high-level igneous intrusion e.g. above a laccolith.
Fold Classification
Folds are classified on the basis of several geometric factors:
Tightness of folding
The tighness of folds can be described as open (limbs dip gently), tight (limbs dip steeply) or isoclinal (limbs are parallel).
Orientation of axial plane
The orientation of the axial plane relative to the horizontal together with the orientation of fold limbs allow subdivision into upright (axial plane vertical, limbs symmetric), overturned (axial plane moderately inclined, one limb overturned), or recumbent (axial plane near horizontal, one limb inverted).
Thickness of folded beds
Thickly-bedded, brittle units tend to form concentric folds with the bed thickness preserved normal to bedding surfaces. Thinly-bedded, clay-rich units have a tendency to develop a foliation parallel to the axial plane and form similar folds with the vertical distance between top and bottom of the unit preserved through the deformation.
Types of Folds
Anticline: linear, strata normally dip away from axial center, oldest strata in center.
Syncline: linear, strata normally dip toward axial center, youngest strata in center.
Antiform: linear, strata dip away from axial center, age unknown, or inverted.
Synform: linear, strata dip toward axial centre, age unknown, or inverted.
Dome: nonlinear, strata dip away from center in all directions, oldest strata in center.
Basin: nonlinear, strata dip toward center in all directions, youngest strata in center.
Monocline: linear, strata dip in one direction between horizontal layers on each side.
Chevron: angular fold with straight limbs and small hinges
Recumbent: linear, fold axial plane oriented at low angle resulting in overturned strata in one limb of the fold.
Slump: typically monoclinal, result of differential compaction or dissolution during sedimentation and lithification.
Ptygmatic: Folds are chaotic, random and disconnected. Typical of sedimentary slump folding, migmatites and decollement detachment zones.
Parasitic: short wavelength folds formed within a larger wavelength fold structure – normally associated with differences in bed thickness
Disharmonic: Folds in adjacent layers with different wavelengths and shapes
In structural geology, an anticline is a type of fold that is an arch-like shape and has its oldest beds at its core. A typical anticline is convex up in which the hinge or crest is the location where the curvature is greatest, and the limbs are the sides of the fold that dip away from the hinge. Anticlines can be recognized and differentiated from antiforms by a sequence of rock layers that become progressively older toward the center of the fold. Therefore, if age relationships between various rock strata are unknown, the term antiform should be used.
The progressing age of the rock strata towards the core and uplifted center, are the trademark indications for evidence of Anticlines on a geologic map. These formations occur because Anticlinal ridges typically develop above thrust faults during crustal deformations. The uplifted core of the fold causes compression of strata that preferentially erodes to a deeper stratigraphic level relative to the topographically lower flanks. Motion along the fault including both shortening and extension of tectonic plates, usually also deforms strata near the fault. This can result in an asymmetrical or overturned fold.
An Antiform can be used to describe any fold that is convex up. It is the relative ages of the rock strata that separate anticlines from antiforms. The hinge of an anticline refers to the location where the curvature is greatest, also called the crest. The hinge is also the highest point on a stratum along the top of the fold. The culmination also refers to the highest point along any geologic structure. The limbs are the sides of the fold that display less curvature.
The inflection point is the area on the limbs where the curvature changes direction. The axial surface is an imaginary plane connecting the hinge of each layer of rock stratum through the cross sectional anticline. If the axial surface is vertical and the angles on each side of the fold are equivalent, then the anticline is symmetrical. If the axial plane is tilted or offset then the anticline is asymmetrical. An anticline that is cylindrical has a well-defined axial surface, whereas non-cylindrical anticlines are too complex to have a single axial plane.
Formation processes
Anticlines are usually developed above thrust faults, so any small compression and motion within the inner crust can have large effects on the upper rock stratum. Stresses developed during mountain building or during other tectonic processes can similarly warp or bend bedding and foliation (or other planar features). The more the underlying fault is tectonically uplifted, the more the strata will be deformed and must adapt to new shapes. The shape formed will also be very dependent on the properties and cohesion of the different types of rock within each layer.
During the formation of flexural-slip folds, the different rock layers form parallel-slip folds to accommodate for buckling. A good way to visualize how the multiple layers are manipulated, is to bend a deck of cards and to imagine each card as a layer of rock stratum. The amount of slip on each side of the anticline increases from the hinge to the inflection point.
Passive-flow folds form when the rock is so soft that it behaves like weak plastic and slowly flows. In this process different parts of the rock body move at different rates causing shear stress to gradually shift from layer to layer.iii There is no mechanical contrast between layers in this type of fold. Passive-flow folds are extremely dependent on the rock stratums makeup and can typically occur in areas with high temperatures
Syncline
In structural geology, a syncline is a fold with younger layers closer to the center of the structure. A synclinorium (plural synclinoriums or synclinoria) is a large syncline with superimposed smaller folds. Synclines are typically a downward fold, termed a synformal syncline (i.e. a trough); but synclines that point upwards, or perched, can be found when strata have been overturned and folded (an antiformal syncline).
Dome
A dome is a feature in structural geology consisting of symmetrical anticlines that intersect each other at their respective apices. Intact, domes are distinct, rounded, spherical-to-ellipsoidal-shaped protrusions on the Earth’s surface. However, a transect parallel to Earth’s surface of a dome features concentric rings of strata. Consequently, if the top of a dome has been eroded flat, the resulting structure in plan view appears as a bullseye, with the youngest rock layers at the outside, and each ring growing progressively older moving inwards. These strata would have been horizontal at the time of deposition, then later deformed by the uplift associated with dome formation.
Basin
A structural basin is a large-scale structural formation of rock strata formed by tectonic warping of previously flat lying strata. Structural basins are geological depressions, and are the inverse of domes. Some elongated structural basins are also known as synclines. Structural basins may also be sedimentary basins, which are aggregations of sediment that filled up a depression or accumulated in an area; however, many structural basins were formed by tectonic events long after the sedimentary layers were deposited.
Basins appear on a geologic map as roughly circular or elliptical, with concentric layers. Because the strata dip toward the center, the exposed strata in a basin are progressively younger from outside-in, with the youngest rocks in the center. Basins are often large in areal extent, often hundreds of kilometers across.
Structural basins are often important sources of coal, petroleum, and groundwater.
Monocline
A monocline (or, rarely, a monoform) is a step-like fold in rock strata consisting of a zone of steeper dip within an otherwise horizontal or gently-dipping sequence.
Chevron
Chevron folds are a structural feature characterized by repeated well behaved folded beds with straight limbs and sharp hinges. Well developed, these folds develop repeated set of v-shaped beds. They develop in response to regional or local compressive stress. Inter-limb angles are generally 60 degrees or less. Chevron folding preferentially occurs when the bedding regularly alternates between contrasting competences. Turbidites, characterized by alternating high-competence sandstones and low-competence shales, provide the typical geological setting for chevron folds to occurs.
Perpetuation of the fold structure is not geometrically limited. Given a proper stratigraphy, chevrons can persist almost indefinitely.
Chevron folds with flat-lying axial planes, Millook Haven, North Cornwall, UK Credit: Smalljim
Recumbent
An asymmetrical fold is one in which the axial plane is inclined. An overturned fold, or overfold, has the axial plane inclined to such an extent that the strata on one limb are overturned. A recumbent fold has an essentially horizontal axial plane. When the two limbs of a fold are essentially parallel to each other and thus approximately parallel to the axial plane
Recumbent fold at Godrevy in Cornwall in England. The rocks are of Devonian age and they were folded during the Variscan orogeny. Credit: mwcarruthers
Slump
Typically monoclinal, result of differential compaction or dissolution during sedimentation and lithification.
Slump Fold An almost isoclinal fold (coin, seaweed and shells for scale) formed as wet layers of mud settled and solidified in Triassic times. Credit: Anne Burgess
Ptygmatic
Folds are chaotic, random and disconnected. Typical of sedimentary slump folding, migmatites and decollement detachment zones.
Ptygmatic folding, Broken Hill Credit: Monash University
Parasitic
Short wavelength folds formed within a larger wavelength fold structure – normally associated with differences in bed thickness
Disharmonic
Folds in adjacent layers with different wavelengths and shapes
Flexural slip
Flexural slip allows folding by creating layer-parallel slip
Folding mechanisms
between the layers of the folded strata, which, altogether, result in deformation. A good analogy is bending a phone book, where volume preservation is accommodated by slip between the pages of the book.
The fold formed by the compression of competent rock beds is called “flexure fold”.
Buckling
Typically, folding is thought to occur by simple buckling of a planar surface and its confining volume. The volume change is accommodated by layer parallel shortening the volume, which grows in thickness. Folding under this mechanism is typically of the similar fold style, as thinned limbs are shortened horizontally and thickened hinges do so vertically.
Mass displacement
If the folding deformation cannot be accommodated by flexural slip or volume-change shortening (buckling), the rocks are generally removed from the path of the stress. This is achieved by pressure dissolution, a form of metamorphic process, in which rocks shorten by dissolving constituents in areas of high strain and redepositing them in areas of lower strain. Folds created in this way include examples in migmatites, and areas with a strong axial planar cleavage.
A lidar image of the Stillaguamish River with newly calculated ages for the landslides. Radiocarbon dating of woody debris shows that the huge Rowan Landslide, on the left, happened only about 500 years ago. Credit: Alison Duvall/University of Washington
The large, fast-moving mudslide that buried much of Oso, Washington in March 2014 was the deadliest landslide in U.S. history. Since then, it’s been revealed that this area has experienced major slides before, but it’s not known how long ago they occurred.
University of Washington geologists analyzed woody debris buried in earlier slides and used radiocarbon dating to map the history of activity at the site. The findings, published online in the journal Geology, show that a massive nearby slide happened around 500 years ago, and not thousands of years ago as some had believed.
“The soil in this area is all glacial material, so one hypothesis is the material could have fallen apart in a series of large landslides soon after the ice retreated, thousands of years ago,” said corresponding author Sean LaHusen, a UW doctoral student in Earth and space sciences. “We found that that’s not the case — in fact, landslides have been continuing in recent history.”
The study establishes a new method to date all the previous landslides at a particular location. The method shows that the slopes in the area around Oso have collapsed on average once every 500 years, and at a higher rate of about once every 140 years over the past 2,000 years.
“This was well known as an area of hillslope instability, but the question was: ‘Were the larger slides thousands of years old or hundreds of years old?’ Now we can say that many of them are hundreds of years old,” said co-author Alison Duvall, a UW assistant professor of Earth and space sciences.
LaHusen had not yet begun his graduate studies when he asked about studying the history of geologic activity at the Oso site. In late summer of 2014, the researchers began their work wading along riverbanks to look for preserved branches or trees that could be used to date previous landslides.
“When you have a large, catastrophic landslide, it can often uproot living trees which kills them and also encapsulates them in the landslide mass,” Duvall said. “If you can find them in the landslide mass, you can assume that they were killed by the landslide, and thus you can date when the landslide occurred.”
The team managed to unearth samples of wood buried in the Rowan landslide, just downstream of the Oso site, and the Headache Creek landslide, just upriver of the 2014 slide. Results from several debris samples show that the Rowan landslide, approximately five times the size of the Oso slide, took place just 300 to 694 years ago. The Headache Creek landslide is within a couple hundred years of 6,000 years old.
Previous UW research had shown a history of geologic activity at the Oso site, including previous major landslides and a recent small slide at the same slope that collapsed in 2014. But while the position of past slides and degree of surface erosion can show the order that the older slides happened, it has not been possible to give a date for the past events.
The new study uses the radiocarbon dates for two slides to establish a roughness curve to date other events along a 3.7-mile (6-kilometer) stretch of the north fork of the Stillaguamish River. A roughness curve uses the amount of surface erosion to establish each slide’s age. The two dates put firm limits on the curve, so that other nearby slides can be dated from their roughness characteristics without having to find material buried inside each mass of soil.
“This is the first time this calibrated surface dating method has been used for landslide chronologies, and it seems to work really well,” LaHusen said. “It can provide some information about how often these events recur, which is the first step toward a regional risk analysis.”
Applying the new method for other locations would require gathering samples for each area, they cautioned, because each site has its own soil composition and erosion characteristics.
It’s not known whether the findings for the Oso site’s history would apply to other parts of the Stillaguamish River, Duvall said, or to other places in Washington state. The researchers are still studying debris from other locations. But the results do have implications for the immediate area.
“It suggests that the Oso landslide was not so much of an anomaly,” Duvall said.
She and LaHusen are also working with the UW’s M-9 Project, which is studying hazards from magnitude-9 earthquakes along the Cascadia subduction zone. They would like to learn whether landslides across Washington state coincided with past earthquakes, and use simulations of future shaking to predict which places in the state are most vulnerable to earthquake-triggered landslides.
Reference:
Sean R. LaHusen, Alison R. Duvall, Adam M. Booth, David R. Montgomery. Surface roughness dating of long-runout landslides near Oso, Washington (USA), reveals persistent postglacial hillslope instability. Geology, 2015; G37267.1 DOI: 10.1130/G37267.1
Note: The above post is reprinted from materials provided by University of Washington. The original item was written by Hannah Hickey.
The discovery of exceptionally well-preserved, tiny fossil seeds dating back to the Early Cretaceous corroborates that flowering plants were small opportunistic colonizers at that time, according to a new Yale-led study.
Angiosperms, or flowering plants, diversified during the Early Cretaceous, about 100 to 130 million years ago. Based on evidence from living and fossil plants, the earliest angiosperms are usually thought to have had small stature. New data from the fossil record presented here strongly support this notion, but also indicates key differences from modern flowering plants.
Writing in the journal Nature, a team of researchers reports the discovery of small seed embryos — less than 0.3 millimeters in size — and their surrounding nutrient storage tissues in well-preserved seeds found in eastern North America and Portugal.
The study was led by Else Marie Friis, a professor emerita at the Swedish Museum of Natural History and a Bass Distinguished Visiting Professor at the Yale School of Forestry & Environmental Studies (F&ES). Other authors include Peter Crane, Professor of Botany and Dean of F&ES, Kaj Raunsgaard Pedersen, an Associate Professor Emeritus at the University of Aarhus in Denmark and a Visiting Fellow at F&ES, and two colleagues from the Swiss Light Source, Paul Scherrer Institute, Villigen, Marco Stampanoni and Federica Marone.
Using a visualization technique known as synchrotron radiation X-ray tomographic microscopy — which allows researchers to examine the internal features of delicate fossils in a non-destructive way — the researchers analyzed more than 250 mature seeds encompassing roughly 75 angiosperm taxa, some of which had the seed embryo fully preserved. Their findings show that the embryos are tiny (one-fourth to one-third of a millimeter), with excellent preservation of cell structure.
The minute size of the fossil embryos is consistent with the interpretation that seed dormancy allowed the earliest flowering plants to survive through harsh environmental conditions and colonize disturbance-prone habitats.
The discoveries support the concept that small embryos and seed dormancy are basic for flowering plants as a whole. However, the embryo to seed ratio in the fossil seeds is much smaller than in seeds of most living angiosperms and an order of magnitude smaller than has been hypothesized for the ancestral angiosperm embryo based on studies of living plants.
Seed dormancy would have ensured that the seeds of early angiosperms could survive until conditions for germination and seedling establishment were favorable, Friis said. However, the tiny embryo size and modest nutrient reserves would also have been a constraint on the rapidity with which these early angiosperms could have germinated in response to short-lived moisture availability.
“This is important because it suggests that while early angiosperms may have had many characteristics of modern weedy early colonizers, they would have been unable to match the very rapid germination of the many different kinds of angiosperm herbs that evolved later and that ultimately proved even more effective in exploiting ephemeral ecological opportunities,” Friis said.
Added Crane: “This is the first time that we have had direct fossil evidence of the embryos of early angiosperms and how they compare with those of living plants. These observations have given us critical insights into the early part of the life cycle of early angiosperms, which is important for understanding the ecology of flowering plants during their emergence and dramatic radiation through the Early Cretaceous.”
Video
The discovery of exceptionally well-preserved, tiny fossil seeds dating back to the Early Cretaceous corroborates that flowering plants were small opportunistic colonizers at that time, according to a new Yale-led study.
Reference:
Else Marie Friis, Peter R. Crane, Kaj Raunsgaard Pedersen, Marco Stampanoni, Federica Marone. Exceptional preservation of tiny embryos documents seed dormancy in early angiosperms. Nature, 2015; DOI: 10.1038/nature16441
The Lesser Antilles island chain. Credit: Jacques Descloitres, MODIS Rapid Response Team, NASA/GSFC.
Reconstructing the magnitude of past volcanic eruptions is important in informing predictions about future eruptions and hazards. This is difficult to accomplish from records on land—old eruptions are often eroded away, buried beneath later eruptions, or obscured by vegetation and soil. Most volcanoes are close to the oceans, so much of the erupted material falls into seawater and accumulates on the seafloor.
More complete records of volcanic activity can be found in marine sediments. In 2012, Integrated Ocean Drilling Program (IODP) Expedition 340 recovered a 140 meter long sediment core between Montserrat and Guadeloupe in the northeastern Caribbean Sea. This is close to several volcanically active islands in the Lesser Antilles. Most notably, this core contained an 18-cm-thick ash layer that was deposited 2.4 million years ago, and came from Guadeloupe, ~75 km to the east.
Volcanological models indicate this layer derived from a far larger eruption than any subsequently recorded event in the region. While a similarly large eruption would have a major impact on human populations in the region if it occurred today, it is important to note that such events are very rare in the Lesser Antilles, and there is no indication that another large eruption is imminent.
Reference:
Martin R. Palmer et al. Discovery of a large 2.4 Ma Plinian eruption of Basse-Terre, Guadeloupe, from the marine sediment record, Geology (2015). DOI: 10.1130/G37193.1
Illinois State Geological Society scientists Timothy Larson, Scott Elrick and Andrew Phillips investigated a long, straight short cliff and found it was most likely carved out by melted glacier water. Credit: L. Brian Stauffer
Geologists investigating an unusual landform in the Wabash River Valley in southern Illinois expected to find seismic origins, but instead found the aftermath of rushing floodwaters from melting Midwestern glaciers after the last ice age. The finding could give clues to how floodwaters may behave as glacier melt increases today in places like Greenland and Iceland.
Illinois State Geological Survey researchers Timothy Larson, Andrew Phillips and Scott Elrick published their findings in the journal Seismological Research Letters. ISGS is part of the Prairie Research Institute at the University of Illinois.
Along the western edge of the Wabash River Valley lies a scarp, or short cliff, about 10 to 20 feet high and running in a nearly straight line for about 6 miles. The Meadow Bank scarp runs nearly perfectly parallel to a fault zone 1 mile to the west. Geologists suspected the Meadow Bank was formed by some past seismic activity along the fault, perhaps an earthquake that caused the scarp to shear upwards.
In an effort to assess earthquake hazard, the ISGS researchers set out to probe the relationship between the fault and the scarp and instead found a deeper mystery: There was no relationship at all.
“This was very surprising to us,” said Larson. “You look at it, you see how parallel it is to the fault. We know that historically there were earthquakes in the area. It just begs to be related. But it turns out it’s not possible.”
The researchers talked to miners and studied records from the White County Coal Company, which mined coal throughout the area around and under the Meadow Bank. They confirmed that there was no fault or seismic activity hidden under the bank. Thus, the researchers set out to answer the new question: How was such a long, straight scarp formed, if not tectonically?
The researchers bored into the ground to take samples along and around the Meadow Bank. They found evidence that the scarp was formed by erosion, and concluded that the type of erosion that could produce such a striking, straight feature had to come from a quick, strong force – such as a flood surge from a melting glacier.
“Looking at the layers in the sediment, you can trace back to big floods at the end of the last glacial time,” said Larson. “As the glaciers melt, the water may build up in lakes along the glacier edge until it gets so deep that it overflows and rushes out in a big discharge. We see this happening today in places like Iceland. So at some point, a glacier flushed a huge slug of water, full of sediment debris, through the Wabash River Valley. It may have happened several times. It washed everything out and formed this straight shot down through the valley.”
The researchers hope that further study of the Meadow Bank could provide clues about the glacial floods – where they originated, what kind of debris they carried and how their course was set. This could provide insight to geologists studying glaciers melting today, such as those in Greenland, Iceland, Canada and New Zealand, as they try to project how the meltwater could behave and the possible effects on the surrounding landscape.
A lifelike model of T-Rex could be yours in time for Christmas, thanks to dinosaur experts from the University of Manchester.
The scary model is one of six remarkable skeletons developed by a team led by Dr Bill Sellers as part of research into understanding how dinosaurs move .
With the help of Manchester colleagues Dr Charlotte Brassey and Prof Phil Manning, the work was originally seen as a computer-based simulation as part of funder NERC’s 50th Anniversary Summer of Science.
But Dr Sellers converted the computer designs, based on work by artist and Southampton University PhD student Stuart Pond, to make them compatible with 3D printers.
Now anyone with access to a 3D printer—often found at schools, colleges and hack spaces—can download them for free from his website, to create a perfect gift for dinosaur fans.
The research team developed an open source computer programme so they could simulate the animals’ movement using ‘Kinect’, a motion sensing device popular with gamers.
Fans with some technical knowledge and a Kinect sensor can download the software to recreate the simulations see how good they are at making lifelike dinosaur movements on their home computers.
And if T-Rex is feeling lonely, there are five others who can cheer him up: Triceratops, Brachiosaurus, Edmontonia (an ankylosaur), Edmontosaurus (a duck-billed hadrosaur), and Gorgosaurus (a meat-eating theropod).
Dr Sellers said: “These models are amazingly accurate and a lot of fun; children will love them as will anyone who has an interest in dinosaurs. Just imagine their surprise when a lifelike model appears beneath the Christmas tree! If you haven’t got the time to 3D print the whole skeleton – you can just print out the skulls. They’re still very striking.”
He added: “But there is a serious side to this work too: We are interested in understanding how dinosaurs actually moved – and these computer simulations upon which the designs are based are very helpful in achieving that. The software doesn’t just animate the dinosaurs, it uses the Kinect PC interface to measure your body’s movements and then drives the muscles in the dinosaur simulations. These muscles generate forces and the software solves Newton’s Law’s of Motion to calculate how the dinosaur could actually have tried to copy your movement. So it’s about learning some physics, as well.”
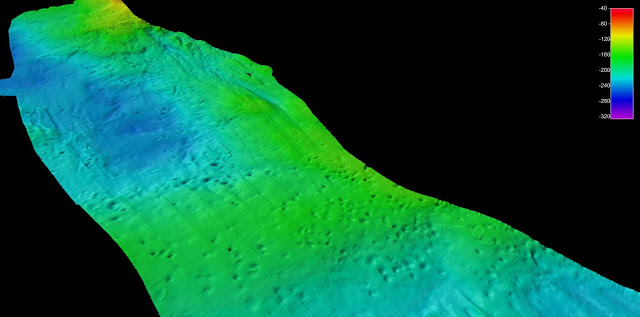
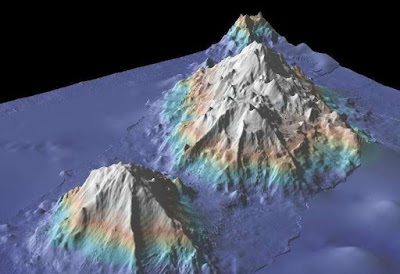
A high resolution 3D bathymetry of the Von Damm vent field. Credit: NOCS
Researchers from the University of Southampton have identified hydrothermal vents in the deep sea of the Caribbean which are unlike any found before.
Collaborating with colleagues at the National Oceanography Centre, the team has revealed active vents in the Von Damm Vent Field (VDVF) that are unusual in their structure, formed largely of talc, rather than the more usual sulphide minerals.
Lead researcher Matthew Hodgkinson and colleagues analysed samples from the VDVF — a vent field south of the Cayman Islands discovered by scientists and crew on board the RRS James Cook in 2010. Results of the analysis are now published in the journal Nature Communications.
Matthew comments: “This vent site is home to a community of fauna similar to those found at the Mid-Atlantic Ridge in the Atlantic Ocean, but the minerals and chemistry at the Von Damm site are very different to any other known vents.”
Hydrothermal vents form in areas where Earth’s tectonic plates are spreading. At these sites, circulating seawater is heated by magma below the seafloor and becomes more acidic — leaching metals from the surrounding rocks and redepositing them as the hot water spews out of vents or ‘chimneys’ at the seabed and hits the cold seawater.
The scientists have also found the VDVF system has a very energetic heat flux (the amount of energy it emits into the surrounding ocean) of around 500 megawatts. This is much more than would be expected since the VDVF, on the slopes of an underwater mountain and away from a large magma supply, is on the edge of a spreading area and not in between two separating tectonic plates. The unusual positioning of this new vent field suggests that other similar ones elsewhere in the world may have been overlooked.
Matthew Hodgkinson adds: “If more of these unusual sites exist they could be important contributors in the exchange of chemicals and heat between Earth’s interior and the oceans, and may be missing from current global assessments of hydrothermal impact on the oceans.”
Reference:
Matthew R. S. Hodgkinson, Alexander P. Webber, Stephen Roberts, Rachel A. Mills, Douglas P. Connelly, Bramley J. Murton. Talc-dominated seafloor deposits reveal a new class of hydrothermal system. Nature Communications, 2015; 6: 10150 DOI: 10.1038/ncomms10150
Vent chimneys at the Von Damm Vent site. Credit: The National Oceanography Cent
The first discovery of a new type of hydrothermal vent system in a decade helps explain the long observed disconnect between the theoretical rate at which the Earth’s crust is cooling at seafloor spreading ridge flanks, and actual observations. It could also help scientists interpret the evidence for past global climates more accurately.
This discovery has been made by scientists at the National Oceanography Centre (NOC) and the University of Southampton using a combination of robot-subs and remotely operated vehicles operated by the NOC.
Dr Bramley Murton, who co-supervised this research, published today in Nature Communications, said “This will really improve our understanding of how the Earth’s interior cools. Theory has long predicted that there must be more cooling in certain locations on the Earth’s crust than we could account for using the known mechanisms….and this new class of hydrothermal vent system may account for that difference.”
What makes these hydrothermal vent systems different is that the source of heat driving them comes from hot rock pushed towards the seabed by low angle faults, called tectonic spreading centres, rather than volcanic heat from magma chambers. Dr Murton has been involved in research that discovered tectonic seafloor spreading centres at a number of sites across the ocean floor.
“We expect this new type of vent system can be found in tectonic seafloor spreading sites across the globe. However, since they are almost invisible to the traditional ways of searching for hydrothermal vents, and the process driving them was not understood, they remained unaccounted for in scientific models of how heat and chemistry is transferred from inside the Earth’s crust. Our discovery was only made possible using the world-leading marine technology at the NOC” continued Dr Murton, who supervised this research by Matthew Hodgkinson, a PhD student from the University of Southampton.
This new class of venting was discovered at the Von Damm Vent Field in the Caribbean during an expedition on board the NOC maintained Royal Research Ship, James Cook. The team used sonar on the autonomous-sub, Autosub6000, to map the vent field before sending down a remotely operated vehicle (ROV) to collect samples of hydrothermal fluids and minerals. Multi-beam sonar on this ROV was also used to produce a map with a resolution so high it could pick out individual pebbles on the sea floor.
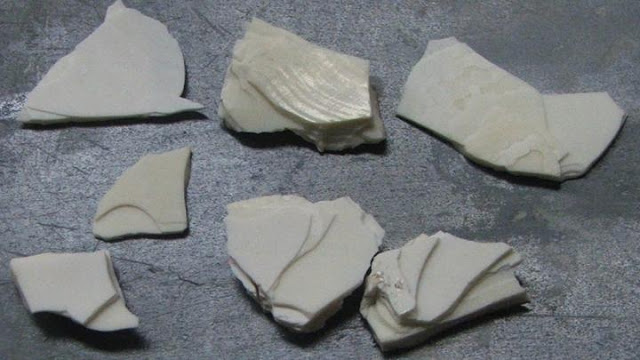
The investigation revealed that minerals and chemistry at the Von Damm Vent site are very different to those from any other known vents. As a result of the unusual chemistry of the vent fluids, the fifty metre tall mounds and chimneys are formed largely of a magnesium-rich mineral, talc, rather than the more usual iron and copper sulphides. In addition, the vents release over a one thousand kilograms per second of fluid at 215°C, which carries hundreds of megawatts of heat out of the crust. Accounting for such a major flux of heat and chemicals from this new class of vent system has important implications for the balance of magnesium and calcium in seawater, which plays a significant role in past climatic conditions. This research will mean that ocean models of magnesium and calcium budgets will need to be updated and could lead to more accurate insights into Earth’s past climate.
Reference:
Matthew R. S. Hodgkinson, Alexander P. Webber, Stephen Roberts, Rachel A. Mills, Douglas P. Connelly & Bramley J. Murton. Talc-dominated seafloor deposits reveal a new class of hydrothermal system. DOI:10.1038/ncomms10150
The Chinese lunar rover, Yutu, photographed by its lander Chang’e-3, after the lander touched down in Mare Imbrium, a giant impact basin that had been filled by successive lava flows. Credit: CNAS/CLEP
In 2013, Chang’e-3, an unmanned lunar mission, touched down on the northern part of the Imbrium basin, one of the most prominent of the lava-filled impact basins visible from Earth.
It was a beautiful landing site, said Bradley L. Jolliff, PhD, the Scott Rudolph Professor of Earth and Planetary Sciences at Washington University in St. Louis, who is a participant in an educational collaboration that helped analyze Chang’e-3 mission data. The lander touched down on a smooth flood basalt plain next to a relatively fresh impact crater (now officially named the Zi Wei crater) that had conveniently excavated bedrock from below the regolith for the Yutu rover to study.
Since the Apollo program ended, American lunar exploration has been conducted mainly from orbit. But orbital sensors primarily detect the regolith (the ground-up surface layer of fragmented rock) that blankets the Moon, and the regolith is typically mixed and difficult to interpret.
Because Chang’e-3 landed on a comparatively young lava flow, the regolith layer was thin and not mixed with debris from elsewhere. Thus it closely resembled the composition of the underlying volcanic bedrock. This characteristic made the landing site an ideal location to compare in situ analysis with compositional information detected by orbiting satellites.
“We now have ‘ground truth’ for our remote sensing, a well-characterized sample in a key location,” Jolliff said. “We see the same signal from orbit in other places, so we now know that those other places probably have similar basalts.”
The basalts at the Chang’e-3 landing site also turned out to be unlike any returned by the Apollo and Luna sample return missions.
“The diversity tells us that the Moon’s upper mantle is much less uniform in composition than Earth’s,” Jolliff said. “And correlating chemistry with age, we can see how the Moon’s volcanism changed over time.”
Two partnerships were involved in the collection and analysis of this data, published in the journal Nature Communications Dec. 22. Scientists from a number of Chinese institutions involved with the Chang’e-3 mission formed one partnership; the other was a long-standing educational partnership between Shandong University in Weihai, China, and Washington University in St. Louis.
A mineralogical mystery
The Moon, thought to have been created by the collision of a Mars-sized body with the Earth, began as a molten or partially molten body that separated as it cooled into a crust, mantle and core. But the buildup of heat from the decay of radioactive elements in the interior then remelted parts of the mantle, which began to erupt onto the surface some 500 million years after the Moon’s formation, pooling in impact craters and basins to form the maria, most of which are on the side of the Moon facing the Earth.
The American Apollo (1969-1972) and Russian Luna (1970-1976) missions sampled basalts from the period of peak volcanism that occurred between 3 and 4 billion years ago. But the Imbrium basin, where Chang’e-3 landed, contains some of the younger flows — 3 billion years old or slightly less.
The basalts returned by the Apollo and Luna missions had either a high titanium content or low to very low titanium; intermediate values were missing. But measurements made by an alpha-particle X-ray spectrometer and a near-infrared hyperspectral imager aboard the Yutu rover indicated that the basalts at the Chang’e-3 landing site are intermediate in titanium, as well as rich in iron, said Zongcheng Ling, PhD, associate professor in the School of Space Science and Physics at Shandong University in Weihai, and first author of the paper.
Titanium is especially useful in mapping and understanding volcanism on the Moon because it varies so much in concentration, from less than 1 weight percent TiO2 to over15 percent. This variation reflects significant differences in the mantle source regions that derive from the time when the early magma ocean first solidified.
Minerals crystallize from basaltic magma in a certain order, explained Alian Wang, PhD, research professor in earth and planetary sciences in Arts & Sciences at Washington University. Typically, the first to crystallize are two magnesium- and iron-rich minerals (olivine and pyroxene) that are both a little denser than the magma, and sink down through it, then a mineral (plagioclase feldspar), that is less dense and floats to the surface. This process of separation by crystallization led to the formation of the Moon’s mantle and crust as the magma ocean cooled.
The titanium ended up in a mineral called ilmenite (FeTiO3) that typically doesn’t crystallize until a very late stage, when perhaps only 5 percent of the original melt remains. When it finally crystallized, the ilmenite-rich material, which is also dense, sank into the mantle, forming areas of Ti enrichment.
“The variable titanium distribution on the lunar surface suggests that the Moon’s interior was not homogenized,” Jolliff said. “We’re still trying to figure out exactly how this happened. Possibly there were big impacts during the magma ocean stage that disrupted the mantle’s formation.”
Another clue to the Moon’s past
The story has another twist that also underscores the importance of checking orbital data against ground truth. The remote sensing data for Chang’e-3’s landing site showed that it was rich in olivine as well as titanium.
That doesn’t make sense, Wang said, because olivine usually crystallizes early and the titanium-rich ilmenite crystallizes late. Finding a rock that is rich in both is a bit strange.
But Yutu solved this mystery as well. In olivine, silicon is paired with either magnesium or iron but the ratio of those two elements is quite variable in different forms of the mineral. The early-forming olivine would be magnesium rich, while the olivine detected by Yutu has a composition that ranges from intermediate in iron to iron-rich.
“That makes more sense,” Jolliff said, “because iron-enriched olivine and ilmenite are more likely to occur together.
“You still have to explain how you get to an olivine-rich and ilmenite-rich rock. One way to do that would be to mix, or hybridize, two different sources,” he said.
The scientists infer that late in the magma-ocean crystallization, iron-rich pyroxene and ilmenite, which formed late and at the crust-mantle boundary, might have begun to sink. and early-formed magnesium-rich olivine might have begun to rise. As this occurred, the two minerals might have mixed and hybridized.
“Given these data, that is our interpretation,” Jolliff said.
In any case, it is clear that these newly characterized basalts reveal a more diverse Moon than the one that emerged from studies following the Apollo and Luna missions. Remote sensing suggests that there are even younger and even more diverse basalts on the Moon, waiting for future robotic or human explorers to investigate, Jolliff said.
The diversity of mammals on Earth exploded straight after the dinosaur extinction event, according to UCL researchers. New analysis of the fossil record shows that placental mammals, the group that today includes nearly 5000 species including humans, became more varied in anatomy during the Paleocene epoch – the 10 million years immediately following the event.
Senior author, Dr Anjali Goswami (UCL Genetics, Evolution & Environment), said: “When dinosaurs went extinct, a lot of competitors and predators of mammals disappeared, meaning that a great deal of the pressure limiting what mammals could do ecologically was removed. They clearly took advantage of that opportunity, as we can see by their rapid increases in body size and ecological diversity. Mammals evolved a greater variety of forms in the first few million years after the dinosaurs went extinct than in the previous 160 million years of mammal evolution under the rule of dinosaurs.”
The Natural Environment Research Council-funded research, published today in the Biological Journal of the Linnean Society, studied the early evolution of placental mammals, the group including elephants, sloths, cats, dolphins and humans. The scientists gained a deeper understanding of how the diversity of the mammals that roamed the Earth before and after the dinosaur extinction changed as a result of that event.
Placental mammal fossils from this period have been previously overlooked as they were hard to place in the mammal tree of life because they lack many features that help to classify the living groups of placental mammals. Through recent work by the same team at UCL, this issue was resolved by creating a new tree of life for placental mammals, including these early forms, which was described in a study published in Biological Reviews yesterday.
First author of both papers, Dr Thomas Halliday (UCL Earth Sciences and Genetics, Evolution & Environment), said: “The mass extinction that wiped out the dinosaurs 66 million years ago is traditionally acknowledged as the start of the ‘Age of Mammals’ because several types of mammal appear for the first time immediately afterwards.
“Many recent studies suggest that little changed in mammal evolution during the Paleocene but these analyses don’t include fossils from that time. When we look at the mammals that were present, we find a burst of evolution into new forms, followed by specialisation that finally resulted in the groups of mammals we see today. The earliest placental mammal fossils appear only a few hundred thousand years after the mass extinction, suggesting the event played a key role in diversification of the mammal group to which we belong.”
The team studied the bones and teeth of 904 placental fossils to measure the anatomical differences between species. This information was used to build an updated tree of life containing 177 species within Eutheria (the group of mammals including all species more closely related to us than to kangaroos) including 94 from the Paleocene – making it the tree with the largest representation from Paleocene mammals to date. The new tree was analysed in time sections from 140 million years ago to present day, revealing the change in the variety of species.
Three different methods were used by the team to investigate the range and variation of the mammals present and all showed an explosion in mammal diversity after the dinosaur extinction. This is consistent with theories that mammals flourished when dinosaurs were no longer hunting them or competing with them for resources.
Dr Anjali Goswami (UCL Genetics, Evolution & Environment), added: “Extinctions are obviously terrible for the groups that go extinct, non-avian dinosaurs in this case, but they can create great opportunities for the species that survive, such as placental mammals, and the descendants of dinosaurs: birds.”
Professor Paul Upchurch (UCL Earth Sciences), co-author of the Biological Reviews study, added: “Several previous methodological studies have shown that it is important to include as many species in an evolutionary tree as possible: this generally improves the accuracy of the tree. By producing such a large data set, we hope that our evolutionary tree for Paleocene mammals is more robust and reliable than any of the previous ones. Moreover, such large trees are very useful for future studies of large-scale evolutionary patterns, such as how early placental mammals dispersed across the continents via land bridges that no longer exist today.”
The team are now investigating rates of evolution in these mammals, as well as looking at body size more specifically. Further work will involve building data from DNA into these analyses, to extend these studies to modern mammals.
Reference:
Thomas Halliday, Paul Upchurch and Anjali Goswami, ‘Resolving the relationships of Paleocene placental mammals’ will be published in Biological Reviews on 21st December 2015. DOI: 10.1111/brv.12242
Tomogram of the lowermost mantle (on top of core-mantle boundary, such as in our paper) centred on the equatorial region north of Australia. Green dots are stations and red dots are earthquakes near the Earth’s surface, the Earth’s mantle is transparent, and the ray paths through the interior are shown by solid lines. This image was made by our NCI Vizlab facility based on my data and the tomographic model of the lowermost mantle. You can see that the stations and earthquakes used in the tomographic inversion are not uniformly distributed across the surface. The blue regions are the regions of high velocity and the red regions show the low velocity. Credit: Hrvoje Tkalcic
The temperature 3,000 kilometres below the surface of Earth is much more varied than previously thought, scientists have found.
The discovery of the regional variations in the lower mantle where it meets the core, which are up to three times greater than expected, will help scientists explain the structure of Earth and how it formed.
“Where the mantle meets the core is a more dramatic boundary than the surface of Earth,” said the lead researcher, Associate Professor Hrvoje Tkalčić, from The Australian National University (ANU).
“The contrast between the solid mantle and the liquid core is greater than the contrast between the ground and the air. The core is like a planet within a planet.” said Associate Professor Tkalčić, a geophysicist in the ANU Research School of Earth Sciences.
“The center of Earth is harder to study than the center of the sun.”
Temperatures in the lower mantle the reach around 3,000-3,500 degrees Celsius and the barometer reads about 125 gigapascals, about one and a quarter million times atmospheric pressure.
Variations in these temperatures and other material properties such as density and chemical composition affect the speed at which waves travel through Earth.
The team examined more than 4,000 seismometers measurements of earthquakes from around the world.
In a process similar to a CT scan, the team then ran a complex mathematical process to unravel the data and build the most detailed global map of the lower mantle, showing features ranging from as large as the entire hemisphere down to 400 kilometres across.
The map showed the seismic speeds varied more than expected over these distances and were probably driven by heat transfer across the core-mantle boundary and radioactivity.
“These images will help us understand how convection connects Earth’s surface with the bottom of the mantle,” said Associate Professor Tkalčić.
“These thermal variations also have profound implications for the geodynamo in the core, which creates Earth’s magnetic field.”
Video
Tomogram of the lowermost mantle (on top of core-mantle boundary, such as in our paper) centred on the equatorial region north of Australia. Green dots are stations and red dots are earthquakes near the Earths surface, the Earths mantle is transparent, and the ray paths through the interior are shown by solid lines. This image was made by our NCI Vizlab facility based on my data and the tomographic model of the lowermost mantle. You can see that the stations and earthquakes used in the tomographic inversion are not uniformly distributed across the surface.
The blue regions are the regions of high velocity and the red regions show the low velocity.
Reference:
Hrvoje Tkalčić, Mallory Young, Jack B. Muir, D. Rhodri Davies, Maurizio Mattesini. Strong, Multi-Scale Heterogeneity in Earth’s Lowermost Mantle. Scientific Reports, 2015; 5: 18416 DOI: 10.1038/srep18416
Acquired August 24 – September 17, 2015 Credit: The Earth Observatory, NASA
Sitting along the southeast edge of the Pacific “Ring of Fire,” Chile is no stranger to earthquakes and tsunamis. The strongest quake on record was recorded there in 1960, and at least three “great” quakes have hit the country since 2000. The most recent occurred on September 16, 2015, when a magnitude 8.3 quake struck near the coast of central Chile along the boundary of the Nazca and South American tectonic plates.
Dubbed the Illapel earthquake, the shaking lasted at least three minutes and propelled a 4.5-meter (15-foot) tsunami wave that washed into Coquimbo and other coastal areas. Smaller tsunami waves raced across the Pacific and showed up on the shores of Hawaii and other islands. The earthquake and tsunami caused substantial damage in several Chilean coastal towns, and at least 13 deaths have been reported. Still, demanding building codes and extensive disaster preparedness meant the loss of life and property was much less than in other, smaller earthquakes around the world (such as Nepal or Haiti).
The maps above show how the Earth moved in mid-September, as observed by the Copernicus Sentinel-1A satellite (operated by the European Space Agency) and reported by ground stations to the U.S. Geological Survey. Sentinel-1A carries a synthetic aperture radar (SAR) instrument, which beams radio signals toward the ground and measures the reflections to determine the distance between the ground and the satellite. By comparing measurements made on August 24 and September 17, Cunren Liang, Eric Fielding, and other researchers from NASA’s Jet Propulsion Laboratory were able to determine how the land surface shifted during and after the earthquake.
On both the close-up and the broad-view maps, the amount of land motion is represented in shades from yellow to purple. Areas where the ground shifted the most (vertically, horizontally, or both) are represented in yellow, while areas with little change are represented in purple. Circles show the location of earthquakes and aftershocks in the two days after the initial M8.3 earthquake, as reported by the USGS National Earthquake Information Center. Larger quakes are represented by larger circles. The base map layer uses a digital elevation model and a bathymetry map to show the contours of the land surface and seafloor.
The interferograms above show that land moved as much as 1.4 meters toward to satellite (generally in the vertical direction) near the coast, and early estimates of the horizontal motion suggest it was as much as 2 meters. While SAR can see through clouds and the dark of night, it cannot see much through water. It is likely that much of the ground deformation from the earthquake occurred underwater, which explains the formation of the tsunami and the location of many aftershocks.
“The 2015 earthquake ruptured along almost the same part of the subduction zone as an earlier event in 1943 that was close to the same size,” Fielding noted. “This means that it took only 70 years for enough stress to build up in the Chile subduction zone to produce a M8.3 earthquake on each section of the zone that runs the full length of Chile.”
Interferograms can be used to estimate where the fault moved deep in the Earth and which areas have increased stress and higher likelihood of future earthquakes, Fielding noted. The details can also provide important information to better understand the earthquake process.
Waptia fieldensis (middle Cambrian) is seen with overlay of scanning electron microscope image highlighting location of eggs. Credit: Copyright Royal Ontario Museum
Long before kangaroos carried their joeys in their pouches and honey bees nurtured their young in hives, there was the 508-million-year-old Waptia. Little is known about the shrimp-like creature first discovered in the renowned Canadian Burgess Shale fossil deposit a century ago, but recent analysis by scientists from the University of Toronto, Royal Ontario Museum, and Centre national de la recherche scientifique has uncovered eggs with embryos preserved within the body of the animal. It is the oldest example of brood care in the fossil record.
“As the oldest direct evidence of a creature caring for its offspring, the discovery adds another piece to our understanding of brood care practices during the Cambrian Explosion, a period of rapid evolutionary development when most major animal groups appear in the fossil record,” said Jean-Bernard Caron, curator of invertebrate palaeontology at the Royal Ontario Museum and associate professor in the Departments of Earth Sciences and Ecology & Evolutionary Biology at the University of Toronto.
Caron, along with Jean Vannier at the Centre national de la recherche scientifique in Lyon, France, describe the findings in a study published December 17 in Current Biology.
Waptia fieldensis is an early arthropod, belonging to a group of animals that includes lobsters and crayfish. It had a two-part structure covering the front segment of its body near the head, known as a bivalved carapace. Caron and Vannier believe the carapace played a fundamental role in how the creature practised brood care.
“Clusters of egg-shaped objects are evident in five of the many specimens we observed, all located on the underside of the carapace and alongside the anterior third of the body,” said Caron.
The clusters are grouped in a single layer on each side of the body with no or limited overlapping among the eggs. In some specimens, eggs are equidistant from each other, while in others, some are are closer together, probably reflecting variations in the angle of burial and movement during burial. The maximum number of eggs preserved per per individuals probably reached 24.
“This creature is expanding our perspective on the diversification of brood care in early arthropods,” said Vannier, the co-author of the study. “The relatively large size of the eggs and the small number of them, contrasts with the high number of small eggs found previously in another bivalved arthropod known as Kunmingella douvillei. And though that creature predates Waptia by about seven million years, none of its eggs contained embryos.”
Kunmingella douvillei also presented a different method of carrying its young, as its eggs were found lower on the body and attached to its appendages.
The presence of these two different parental strategies suggests an independent and rapid evolution of a variety of methods of parental care of offspring. Together with previously described brooded eggs in ostracods from the Upper Ordovician period 450 million years ago, the discovery supports the theory that the presence of a bivalved carapace played a key role in the early evolution of brood care in arthropods.
Reference:
Jean-Bernard Caron, Jean Vannier. Waptia and the Diversification of Brood Care in Early Arthropods. Current Biology, December 2015 DOI: 10.1016/j.cub.2015.11.006
Note: The above post is reprinted from materials provided by University of Toronto. The original item was written by Sean Bettam.
This photo shows green algae Spirogyra, which reproduce sexually by a process known as conjugation. Credit: Gert Hansen, SCCAP, Copenhagen
Plant biologists agree that it all began with green algae. At some point in our planet’s history, the common ancestor of trees, ferns, and flowers developed an alternating life cycle–presumably allowing their offspring to float inland and conquer Earth. But on December 16 in Trends in Plant Science, Danish scientists argue that some green algae had been hanging out on land hundreds of millions of years before this adaptation and that land plants actually evolved from terrestrial, not aquatic, algae.
Botanists have suspected this possibility since 1980, but supporters have lacked proof. Now, Carlsberg Laboratory’s Jesper Harholt and University of Copenhagen’s Øjvind Moestrup and Peter Ulvskov present genetic and morphological evidence that corroborates the theory. Notably, traits that land plants use to survive on land today are well conserved in some species of green algae.
The collaboration began while Harholt and Ulvskov were studying the evolution of the plant cell wall, long considered to be a key adaptation for a terrestrial lifestyle, as it provides body support for plants growing under the influence of gravity.
“We realized that algae have a cell wall that’s similarly complex to terrestrial plant cell walls, which seemed peculiar because ancient algae were supposedly growing in water,” says Harholt, Science Manager at the Carlsberg Laboratory. “We then started looking for other traits that would support the idea that algae were actually on land before they turned into land plants.”
Working with Moestrup, an expert in algae, they also explored structures (or rather, the loss of structures) that are hard to explain if algae only lived in water. For example, some green algae have lost their flagella, whip-like organelles that help single-celled organisms move around in water. All of the algae that are close relatives to land plants no longer have an eyespot, which they would use to swim toward light.
Cell wall traits combined with the recently sequenced genome of terrestrial green algae Klebsormidium, (published in 2014, doi:10.1038/ncomms4978), revealed that this green alga shares a number of genes with land plants related to light tolerance and drought tolerance. With the genetic evidence in hand, we know that the traits have arisen linearly, rather than by convergent evolution.
If their theory withstands scrutiny, it would begin to upend what’s been cited in textbooks for over a century. The idea that plants jumped from water to land is credited to botanist Frederick Orpen Bower, although it is unclear whether that was his intended argument. In his 1908 tome “The Origin of a Land Flora,” he simply proposed that the “invention” of alternating life cycles provided early land plants with a platform–the sporophyte–for evolutionary experimentation and thus adaptability.
“With all of the genomic and morphological data we have, it is very hard to explain, evolutionarily-wise, how algae lived in water all the way up to land plants,” says Ulvskov, also with Copenhagen’s Department of Plant and Environmental Sciences. “We have to turn this thinking on the head–we have the evidence now.”
The researchers’ biggest challenge will be to prove that a period of pre-adaptation led to the complex cell walls of land plants (although about 250 new genes were required for the formation of this terrestrial-friendly cell covering, which helps their case). They believe that these terrestrial green algae were advanced enough to survive on sandy surfaces, living on rain as a source of humidity. But with a small fossil record to go on–only spores exist from this period of evolutionary history–they will need to rely heavily on genetics to make their argument.
“The strange thing for me is that if these green algae were terrestrial for a long time, how come that so few of these species are still around?” says Moestrup, an evolutionary biologist. “It could be because they were all outcompeted, but maybe one day we will find more green algae of this lineage.”
“You have to be patient and sometimes pursue your crazy ideas, even when they differ from the dogmatic thinking in the field,” Harholt adds. “If you pile up enough evidence, at some point you may realize that you might be correct.”
Reference:
Jesper Harholt, Øjvind Moestrup, Peter Ulvskov. Why Plants Were Terrestrial from the Beginning. Trends in Plant Science, 2015; DOI: 10.1016/j.tplants.2015.11.010
Note: The above post is reprinted from materials provided by Cell Press.
Acid mine drainage sludge drying cells at a mine in Upshur, West Virginia. Credit: West Virginia University
West Virginia could become one of the country’s significant sources for rare earth elements, the “vitamins of modern industry,” without the expense or environmental cost of opening new mines.
Last week, the United States Department of Energy’s National Energy Technology Laboratory, or NETL, selected West Virginia University to conduct a $937,000 research project in support of DOE’s program to Recover of Rare Earth Elements from Coal and Coal Byproducts.
Rare earth elements, or REEs, are chemical elements in Earth’s crust that are essential ingredients in modern technologies such as cell phones, rechargeable batteries, DVDs, GPS equipment, medical equipment and many defense applications.
Demand for REEs continues to grow, but mining and processing these elements is expensive and difficult. Conventional rare earth extraction grinds large volumes of hard rock and removes rare earths through acid extraction. The process is energy intensive, disturbs large areas of pristine land, and generates large volumes of toxic tailings.
Because of this and the cost of developing domestic sources, the U.S. imports nearly all of its REEs.
There are other methods for obtaining REEs. Some coal-related waste streams are enriched with REEs, sparking interest in evaluation of these wastes as a potential domestic supply.
WVU’s project, “Recovery of Rare Earth Elements from Coal Mine Drainage,” brings together academia, state regulators and industry to collaborate on finding a successful recovery technology for total REEs from acid mine drainage, or AMD.
Paul Ziemkiewicz, director of the West Virginia Water Research Institute and principal investigator for the project, and co-investigators Xingbo Liu, professor of mechanical engineering, and Aaron Noble, professor of mining engineering, will test different sources of AMD solids and methods for extracting valuable REEs.
The team has already identified solids precipitated during treatment of AMD, as an enriched source of REEs, particularly the more valuable, heavy elements.
AMD is a waste stream generated by Appalachian coal mining that is created when sulfide minerals in rocks are exposed to air and water. Active coal mines are required to treat this water resulting in the precipitation of AMD solids which must be disposed of.
In Pennsylvania and West Virginia alone, it is estimated that AMD generates more than 45,000 tons of total REEs per year or about three times the current U.S. demand for total REEs.
The team will work with industry partners Mepco Inc., Consol Energy and Rosebud Mining as well as the West Virginia Department of Environmental Protection’s Office of Special Reclamation to not only identify enriched AMD solids but to develop ways to integrate rare earth extraction with their current mine drainage treatment operations.
WVU’s approach capitalizes on the fact that acid mine drainage is an existing source of acid which extracts rare earths from coal-related rock. As the coal industry treats this acid water to meet regulatory requirements it generates huge volumes of solids which require disposal.
“Those solids are our feedstock,” Ziemkiewicz said. “And in a sense, it’s already pre-processed.”
Liu and Noble will develop ways to further concentrate REEs so that it can supply the metal refining industry.
No new mines will be needed to generate this domestic supply of rare earths, and rejects will be returned to the AMD treatment plant’s disposal system requiring a negligible environmental footprint.
“Successful development of this concept will generate an additional revenue stream for the coal industry, create jobs and incentivize acid mining treatment,” Ziemkiewicz said. “At the same time it will reduce U.S. reliance on foreign supplies of rare earth elements.”
The research team acknowledges NETLfor its support of this project and looks forward to working with NETL’s scientists in advancing this technology.
It took 100 million years for oxygen levels in the oceans and atmosphere to increase to the level that allowed the explosion of animal life on Earth about 600 million years ago, according to a UCL-led study funded by the Natural Environment Research Council.
Before now it was not known how quickly Earth’s oceans and atmosphere became oxygenated and if animal life expanded before or after oxygen levels rose. The new study, published today in Nature Communications, shows the increase began significantly earlier than previously thought and occurred in fits and starts spread over a vast period. It is therefore likely that early animal evolution was kick-started by increased amounts of oxygen, rather than a change in animal behaviour leading to oxygenation.
Lead researcher, Dr Philip Pogge von Strandmann (UCL Earth Sciences), said: “We want to find out how the evolution of life links to the evolution of our climate. The question on how strongly life has actively modified Earth’s climate, and why the Earth has been habitable for so long is extremely important for understanding both the climate system, and why life is on Earth in the first place.”
Researchers from UCL, Birkbeck, Bristol University, University of Washington, University of Leeds, Utah State University and University of Southern Denmark tracked what was happening with oxygen levels globally 770 – 520 million years ago (Ma) using new tracers in rocks across the US, Canada and China.
Samples of rocks that were laid down under the sea at different times were taken from different locations to piece together the global picture of the oxygen levels of Earth’s oceans and atmosphere. By measuring selenium isotopes in the rocks, the team revealed that it took 100 million years for the amount of oxygen in the atmosphere to climb from less than 1% to over 10% of today’s current level. This was arguably the most significant oxygenation event in Earth history because it ushered in an age of animal life that continues to this day.
Dr Pogge von Strandmann, said: “We took a new approach by using selenium isotope tracers to analyse marine shales which gave us more information about the gradual changes in oxygen levels than is possible using the more conventional techniques used previously. We were surprised to see how long it took Earth to produce oxygen and our findings dispel theories that it was a quick process caused by a change in animal behaviour.”
During the period studied, three big ‘snowball Earth’ glaciations – Sturtian (~716Ma), Marinoan (~635Ma) and Gaskiers (~580Ma) – occurred whereby the Earth’s land was covered in ice and most of the oceans were frozen from the poles to the tropics. During these periods, temperatures plummeted and rose again, causing glacial melting and an influx of nutrients into the ocean, which researchers think caused oxygen levels to rise deep in the oceans.
Increased nutrients means more ocean plankton, which will bury organic carbon in seafloor sediments when they die. Burying carbon results in oxygen increasing, dramatically changing conditions on Earth. Until now, oxygenation was thought to have occurred after the relatively small Gaskiers glaciation melted. The findings from this study pushes it much earlier, to the Marinoan glaciation, after which animals began to flourish in the improved conditions, leading to the first big expansion of animal life.
Co-author Prof. David Catling (University of Washington Earth and Space Sciences), added: “Oxygen was like a slow fuse to the explosion of animal life. Around 635 Ma, enough oxygen probably existed to support tiny sponges. Then, after 580 Ma, strange creatures shaped like pizzas lived on a lightly oxygenated seafloor. Fifty million years later, vertebrate ancestors were gliding through oxygen-rich seawater. Tracking how oxygen increased is the first step towards understanding why it took so long. Ultimately, a grasp of geologic controls on oxygen levels can help us understand whether animal-like life might exist or not on Earth-like planets elsewhere.”
Reference:
‘Selenium isotope evidence for progressive oxidation of the Neoproterozoic biosphere’ by Philip A.E. Pogge von Strandmann, Eva E. Stüeken, Tim Elliott, Simon W. Poulton, Carol M. Dehler, Don E. Canfield and David C. Catling in Nature Communications. DOI:10.1038/ncomms10157
The shoreline at Laguna del Maule in Chile was horizontal about 10,000 years ago. Now, the south end of the lake is 220 feet higher than the north, indicating a long-term uplift probably caused by the intrusion of magma under the lake. Credit: Brad Singer
Ongoing studies of a massive volcanic field in the Andes mountains show that the rapid uplift which has raised the surface more than six feet in eight years has occurred many times during the past 10,000 years.
A clearly defined ancient lakeshore that is about 600 feet above the current lake level must have been horizontal when it formed about 100 centuries ago. Since then, the southern end of the shoreline has risen 220 feet, or about 20 stories, says Brad Singer, a professor of geoscience at the University of Wisconsin-Madison. The finding, he says, “extends the current deformation behavior well into the geologic past. The shoreline appears to record a similar behavior to what we are seeing today, but over 10,000 years.”
The volcanic field is known as Laguna del Maule. The dramatic finding rested on a simple, painstaking study of the ancient lakeshore, which resembles a bathtub ring. Singer and colleagues traveled along the shoreline on foot, and precisely recorded its altitude with a GPS receiver.
The most likely cause of the sustained rise is the long-term intrusion of molten rock beneath the lake, says Singer, who has spent more than 20 years studying volcanoes in Chile. “I was shocked that we measured this much rise. This requires the intrusion of a Half Dome’s worth of magma in 10,000 years.”
Half Dome, an iconic granite massif at Yosemite National Park in California, has a volume of about 1.5 cubic miles. Half Dome and similar structures form when molten rock — magma — cools and solidifies underground, and then the rock body is pushed upward over the eons.
The modern uplift at Maule is what convinced Singer to organize a large-scale scientific campaign to explore a dangerous, highly eruptive region. “I am not aware of magma-drive uplift at these rates, anywhere, over either of these time periods,” he says.
Singer is leading a five-year National Science Foundation-funded investigation of Laguna del Maule that involves 30 scientists from the United States, Chile, Canada, Argentina and Singapore. At least 36 eruptions have occurred there during the past 20,000 years.
The researchers presented the new data on the uplift during the last 10,000 years on Dec. 16, at the annual American Geophysical Union meeting in San Francisco.
Laguna del Maule may cast light on the current — but much slower — uplift at the Yellowstone caldera in Wyoming and at Long Valley in California. “These volcanoes have produced super-eruptions spewing hundreds of cubic kilometers of volcanic ash, but the uplift and deformation today are far slower than what we see at the much younger Laguna del Maule volcanic field,” Singer says.
The lake basin at Maule, measuring roughly 14 by 17 miles, is dominated by massive, repeated lava flows. But the full influence of Maule’s volcanoes extends much farther, Singer says. “The impressive lava flows we see in the lake basin are only a fraction of the record of eruptions. Downwind, in Argentina, deposits of volcanic ash and pumice show that the system’s footprint is many times larger than what appears at the lake.” Understanding the real hazards of Laguna del Maule must consider the downwind impacts of the explosive eruptions, he adds.
Chile has seen remarkable geologic activity in recent years. In 2010, the fifth-largest earthquake ever recorded on a seismometer occurred 120 miles west of Laguna del Maule.
In the past 12 months alone, Calbuco, Villarica and Copahue volcanoes have erupted.
In the United States, eruptions are often compared to the one at Mount St. Helens in 1980, which released about 1 cubic kilometer of rock. One of the 36 Laguna del Maule eruptions nearly 20,000 years ago spewed 20 times that much ash.
Other nearby volcanoes have surpassed 100 cubic kilometers, entering the realm of the “super-volcano.”
The new results shed light on the force that has been “jacking up” this piece of earth’s crust, Singer says. “Some people have argued that the dramatic deformations like we are seeing today could be driven by the expansion of steam above the magma.” However, gravity measurements around the lake basin by Basil Tikoff of UW-Madison and Craig Miller and Glyn Williams-Jones of Simon Fraser University in Canada suggest that steam is unlikely to be the major cause of uplift. Only solidified magma can support 67 meters of uplift, Singer says: “Steam would leak out.”
The average interval between eruptions at Laguna del Maule over 20,000 years is 400 to 500 years, and the last eruption was more than 450 years ago, prior to Spanish colonization.
These findings “mean the current state of unrest is not the first,” Singer says. “The crust has gone up by more than my own height in less than 10 years, but it has done similar things throughout the last 10,000 years, and likely even longer. This uplift coincides with a flare-up of large eruptions around the southern end of the lake. Thus the most likely explanation is the sustained input of new magma underground, although some of it could be due to geologic faults.
“We are trying to determine the dimensions of the active system at depth, which will help us understand the hazard,” Singer adds, “but there is no way of knowing if the next eruption will be business as usual, or something outside of human experience.”
This is a picture of a life reconstruction of Morelladon beltrani. Credit: Carlos de Miguel Chaves
In a new study, scientists describe a ‘sail-backed’ dinosaur species named Morelladon beltrani, which inhabited the Iberian landmass approximately 125 million years ago. The research was published Dec. 16, 2015 in the open-access journal PLOS ONE by José Miguel Gasulla from Grupo Biología Evolutiva (UNED-UAM) and colleagues.
The specimen the authors of this study describe is a partial skeleton mainly composed of dorsal and sacral vertebrae and pelvic bones. Morelladon is a medium-sized styracosternan ornithopod of around 6 meters long and 2.5 meters high, similar in body length and proportions to its relative Mantellisaurus atherfieldensis. The most conspicuous feature of this new, relatively gracile ornithopod is the presence of tall neural spines on dorsal vertebrae, which the authors suggest was possibly a ‘sail’ used for thermoregulation, or as a storage place for fat to be used during periods of low food supply.
The discovery of Morelladon beltrani in the same area and time period with its relatives Iguanodon bernissartensis and Mantellisaurus atherfieldensis may indicate a particularly diverse medium-large bodied styracosternan assemblage in the eastern Iberian landmass during the late Barremian, ~125 million years ago.
Co-author Dr. Escaso added, “We knew the dinosaur fauna from Morella was sim
ilar to those of other contemporary European sites. However, this discovery shows an interesting rise of the iguanodontoid diversity in southern Europe ~125 million years ago.”
This is a photograph of dorsal vertebrae series of the holotype specimen of Morelladon beltrani (CMP-MS-03). CMP-MS-03-06, -07 (including CMP-MS-03-17 and -29) and -05 (including CMP-MS-03-08) in left lateral (A) view. Interpretive drawing of CMP-MS-03-05 (including CMP-MS-03-08 neural spine) in left lateral (B) view. Abbreviations: ns, neural spine; poz, postzygapophysis; pre, prezygapophysis; rec, vertical recess; tp, transverse process. Credit: Gasulla et al.
Reference:
José Miguel Gasulla, Fernando Escaso, Iván Narváez, Francisco Ortega, José Luis Sanz. A New Sail-Backed Styracosternan (Dinosauria: Ornithopoda) from the Early Cretaceous of Morella, Spain. PLOS ONE, 2015; 10 (12): e0144167 DOI: 10.1371/journal.pone.0144167
Note: The above post is reprinted from materials provided by PLOS.